Sample Category Title
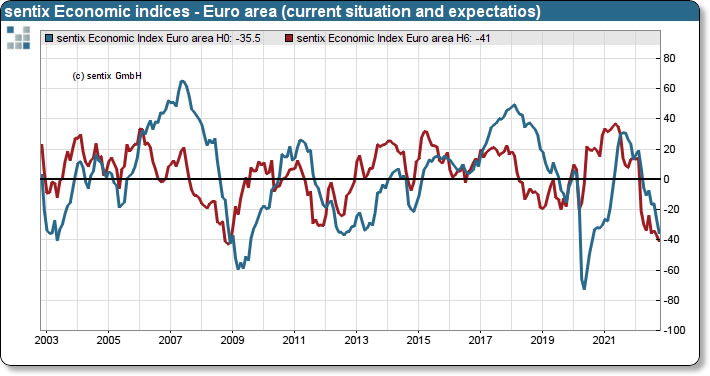
Eurozone Sentix dropped to -38.3, Germany in catastrophic state
Eurozone Sentix investor confidence dropped from -31.8 to -38.3 in October, lowest since May 2020. Current situation index dropped from -26.5 to -35.3, worst since August 2020. Expectations index dropped from -37.0 to -41.0, lowest since December 2008.
Sentix said: "The ongoing uncertainties about the gas and energy situation in winter have not diminished due to the attack on the Nordstream pipelines. In addition to the economic worries, there is now also an increasing probability of an escalation of the military conflict in Ukraine."
Germany investor confidence dropped from -29.9 to -37.4, lowest since March 2009. Current situation index dropped from -23.5 to -33.5, lowest since July 2020. Expectations index dropped from -36.0 to -41.3, an all-time low. Sentix said the data signaled a "catastrophic state of the economic condition" in Germany.
GBP/JPY Daily Outlook
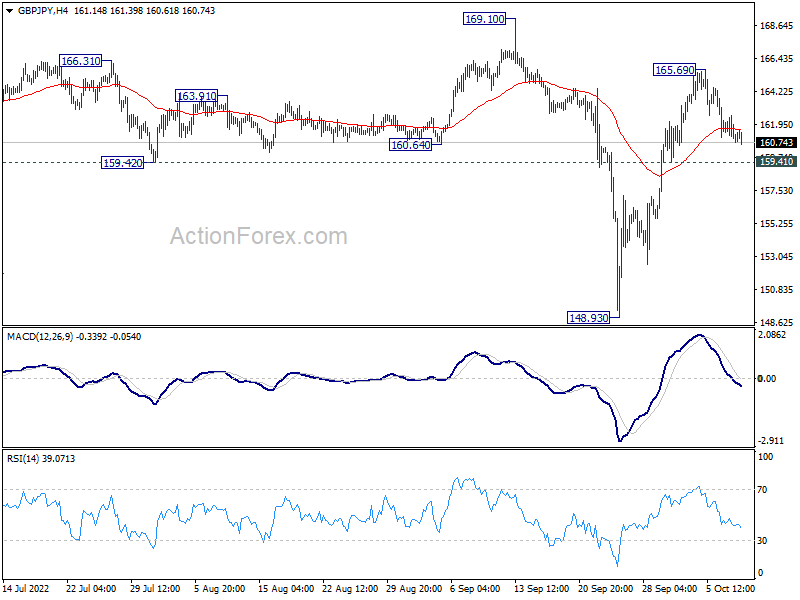
Daily Pivots: (S1) 160.46; (P) 161.53; (R1) 162.28; More...
Intraday bias in GBP/JPY remains neutral first. While further rise could be seen, strong resistance might be seen from 169.10 high to limit upside, at least on first attempt. On the downside, below 159.41 minor support will turn bias back to the downside for 148.93 again. However, firm break of 169.10 will confirm resumption of larger up trend.
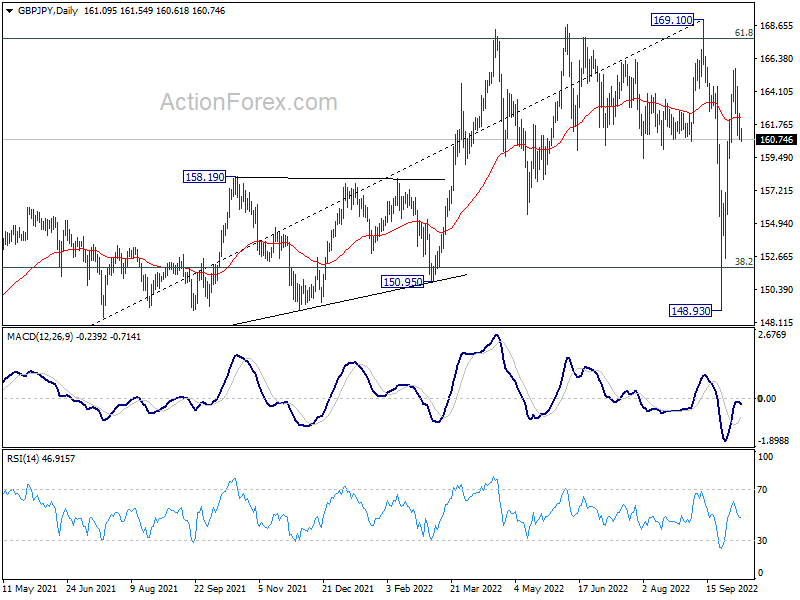
In the bigger picture, strong support from 38.2% retracement of 123.94 to 169.10 at 151.84 suggests that price actions from 169.10 are developing into a corrective pattern only. That is, rise from 123.94 (2020 low) should resume at a later stage. This will now remain the favored case as long as 148.93 support holds.
EUR/JPY Daily Outlook
Daily Pivots: (S1) 141.14; (P) 141.68; (R1) 142.14; More....
Intraday bias in EUR/JPY remains neutral for the moment. On the downside, break of 140.77 minor support will turn bias back to the downside, to extend the corrective pattern from 145.62 with another falling leg towards 137.32 support. On the upside, above 144.06 will bring retest of 145.62 high.
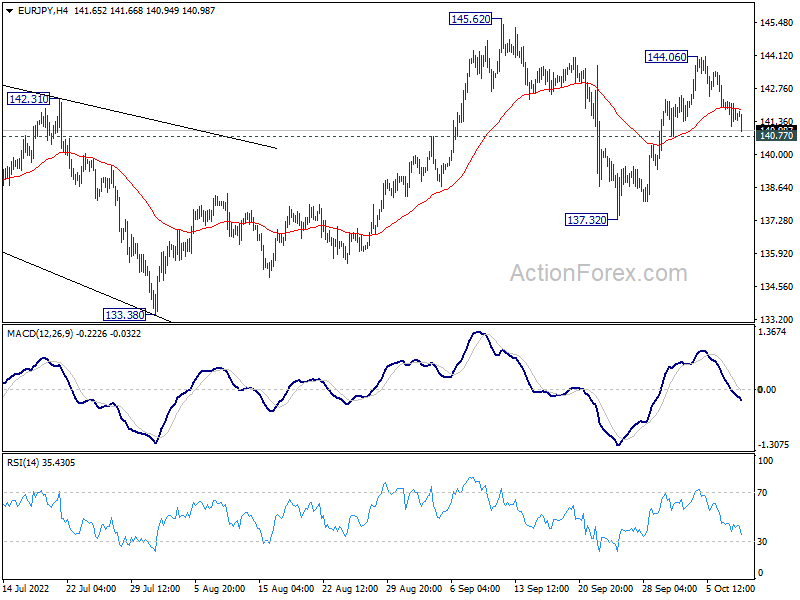
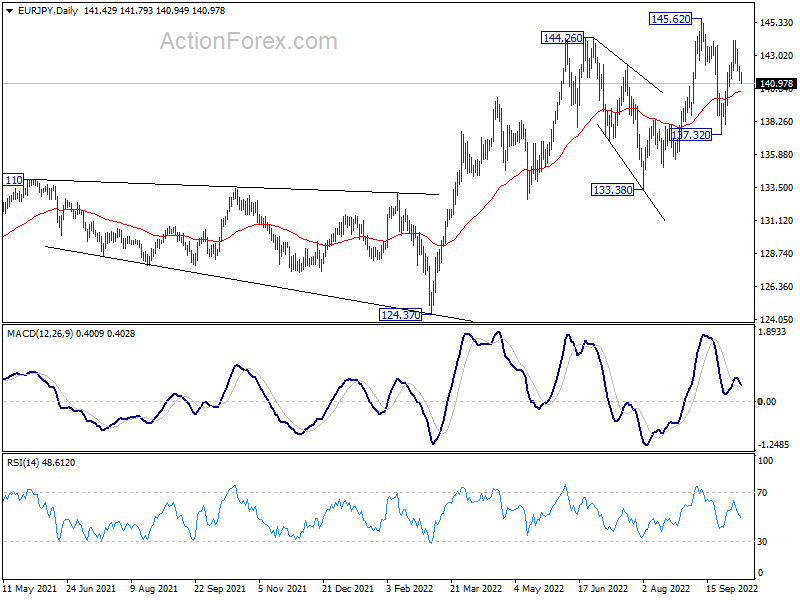
In the bigger picture, as long as 133.38 support holds, the up trend from 114.42 (2020 low) could still extend through 145.62 high. In that case, next target is 149.76 (2015 high). However, sustained break of 133.38 will be a sign of medium term bearish reversal and bring deeper fall to 124.37 support first.
EUR/GBP Daily Outlook
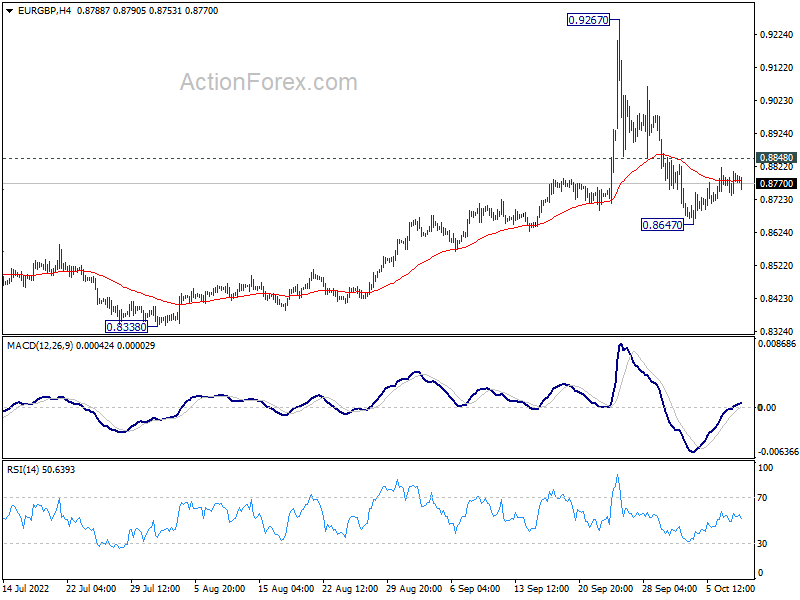
Daily Pivots: (S1) 0.8744; (P) 0.8776; (R1) 0.8815; More...
Intraday bias in EUR/GBP remains neutral first. On the downside, sustained trading below 55 day EMA (now at 0.8656) will extend the fall from 0.9267 (as another falling leg of a long term consolidation pattern), to 0.8201/8338 support zone. On the upside, above 0.8848 minor resistance will turn bias back to the upside for recovery instead.
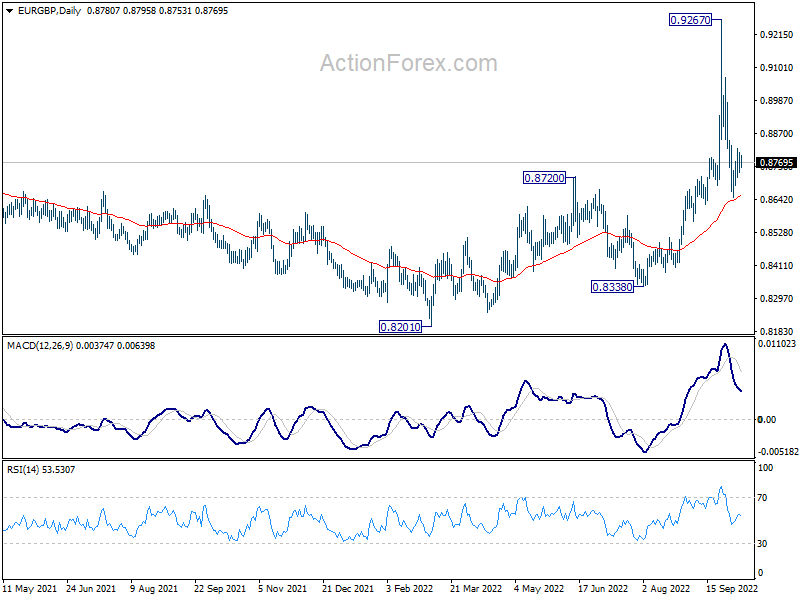
In the bigger picture, as long as 0.8720 resistance turned support holds, rise from 0.8201 is seen as resuming larger up trend from 0.6935 (2015 low). Break of 0.9499 (2020 high) should be seen at a later stage. However, firm break of 0.8720 will argue that sideway pattern from 0.9499 is extending with another falling leg instead.
EUR/AUD Daily Outlook
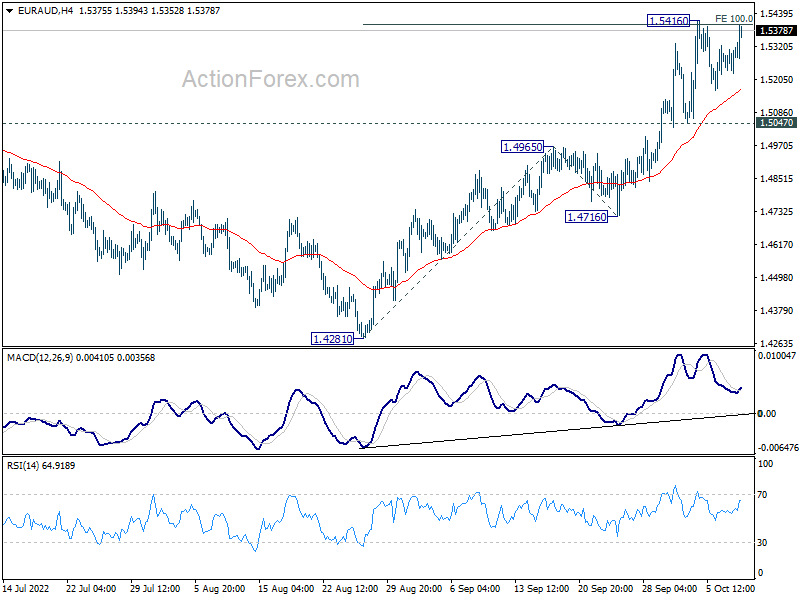
Daily Pivots: (S1) 1.5253; (P) 1.5286; (R1) 1.5344; More...
Intraday bias in EUR/AUD stays neutral first and further rally is expected with 1.5047 support intact. Firm break of 1.5416 will carry larger bullish implication. Next target is 161.8% projection of 1.4281 to 1.4965 from 1.4716 at 1.5823. However, break of 1.5047 will turn bias back to the downside for 55 day EMA (now at 1.4885).
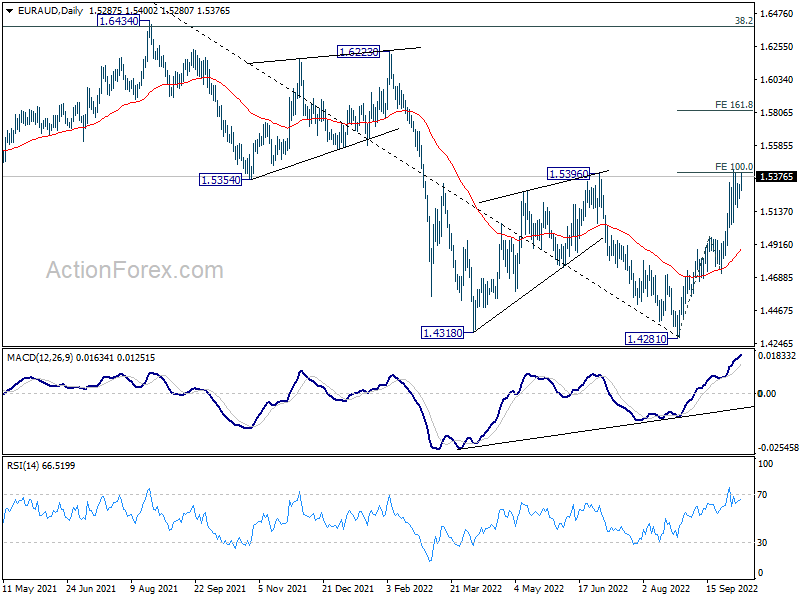
In the bigger picture, current development raises the chance of medium term bottoming at at 1.4281, on bullish convergence condition in daily MACD. Firm break of 1.5396 will bring stronger rally back to 1.6434 key resistance next. Nevertheless, rejection by 1.5396 will maintain medium term bearishness for another fall through 1.4281 at a later stage.
EUR/CHF Daily Outlook
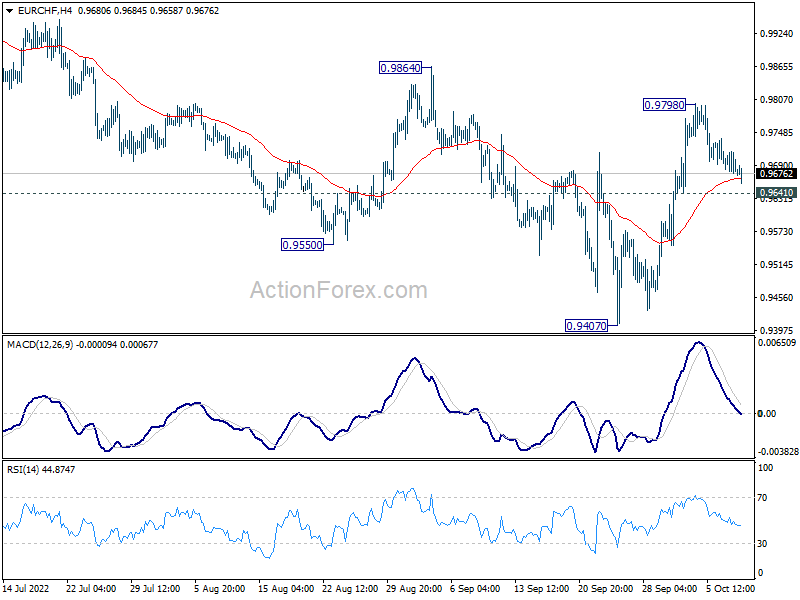
Daily Pivots: (S1) 0.9669; (P) 0.9693; (R1) 0.9708; More....
Intraday bias in EUR/CHF stays neutral first. On the upside, above 0.9798 will resume the rebound to 0.9864 resistance. Firm break there will solidify the case of medium term bottoming at 0.9407, and target 38.2% retracement of 1.1149 to 0.9407 at 1.0072. On the downside, below 0.9641 minor support will turn bias back to the downside for retesting 0.9407 low instead.
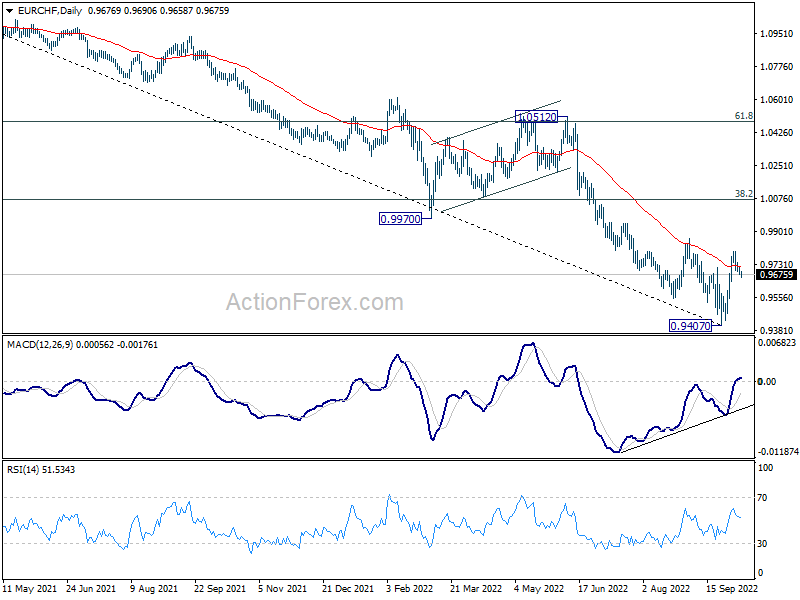
In the bigger picture, as long as 0.9864 resistance holds, long term down trend from 1.2004 (2008 high) is expected to continue. Next target is 138.2% projection of 1.2004 to 1.0505 to 1.1149 at 0.9033. However, firm break of 0.9864 will confirm medium term bottoming, on bullish convergence condition in daily MACD. Stronger rally would then be seen back to 55 week EMA (now at 1.0152), even as a corrective rebound.
Gold Eases Below the Falling Trend line Again
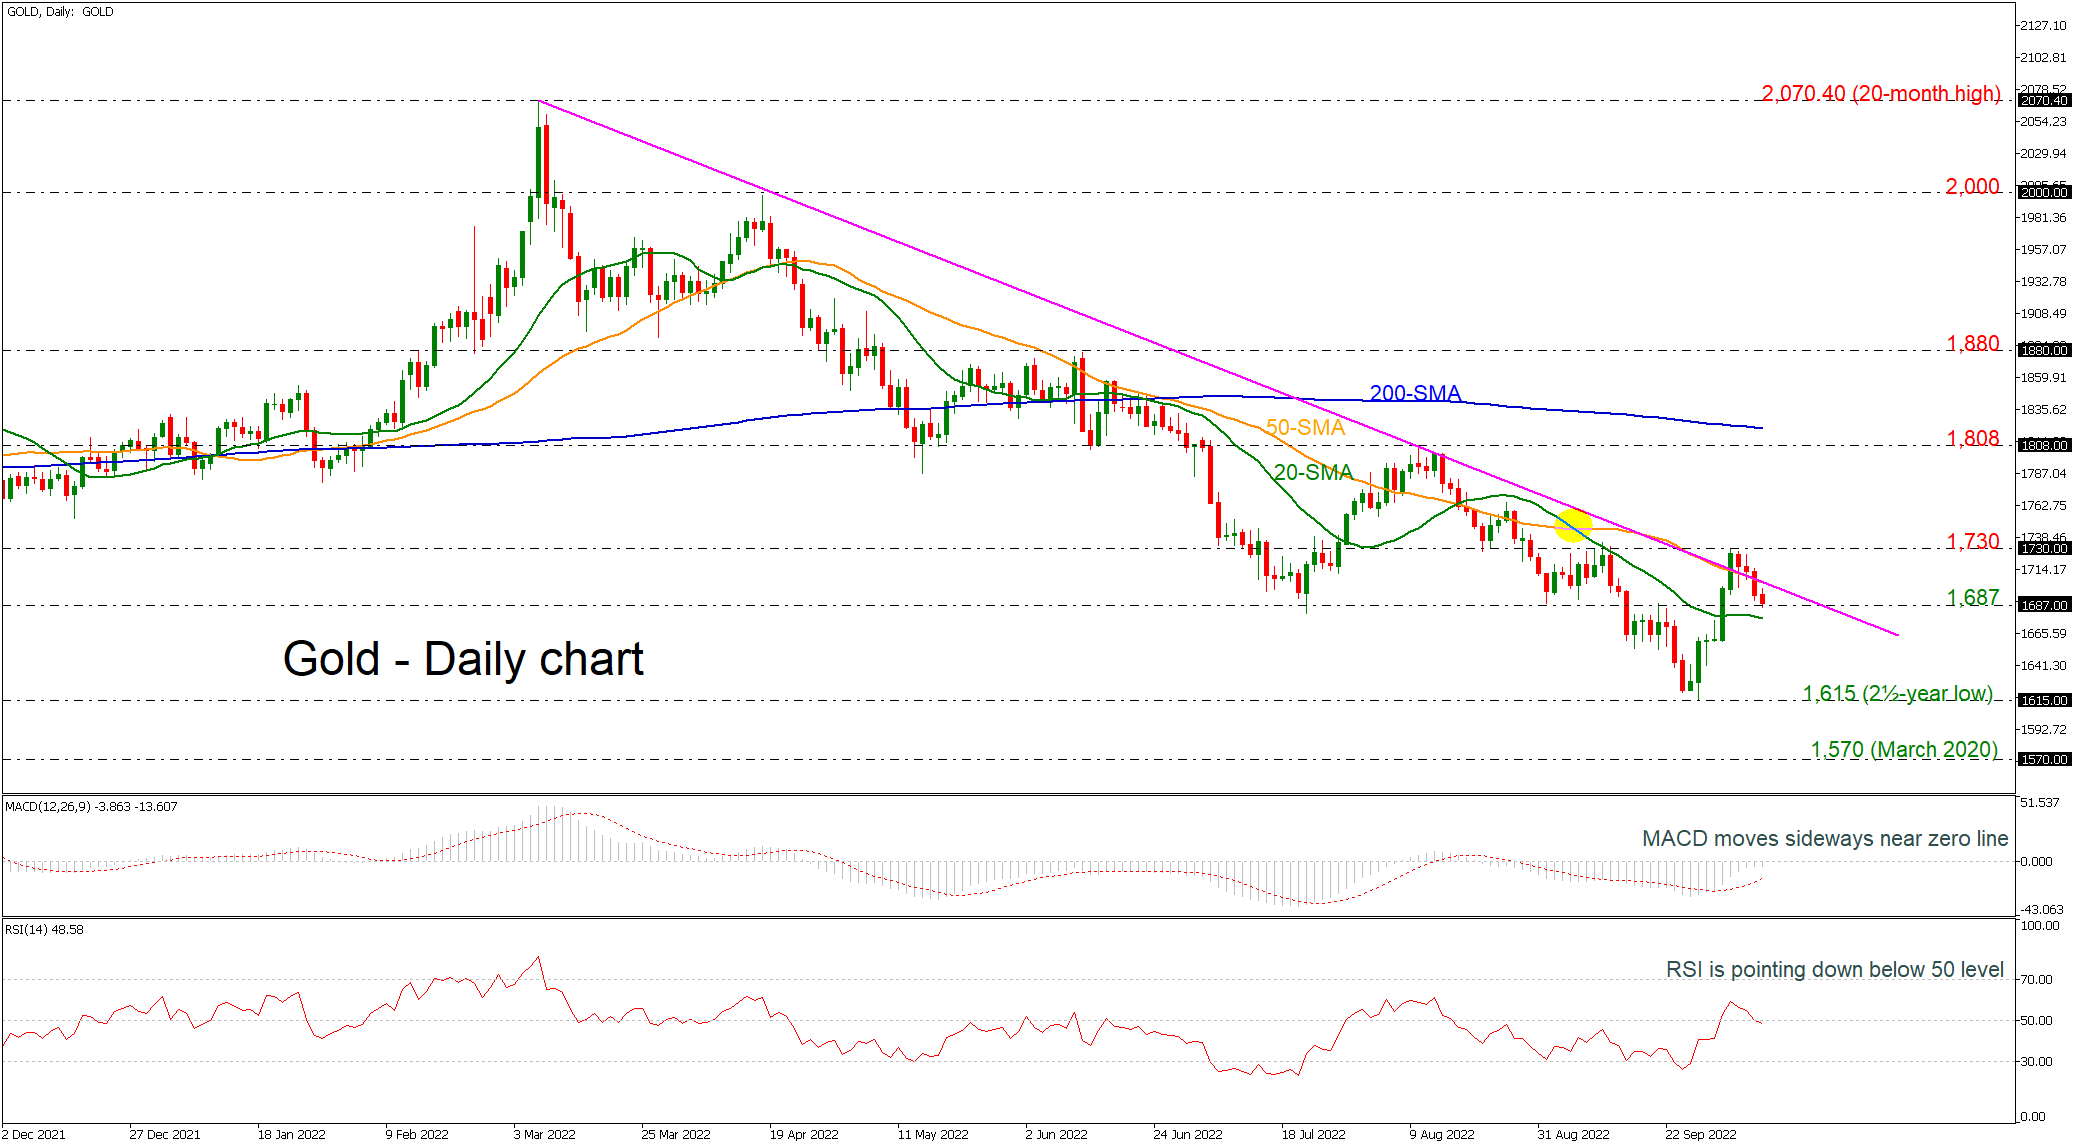
Gold prices are continuing the decline from the 1,730 resistance level, dropping back below the long-term descending trend line. In trend indicators, the 20- and 50-day simple moving averages (SMAs) are acting as support and resistance levels for traders, while the MACD is moving sideways in the negative zone. However, the RSI is confirming the recent bearish bias as it is developing beneath the neutral threshold of 50.
Further losses should see the 20-day SMA currently at 1,675, before plunging to the two-and-a-half-year low of 1,615. A drop below this level would reinforce the bearish structure, opening the way towards the next key support at 1,570, registered in March 2020.
In the event of an upside reversal, the 1,730 level could come into focus before being able to re-challenge the 1,808 resistance. Further gains could lead the way towards the 200-day SMA at 1.821, while even higher the outlook may change to bullish.
In a nutshell, the yellow metal has returned to losses and below the long-term falling trend line, maintaining the bearish structure.
Nasdaq 100 Tests Support
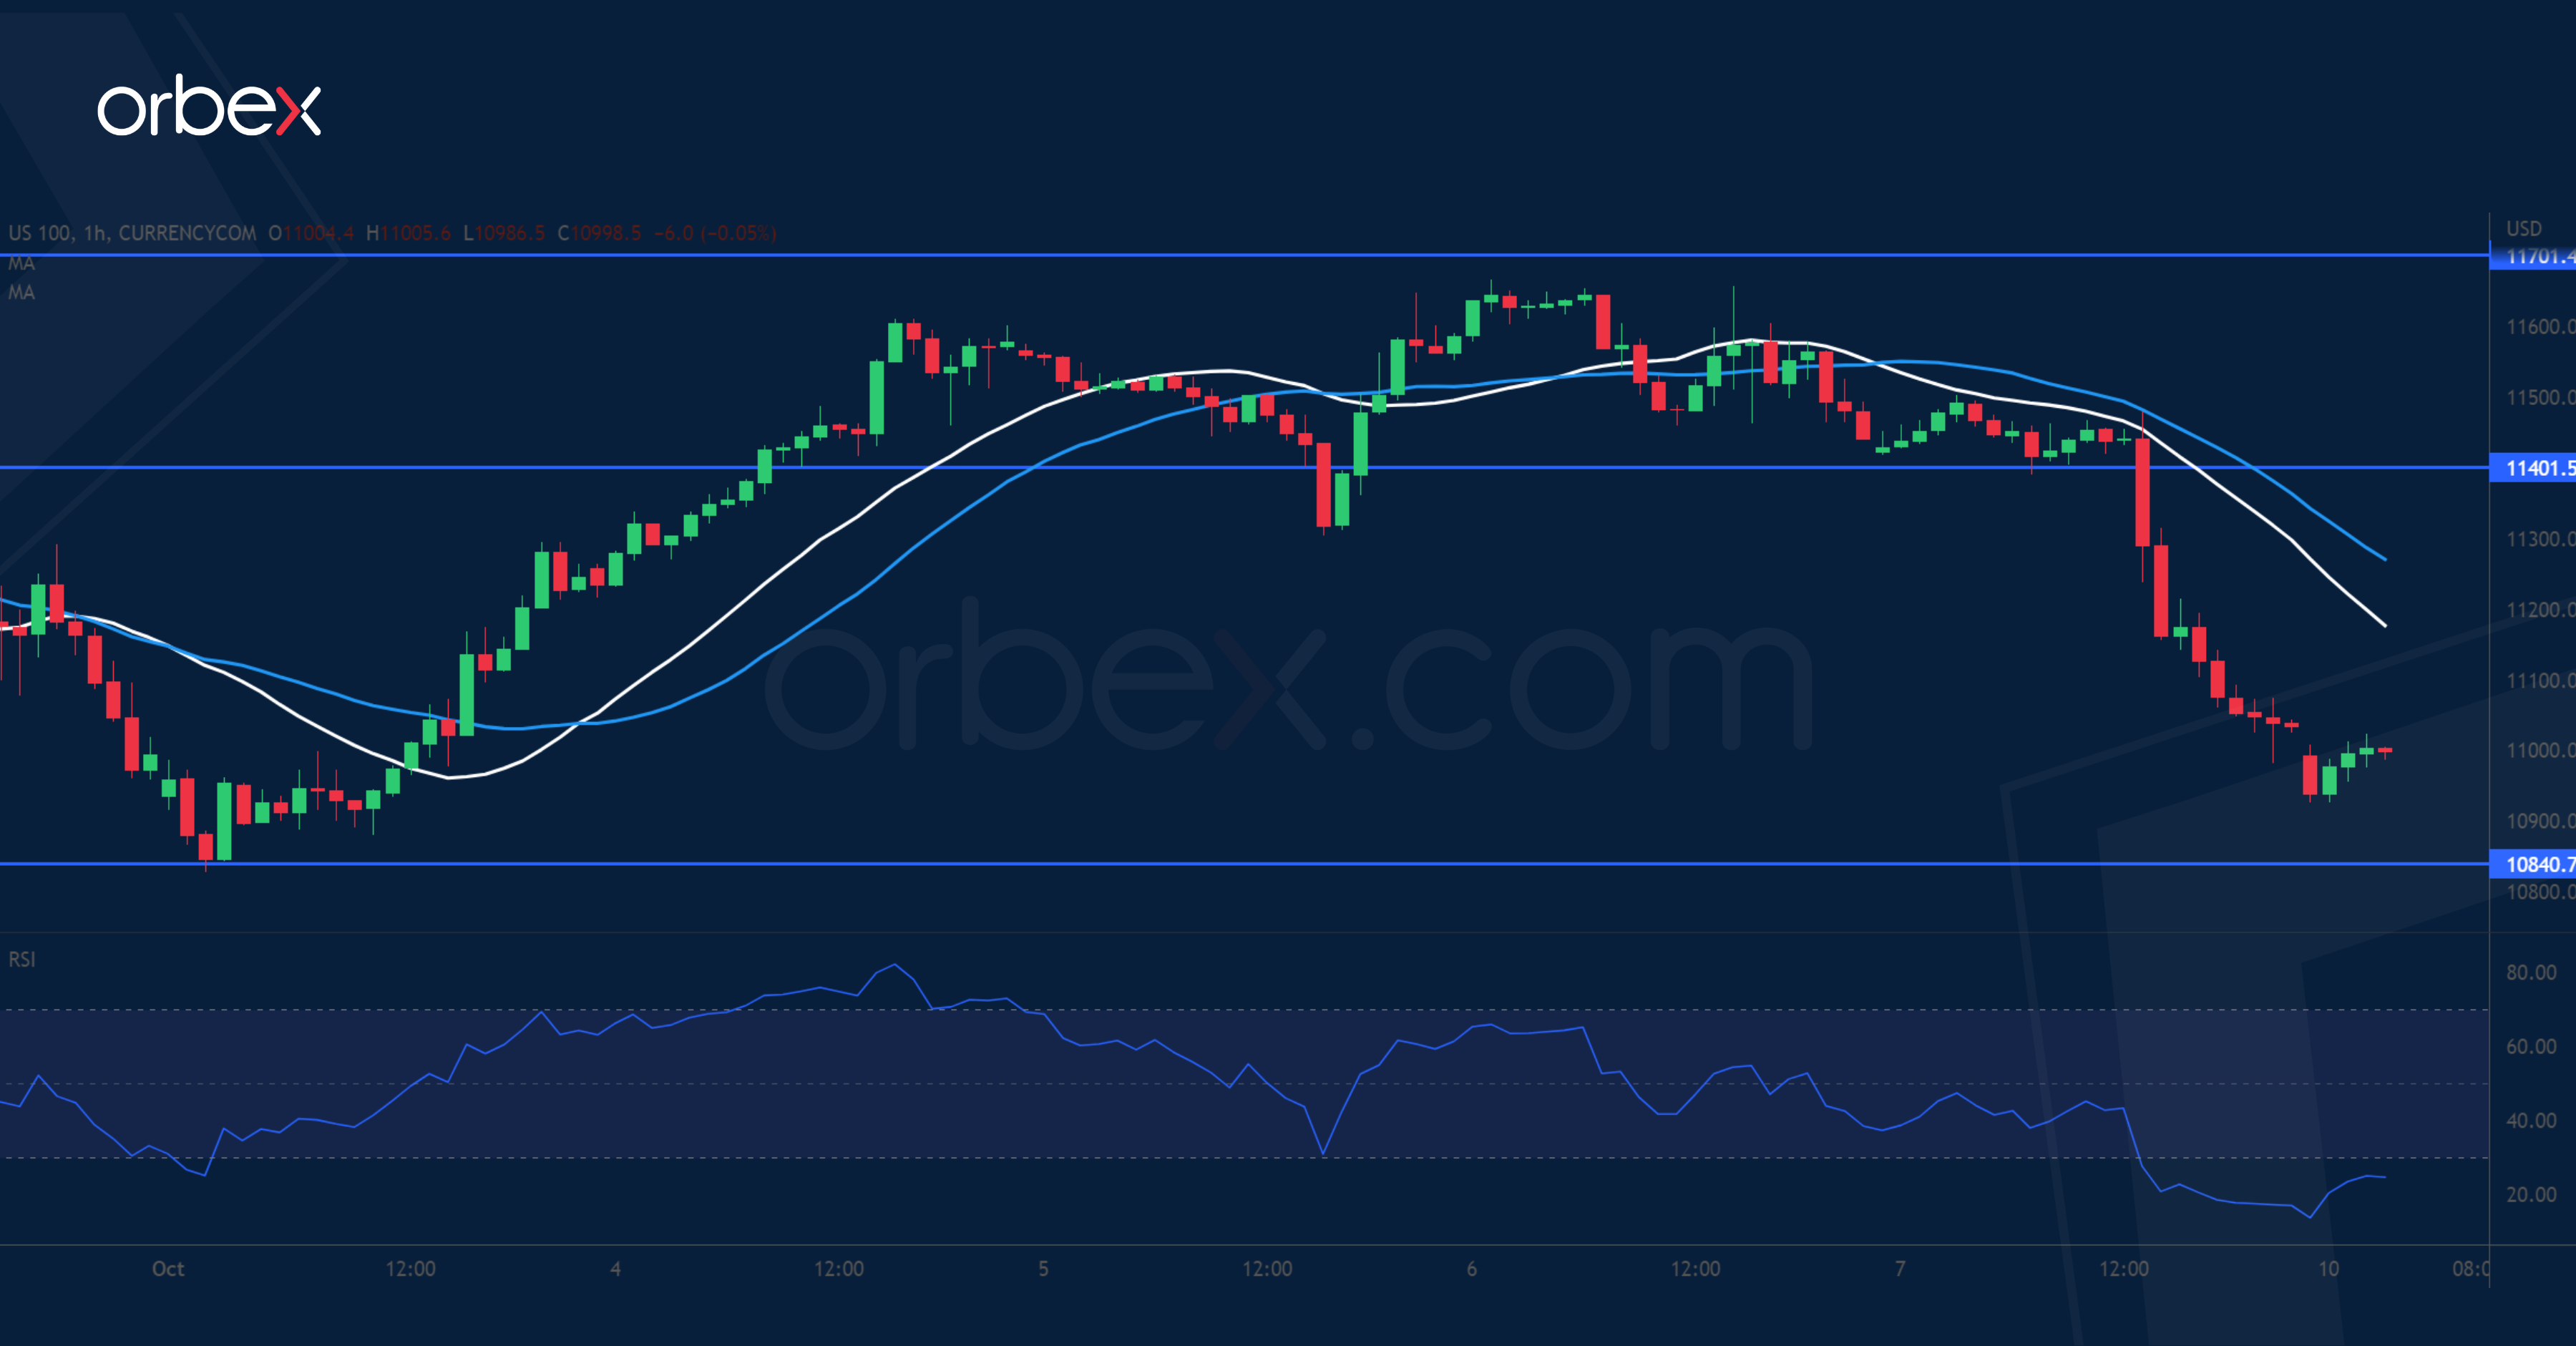
The Nasdaq 100 tumbles as the Fed is likely to stick to its aggressive hike policy. The index has previously bounced off its two-year low at 10840 and a break above 11500 temporarily eased the selling pressure. However, a swift U-turn near 11700 might have shattered hopes of a sustained recovery. A fall below 11300 has forced bulls to bail out. The new supply area around 11400 may attract stiff selling from trend followers. A break below 10840 would resume the downtrend and send the index towards 10400.
XAU/USD Pulls Back
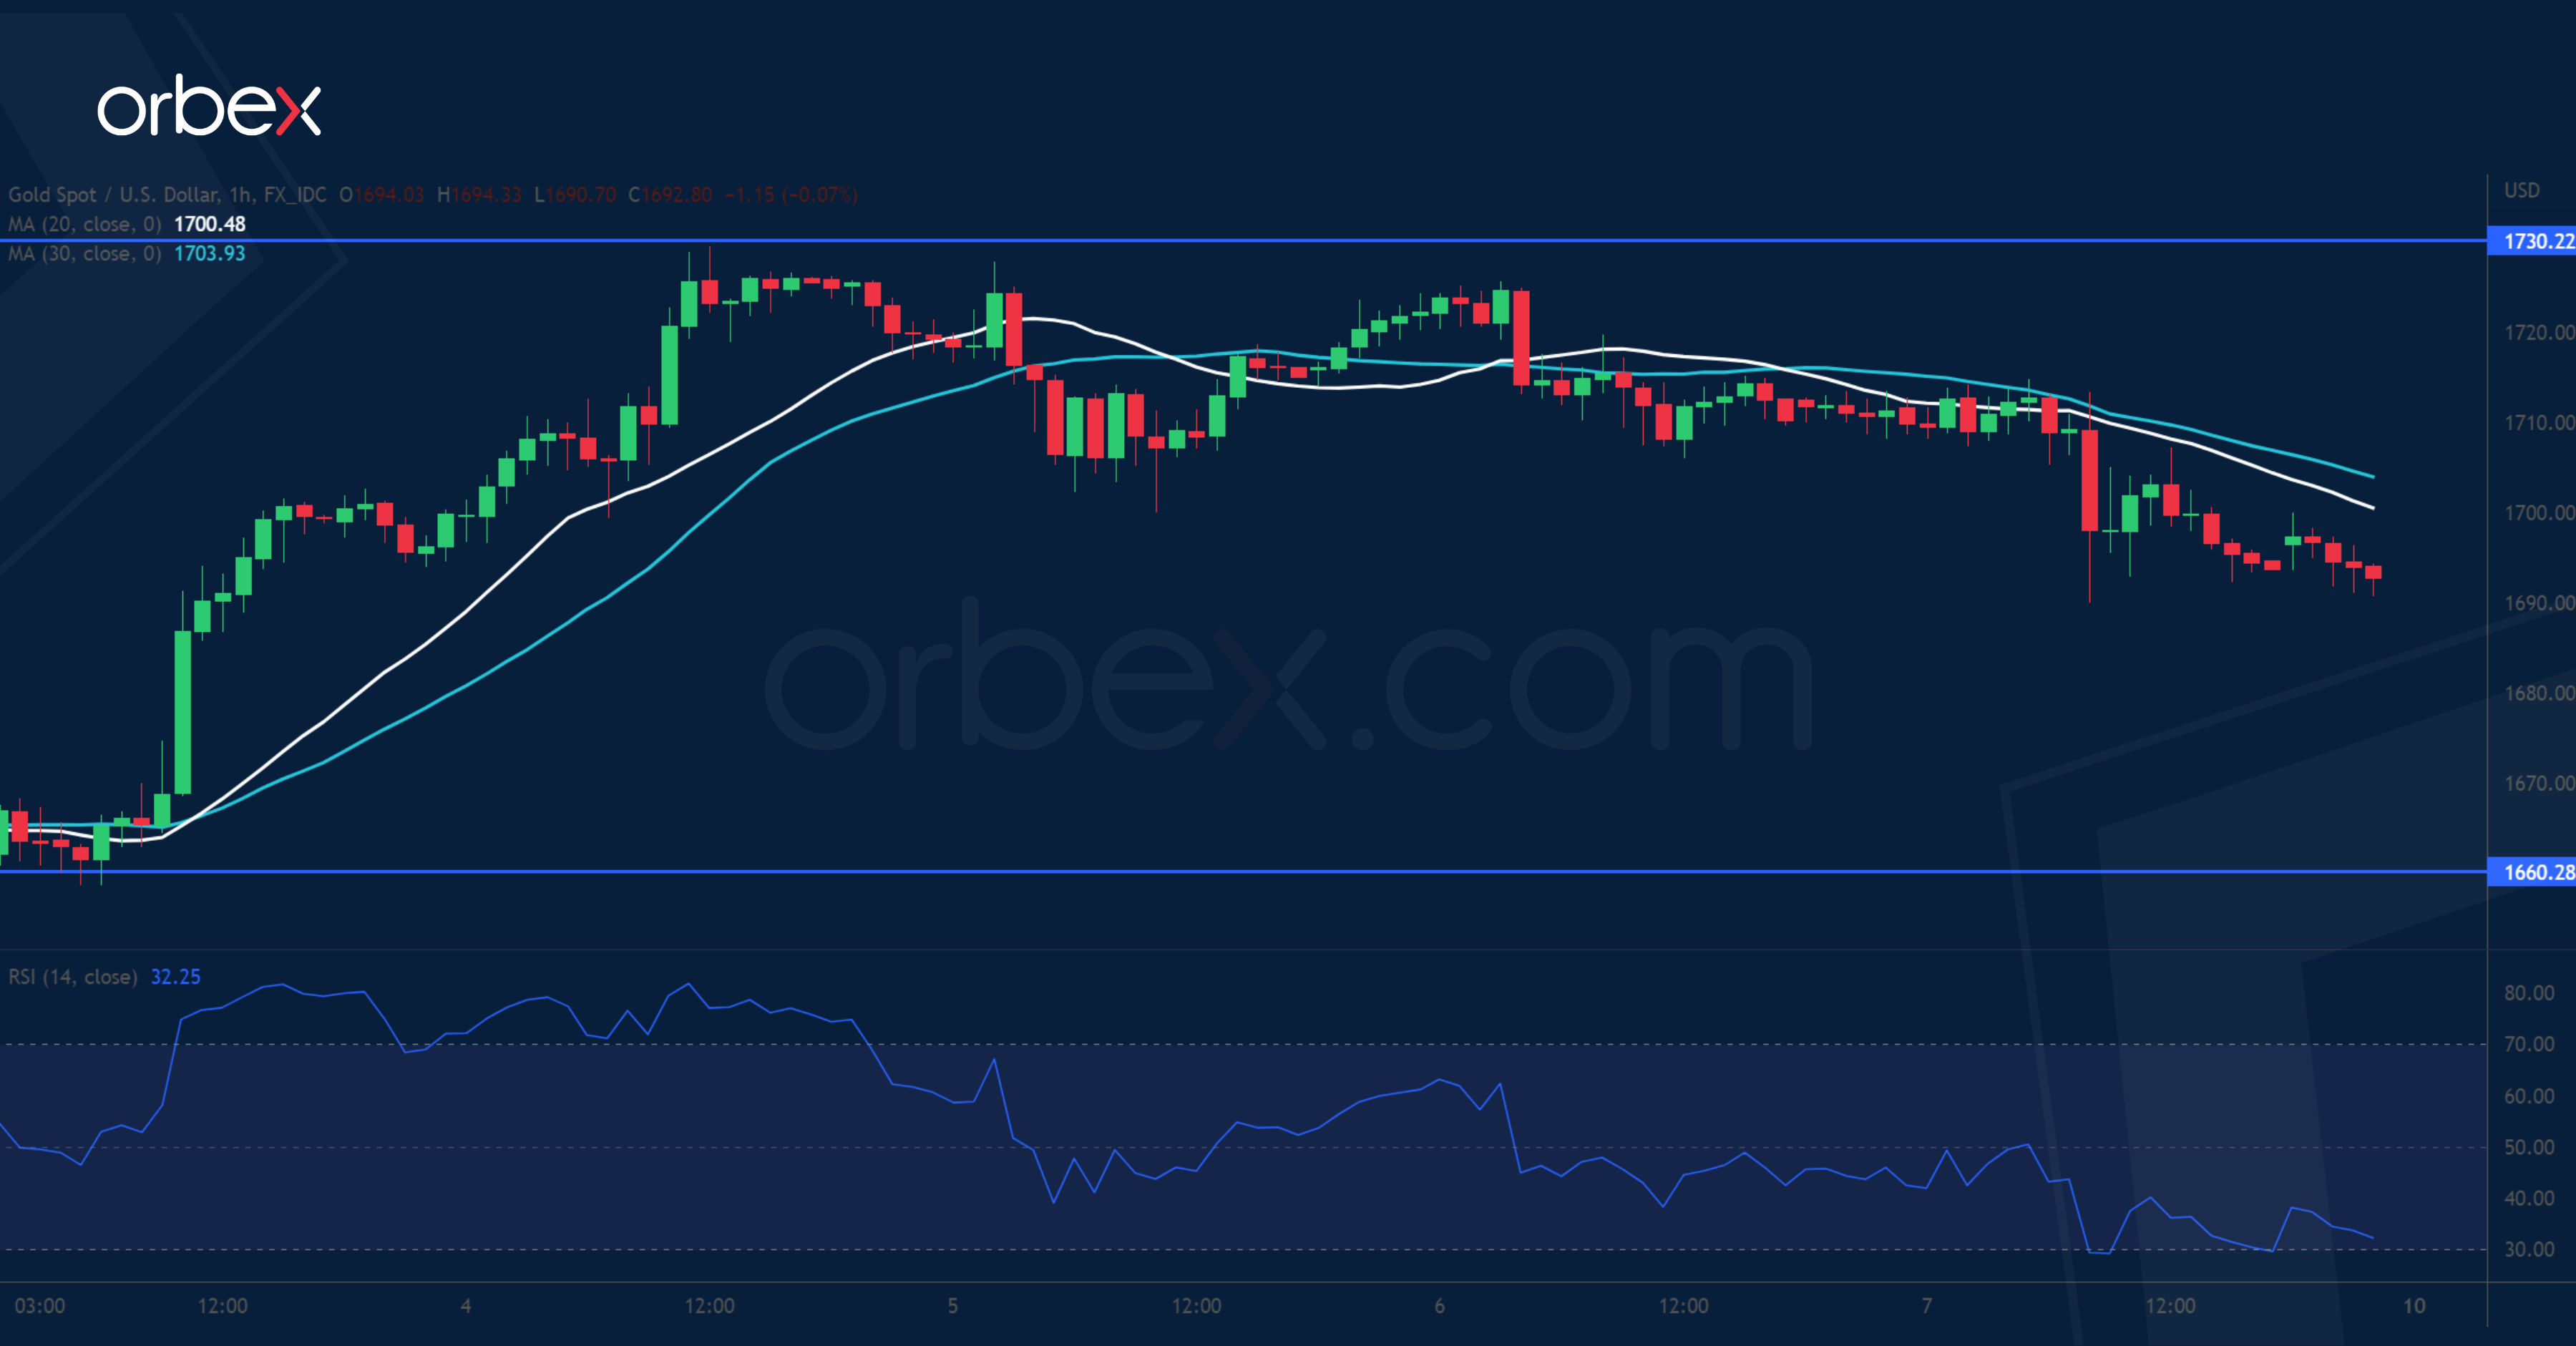
Gold slipped after the US dollar regained strength over upbeat nonfarm payrolls. The precious metal came under pressure near September’s high at 1730. As the RSI showed exhaustion, a combination of short-term profit-taking and fresh selling has kept the rally in check. A bullish breakout would force sellers out and attract momentum buyers instead, turning sentiment around. But for now, a drop below the round number at 1700 may send bullion to 1660 which is a critical support in keeping the rebound valid.
USD/CAD Awaits Breakout
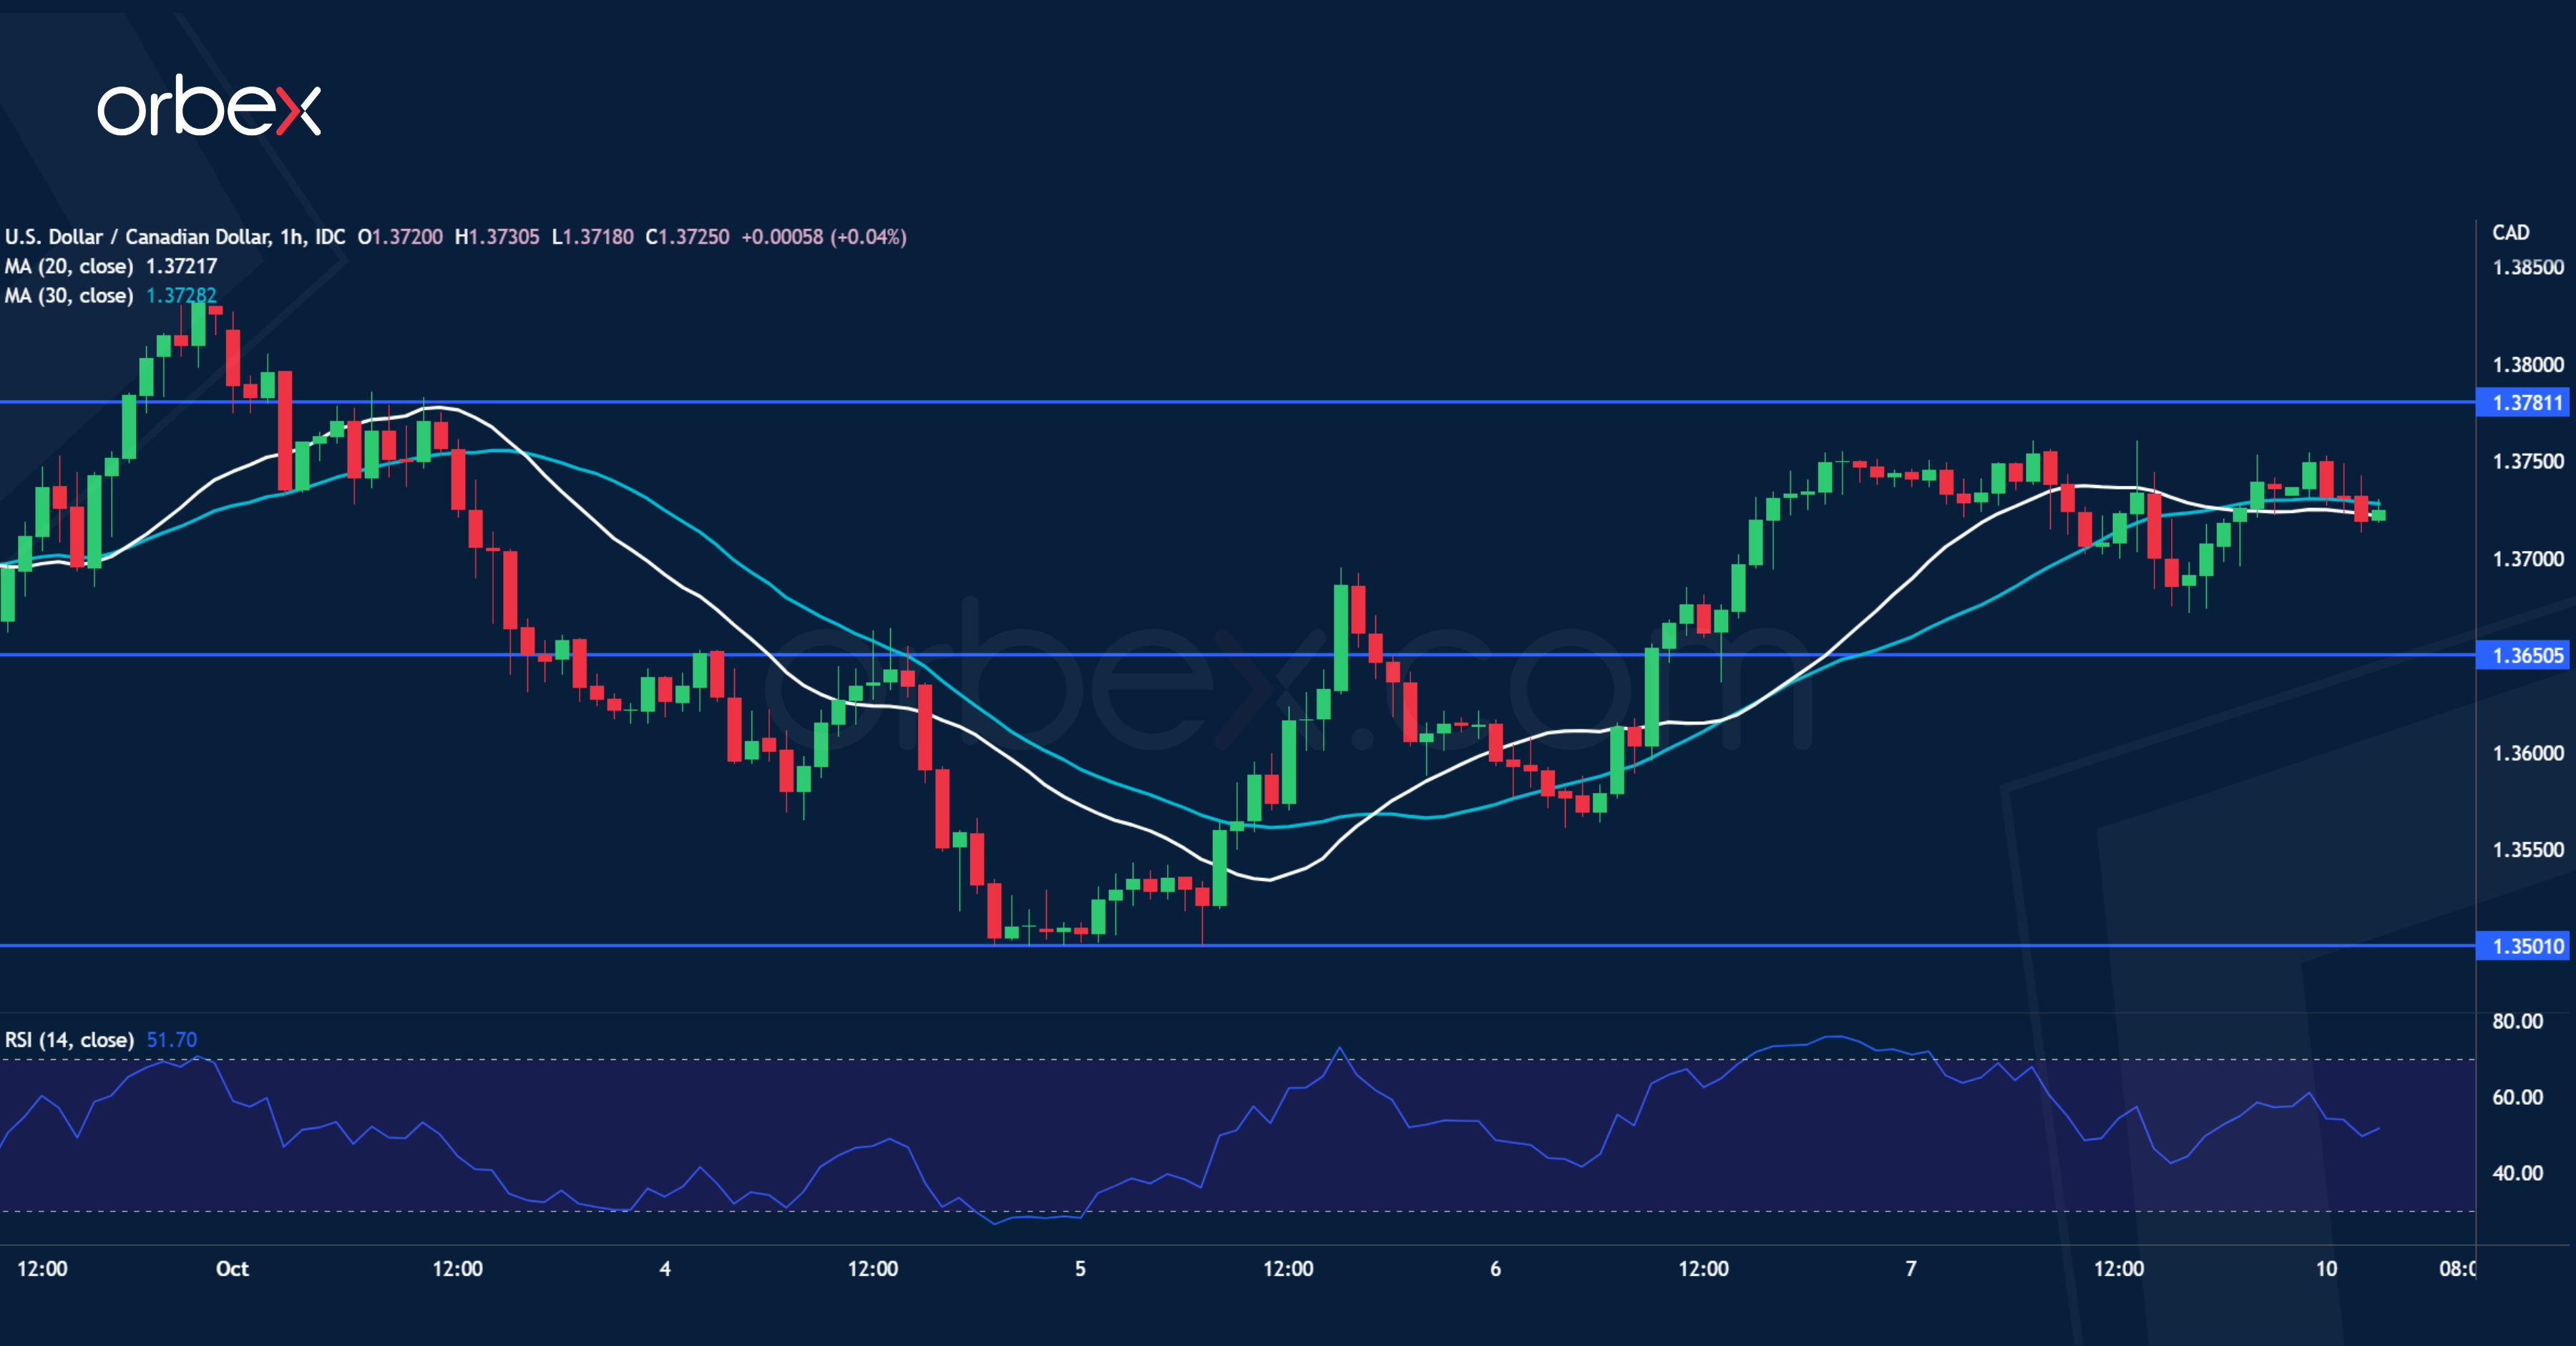
The US dollar finds support from a stronger-than-expected jobs report in September. The pair has been consolidating its gains after a vertical ascent lately. An overbought RSI on the daily chart calls for a limited pullback as the bulls might be reluctant to chase after high bids. The price has bounced off 1.3500 and made its way back to the key resistance at 1.3780, where a breakout would signal a bullish continuation. Then the psychological level of 1.4000 could be within reach. On the downside, 1.3650 is the closest support.