

Sample Category Title
AUD/USD Weekly Outlook
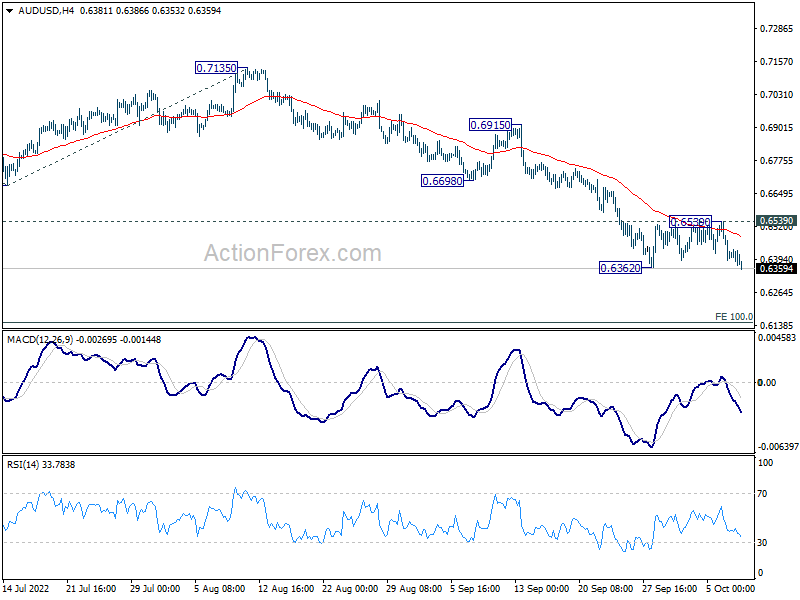
AUD/USD's late breach of 0.6362 support indicates down trend resumption. Initial bias is now on the downside this week. Next target is 100% projection of 0.7660 to 0.6680 from 0.7135 at 0.6155. On the upside, break of 0.6539 resistance is needed to indicate short term bottoming. Otherwise, outlook will stay bearish in case of recovery.
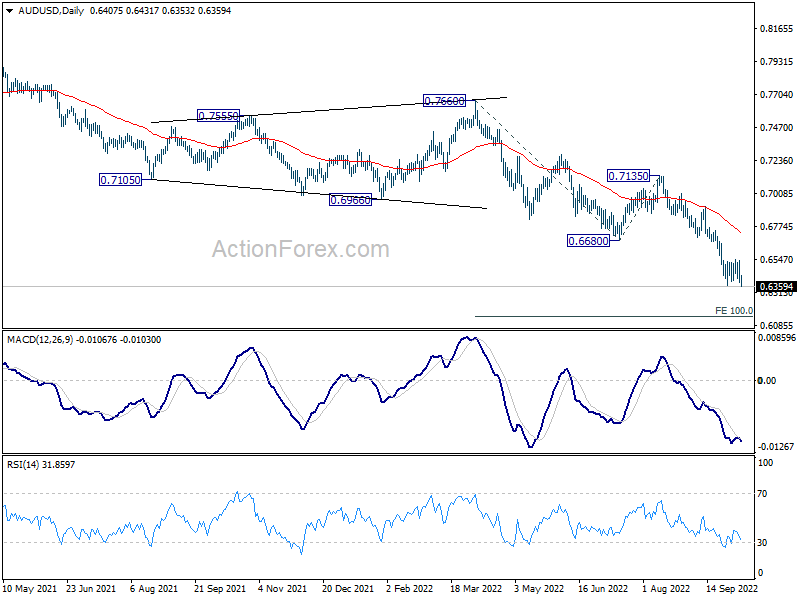
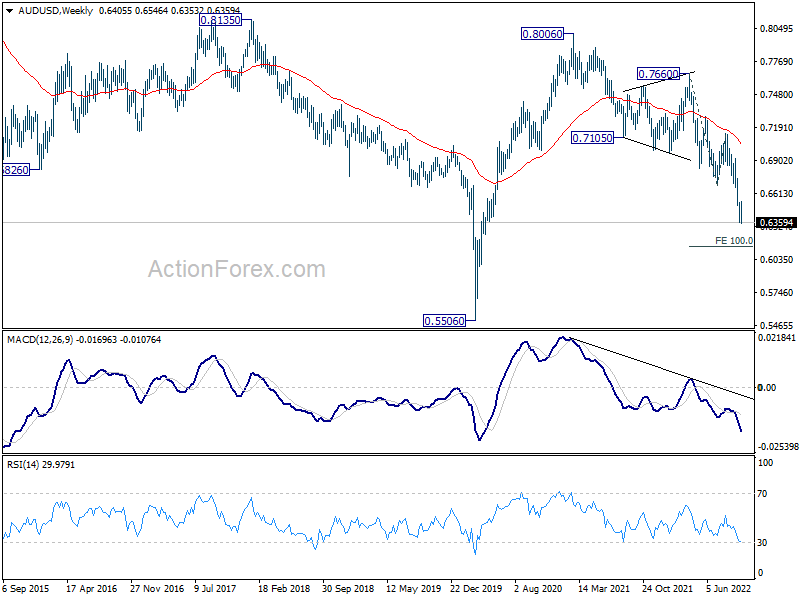
In the bigger picture, down trend form 0.8006 (2021 high) is expected to continue as long as 0.6680 support turned resistance holds. Next target is 0.5506 low. Medium term momentum will now be closely monitored to gauge the chance of break of 0.5506.
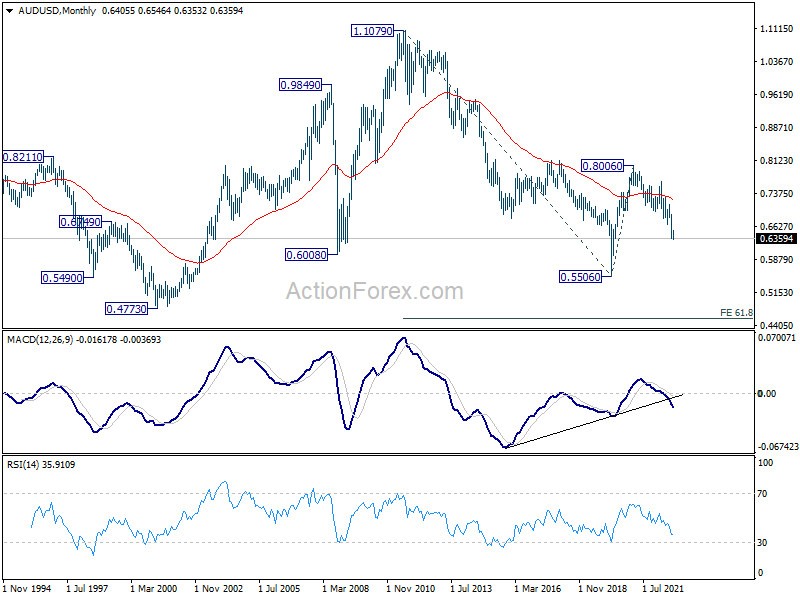
In the long term picture, current medium term downside momentum raises the chance of resumption of long term down trend from 1.1079 (2011 high). It's still a bit early to judge the chance. But break of 0.5506 will target 0.4773 (2001 low).
USD/CAD Weekly Outlook
USD/CAD dipped to 1.3501 last week but rebounded. Initial bias is neutral this week first. On the upside, firm break of 1.3832 will resume larger up trend. Next target is 161.8% projection of 1.2005 to 1.2947 from 1.2401 at 1.3925. In case of another fall, downside should be contained by 38.2% retracement of 1.2952 to 1.3832 at 1.3496 to bring rebound.
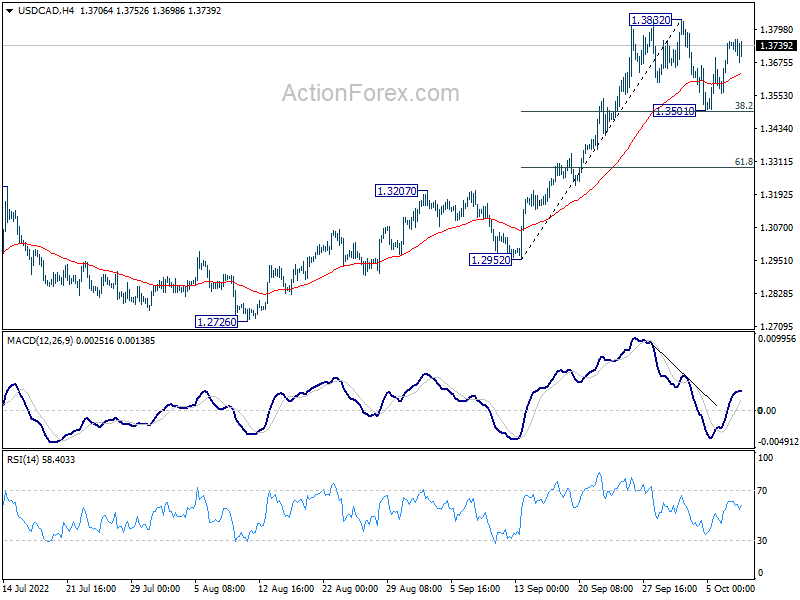
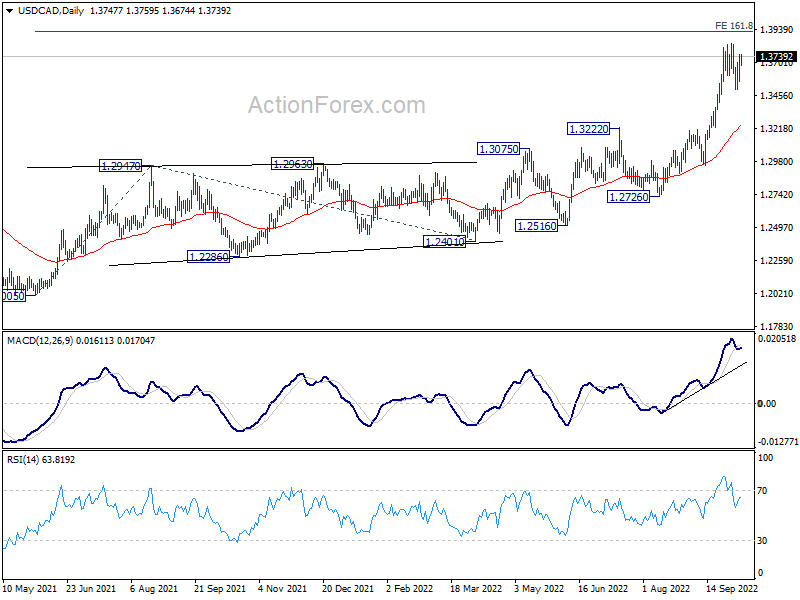
In the bigger picture, up trend from 1.2005 (2021 low) is still in progress. Based on current impulsive momentum, it could be resuming long term up trend from 0.9056 (2007 low). Whether it is or it isn't, retest of 1.4689 (2016 high) should be seen next. This will now remain the favored case as long as 1.3222 resistance turned support holds.
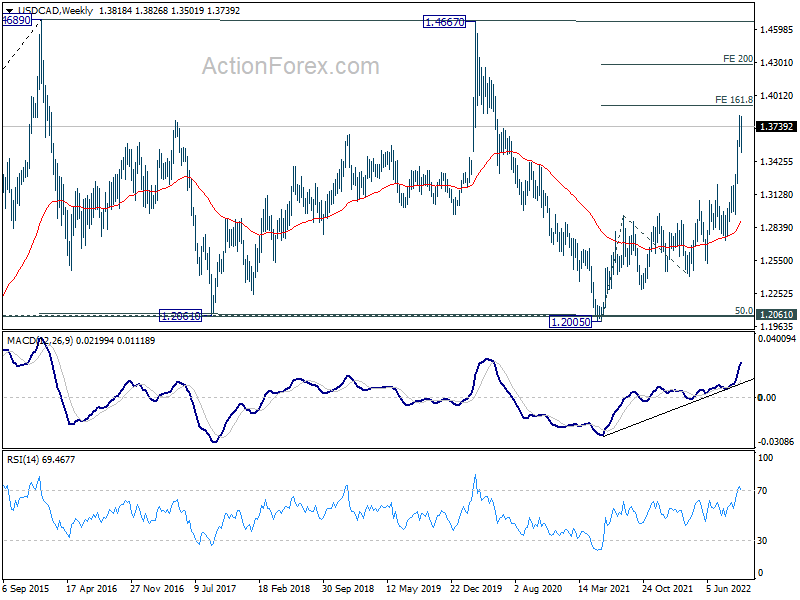
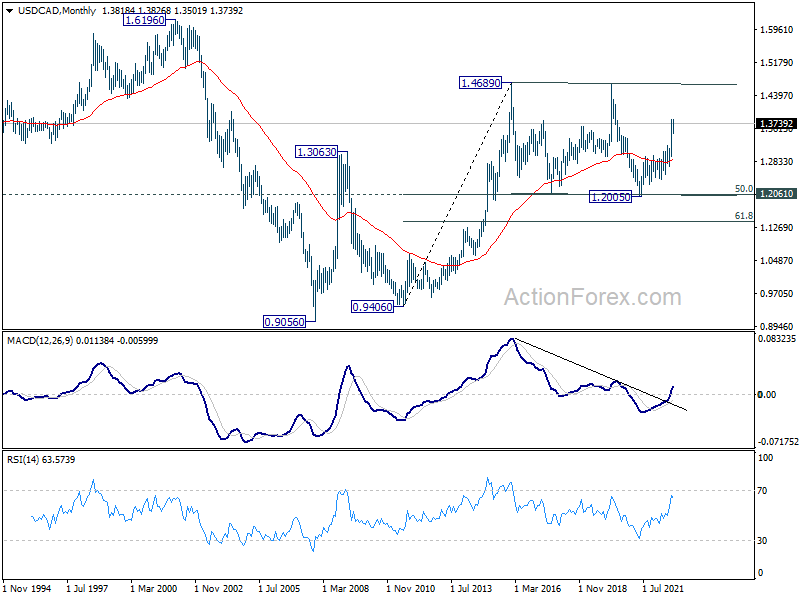
In the longer term picture, price actions from 1.4689 (2016 high) are seen as a consolidation pattern only, which might have completed at 1.2005. That is, up trend from 0.9506 (2007 low) is expected to resume at a later stage. This will remain the favored case as long as 1.2061 support holds, which is close to 50% retracement of 0.9406 to 1.4689 at 1.2048.
GBP/JPY Weekly Outlook
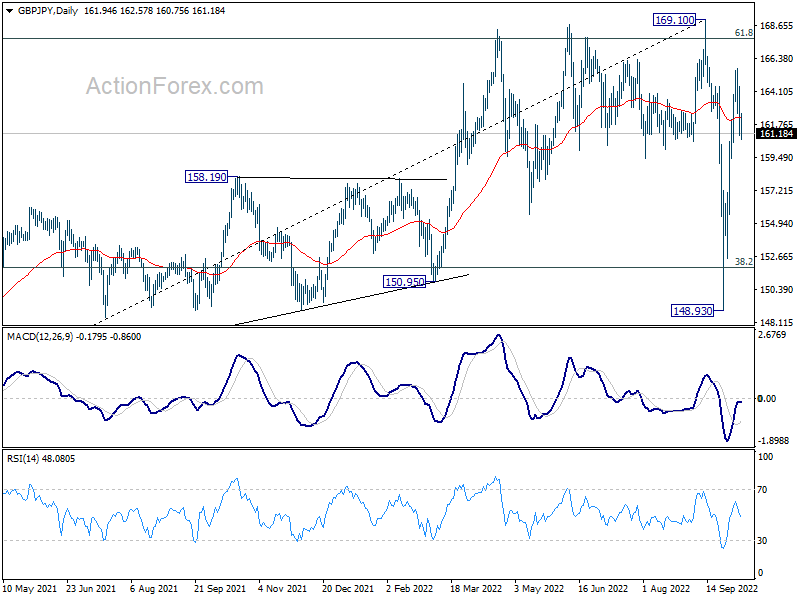
GBP/JPY rebounded further to 165.69 last week but retreated since then. Initial bias remains neutral this week first. While further rise could be seen, strong resistance might be seen from 169.10 high to limit upside, at least on first attempt. On the downside, below 159.41 minor support will turn bias back to the downside for 148.93 again. However, firm break of 169.10 will confirm resumption of larger up trend.
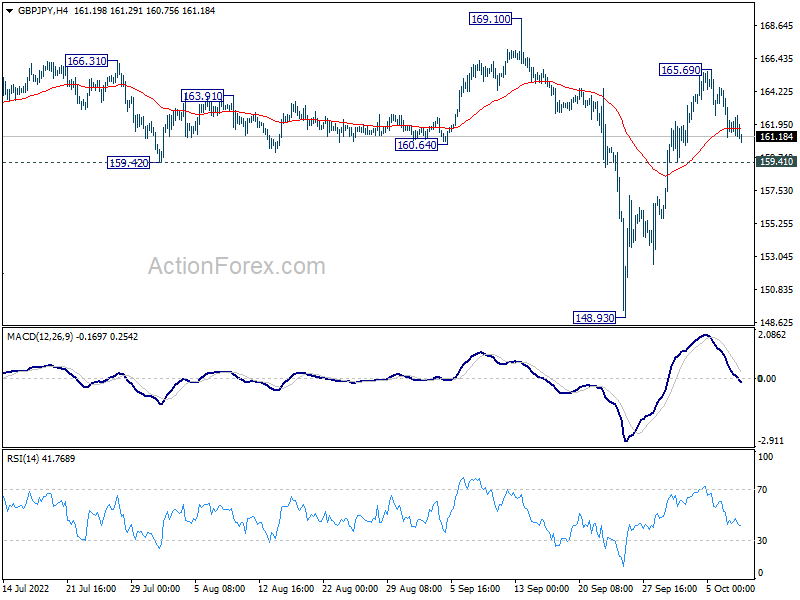
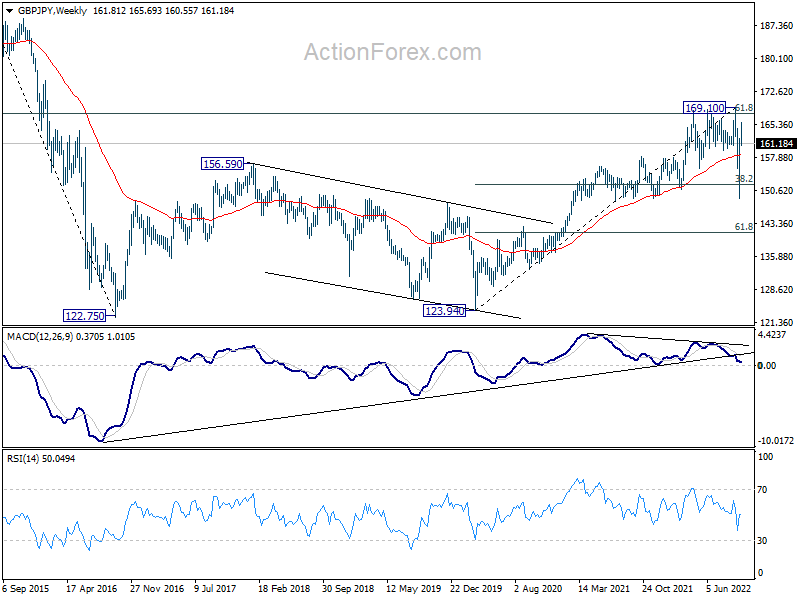
In the bigger picture, strong support from 38.2% retracement of 123.94 to 169.10 at 151.84 suggests that price actions from 169.10 are developing into a corrective pattern only. That is, rise from 123.94 (2020 low) should resume at a later stage. This will now remain the favored case as long as 148.93 support holds.
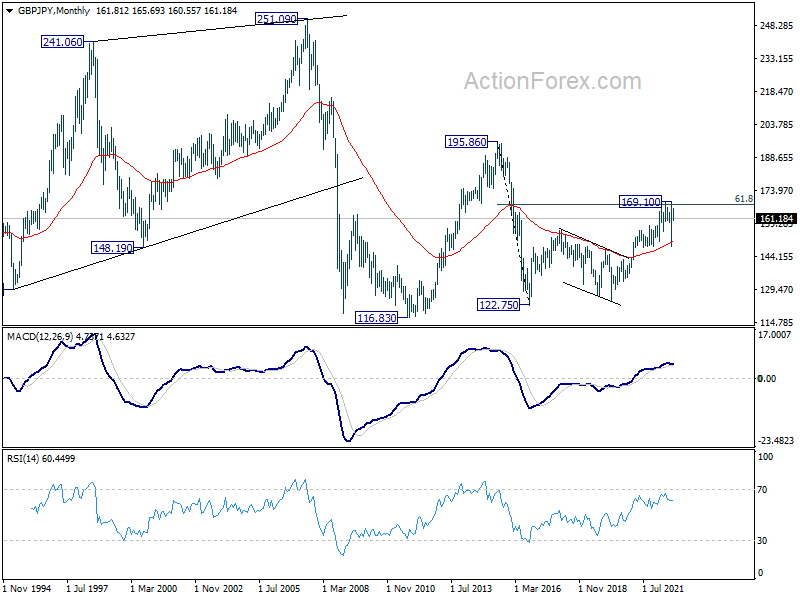
In the longer term picture, as long as 55 month EMA (now at 151.00) holds, rise from 122.75 could still extend higher at a later stage. However, sustained break of 55 month EMA will ague that whole rise has completed, and open up deeper fall back to 116.83/122.75 support zone.
EUR/JPY Weekly Outlook
EUR/JPY rose further to 144.06 last week but retreated well ahead of 145.62 high. Initial bias stays neutral this week first. On the upside, firm break of 145.62 resistance will resume larger up trend. However, break of 140.77 minor support will turn bias back to the downside, to extend the corrective pattern from 145.62 with another falling leg towards 137.32 support.
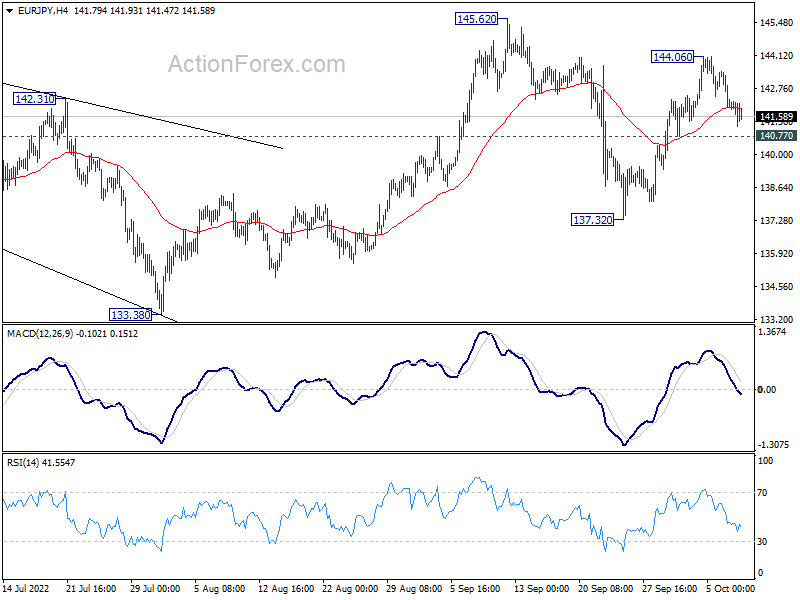
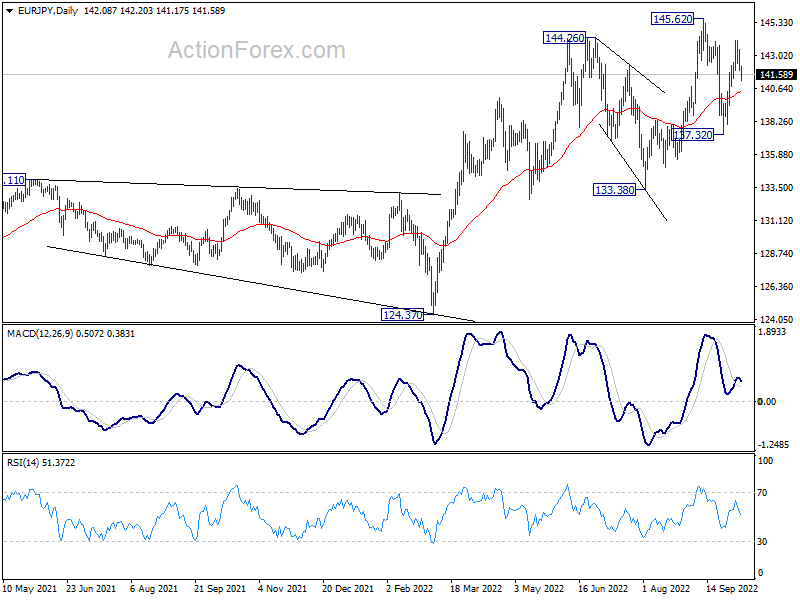
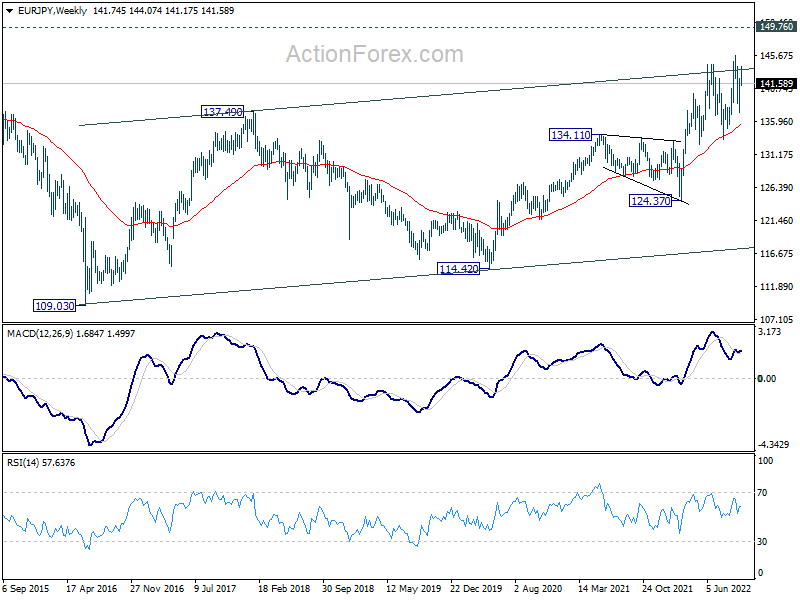
In the bigger picture, as long as 133.38 support holds, the up trend from 114.42 (2020 low) could still extend through 145.62 high. In that case, next target is 149.76 (2015 high). However, sustained break of 133.38 will be a sign of medium term bearish reversal and bring deeper fall to 124.37 support first.
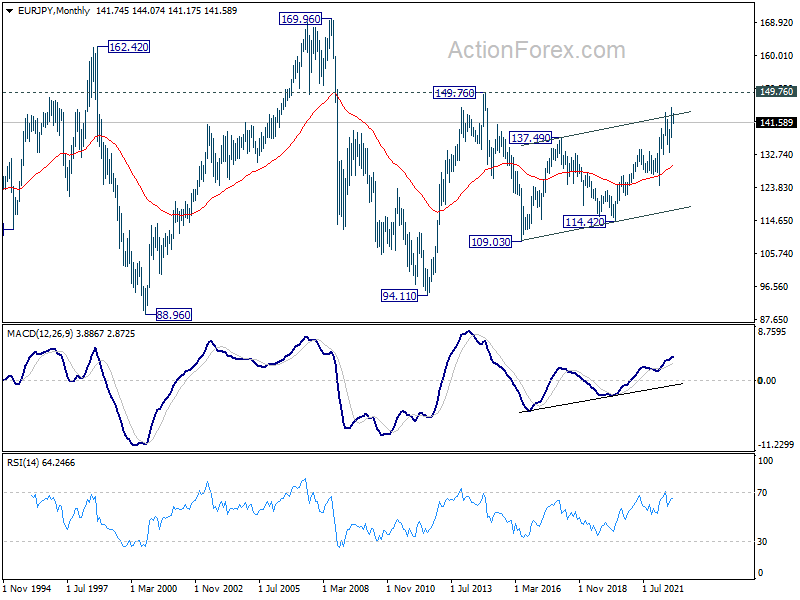
In the long term picture, as long as 55 month EMA (now at 129.41) holds, up trend 109.03 (2016 low) should still extend higher to 149.76 resistance (2014 high). However, sustained break of 55 month EMA will argue that the three wave pattern has completed, and bring deeper fall back to 109.03/114.42 support zone.
EUR/GBP Weekly Outlook
EUR/GBP dropped further to 0.8647 last week but recovered. Initial bias is neutral this week first. On the downside, sustained trading below 55 day EMA (now at 0.8625) will extend the fall from 0.9267 (as another falling leg of a long term consolidation pattern), to 0.8201/8338 support zone. On the upside, above 0.8848 minor resistance will turn bias back to the upside for recovery instead.
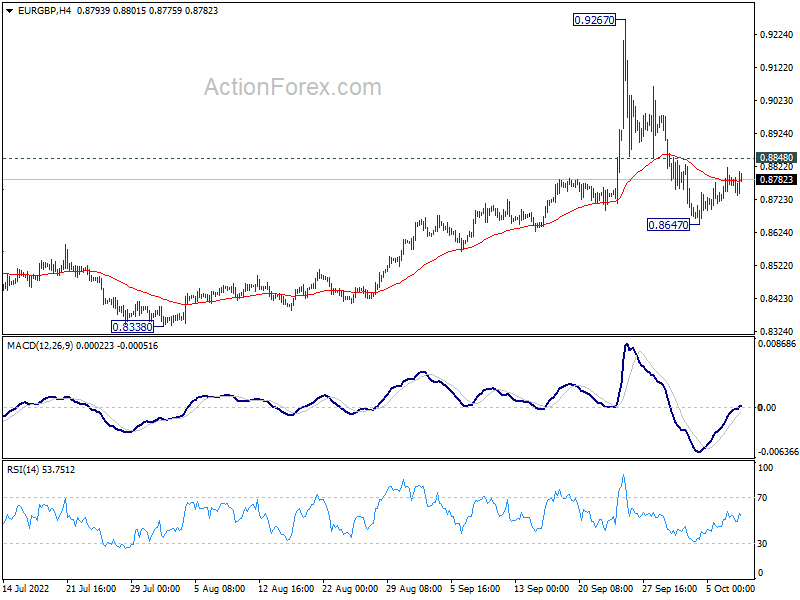
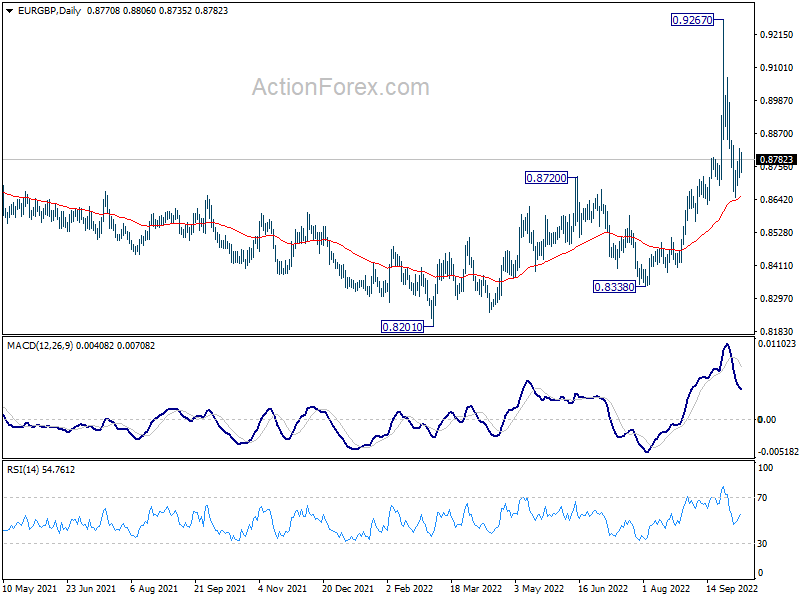
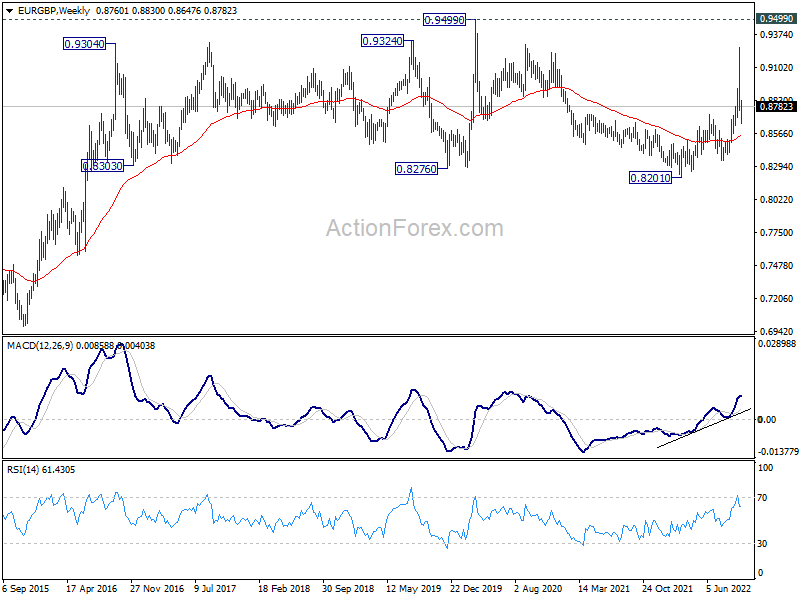
In the bigger picture, as long as 0.8720 resistance turned support holds, rise from 0.8201 is seen as resuming larger up trend from 0.6935 (2015 low). Break of 0.9499 (2020 high) should be seen at a later stage. However, firm break of 0.8720 will argue that sideway pattern from 0.9499 is extending with another falling leg instead.
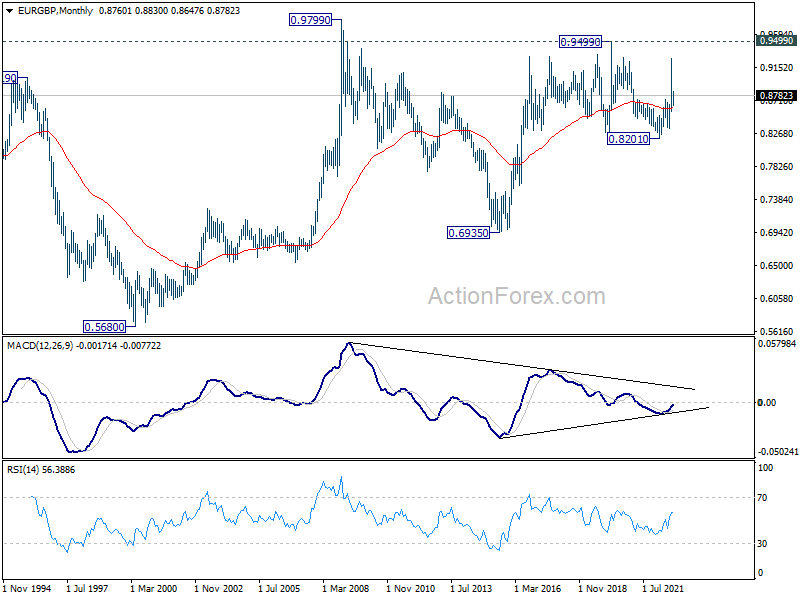
In the long term picture, the fall form 0.9499 (2020 high), as a correction to rise from 0.6935 (2015 low), could have completed 0.8201. It's still early to judge that up trend is ready to resume. But in that case, further rise would be seen to 0.9499 first, and then 0.9799 (2009 high).
EUR/AUD Weekly Outlook
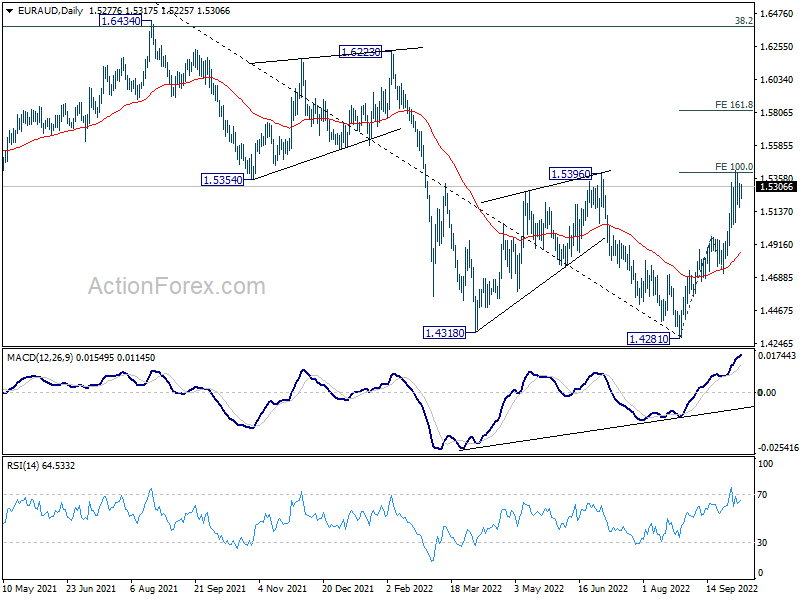
EUR/AUD rose further to 1.5416 last week but failed to sustain above 1.5396 resistance and retreated. Initial bias stays neutral this week first. Further rally is in favor as long as 1.5047 support holds. Firm break of 1.5416 will carry larger bullish implication. Next target is 161.8% projection of 1.4281 to 1.4965 from 1.4716 at 1.5823. However, break of 1.5047 will turn bias back to the downside for 55 day EMA (now at 1.4867).
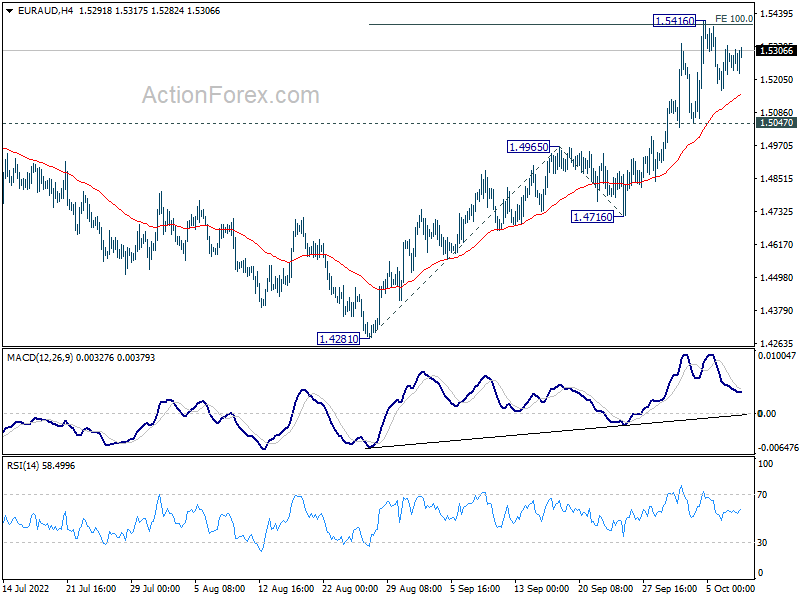
In the bigger picture, current development raises the chance of medium term bottoming at at 1.4281, on bullish convergence condition in daily MACD. Firm break of 1.5396 will bring stronger rally back to 1.6434 key resistance next. Nevertheless, rejection by 1.5396 will maintain medium term bearishness for another fall through 1.4281 at a later stage.
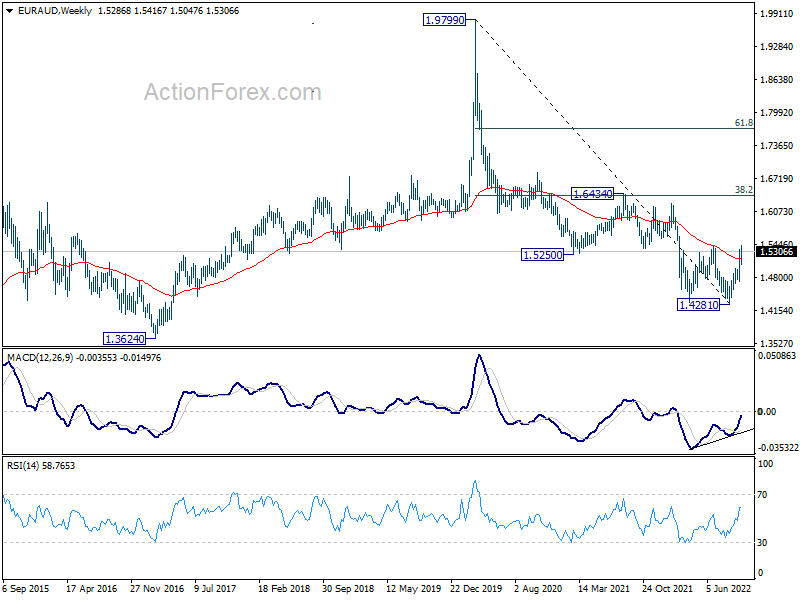
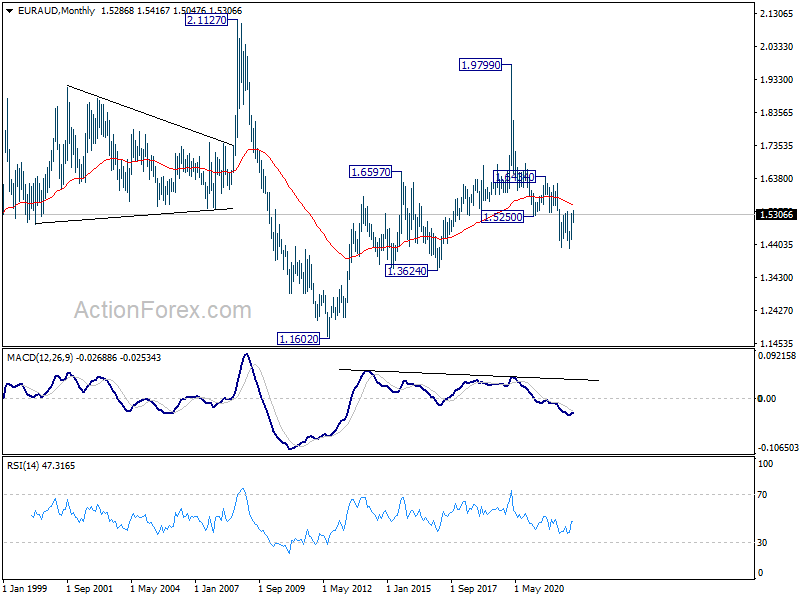
In the longer term picture, as long as 55 month EMA (now at 1.5599) holds, the down trend from 1.9799 (2020 high) could still extend to 1.3624 long term support, and below. However, sustained trading above 55 month EMA will raise the chance that this down trend was over. Further break of 1.6434 resistance should confirm medium term bullish reversal.
EUR/CHF Weekly Outlook
EUR/CHF's rebound from 0.9407 extended to 0.9798 last week, but lost momentum again. Initial bias remains neutral this week first. On the upside, above 0.9798 will resume the rebound to 0.9864 resistance. Firm break there will solidify the case of medium term bottoming at 0.9407, and target 38.2% retracement of 1.1149 to 0.9407 at 1.0072. On the downside, below 0.9641 minor support will turn bias back to the downside for retesting 0.9407 low instead.
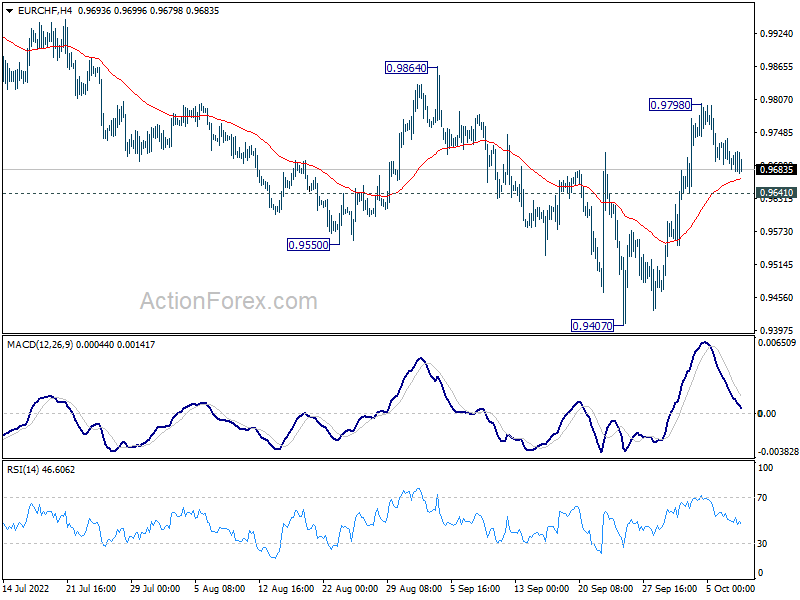
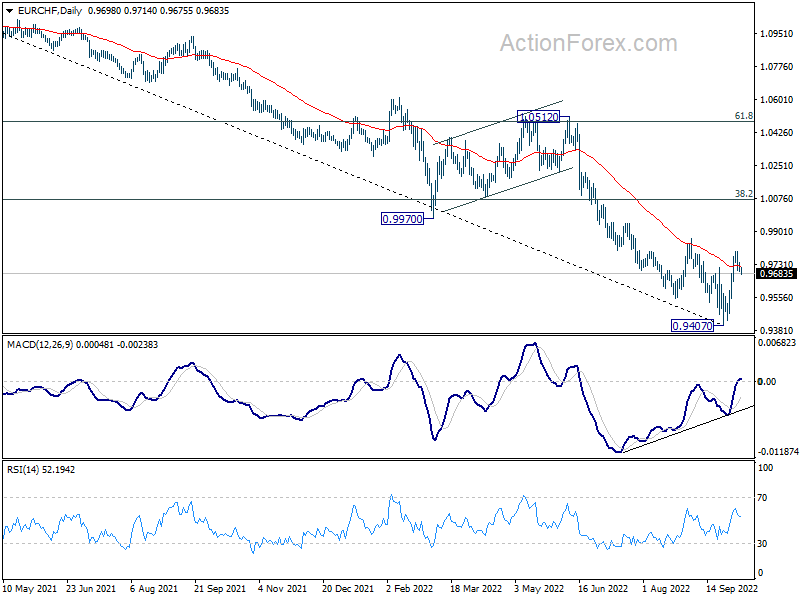
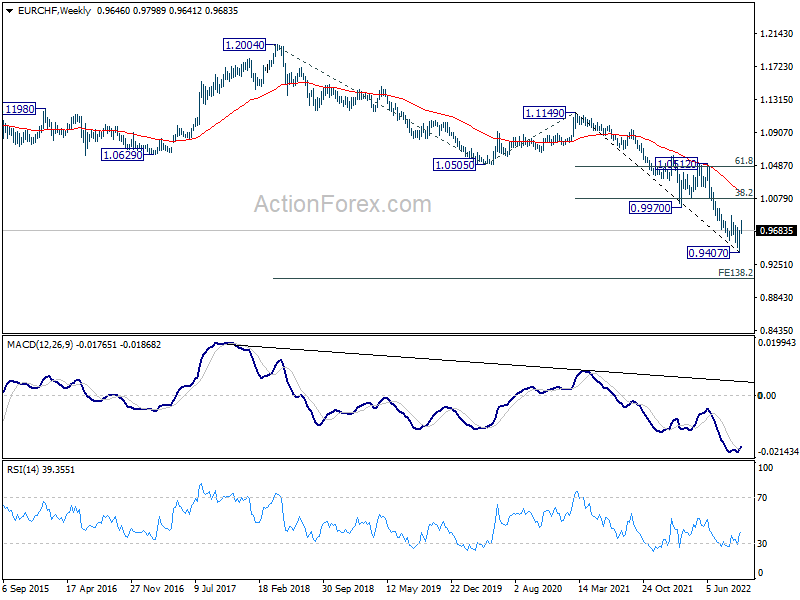
In the bigger picture, as long as 0.9864 resistance holds, long term down trend from 1.2004 (2008 high) is expected to continue. Next target is 138.2% projection of 1.2004 to 1.0505 to 1.1149 at 0.9033. However, firm break of 0.9864 will confirm medium term bottoming, on bullish convergence condition in daily MACD. Stronger rally would then be seen back to 55 week EMA (now at 1.0152), even as a corrective rebound.
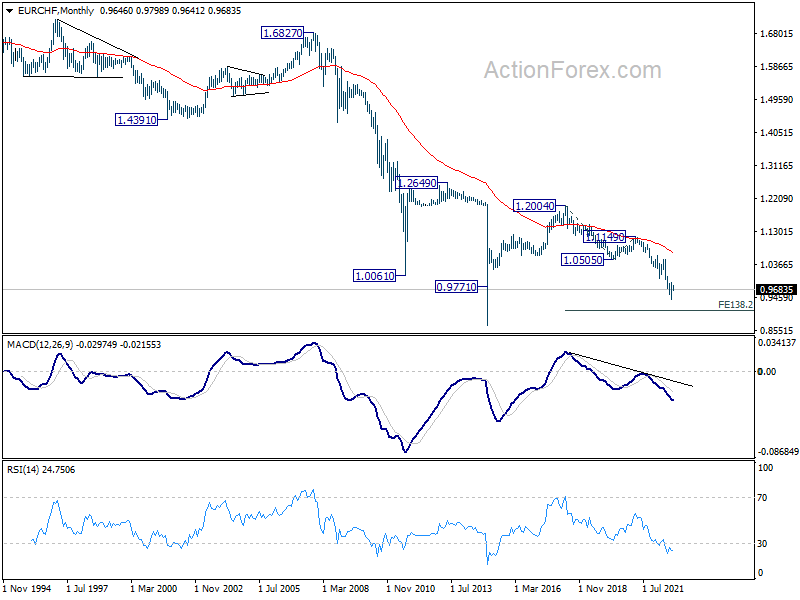
In the long term picture, capped below 55 month EMA, EUR/CHF is seen as extending the multi-decade down trend. There is no prospect of a bullish reversal until firm break of 1.0505 support turned resistance (2020 low).
Summary 10/10 – 10/14
Monday, Oct 10, 2022
[php_everywhere instance="1"]
Tuesday, Oct 11, 2022
[php_everywhere instance="2"]
Wednesday, Oct 12, 2022
[php_everywhere instance="3"]
Thursday, Oct 13, 2022
[php_everywhere instance="4"]
Friday, Oct 14, 2022
[php_everywhere instance="5"]
What’s Next for Japan and the Yen?
Summary
- Japan's economy has been reasonably resilient so far in 2022. Growth has been moderate, although confidence surveys suggest mixed prospects for different economic sectors, consistent with only moderate growth ahead.
- We also expect relatively contained inflation going forward as well. While prices are elevated compared to recent history, inflation remains low by international standards.
- As for the currency, historically there have been two important drivers for movements in the yen: the currency's safe haven characteristics and Japan's yield differentials with the rest of the world. In more recent times the yen's safe haven properties seem to have diminished to some extent, whereas yield differentials have remained a better indicator of potential trends in the yen.
- Given that yield spreads appear to be the more influential driver, trends in global monetary policy, especially those of the Federal Reserve, should be influential for the yen. The increasing divergence in monetary policy between a hawkish Federal Reserve and dovish Bank of Japan means we believe the yen still has room to weaken against the U.S. dollar in the medium term, even if the Ministry of Finance intervenes in FX markets again to support the currency.
- We believe that as yields continue to diverge, the yen can weaken toward a USD/JPY exchange rate of JPY149.00 by Q1-2023, before recovering somewhat as next year progresses.
Only Moderate Economic Growth Ahead for Japan
Japan's economy has been reasonably resilient so far in 2022. Growth has been moderate; the economy expanded 0.9% quarter-over-quarter (not annualized) in the Q2, following a mere 0.1% gain in Q1. Taking a closer look at the details of the Q2 GDP report, this growth was broad-based, with private consumption growing 1.2% over the quarter and business capital spending increasing by 2%.
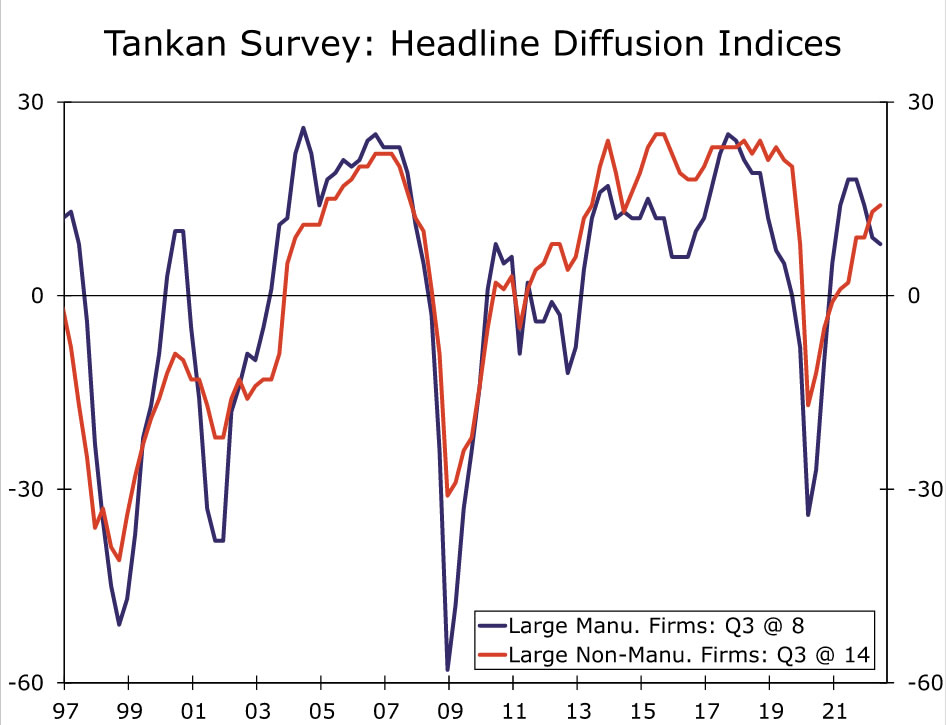
However, key measures from the Bank of Japan's Q3 Tankan surveys showed business sentiment in some sectors becoming less upbeat. Confidence at large manufacturing firms continued to soften in Q3, with the large manufacturers' diffusion index unexpectedly falling one point to 8 in Q2, the third consecutive decline. A positive Tankan survey reading indicates that of the surveyed businesses, optimists outnumbered pessimists. So while in Q3 some optimists likely became pessimists, there are still more optimists than pessimists overall. Future expectations also became less positive, as the forward-looking outlook measure for manufacturing firms fell one point to 9.
Meanwhile, service sector sentiment improved, with the large non-manufacturing index ticking up to 14 from 13, as Japan gradually reopens its borders to travel and tourism. However, uncertainty regarding how the service sector will fare amid a global slowdown may be clouding future expectations, as the outlook reading fell two points to 11. Ultimately, softening confidence is consistent with our expectation for only moderate growth ahead.
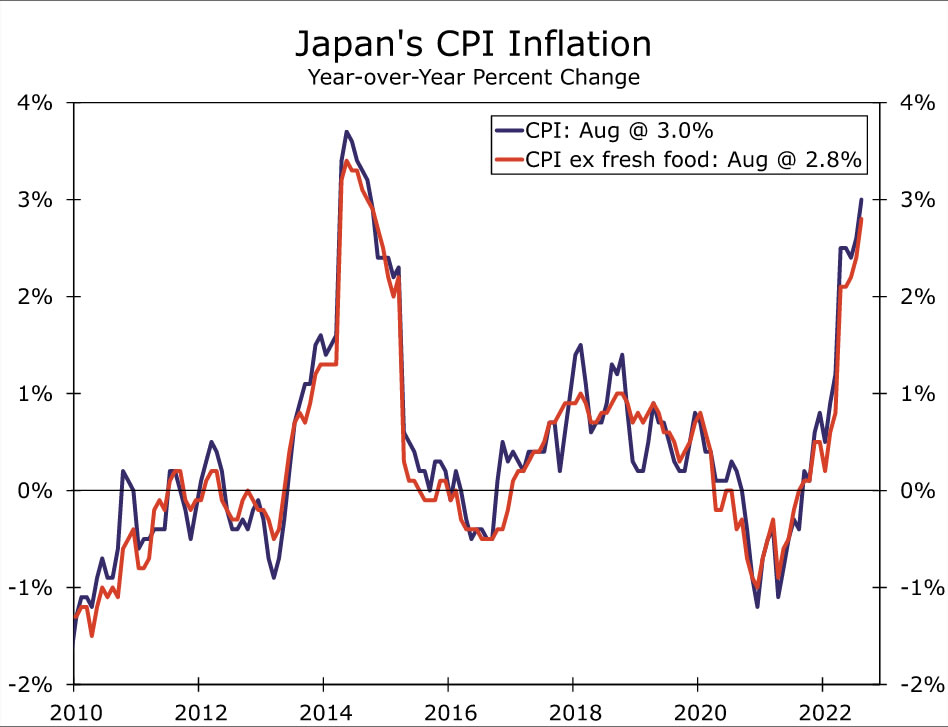
As for inflation, prices have picked up and are elevated compared to recent history, although inflation remains low by international standards. In August, nationwide CPI inflation reached 3.0% year-over-year, with the CPI excluding volatile components like fresh food and energy lower at 1.6%. We expect these moderate trends for growth and inflation to continue in 2022.
Bank of Japan: Easy Does It
With only limited growth and inflation as well as softening sentiment, we expect the Bank of Japan (BoJ) to maintain its easy monetary policy stance in the near-to-medium term. At the BoJ's September meeting, the central bank was clear that no rate hikes are on the table. Thus, we do not expect any shift in the BoJ's key policy parameters—the policy rate and the 10-year government bond yield target—for the foreseeable future. BoJ Governor Kuroda has said monetary easing will support the economy and help prevent a downturn, and the BoJ won't hesitate to add to easing if needed.
Given the yen's continued depreciation against the U.S. dollar, the Ministry of Finance recently intervened in currency markets for the first time in over 30 years, spending US$19.7B in September to support the currency. While the yen surged initially, that gain proved to be short-lived. The yen is currently down around 20% against the U.S. dollar year-to-date, and the Ministry of Finance has warned of yet another intervention to prop up the currency, committing to take “bold action” if there are “excessively one-sided moves”. Ultimately, we still expect weakness in the yen versus the U.S. dollar in the coming quarters, and view intervention as likely to provide only temporary relief for the currency.
Safe Haven vs. Yield Differentials: Which is More Influential for the Yen?
Historically, there have been two important drivers for movements in the yen. The first comes from safe haven characteristics of the currency. The second is Japan's yield differentials with the rest of the world. Looking back at much of the past decade, both seem to be relevant influences for the currency. However, more recently, the yen's safe haven properties seem to have diminished to some extent, while yield differentials have remained a better indicator of the yen's potential future trend.
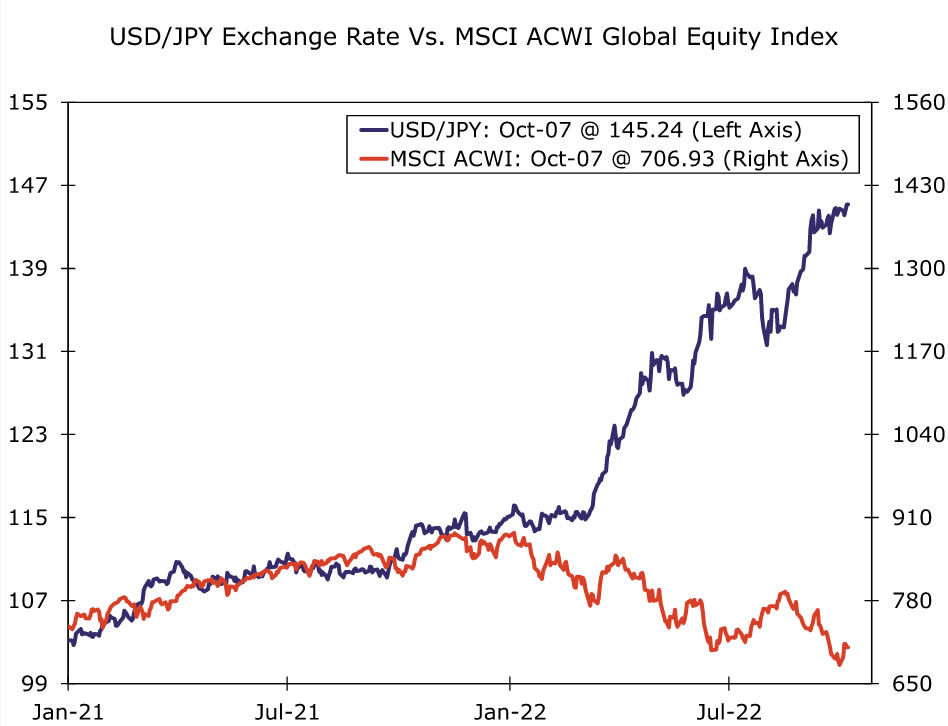
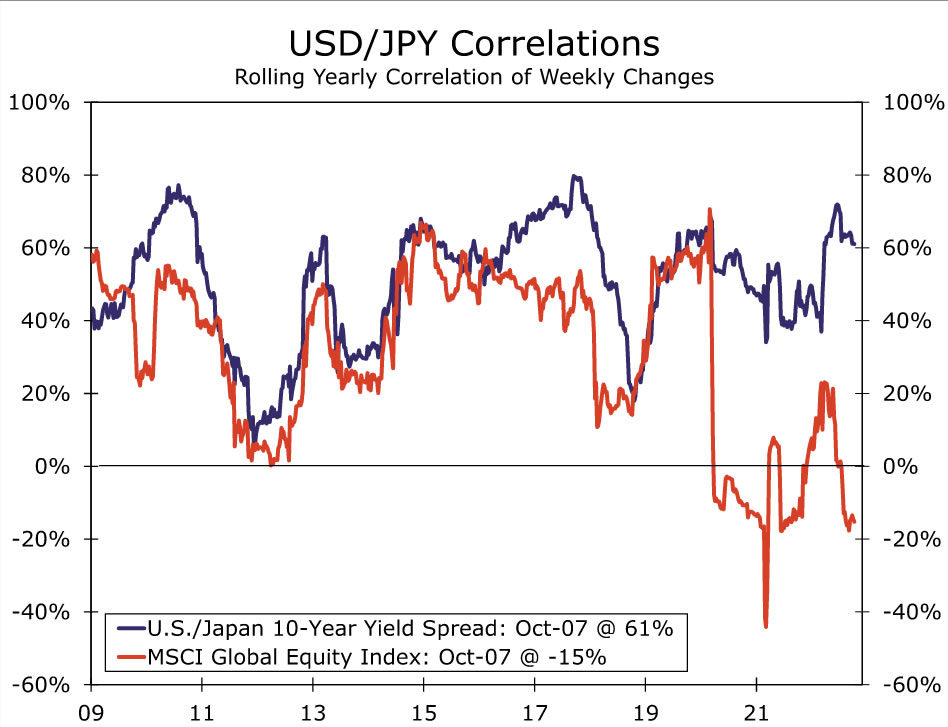
Safe haven investments are typically attractive during times of market volatility, and are expected to retain or gain value during times of market stress. In theory, safe haven currencies should do better when equity markets are down. To better understand the historical relationship between global equity markets and the yen, and examine the correlation between these variables over time. We used the MSCI global equity index (in local currency terms) to measure worldwide equity performance. We would expect the USD/JPY exchange rate to have a positive correlation with equity performance, with both moving in the same direction most of the time. That is, when an equity index declines, the USD/JPY exchange rate should also decline so that the U.S. dollar gets weaker and the Japanese yen gets stronger. Using weekly returns between 2010 and 2019 (prior to the pandemic), the correlation between the MSCI global equity index and USD/JPY is indeed positive at +35%. However, since the start of 2020 (essentially when the pandemic began), the correlation between equities and USD/JPY has turned negative. And indeed, weekly data since March 2022 (when the Fed first began to lift the fed funds rate) show that MSCI index returns had a negative correlation with changes in USD/JPY, with the correlation at -24%. This would imply a negative relationship between the currency pair and global equities, or in other words when equities fall, USD/JPY rises or the yen weakens against the U.S. dollar—antithetical to the characteristics of a safe haven currency. While it is not obvious why the yen's safe haven characteristics have diminished, recent history suggests looking elsewhere for a more reliable currency driver, as the equity-yen correlation has broken down.
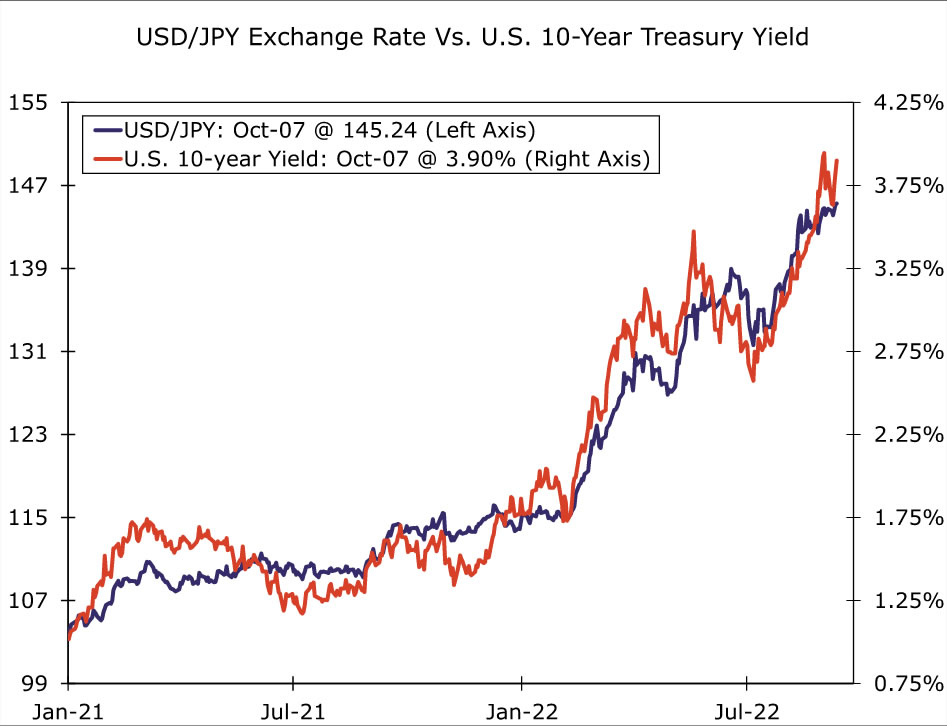
That brings us to yield differentials between the U.S. and Japan. To compare these differentials, we used the difference between the yield on the 10-year U.S. Treasury bond and the yield on the 10-year Japanese government bond (JGB). Similarly to equities, we would also expect USD/JPY to have a positive correlation with this yield spread. Given the BoJ targets a JGB yield near zero, rising U.S. yields as a result of Fed tightening should ultimately be supportive of the dollar. A stronger dollar would drive up the USD/JPY exchange rate and reflect a weaker yen. Indeed, using weekly percentage changes since 2010, the correlation between USD/JPY and the yield spread is +42%. In contrast to the yen and equities, there does not appear to have been any significant change in the relationship between the yen and yield spread during the pandemic, meaning the post-2010 correlation is representative of the historical behavior of the two variables. In our view, this yield spread, heavily influenced by BoJ and Fed policy, remains a better driver of the yen's movements than safe haven dynamics. When looking at the correlations between the weekly percentage change of the Treasury-JGB yield spread versus USD/JPY starting in March 2022, we observe a higher correlation of +68%.
The rolling yearly correlation of weekly changes in the yield spread and the MSCI index versus USD/JPY show that the two correlations sharply diverge in 2020 and have remained apart since, a sign that safe haven characteristics of the yen may not as reliable an influence as they were pre-pandemic. Given that yield spreads appear to remain a more influential driver of the USD/JPY exchange rate, trends in global monetary policy and bond yields, especially those of the Federal Reserve and United States, should be influential for the yen. The FOMC has committed to doing “whatever it takes” to bring inflation down, and we expect the FOMC to hike the fed funds rate by 75 bps in November and 50 bps in December. Looking ahead to 2023, we expect further tightening, with 25 bps rate hikes at both the February and March meetings. If realized, the target range for the fed funds rate would peak at 4.75%-5.00% in March 2023.
In stark contrast, the Bank of Japan likely will remain comfortable with easy monetary policy for the foreseeable future. Given the increasing divergence between a dovish BoJ and tighter Fed monetary policy, the yen still has potential to weaken against the U.S. dollar in the medium term, even if the Ministry of Finance intervenes in FX markets again to support the currency. We believe that as yields continue to diverge, the yen can weaken toward a USD/JPY exchange rate of JPY149.00 by Q1-2023. However, once the United States falls into recession and given our outlook for the Federal Reserve to eventually ease monetary policy, we do subsequently see potential for the yen to strengthen heading into late 2023.
Weekly Economic & Financial Commentary: Labor Market Cooling Jolts Markets
Summary
United States: Labor Market Cooling Jolts Markets
- Total payrolls rose by 263K in September, a shade above consensus. The unemployment rate fell to 3.5%, while average hourly earning increased 0.3%. Job opening plummeted by 1.1 million vacancies, according to September's JOLTS. The ISM manufacturing survey fell to 50.9 in September, while ISM services slipped to 56.7. During August, the U.S. trade deficit narrowed to $67.4 billion, while construction spending fell 0.7%.
- Next week: NFIB (Tuesday), CPI (Thursday), Retail Sales (Friday)
International: RBA Slows Down While RBNZ Keeps Constant
- The RBA delivered a smaller-magnitude 25 bps rate hike at its October monetary policy meeting, bringing its Cash Rate to 2.60%. This was in line with our forecast, but fell short of consensus and market expectations. The central bank signaled that it expects to further increase the policy rate in the period ahead, and said it remains “resolute in its determination” to bring down inflation. Also this week, the RBNZ delivered its fifth consecutive 50 bps rate hike, bringing the OCR to 3.50% and signaling more to come as well.
- Next week: Norway CPI (Monday), U.K. Monthly GDP (Wednesday), Sweden CPI (Thursday)
Credit Market Insights: Treasury Market Turbulence Intensifies
- A bout of volatility has taken a hold of Treasury markets. Global recession fears, aggressive rate hikes from the Fed and market intervention in the U.K. and Japan have intensified financial market volatility. Bond prices often rise when recession fears mount. Yet persistent inflation and the expectations for tighter monetary policy have pushed yields up, straining the inverse relationship commonly seen between bond and equity prices.
Topic of the Week: Cashed Out? A Look at Household Savings
- The U.S. consumer has shown incredible resilience, though cracks are starting to appear. If the differential from the pre-pandemic saving growth rate continues to decline at the same rate that it has over the past three quarters, the excess savings accumulated in 2020 and 2021 will be wiped out by Q3-2023.