

Sample Category Title
AUD/JPY downside breakout, targets 90
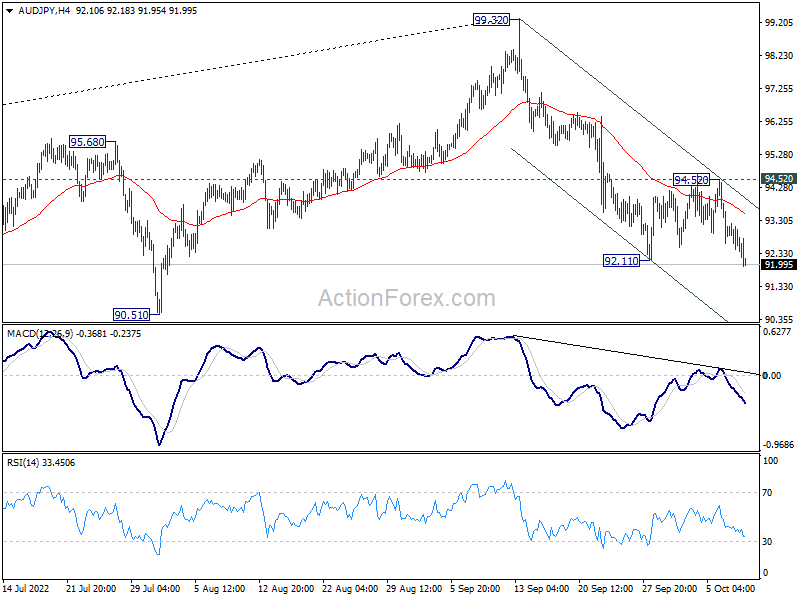
Australian Dollar falls broadly in Asian session, after release of poor service sector data, and on the back of risk aversion. AUD/JPY's break of 92.11 temporary low confirms down resumption of decline from 99.32. Near term outlook will stay bearish as long as 94.52 resistance holds, even in case of recovery. Next target is 90.51 support first.
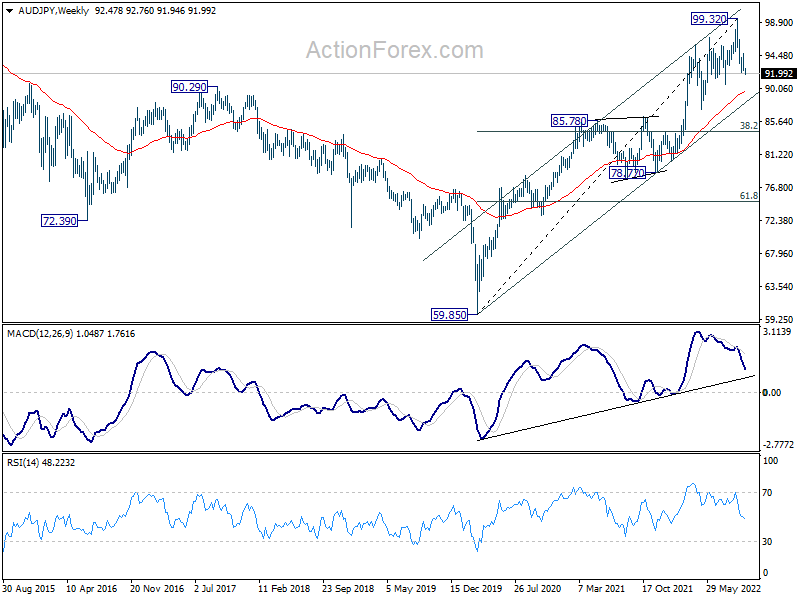
For now, it's unsure whether fall from 99.32 is corrective the up trend from 78.77 only, or that from 59.85. Reaction to 55 week EMA (now at 89.60) should reveal which case it is. In the bearish case, AUD/JPY could fall further to 38.2% retracement of 59.85 to 99.32 at 84.24 before bottoming.
Technical Outlook and Review
USD/JPY:
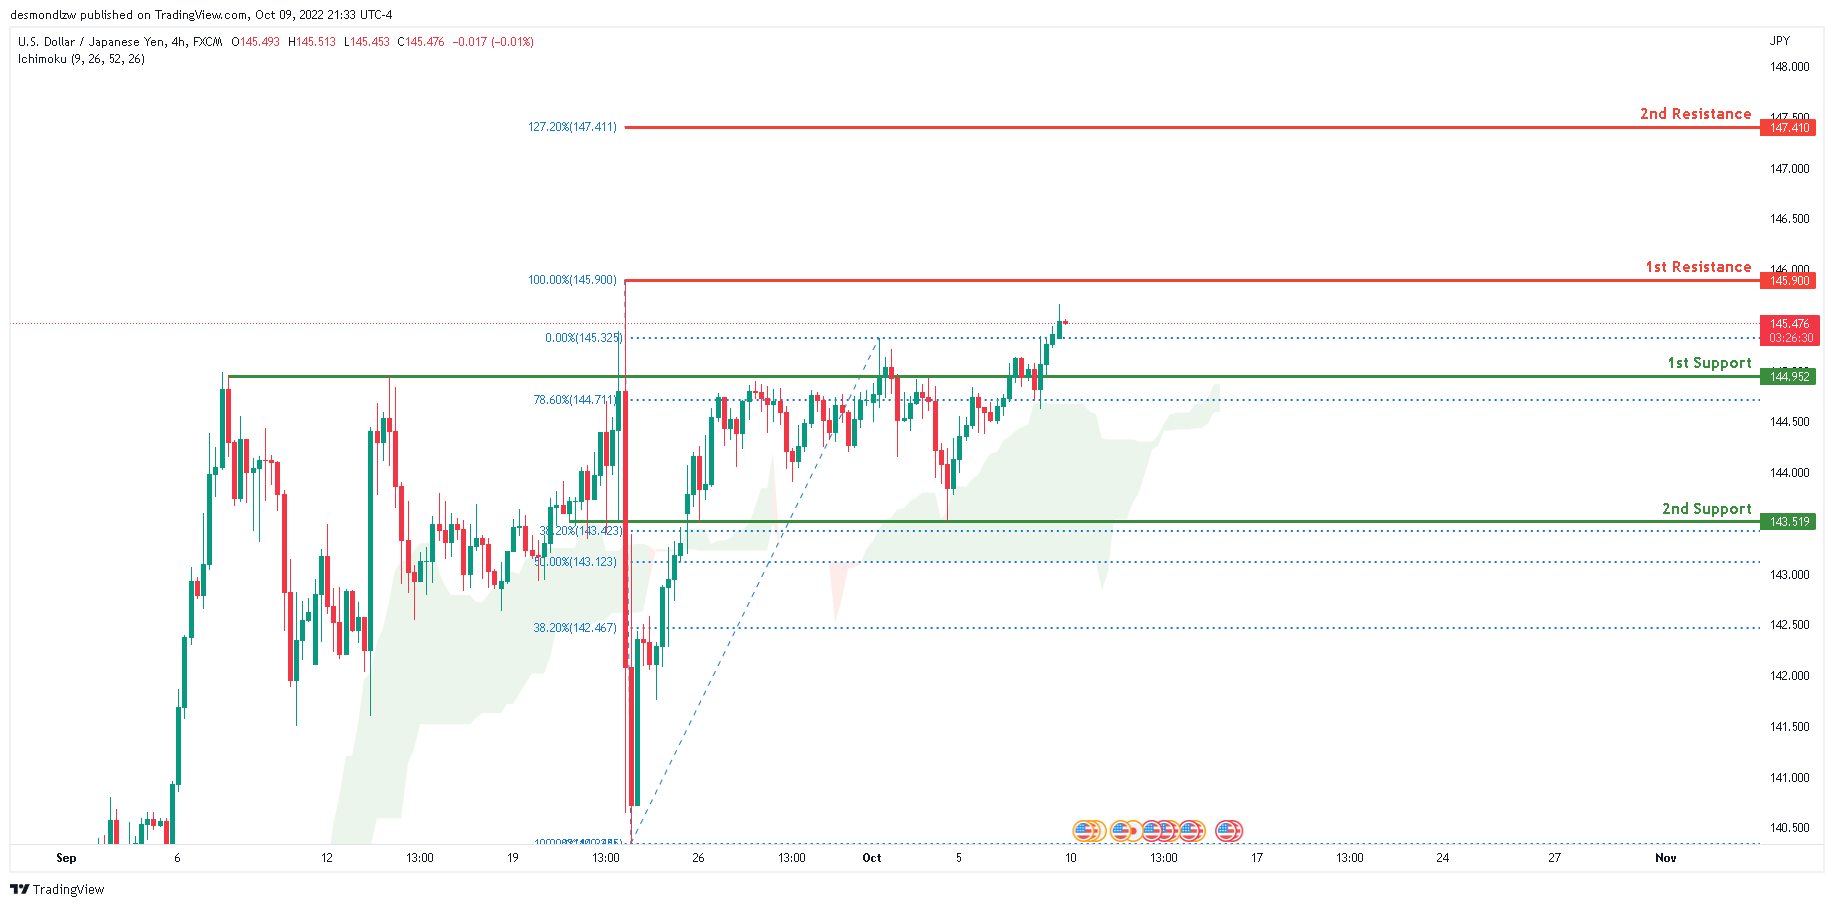
Price is in a bullish trend on the H4 chart. To add to this bias, the price is above the Ichimoku cloud, indicating a bullish trend. Price closed above the first support level at 144.952, which is also the key 145 level. Price is expected to go towards the first resistance level around 145.900, where the 100% Fibonacci line is placed.
Areas of consideration:
- H4 time frame, 1st resistance at 145.900
- H4 time frame, 1st support at 144.952
DXY:
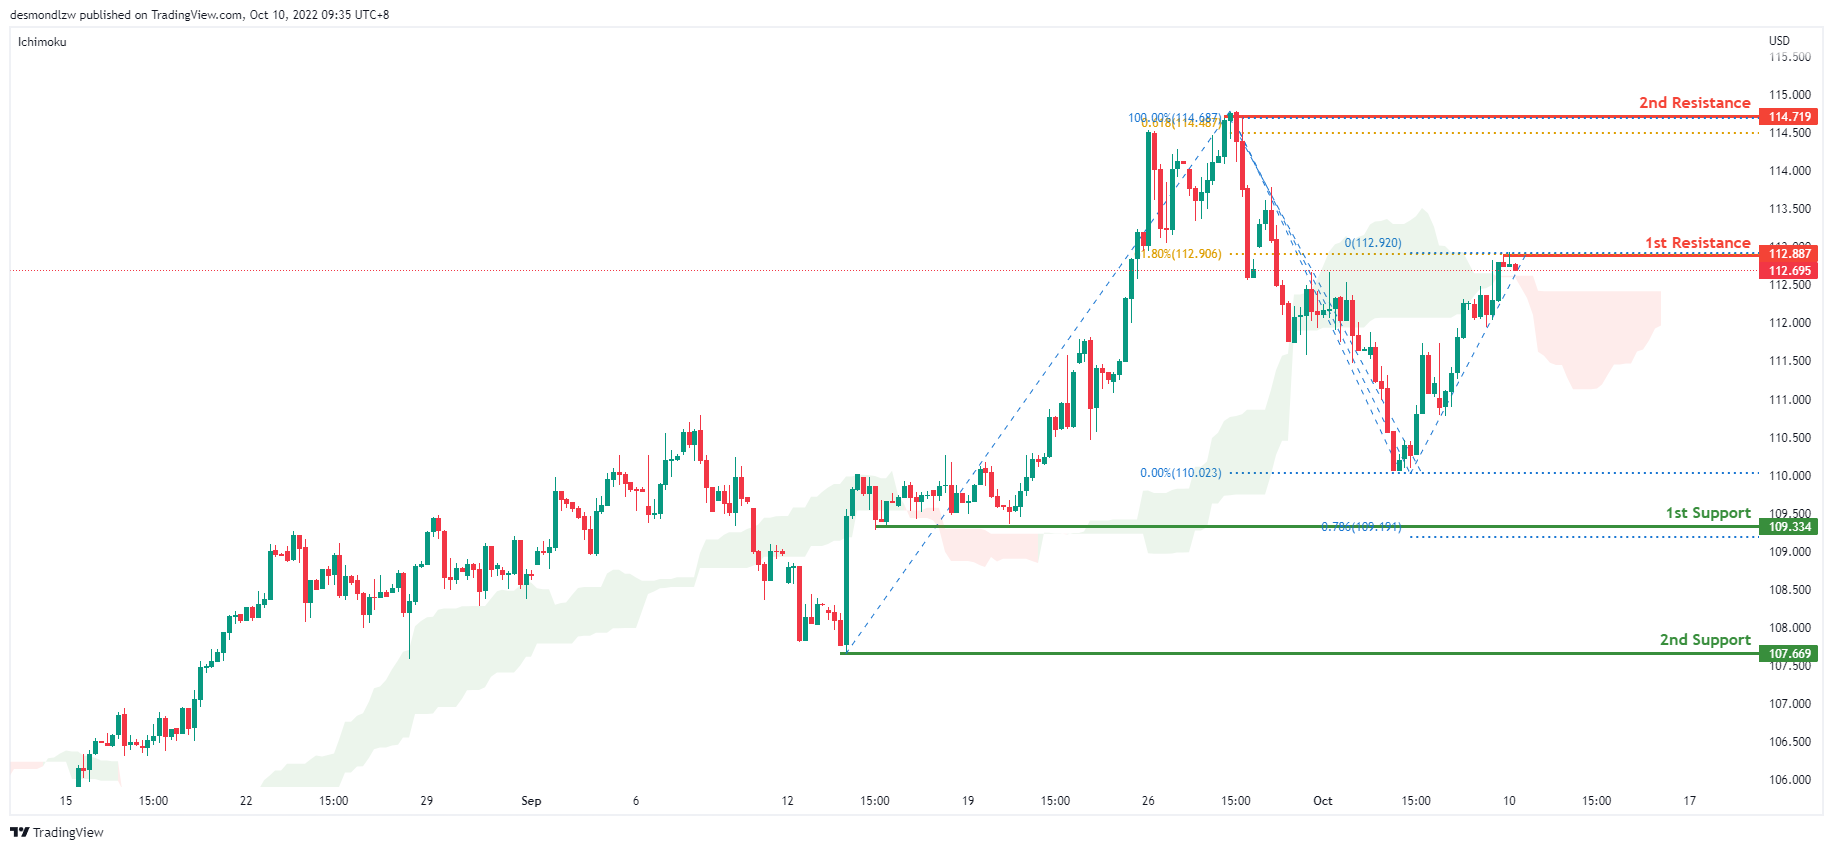
On the H4 chart, prices are moving in an ascending trend signalling slight bullish momentum. It is currently testing the first resistance at 112.887 where the 61.8% retracement sits. If it breaks this level, price will move to the second resistance at 114.719 where the previous swing high sits. Alternatively, prices could test the first support at 109.334 where the 78.6% projection sits and if it breaks this level, bearish momentum will bring price to secdon support at 107.669
Areas of consideration:
- H4 time frame, 1st resistance at 112.887
- H4 time frame, 1st support at 109.334
EUR/USD:
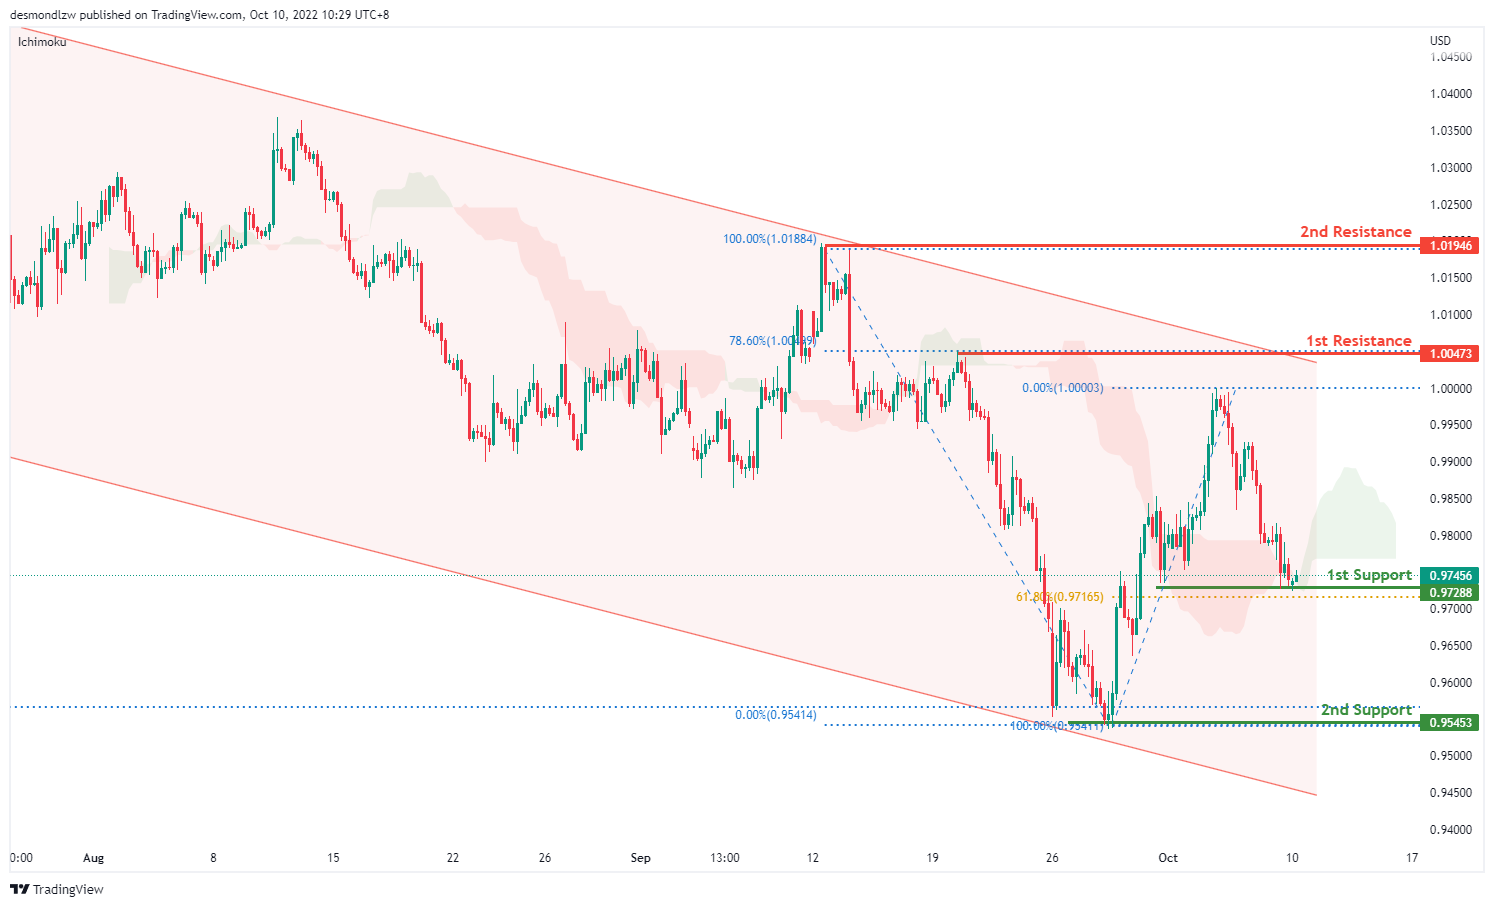
On the H4, price is moving within the descending trendline in a descending manner, with the price moving below ichimoku cloud,- we are bearish biased. Price is testing the first support at 0.9728 where the 61.8% retracement sits. If it breaks this level, bearish momentum will bring price to the second support at 0.9545 where the swing low and 161.8% extension sit. Alternatively, price may test the first resistance at 1.0047 where the 78.6% retracement sits. If price breaks this level, it may test the second resistance at 1.0194, where the previous swing high sits
Areas of consideration :
- H4 1st resistance at 1.0047
- H4 2nd resistance at 1.0194
GBP/USD:
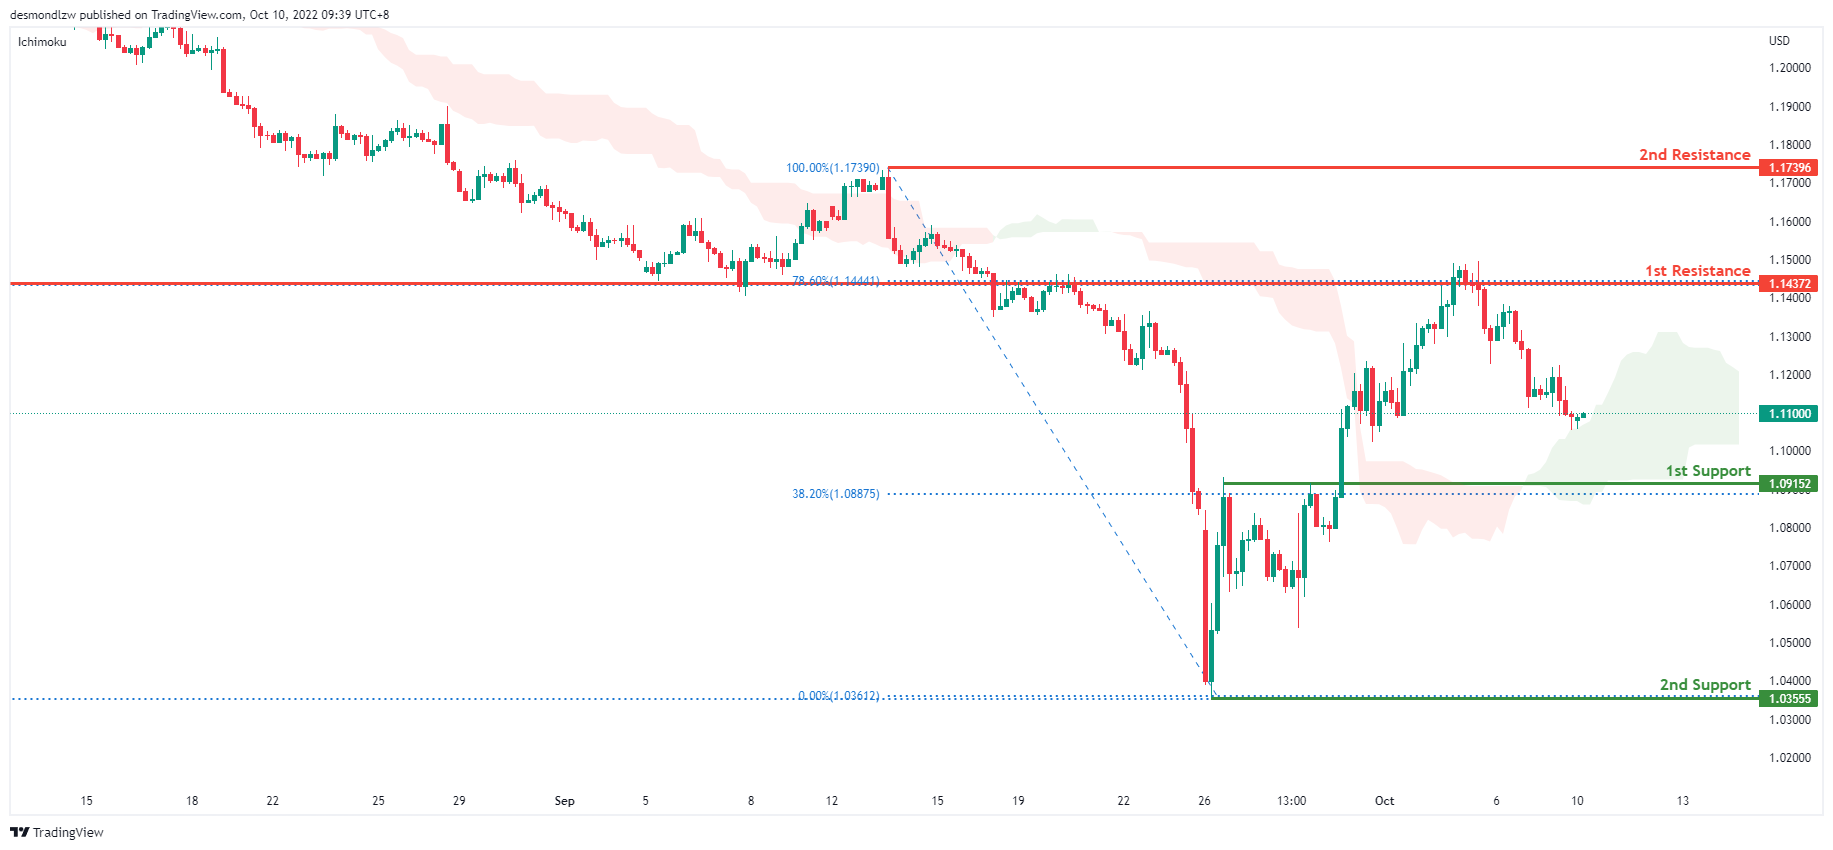
On the H4, price has rejected the first resistance and is moving in a descending trend hence we are bearish bias- price might break the ichimoku to test the first support at 1.0915 where the 38.2% retracement sits. If it breaks this level, bearish momentum will bring price to the second support at 1.0055 where the previous swing low sits. Alternatively price can test the first resistance at 1.1437 where the 78.6% retracement and overlap resistance sit. Subsequently the second resistance at 1.1739
Areas of consideration:
- H4 1st support at 1.0915
- H4 1st resistance at 1.1437
USD/CHF:
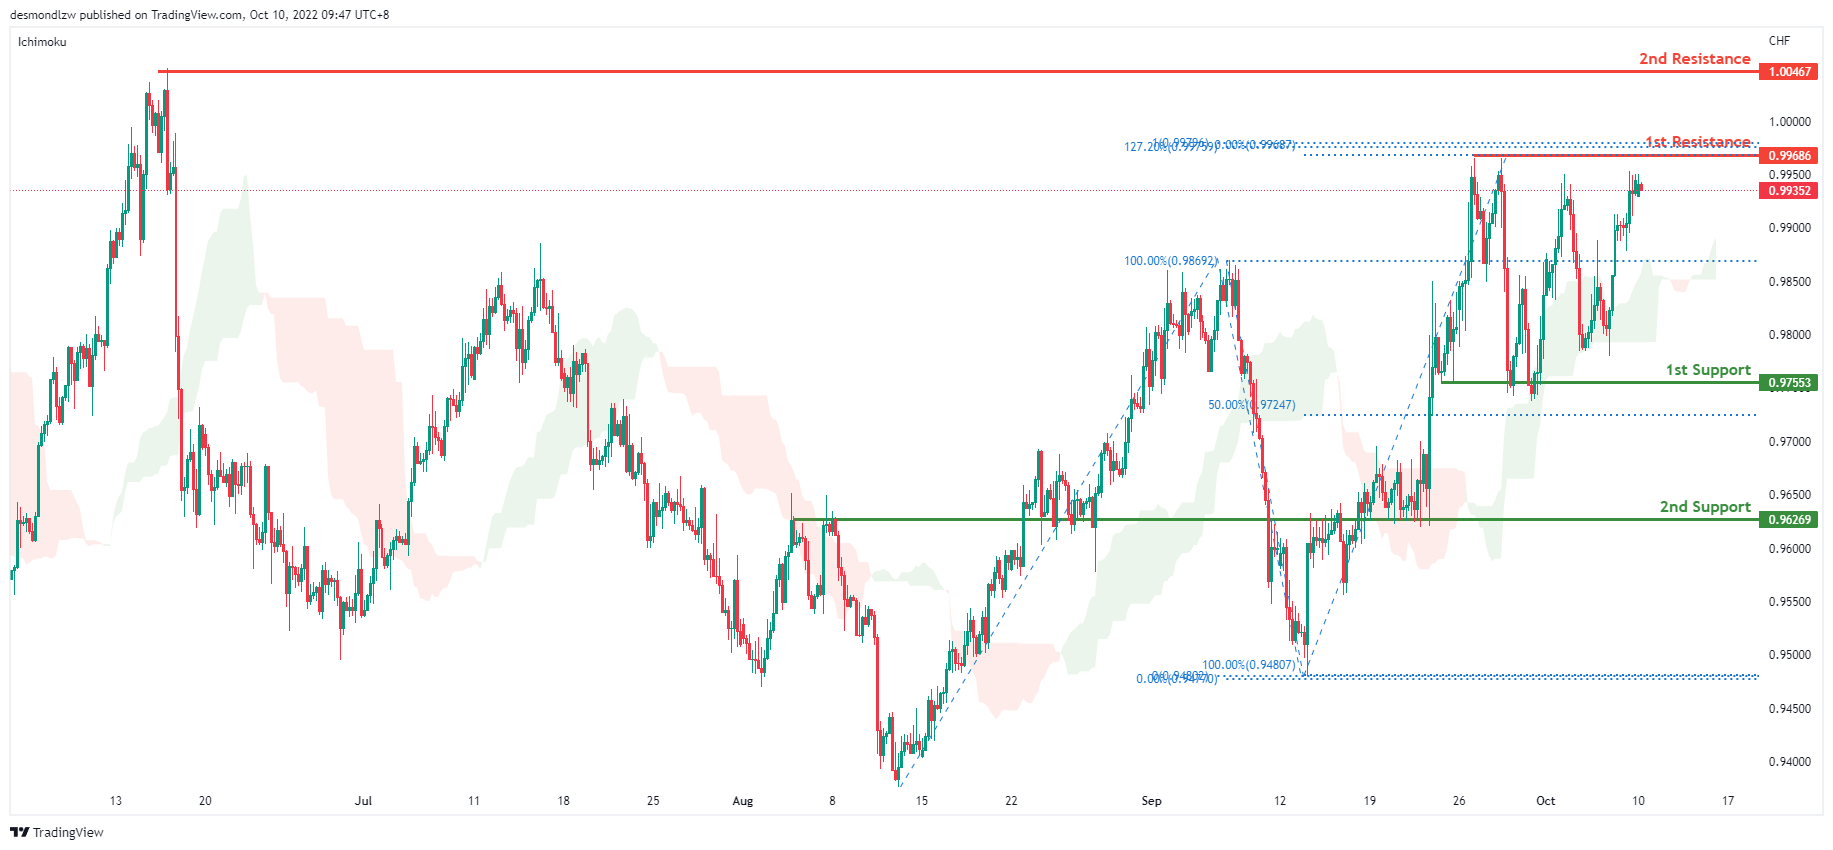
USDCHF is in a strong bullish trend on the H4 chart. Price is trading above the Ichimoku cloud signaling a bullish trend. Price look like its moving toward the first resistance 0.9968 where the 127.2% extension and previous swing high sit. If it breaks this level, bullish momentum will bring price to the second resistance at 1.0046 where the previous swing high sit. Alternatively price can test the first support at 0.9755 where the swing low sits then the second support at 0.9626 where the overlap support sits
Areas of consideration
- H4 1st support at 0.9755
- H4 1st resistance at 0.9968
XAU/USD (GOLD):
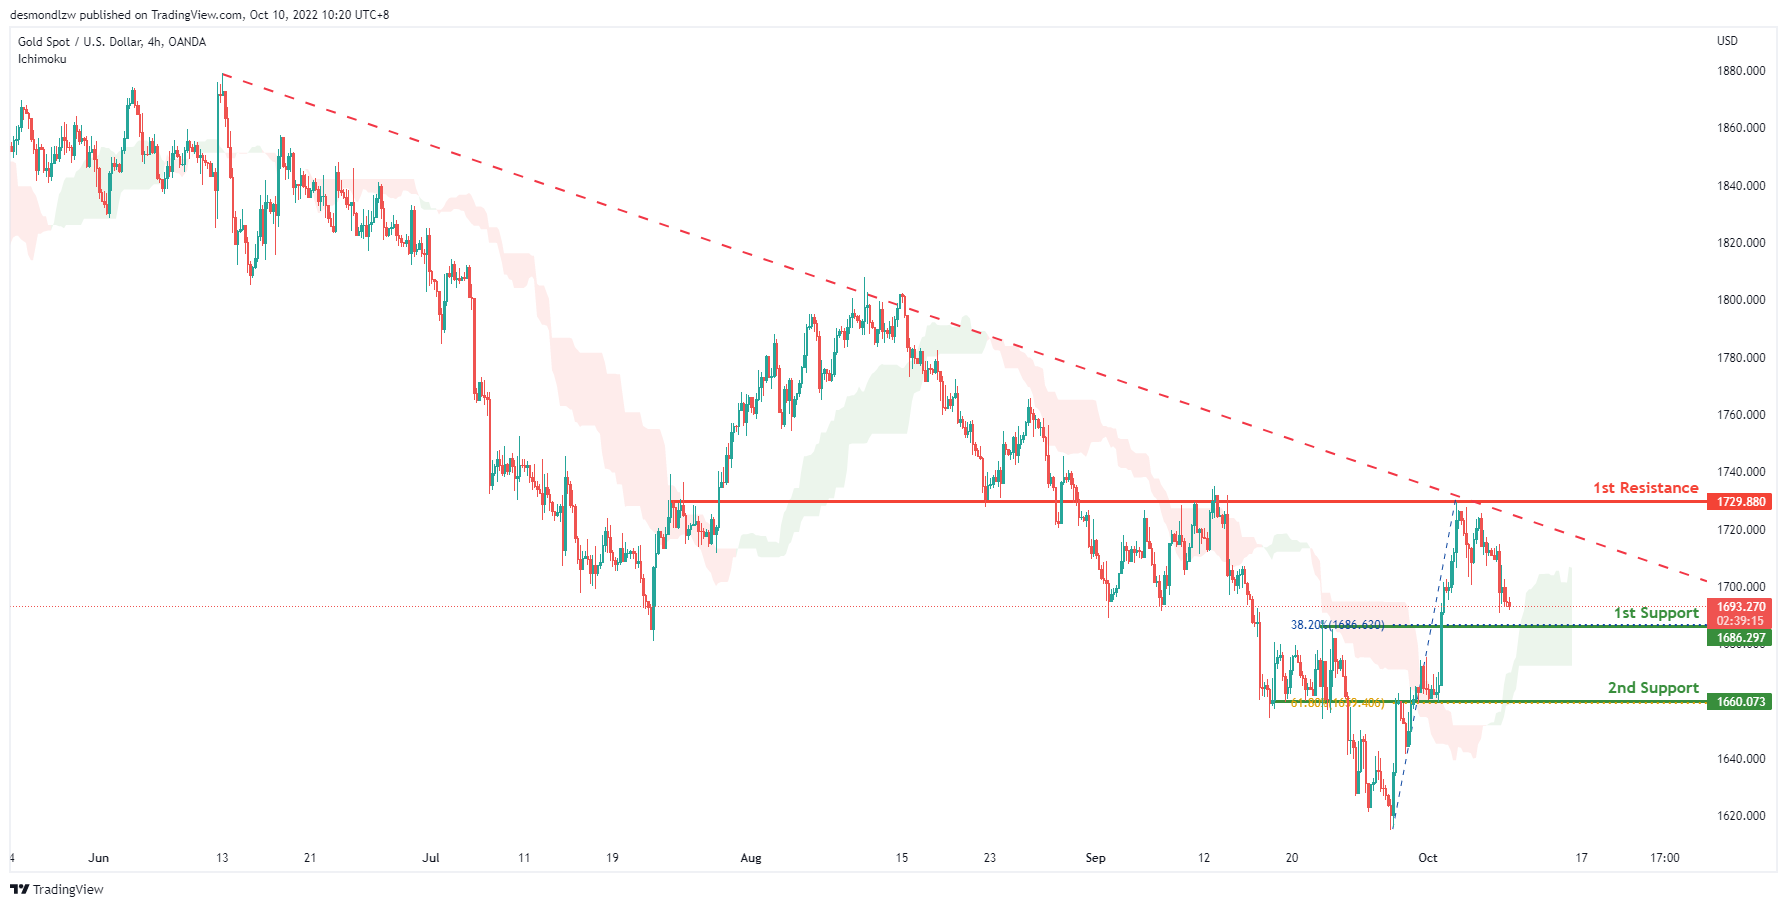
On the H4, price is dropping from 1st resistance, as the price is below long term descending trendline, we can expect the price to test the 1st support at 1686.297, which is in line with the 38.2% fibonacci retracement and previous swing high. If the 1st support is broken, the 2nd support is at 1660.073, where the previous swing lows and 61.8% fibonacci retracement sits. Alternatively, as the price is above ichimoku cloud, we can expect the price to rise to the 1st resistance at 1729.880, where the overlap resistance is.
Areas of consideration:
- H4 time frame, 1st support at 1686.297
- H4 time frame, 2nd support at 1660.073
AUD/USD:
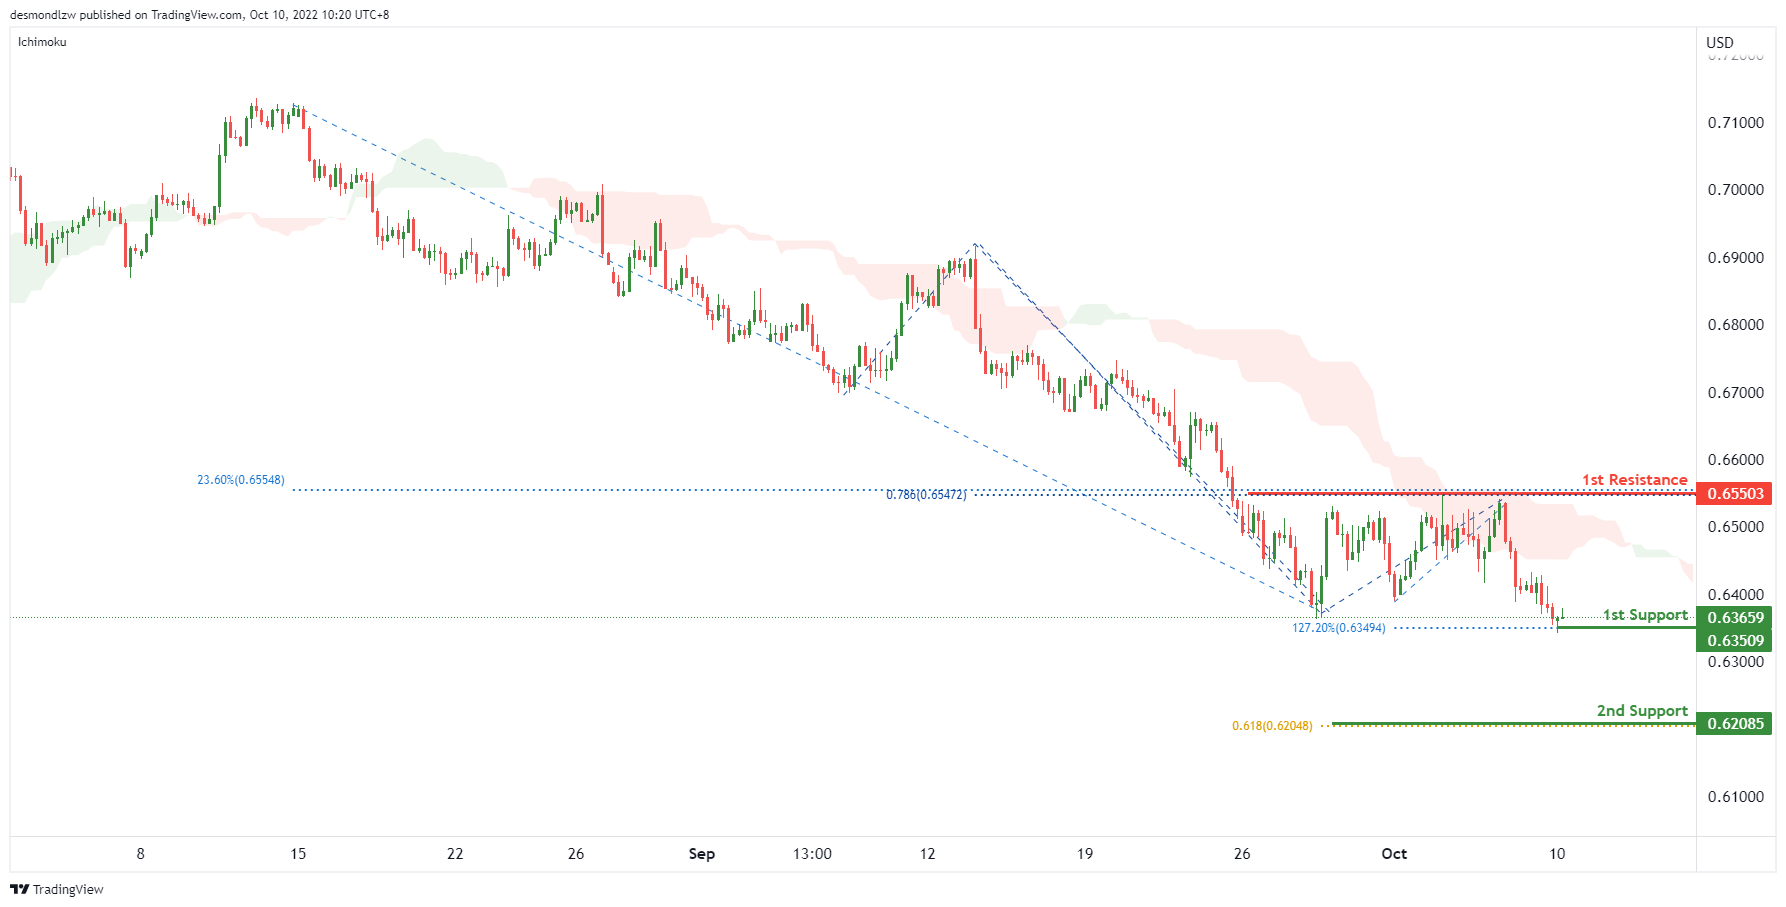
On the H4, the price is bouncing off from the 1st support at 0.63509, which is in line with the swing low and 127.2% fibonacci extension. The price may rise from the 1st support and test the 1st resistance at 0.65503, where the previous swing high, 23.6% fibonacci retracement and 78.6% fibonacci projection are. Alternatively, as the price is below ichimoku cloud, the price may break the 1st support and drop to the 2nd support at 0.62085, which is in line with the 61.8% fibonacci projection.
Areas of consideration
- H4, 1st support at 0.63509,
- H4, 1st resistance at 0.65503
NZD/USD:
On the H4, the price bounced off from the 1st support at 0.55942, which is in line with the swing lows. The price may rise to test the 1st resistance at 0.57384, which is in line with the previous swing highs and 61.8% fibonacci retracement. Alternatively, as the price is below ichimoku cloud, the price may break the 1st support and drop to the 2nd support at 0.55396, which is in line with the 127.2% fibonacci extension.
Areas of consideration:
- H4 time frame, 1st support at 0.55942
- H4 time frame, 1st resistance at 0.57384
USD/CAD:
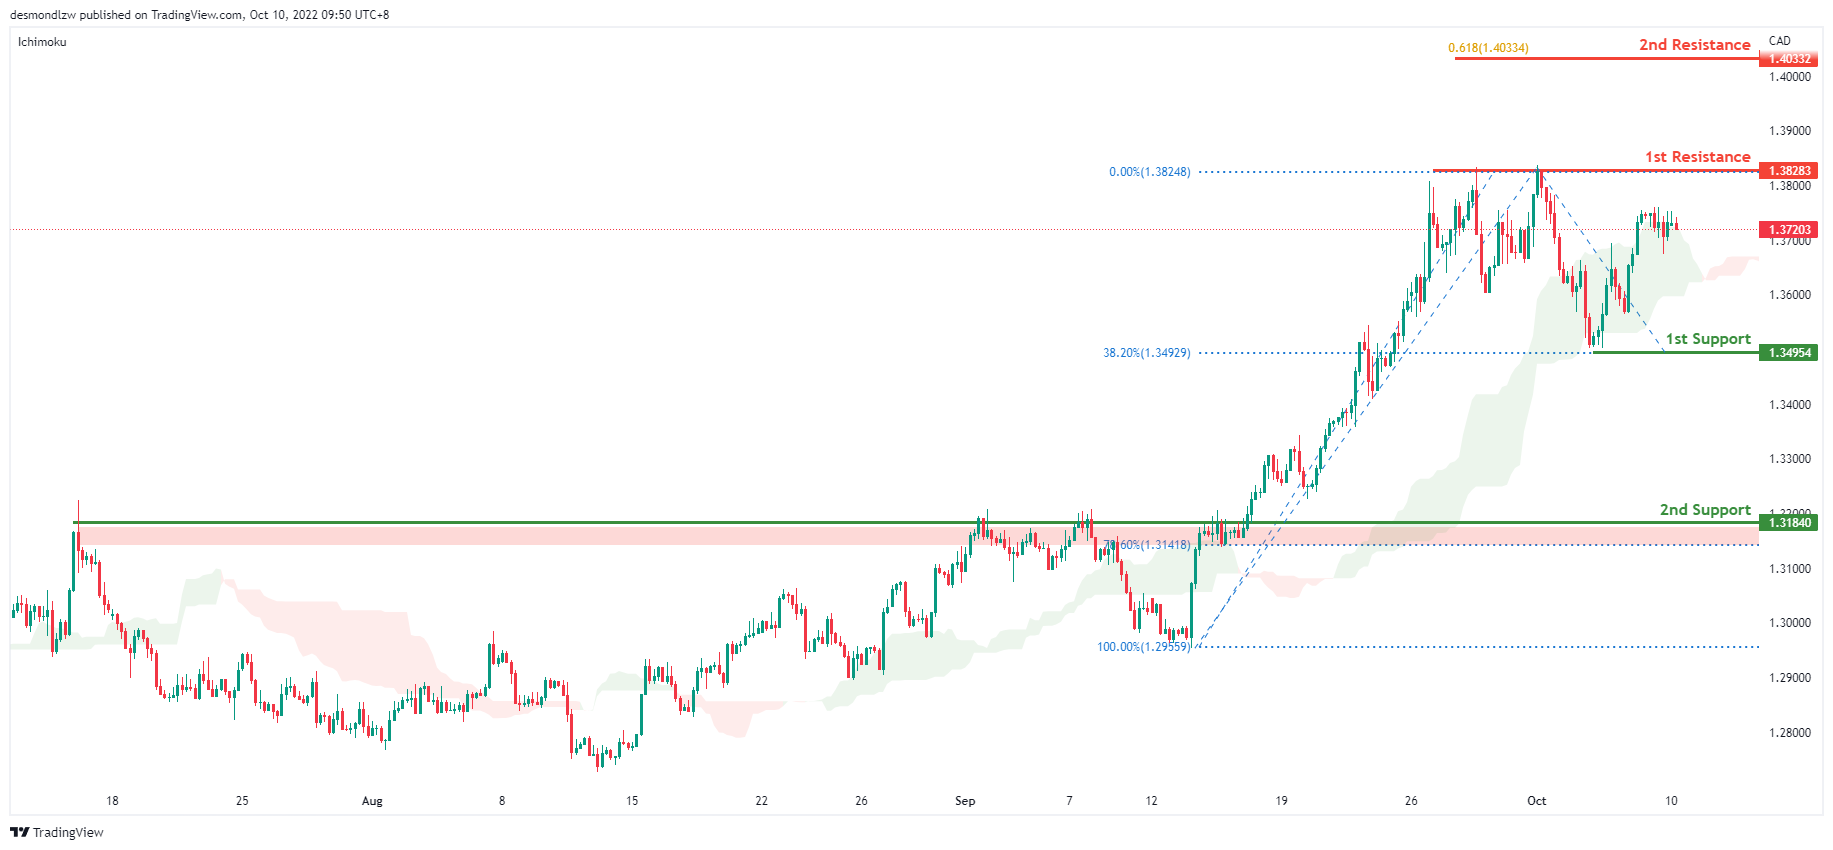
On the H4, the price trades higher near the 1st resistance of 1.3832 which is the previous swing high level. With the price trading above the ichimoku cloud, we have a short term bullish bias. The price could break the first resistance to test the second resistance at 1.4033 where the 61.8% projection sits. Alternatively it could fall to the 1st support at 1.3495 which is in line with the 38.2% retracement level and the previous swing low subsequently the second support at 1.3184 where the overlap support sits
Areas of consideration:
- H4 time frame, 1st resistance at 1.3828
- H4 time frame, 1st support at 1.3495
OIL:
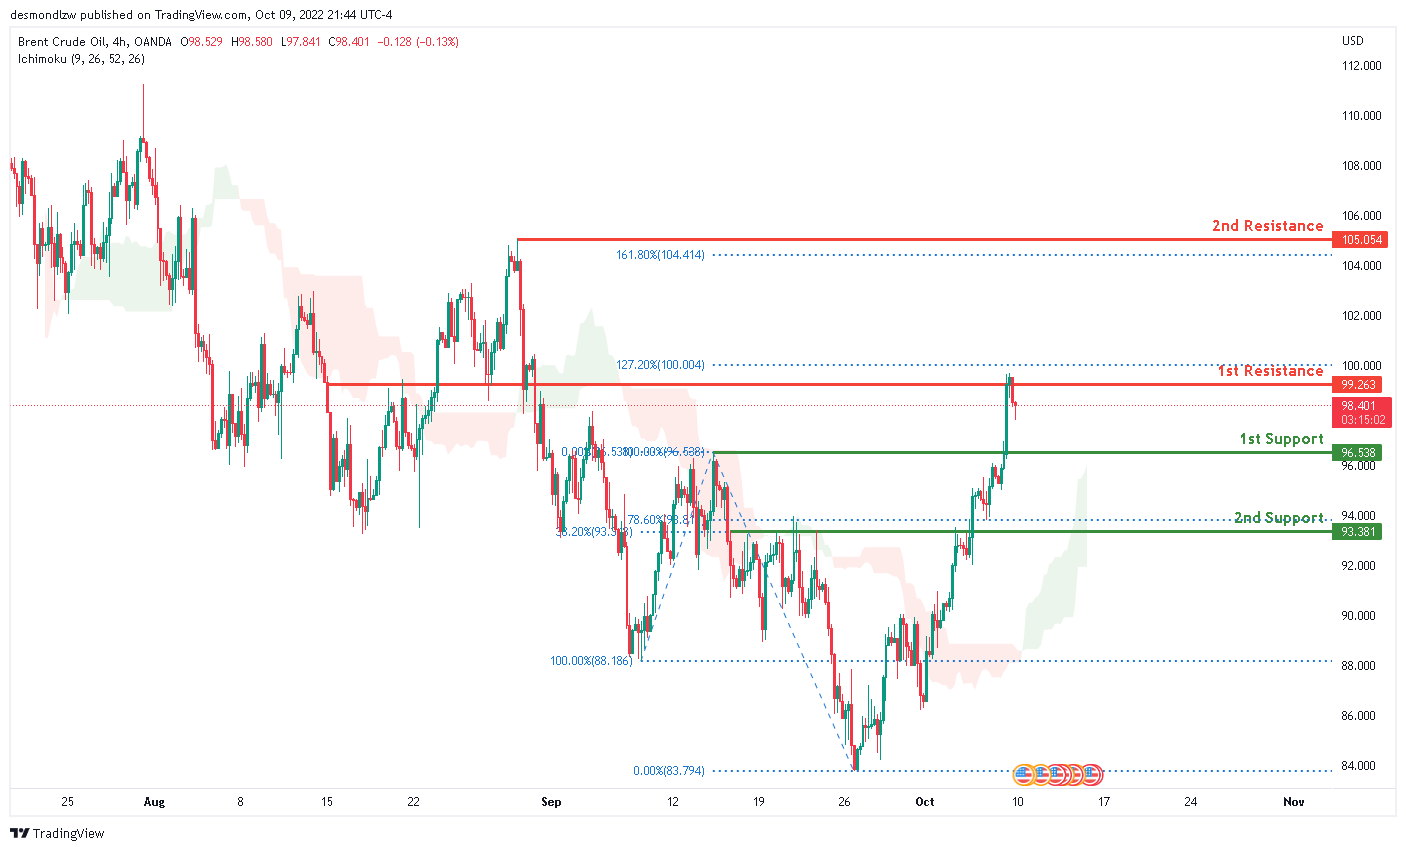
Oil is in a bearish trend on the H4 chart. However, the price started to rise a week ago and is now above the Ichimoku cloud, indicating that the market has entered a medium-term bullish trend. Price has closed above the first support level at 96.538, which contains the 100% Fibonacci and 0% Fibonacci lines. Price has also struck the first resistance level at 99.263 (the 127.2% Fibonacci line) and reflected back downwards. If the bullish momentum continues, price will close above the first resistance and move toward the second resistance, which is positioned at 105.054, where the 161.8% Fibonacci line is located.
Areas of consideration:
- H4 time frame, 1st resistance at 99.263
- H4 time frame, 1st support at 96.538
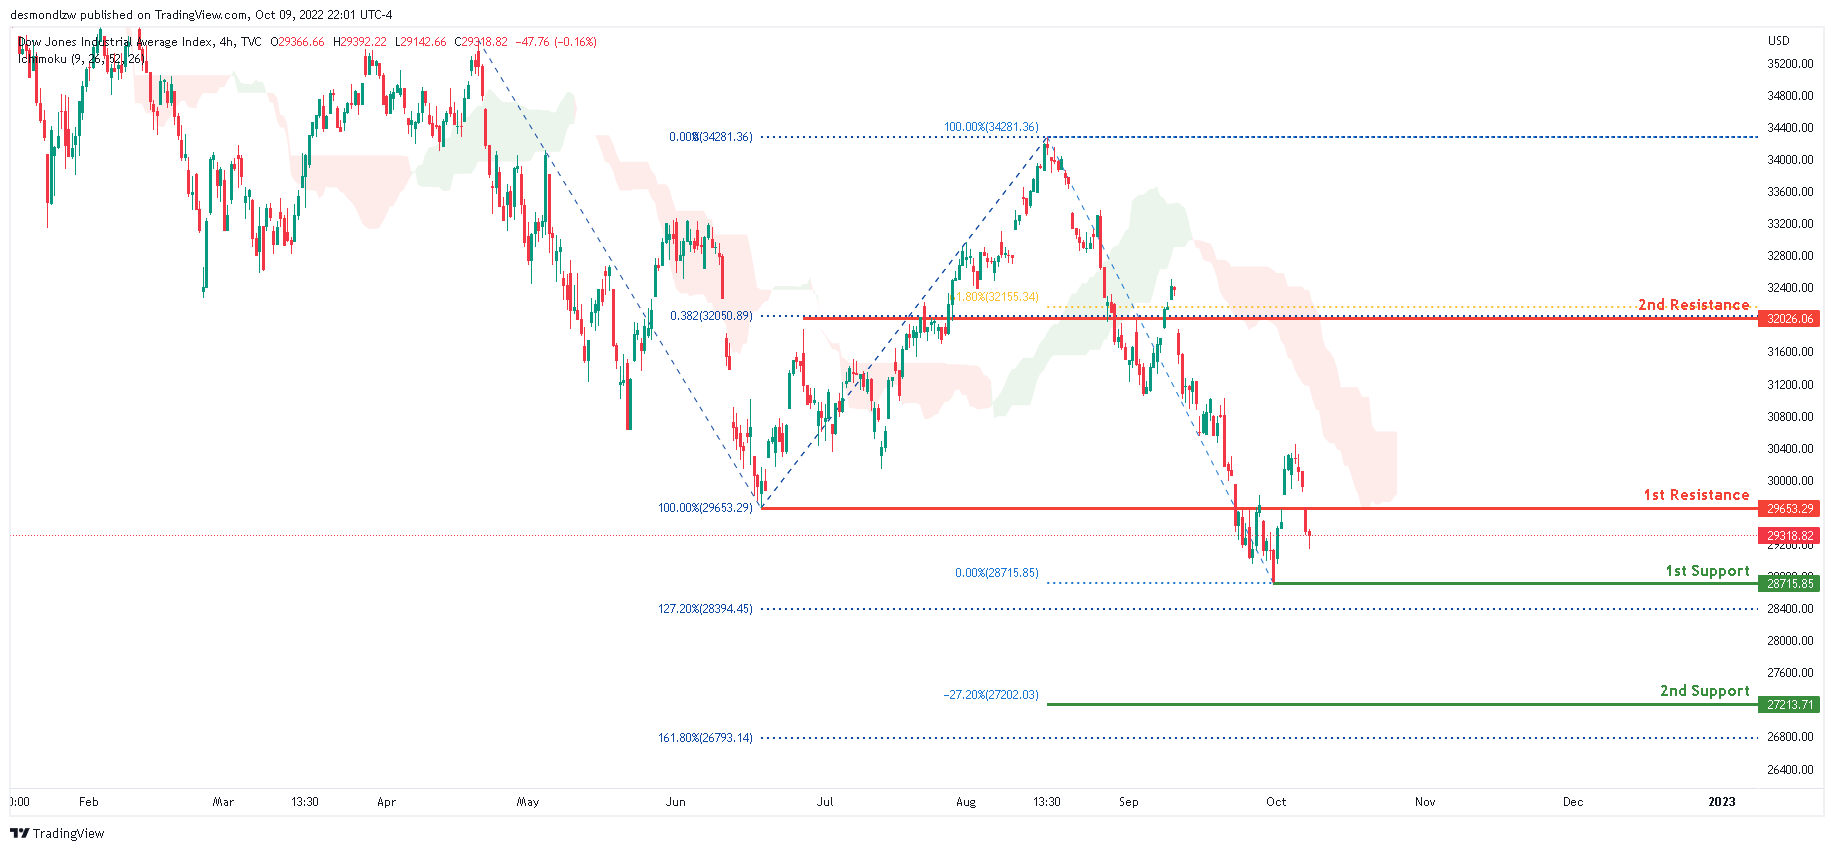
Dow Jones Industrial Average:
DJI is in a strong bearish trend on the H4 chart. To add to this bias, the price is below the Ichimoku cloud, indicating a bearish market. Price has closed below the first resistance level of 29653.29, which contains the 100% Fibonacci line and the last swing low. If the bearish momentum continues, price will move towards the first support level around 28715.85, which contains the 0% Fibonacci and 127.2% Fibonacci extension lines.
Areas of consideration:
- H4 time frame, 1st support at 28715.85
- H4 time frame, 1st resistance at 29653.29
DAX:
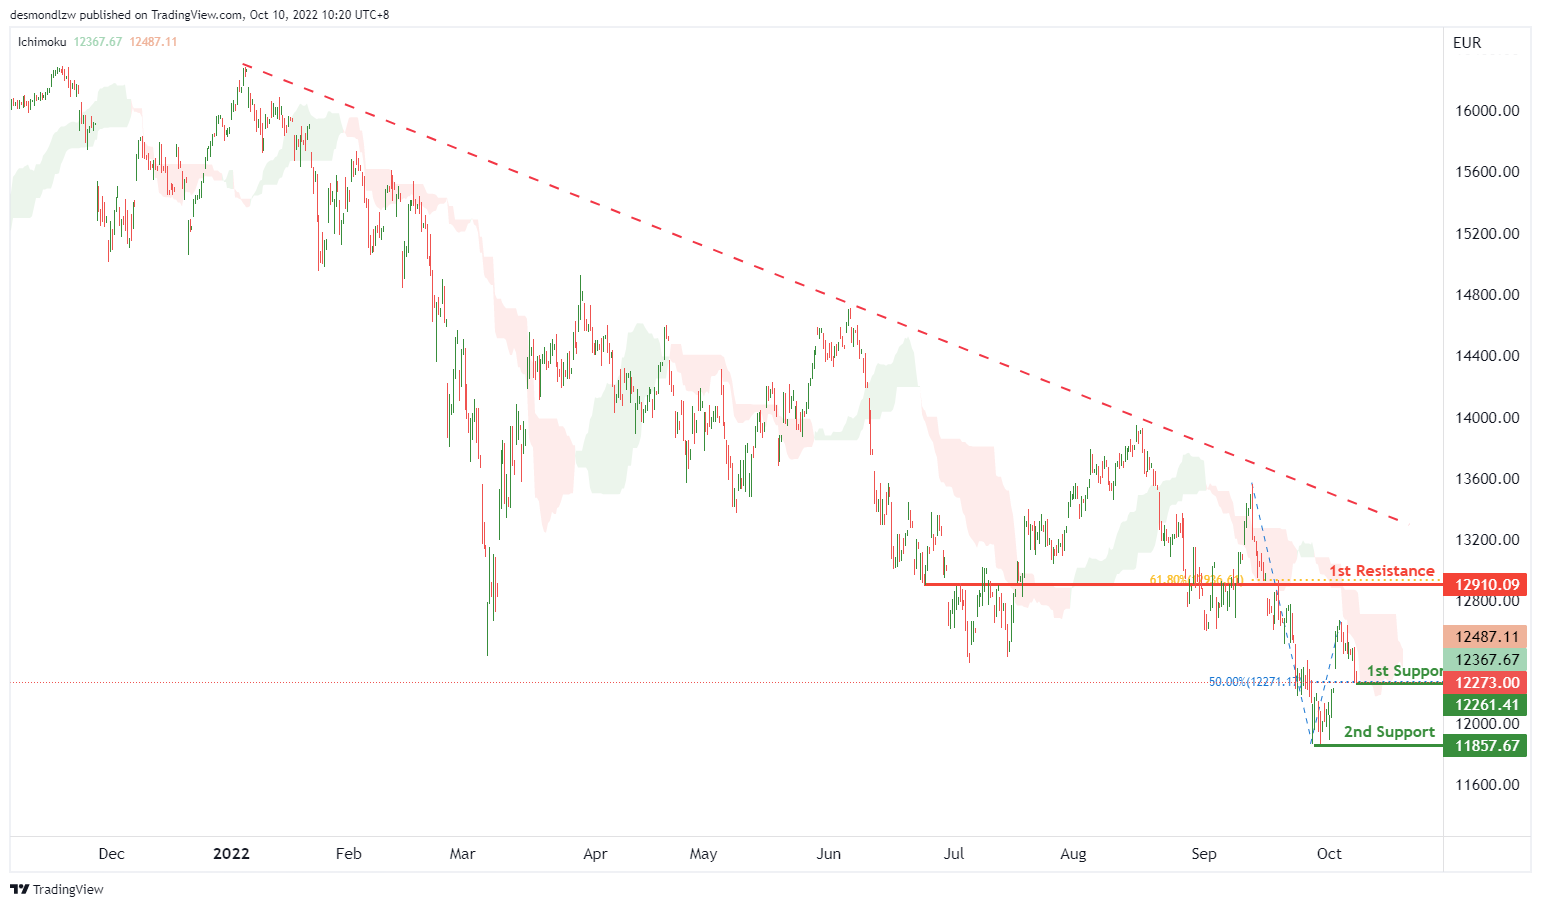
On the H4, with the price moving below ichimoku cloud and long term descending trendline, we have a bearish bias that the price may break the 1st support at 12261.41, which is in line with the 50% fibonacci retracement. If the 1st support is broken, the 2nd support could be at 11857.67, which is in line with the swing low. Alternatively, the price may rise to the 1st resistance at 12910.09, which is in line with the 61.8% fibonacci retracement.
Areas of consideration:
- H4 time frame, 1st support at 12261.41
- H4 time frame, 2nd support at 11857.67
ETHUSD:
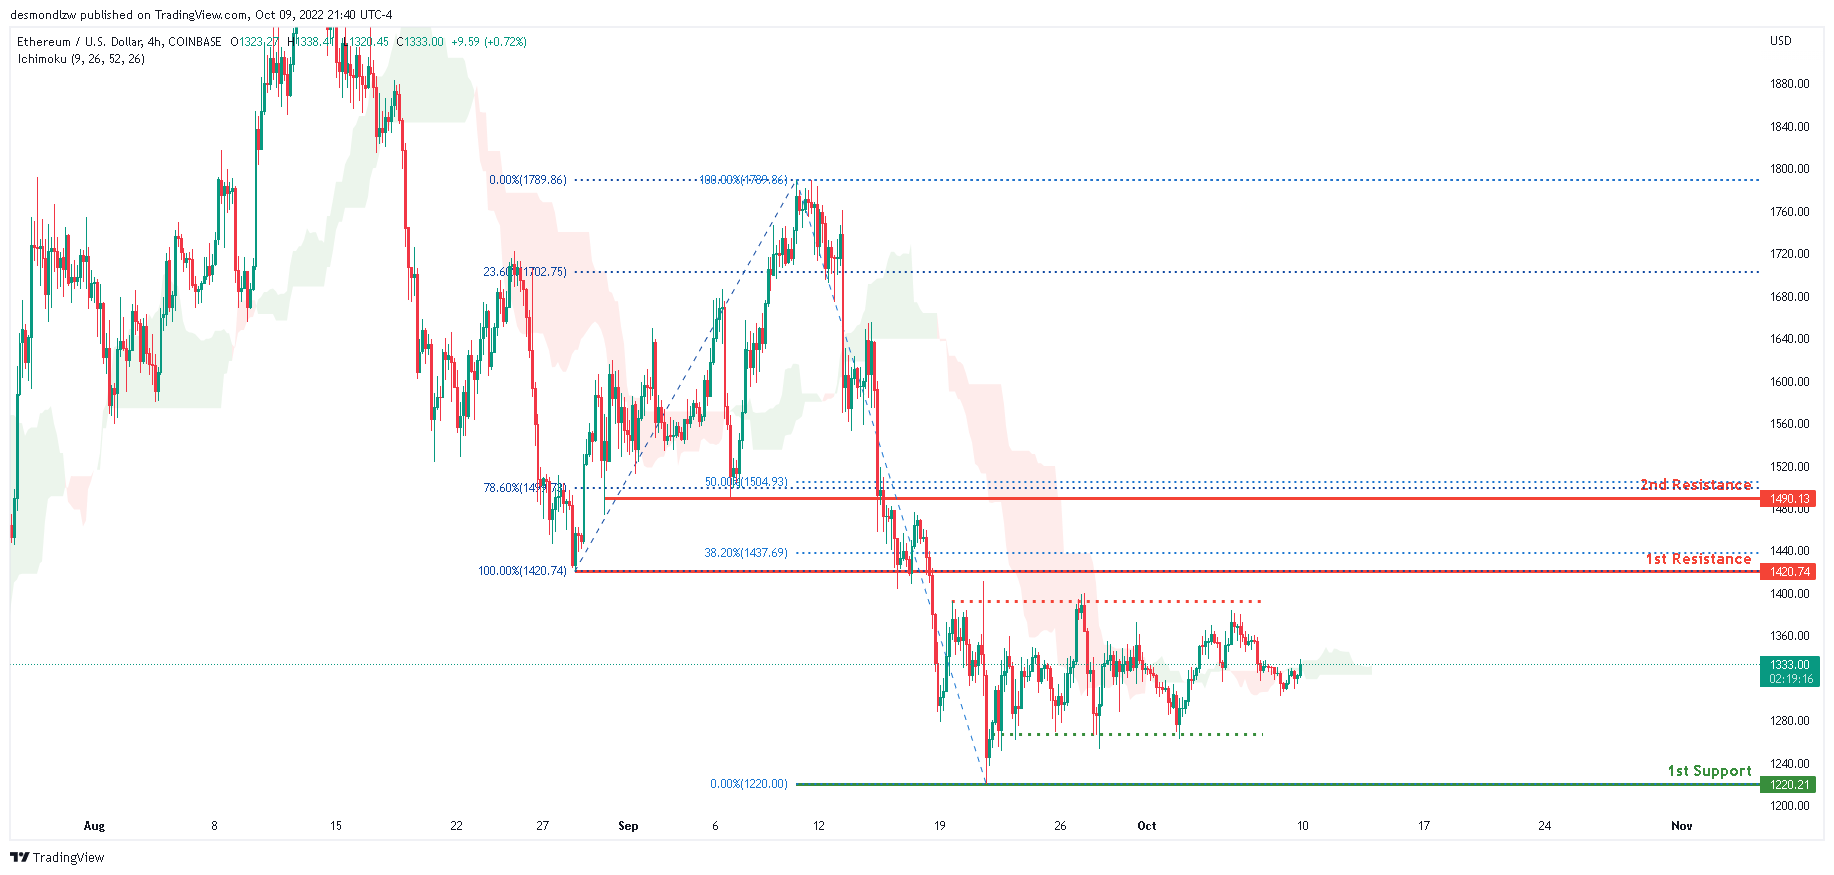
Price is in a bearish trend on the H4 chart. Price closed below the first resistance level at 1420.74, which is also the location of the 100% Fibonacci line and the prior swing low. For the previous four weeks, price has been consolidating between the first support, where the 0% Fibonacci line is placed, and the first resistance. Price is expected to remain consolidating between these levels, with no apparent indicators of direction.
Areas of consideration:
- H4 time frame, 1st resistance of 1420.74
- H4 time frame, 1st support at 1220.21
BTCUSD:
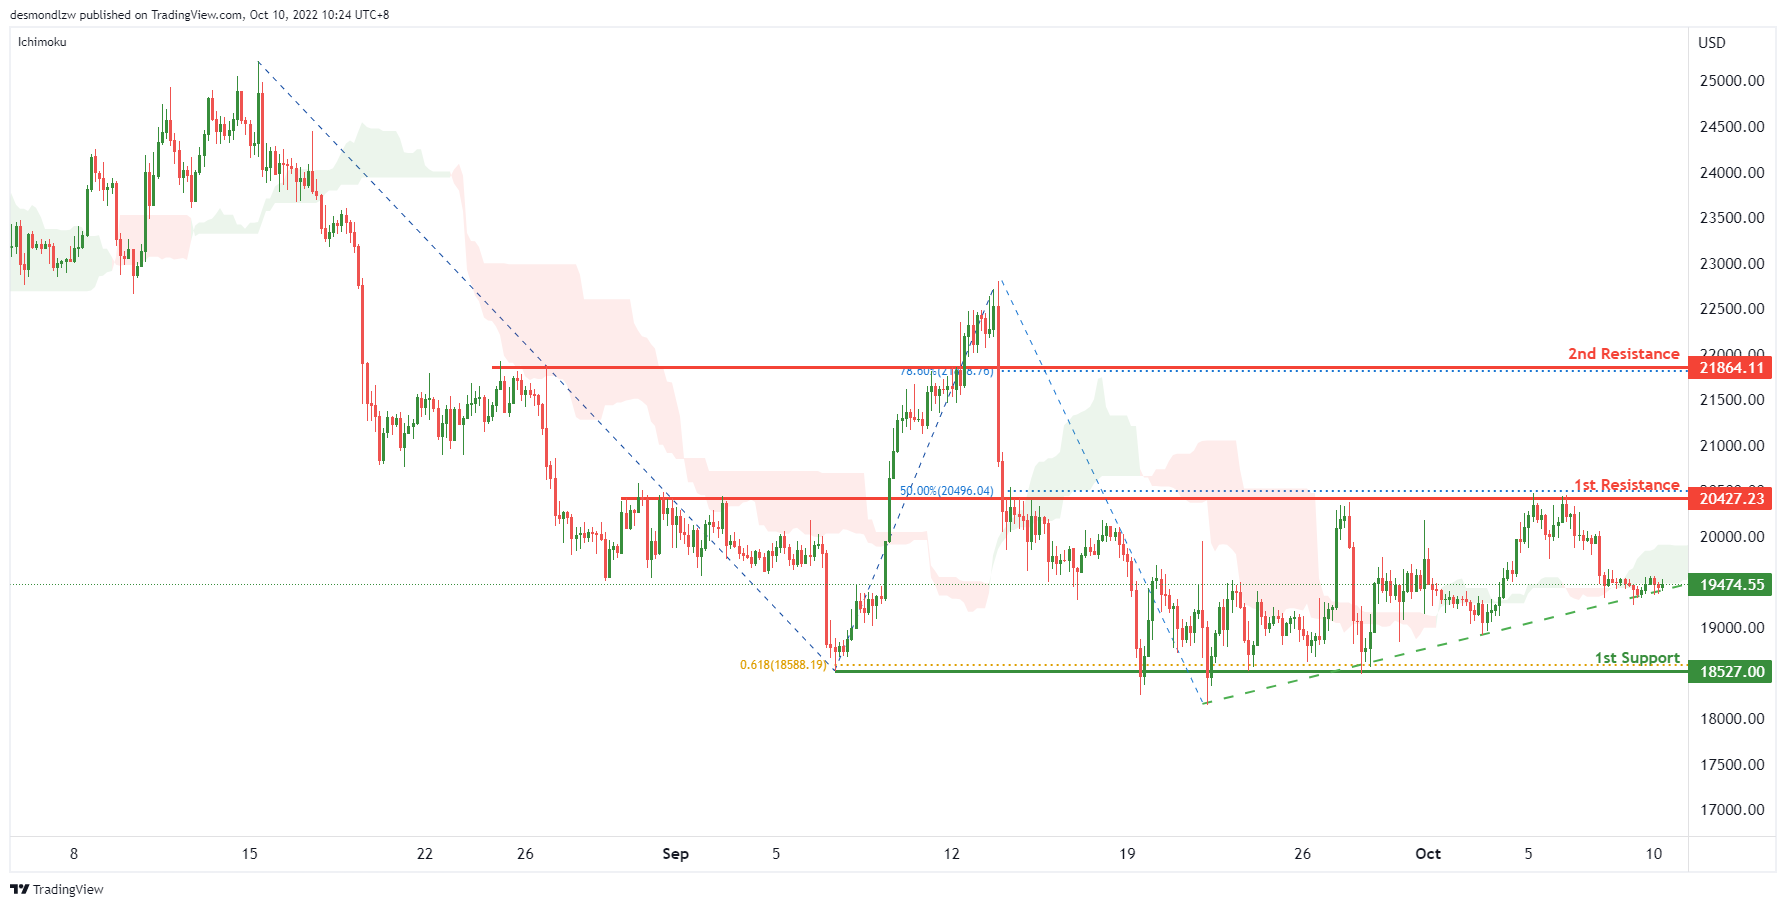
On the H4, price is showing a short term ascending trendline and crossing the ichimoku cloud, we can expect the price rise to test the 1st resistance at 20427.23, where the overlap resistance and 50% fibonacci retracement are. If the 1st resistance is broken, the next resistance could be at 21864.11, which is in line with the 78.6% fibonacci retracement. Alternatively, the price may pull back from the 1st resistance and drop to the 1st support at 18527, which is in line with the swing lows and 61.8% fibonacci projection.
Areas of consideration:
- H4 time frame, 1st resistance at 20427.23
- H4 time frame, 2nd resistance at 21864.11
S&P 500:
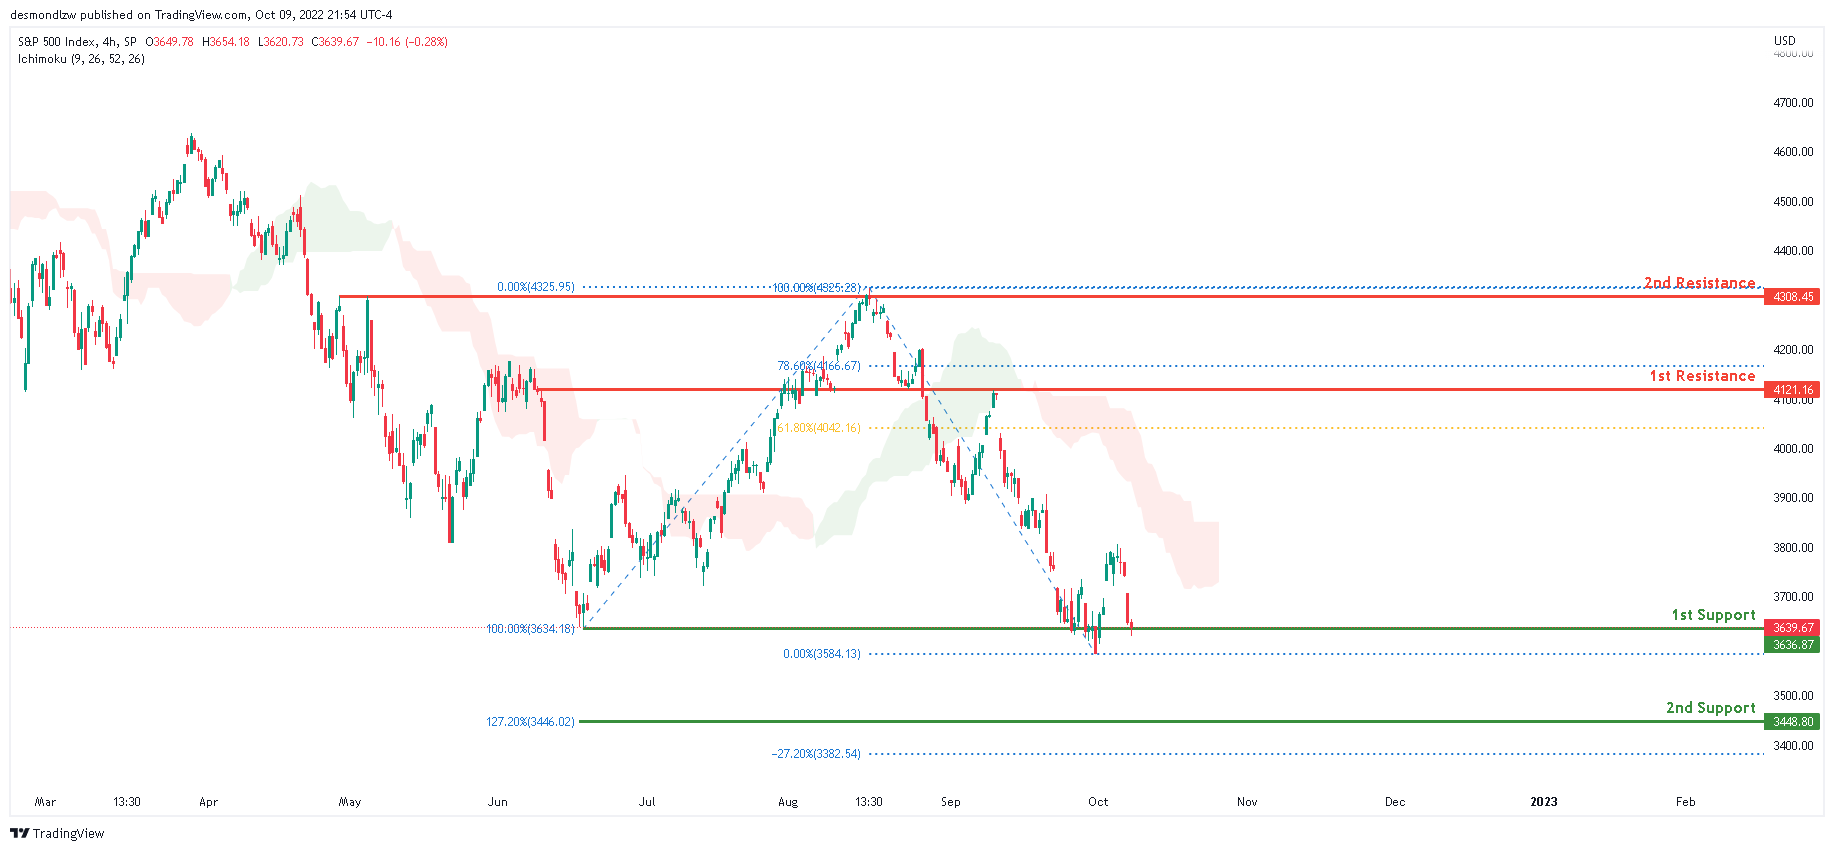
The S&P500 is in a strong bearish trend on the H4 chart. In addition, the price is below the ichomoku cloud, indicating a bearish market. Price is currently resting along the first support at 3636.87, which is also the location of the 100% Fibonacci line and the last swing low. If the bearish momentum continues, price will fall below the first support and move towards the second support at 3448.80, which contains the 127.2% Fibonacci extension line and the -27.2% Fibonacci expansion line.
Areas of consideration:
- H4 time frame, 1st support at 3636.87
- H4 time frame, 2nd resistance at 3448.80
Forex and Cryptocurrency Forecast
EUR/USD: It's Getting Worse in the EU, It's Getting Better in the US
EUR/USD updated another 20-year low on September 28, bottoming at 0.9535. This was followed by a correction, and the pair came close to the parity level on Tuesday, October 04, rising to 0.9999. However, the happiness of the bulls was short-lived, followed by another reversal to the south and the finish line at 0.9737.
Judging by the economic macro statistics, the advantage will remain on the side of the bears for a long time to come. According to the latest data, the index of business activity in the services sector (ISM) of the Eurozone fell from 49.8 to 48.8 points. A similar indicator in the US decreased as well, but much less: from 56.9 to 56.7, and at the same time it turned out to be higher than the forecast of 56.0 points.
Things are even worse in Germany: this locomotive of the region's economy, instead of pushing the pan-European train forward, began to pull it back. The service sector activity index sank from 47.7 to 45.0 points, while the Composite Index fell from 46.9 to 45.7 points.
The August data on trade in Germany also indicate serious problems. Imports increased by 3.4%, more than three times the forecast of 1.1%. As a result, the country's trade surplus fell from €3.4 billion to €1.2 billion.
This depressed state of the economy against the background of continuing inflation suggests the threat of stagflation in the Eurozone. The increase in energy prices adds to the negative. And it is likely to continue, as the OPEC + countries decided to seriously reduce oil production. Recall that these prices were one of the most powerful triggers for the global wave of inflation. Another negative factor is the proximity of the EU countries to the theater of Russian-Ukrainian military operations, especially since Russian President V. Putin constantly threatens to use nuclear weapons.
The situation in the US is much better, which contributes to the strengthening of the US currency across the board. The country is far from the Russian-Ukrainian front, and the oil and gas crisis does not threaten it. According to ADP, private sector employment rose by 208K in September, above market expectations of 200K. The number of new jobs outside the agricultural sector of the country (NFP) also turned out to be higher than expected: 263K against 250K, and unemployment in the US decreased from 3.7% to 3.5% over the month.
This situation in the labor market allows the Fed to continue to fight inflation, using the policy of quantitative tightening (QT) and raising the interest rate on the dollar. Atlanta Fed chief Rafael Bostic said the tightening cycle is "still at the very beginning" and warned against betting on a "reversal" soon. Similar statements were made by his colleague Mary Daly from San Francisco. What will actually happen to the rate will be known on November 2, when the next meeting of the FOMC (Federal Open Market Committee) of the US Central Bank will take place.
At the time of writing this review, on the evening of Friday October 07, the votes of the experts were distributed as follows. 50% of analysts say that the pair will continue to move south in the near future, another 30% expect it to move north, and the remaining 20% vote for a sideways trend. Among the trend indicators on D1, 40% are red, 25% are green and 35% are neutral gray. The picture is completely different among the oscillators: all 100% advise to sell the pair.
The immediate support for EUR/USD is at 0.9700-0.9725, followed by 0.9645, 0.9580 and finally the Sep 28 low at 0.9535. The next target of the bears is 0.9500. The resistance levels and targets of the bulls look like this: 0.9800-0.9825, 0.9900, the immediate task is to return to the range of 0.9950-1.0020, the next target area is 1.0130-1.0200.
As for the upcoming week, the publication of the minutes of the last FOMC meeting, as well as the speech of the head of the ECB, Christine Lagarde, will give food for forecasts on Wednesday, October 12. The following day, Thursday 13 October, will see data from the consumer market (CPI) in Germany, as well as from the consumer market and the US labour market. US retail sales, as well as the University of Michigan Consumer Confidence Index, will become known at the very end of the working week, on Friday, October 14.
GBP/USD: A Disservice for the British Pound
As a result of the shock collapse on September 23-26, the British pound almost reached parity with the dollar. After flying 860 pips, the pair landed at 1.0350, below the 1985 low.
Such a record head-down throw was provoked by British Finance Minister Kwasi Kwarteng, who, instead of the planned increase, announced a program to reduce the tax burden for citizens and legal entities of the country. That is, in the context of inflation, which exceeded 10% in July, and could rise to 14% by the end of the year, in the face of growing public debt and the problems that have accumulated since Brexit, the government decided to turn around and return to quantitative easing (QE) . Alas for a while, this was enough to knock down the national currency.
The Office of Budget Responsibility (OBR) estimates that this decision, along with previous support programs for the population and continued high energy prices, will lead to an increase in public debt from the current 96% to 320% of GDP over the next 50 years. The Parliament of the United Kingdom immediately talked about a vote of no confidence in the government of the country. Even the IMF flinched in surprise and lashed out at the British Cabinet. There is no need to talk about citizens: in anticipation of a further fall in the pound, they began to actively buy up gold and cryptocurrencies. New account openings have more than doubled, according to Bullion Vault, the London Bullion Market Association. A twofold increase in trading volumes for the BTC/GBP pair was also registered on crypto exchanges. In other words, what has been called a "disservice" since ancient times has happened.
The final chord of the week was set at 1.1079. According to strategists at ING, the largest banking group in the Netherlands, the current levels of the pound are unstable, given the instability of the bond market, the deterioration of the fiscal situation and the state of the UK current operations account. Therefore, they predict a return of GBP/USD below 1.1000. Their colleagues from MUFG Bank expect it to fall again to the lows of the last ten days of September. As for the median forecast, here the majority of analysts (55%) side with the bears as well. 15% expect the pound to strengthen, and 30% have taken a neutral position. All 100% of the oscillators on D1 point exactly south. But the picture is mixed among the trend indicators: 35% are colored red, the same amount is green, and the remaining 30% are gray. The nearest levels and support zones are 1.0985-1.1000, 1.0500-1.0740 and the September 26 low of 1.0350. In case the pair reverses to the north, the bulls will meet resistance at the levels of 1.1230, 1.1400, 1.1470, 1.1720, 1.1800 1.1960.
The event calendar can mark Tuesday, October 11, when UK unemployment data will be released. The head of the Bank of England, Andrew Bailey, will make a speech by the end of the same day.
USD/JPY: "Sharp Yen Movements Are Undesirable"
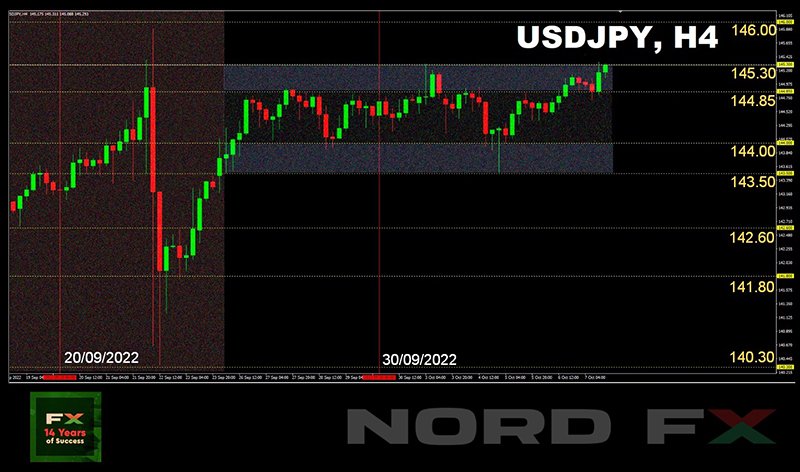
Recall that the experts' median forecast for USD/JPY looked more than uncertain two weeks ago. Then 45% of the experts sided with the bulls, 45% took the opposite position, the remaining 10% remained neutral. And this uncertainty has been fully confirmed: the pair has been moving in the side channel 143.50-145.30 since September 26, spending most of the time in an even narrower trading range of 144.00-144.85. The assault on the height of 146.00 has not happened. The strengthening of the yen, which bears hoped for after the Japanese Ministry of Finance ordered the Central Bank (BOJ), for the first time in 24 years, to intervene in support national currency, has not happened either.
A record amount of 2.8 trillion yen ($19.3 billion) was allocated for this purpose last month. As a result of this move, Japan's foreign exchange reserves fell by 4.2% to $1.238 trillion. The country's total foreign exchange reserves were $1.409 trillion a year ago. Japan's deposits in other countries' Central Banks, the volume of foreign securities, and gold reserves have also decreased.
It looks like the country's leadership is quite satisfied with the lull in USD/JPY quotes. Thus, the Japanese Prime Minister Fumio Kishida, commenting on the last intervention on October 7, stated that "the recent sharp, one-sided movements of the yen are undesirable." And this raises the question: did the Ministry of Finance and the Central Bank take such a step contrary to the Prime Minister's position? Or did they not expect such an increase in volatility?
At the same time, the fact remains that, as we predicted, there was no long-term strengthening of the Japanese currency, and USD/JPY finished last week at 145.30 Supports are located in zones and at levels 144.85, 144.20, 143.50, 142.60, 141.80-142.20 and 140.25-140.60. The bulls' task No. 1 is to prevent the pair from falling below 145.00, and task No. 2 is to storm the height of 146.00. This is followed by 146.78, the level reached before the joint actions of Japan and the US to support the yen in 1998. Trend indicators and oscillators on D1 are 100% on the green side, although among the latter, one third signal that the pair is overbought.
No important statistics on the state of the Japanese economy are expected to be released this week. In addition, traders should keep in mind that Monday, October 10, is a day off in the country, National Sports Day.
CRYPTOCURRENCIES: Bitcoin Is Still Gold. Although Digital One.
According to The Block, despite the global bearish trend, the number of active investors in the bitcoin network has increased by 4.5 million since January 01, 2022. The number of bitcoin addresses with a balance of at least 0.01 BTC has reached an all-time high of 10.7 million in the last few weeks alone (At the same time, about 47% of holders remain in profit, despite the flagship cryptocurrency's long drawdown relative to the all-time high).
This dynamic is due to a serious economic crisis in Europe, against which retail holders are increasingly investing in the main cryptocurrency in order to diversify risks. It suffices to cite the UK as an example, where, due to the loss of confidence in the government's fiscal policy, the pound went into a peak on September 23-26. As a result, panic-stricken investors began to convert the British currency into physical gold and crypto-assets. We wondered in the last forecast if BTC is digital gold. In the case of the UK, the answer is yes.
What happened suggests that the destabilization of traditional financial markets can benefit the crypto market. And this is not just our opinion. Billionaire Stanley Druckenmiller, a former associate of George Soros at Quantum, predicted a resurgence of digital assets amid the collapse of the fiat-based economy. He stated this at the CNBC conference. The financier expects a "hard landing" of the economy in 2023 against the backdrop of an aggressive tightening of the Fed's monetary policy.
In his opinion, quantitative easing and low rates led to bubbles in financial markets. These factors have not only been stopped now, but reversed. The Fed has begun cutting its $9 trillion balance and has already managed to raise the key rate five times to 3.25%, expecting its peak at 4.60%. "You don't even need to talk about black swans to start worrying," the billionaire said. In his opinion, if confidence in the actions of central banks is lost, cryptocurrencies "will play a big role in the revival".
Not only Stanley Druckenmiller, but the market as a whole fear that the economy will not be able to withstand such monetary tightening. In addition to the rate hike, the monthly rate of contraction in the global money supply, according to Morgan Stanley, has reached $750 billion in dollar terms. This is leading to a deepening recession. it is only the Fed that can change the situation if it retreats from its plans to combat inflation. Looking to the future, Rich Dad Poor Dad bestselling author Robert Kiyosaki called the current situation a great opportunity to buy the first cryptocurrency and other digital assets. "Buy more. When the Fed turns around and cuts interest rates, you will smile while others cry," he said.
Mike Novogratz, CEO of Galaxy Digital, gave a similar forecast. This expert did not rule out that the regulator may re-initiate the quantitative easing procedure at some point in order to stabilize the market situation. In his opinion, bitcoin looks quite stable even in the current macroeconomic conditions. And in the event of a change in the policy of the Fed, BTC will still be able to reach $500,000 within a few years.
As for the near future, Ardian Zdunczyk, founder and CEO of The Birb Nest, shared his forecast here. He referred to historical data, according to which the fourth quarter has always been successful for BTC. Based on this, investors can expect good returns over the next two months. True, Zdunczyk made a reservation straight away that no one would give guarantees on this score.
Another argument in favor of the pre-New Year rally, according to the specialist, is the fact that the coins rose slightly compared to their 200-day trends. Unlike fiat currencies that are on a rollercoaster ride, bitcoin is holding steady around $20,000. And now all markets are waiting for stability. They are already tired of the recession, the fall in company stocks, the gloomy forecasts of the IMF and the ill-conceived policies of the Central Banks, says Ardian Zdunczyk. Therefore, against such a background, bitcoin is becoming more and more attractive.
Against the backdrop of BTC price stability, mining-related metrics are also improving. In particular, the hash rate reached a record 242 EH/s. Analysts have estimated the "painful" breakeven threshold for miners at $18,300. According to Glassnode's calculations, 78,400 BTC could be at risk of liquidation if bitcoin goes below this price, which is derived from a mining difficulty regression model. This value is slightly higher than the June low of $17,840.
The balances of miners have 78,400 BTC, the maximum number of coins that can increase sales in case of stress for this category of market participants. At the moment, most of the sales are carried out by miners associated with the Poolin pool. In September, representatives of this company admitted that there were problems with liquidity.
Cryptocurrency strategist and trader Cantering Clark also warns that BTC could plunge to five-year lows amid weak stock markets. According to his calculations, bitcoin could fall by almost 40% from current levels if the S&P 500 stock index resumes its bearish trend. "If the S&P 500 drops to the next major area between 3,200-3,400 [pips], I think the correct assumption is that the crypto crash will be 2-3 times greater. This means at least that BTC will re-test the largest protrusion in five years: about $12,000-13,000," the trader predicts.
However, in the short term, he believes bitcoin bulls could bring back some confidence to the market if they manage to gain a foothold above $20,000. "If we can break these local highs, I think BTC will see some momentum," Cantering Clark thinks.
Social media users had been recently discussing vigorously the fact that October 07 will be a key day for the cryptocurrency market last week. The reason for this is the release of data on the US labor market that day. Together with CPI, these statistics allow us to predict how much the Fed can raise interest rates at its next meeting in November. And this, in turn, will certainly affect the value of risky assets, such as stocks and cryptocurrencies.
The market reacted to the release of these data by lowering the quotations of risky assets: at the time of writing the review (Friday evening, October 07), BTC/USD went below $20,000 and is trading at $19,610. The total capitalization of the crypto market is $0.946 trillion ($0.935 trillion a week ago). The Crypto Fear & Greed Index has risen only 1 point in seven days, from 22 to 23, and is still in the Extreme Fear zone.
And at the end of the review, as usual, we will try to give everyone a boost of optimism. According to US Treasury Secretary Janet Yellen, the crypto industry, left unregulated, is fraught with risks and could harm the entire US financial system. Usually, such statements were perceived by the market as a threat, and became a bearish factor for bitcoin and other cryptocurrencies. However, the Commodity Futures Trading Commission (CFTC), which oversees the US futures market, believes that proper regulation could have a powerful bullish effect on the price of BTC. CFTC chief Rostin Behnam explained that a clear regulatory framework would help boost the number of institutional investors.
There is no doubt that the US government agencies will soon squeeze the crypto industry into their regulatory "embrace". But what if that's when Mike Novogratz's predictions come true, and we see bitcoin at around $500,000?
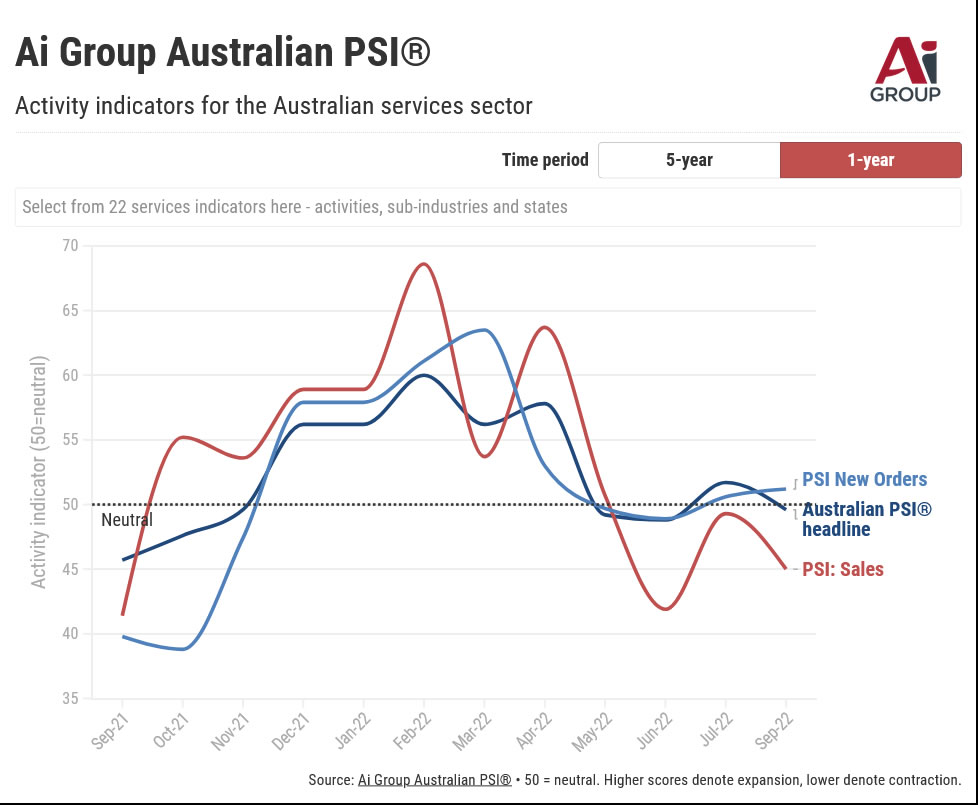
Australia AiG services dropped to contraction at 48
Australia AiG Performance of Services Index dropped sharply by -5.3 pts to 48.0 in September, back in contraction. Looking at some details, sales tumbled by -10.1 to 41.8. Employment edged down by -0.6 to 52.6. New orders dropped -7.1 to 50.2. Input prices rose 4.7 to 73.4. Selling prices dropped -2.9 to 58.3. Average wages dropped -1.7 to 65.9.
Innes Willox, Chief Executive of Ai Group, said: "The increasingly uncertain economic environment is dragging on service industries. The sector has fallen into contraction in September, and all services activity indicators have worsened in the last month. Low consumer and business confidence – following repeated interest rate rises and persistent inflation – were major factors in this decline. The indicators for sales, new orders, and selling prices all fell, while input prices continued their upward march adding to inflationary pressures.
EUR/USD Could Resume Downtrend Below 0.9650
Key Highlights
- EUR/USD failed to surpass 1.0000 and reacted to the downside.
- A key bearish trend line is forming with resistance near 0.9880 on the 4-hours chart.
- GBP/USD failed to recover above the 1.1500 resistance and declined.
- Crude oil price rallied above the $90 resistance zone.
EUR/USD Technical Analysis
The Euro attempted a recovery wave above the 0.9800 resistance against the US Dollar. EUR/USD climbed above the 0.9880 resistance, but it struggled near the parity level.
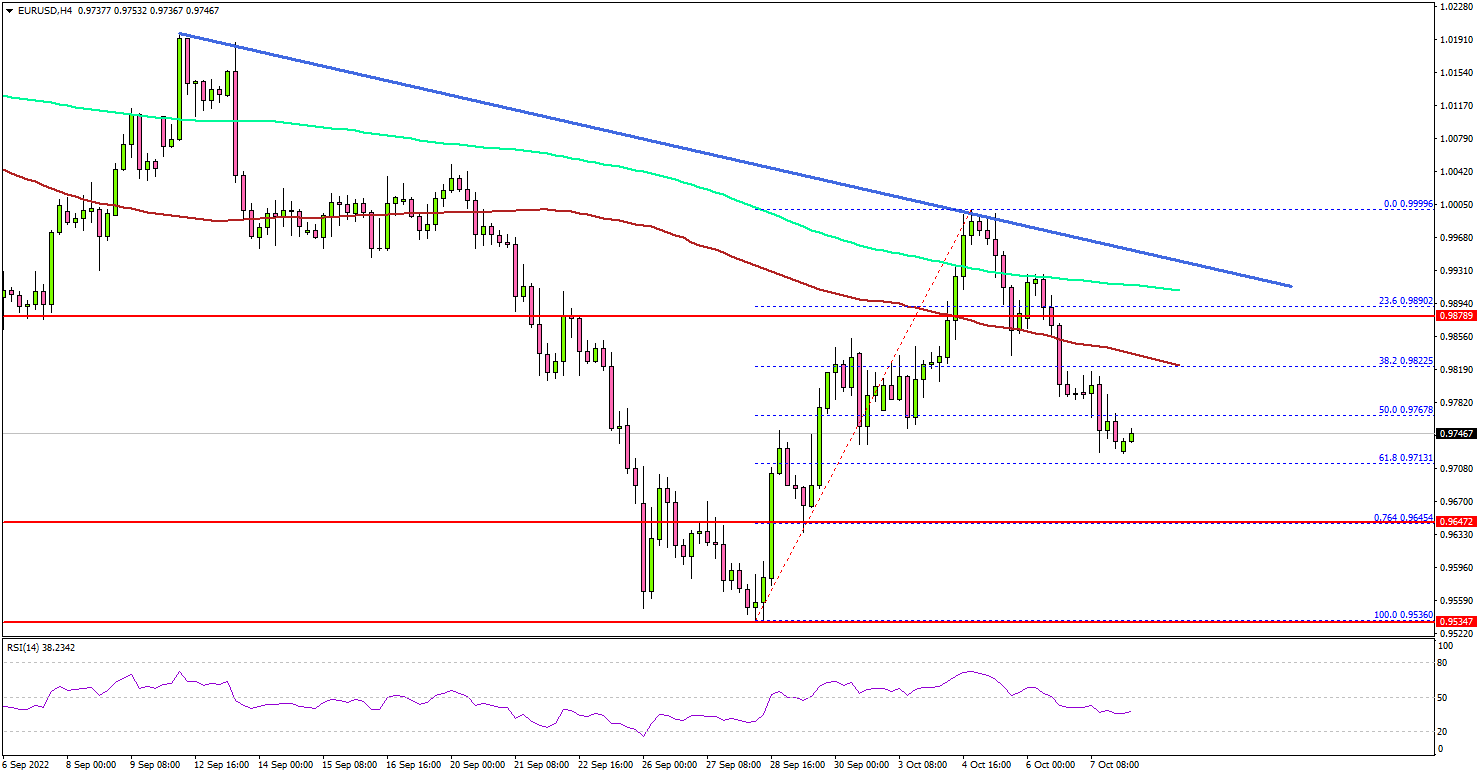
Looking at the 4-hours chart, the pair struggled to climb above the 0.9980 and 1.0000 resistance levels. A high was formed near 0.9999 and the pair reacted the downside. There was a move below the 0.9950 and 0.9900 support levels.
The pair declined below the 50% Fib retracement level of the upward move from the 0.95.36 swing low to 0.9999 high. It even settled below the 0.9850 level, the 100 simple moving average (red, 4-hours), and the 200 simple moving average (green, 4-hours).
On the downside, an initial support is near the 0.9700 level. The main support sits at the 0.9650 level. It is close to the 76.4% Fib retracement level of the upward move from the 0.95.36 swing low to 0.9999 high.
A downside break below the 0.9650 zone might send the pair towards the 0.9550 level or even to a new multi-year low.
An immediate resistance is near the 0.9820 level. The next major resistance is near the 0.9880 level. There is also a key bearish trend line forming with resistance near 0.9880 on the same chart.
A clear move above the 0.9880 level might send the pair towards the 0.9950 level. The next major hurdle could be near the 1.0000 level.
Looking at GBP/USD, the pair also failed to clear the 1.1500 resistance zone and there was a bearish reaction below the 1.1250 level.
Economic Releases
- Euro Zone Sentix Investor Confidence for Oct 2022 - Forecast -30.8, versus -31.8 previous.
- IMF Meeting.
Eco Data 10/10/22
[php_everywhere instance="1"]
Rising Oil and Yields, Falling Stocks, Stronger Dollar Ahead
After a brief recovery, risk sentiment turned sour again towards the end of the week. Solid data from the US that solidify expectation for continuous aggressive Fed actions was a factor. Strong rebound in oil price also raised concern of a second wave in inflation. The overall development suggests that risk sentiment remains fragile, and extended selloff in stocks and bonds ahead could give Dollar further boost ahead.
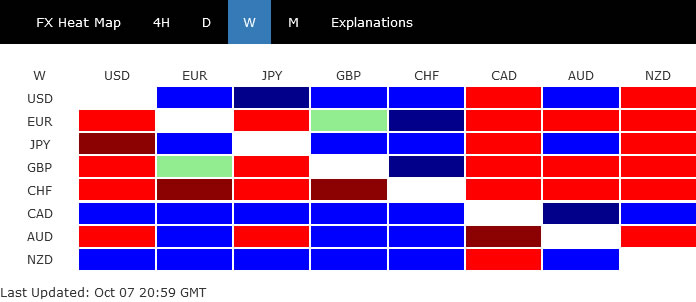
Dollar did rally broadly towards the end of the week, but that wasn't enough to push it through near term resistance levels against most major rivals. Greenback buyers were probably still on the sideline, awaiting upcoming inflation data. Indeed, Canadian Dollar eked out the first place for its resilience, while New Zealand Dollar was second only because of its earlier gains. Swiss Franc was the worst performer, followed by Euro and Sterling.
Robust job data backs more aggressive Fed tightening
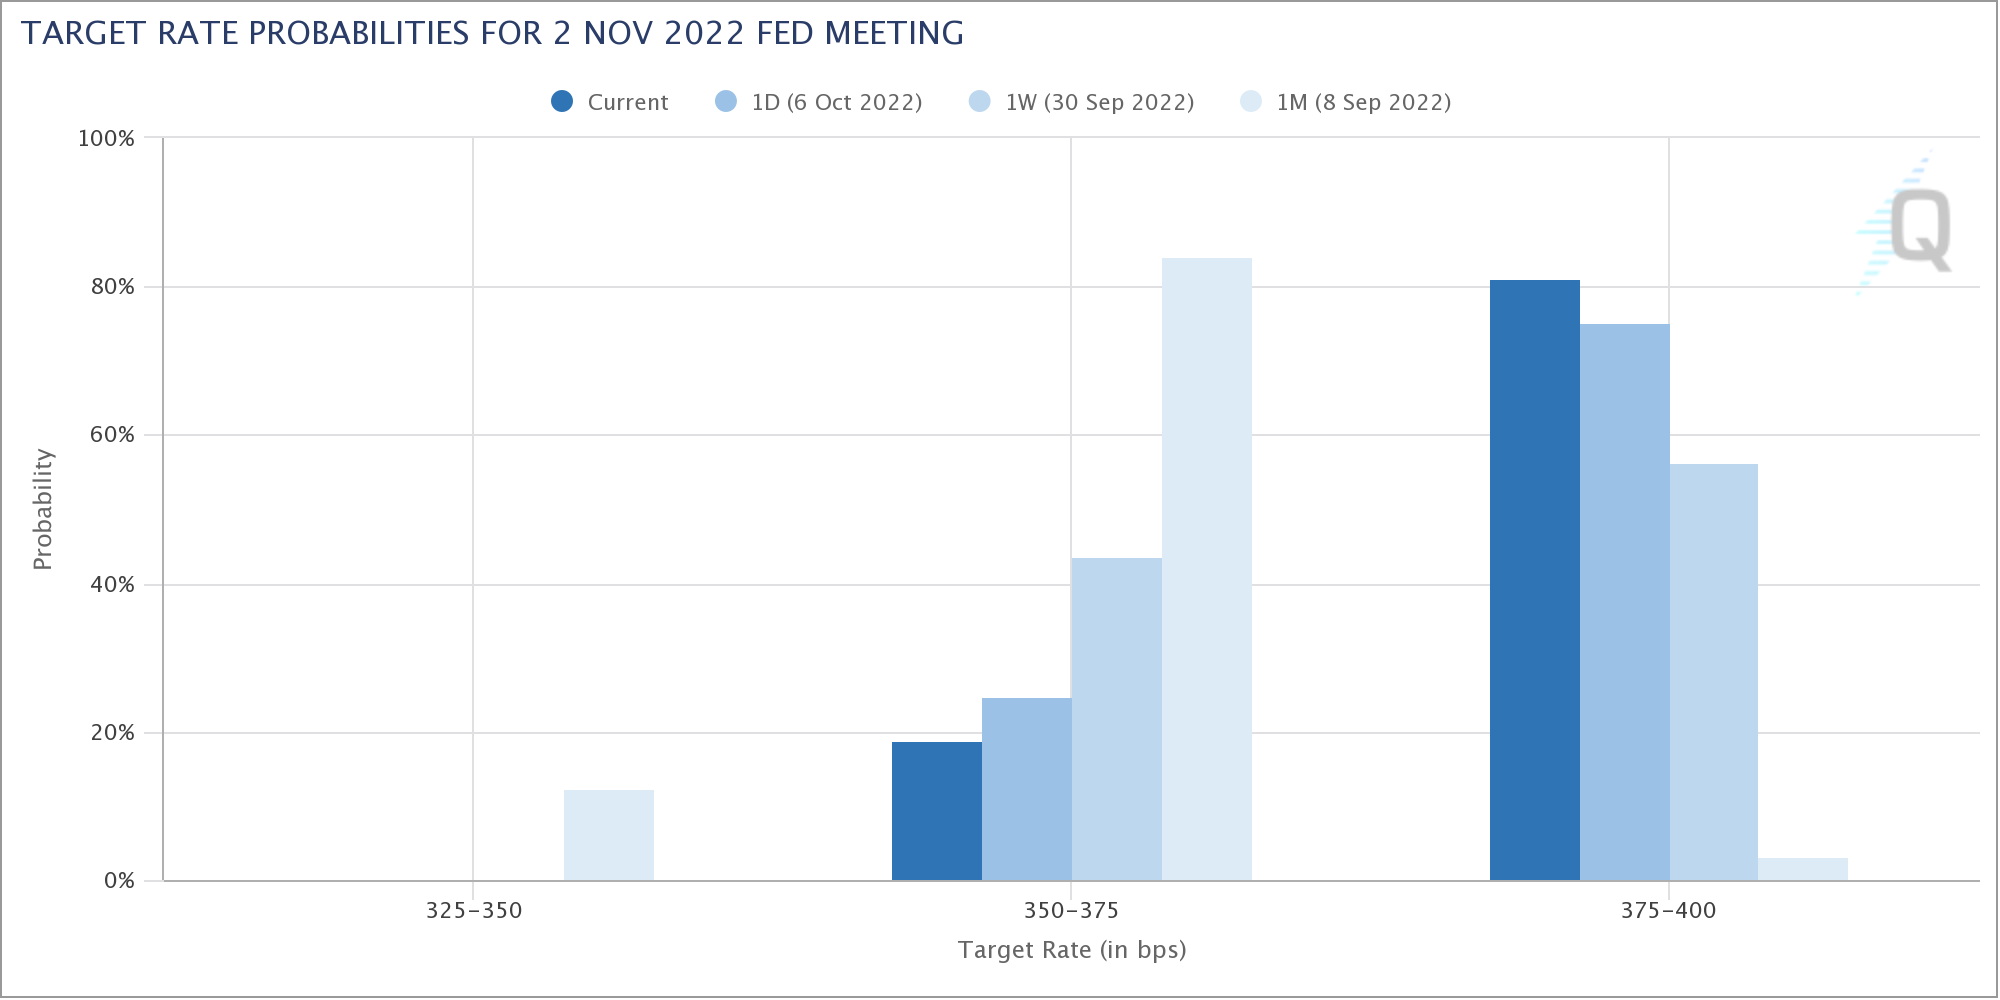
Comments from Fed officials last week indicate that the majority are still leaning towards continuing the tightening pace. Their views were backed up by a set of robust non-farm payroll data. ISM indexes showed while there was some slowdown in manufacturing, services remained resilient. Fed fund futures are pricing in 81% chance of another 72bps hike on November 2 to 3.75-4.00%, comparing to just 56% a week ago. The upcoming September CPI data is crucial to solidify such expectations.
Oil rebounded strongly after OPEC+ pre-emptive production cut
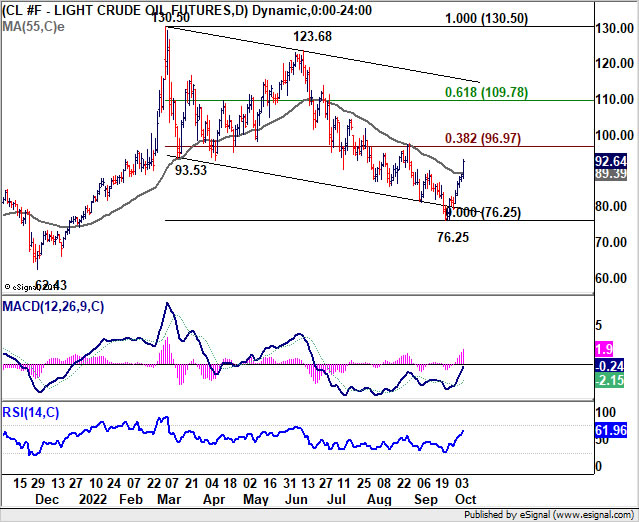
Strong rebound in oil price was another factor that investors could find worrying. OPEC+ announced its largest supply cut since 2020. OPEC and allies including Russia agreed to lower output target by 2 million bpd, equalling to 2% of global supply. OPEC Secretary General Haitham al-Ghais said there's a "high possibility that recession will happen", and the decisions was "pre-emptive". EU also agreed to impose a price cap of Russian oil, which will squeeze supply further.
WTI crude oil closed strongly at 96.97, taking out 55 day EMA decisively. Further rise is now in favor to 38.2% retracement of 130.50 to 76.25 at 96.97 and possibly above. But overall market sentiment could stay relatively calm as long as it stays below 100 psychological level.
Yet, given that correction from 130.50 has possibly completed with three waves down to 76.25, decisive break of 100 could push WTI further to 61.8% retracement at 109.78, which is close to 110. If that happens, sentiment should be dashed further by prospect of more prolonged inflation, higher terminal interest rates, and a longer time monetary policy stays restrictive.
S&P 500 ready for down trend resumption after brief recovery
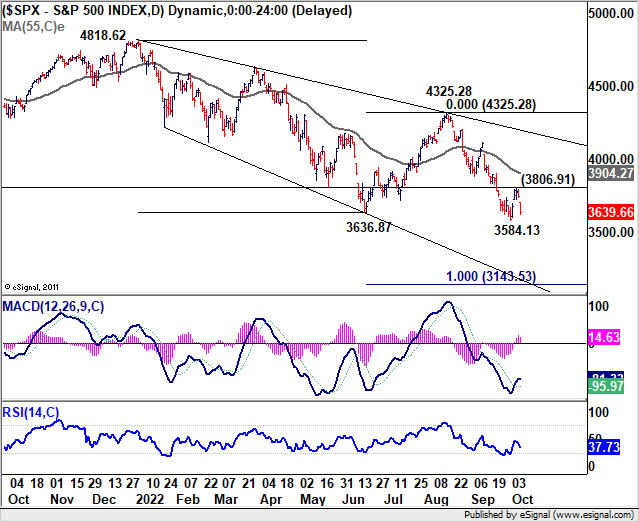
Despite a strong start, US stocks reversed and pared back most of earlier gains to close a a very weak note. S&P 500's brief recovery indicates that outlook stays bearish and the corrective down trend from 4818.62 might be ready to resume soon. Break of 3584.13 support will confirm and target 100% projection of 4818.62 to 3636.87 from 4325.28 at 3143.53. The power of the downside breakout would depend on the US inflation data as well as development in oil prices.
US 10-year yield to take on 4% handle again soon
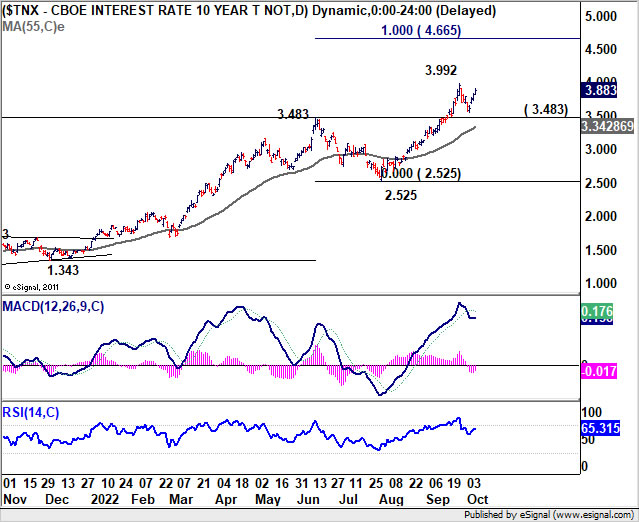
US 10-year yield's retreat from 3.992 might have completed after last week's rebound. Such retreat now looks more likely just a near term correction than not. And even in case of another fall, 3.483 resistance turned support should provide a floor. Break of 3.992 will resume up trend through 4% psychological level to 100% projection of 1.343 to 3.483 from 2.525 at 4.665. Such development, if happens, will reconfirm worries on prolonged inflation and tightening.
Dollar index staying bullish, but upside breakout not warranted yet
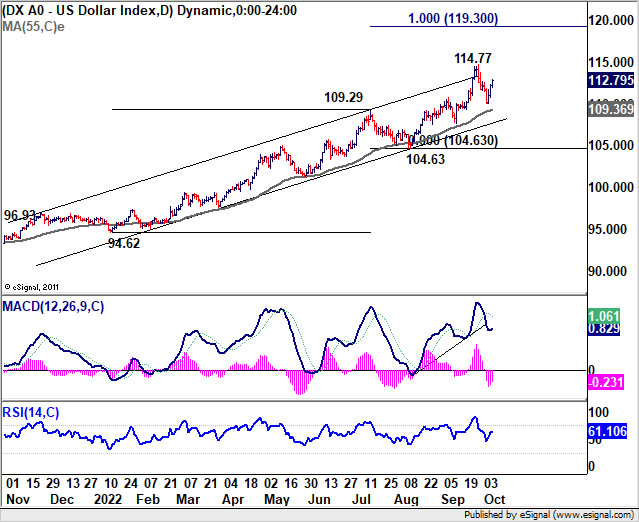
Dollar's reaction to NFP was affirmative to its underlying bullishness, but somewhat disappointing. The greenback could only break through recent high against Aussie, but stuck in range against others. Outlook in Dollar index remains clearly bullish as it's holding well above 55 day EMA (now at 109.36) as well as medium term channel support. But current upside momentum doesn't warrant a breakout yet.
Still, in case of of another fall, strong support should be seen from 55 day EMA to contain downside. Break of 114.77 will resume larger up trend to 100% projection of 94.62 to 109.29 from 104.63 at 119.30. In this case, there is prospect of upside acceleration if risk aversion intensifies while 10-year yield breaks 4%.
AUD/CAD breakout on BoC and RBA divergence
Canadian Dollar was support by rebound in oil price, solid job data, as well as hawkish comments from BoC Governor Tiff Macklem. Macklem indicated that more work is needed to be done to curb inflation, and it's too soon to take a "decision-by-decision" approach to monetary policy. That is, another 75bps hike is on the card for October 26 meeting.
On the other hand, RBA has already started slowing down tightening, and delivered only a 25bps hike last week. It's likely continue to lag behind others in pace.
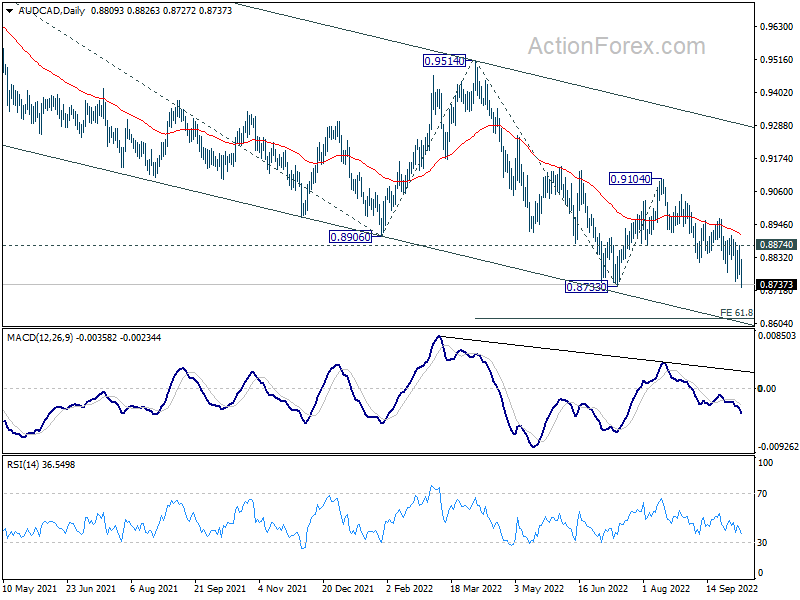
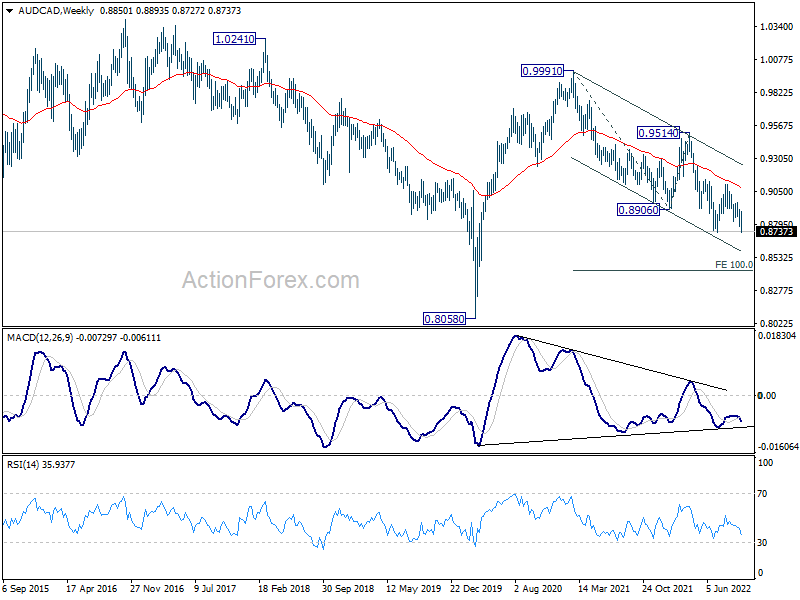
AUD/CAD breached 0.8733 support last week as down trend is now ready to resume. Further decline is expected as long as 0.8874 resistance holds. Next near term target is 61.8% projection of 0.9514 to 0.8733 from 0.9104 at 0.8621.
Sustained break of 0.8621, coupled with further divergence in monetary policy between BoC and RBA, could send AUD/CAD to medium term target of 100% projection of 0.9991 to 0.8906 from 0.9514 at 0.8429, with downside acceleration.
USD/CHF Weekly Outlook
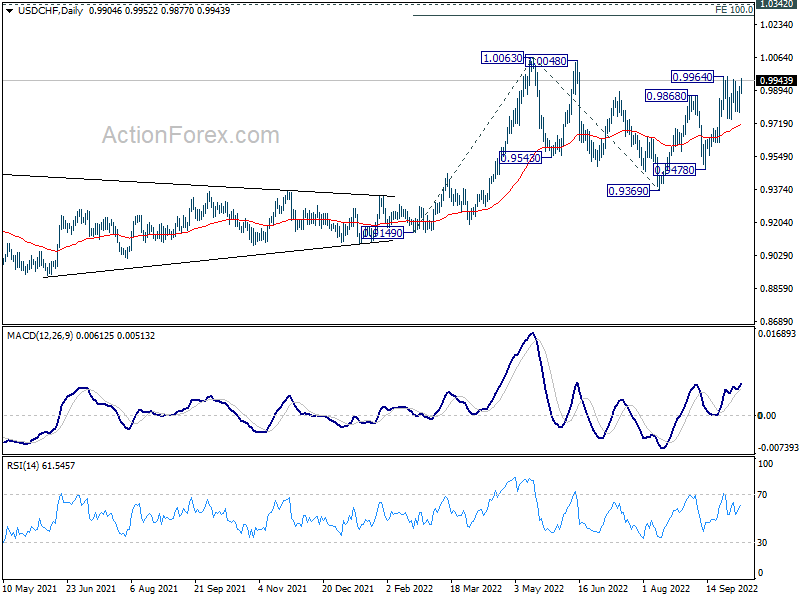
USD/CHF stayed in consolidation from 0.9964 last week and outlook is unchanged. Initial bias remains neutral this week first. On the upside, above 0.9964 will resume the rally from 0.9369 to retest 1.0063 high. For now, outlook will stay bullish as long as 0.9738 support holds, in case of retreat.
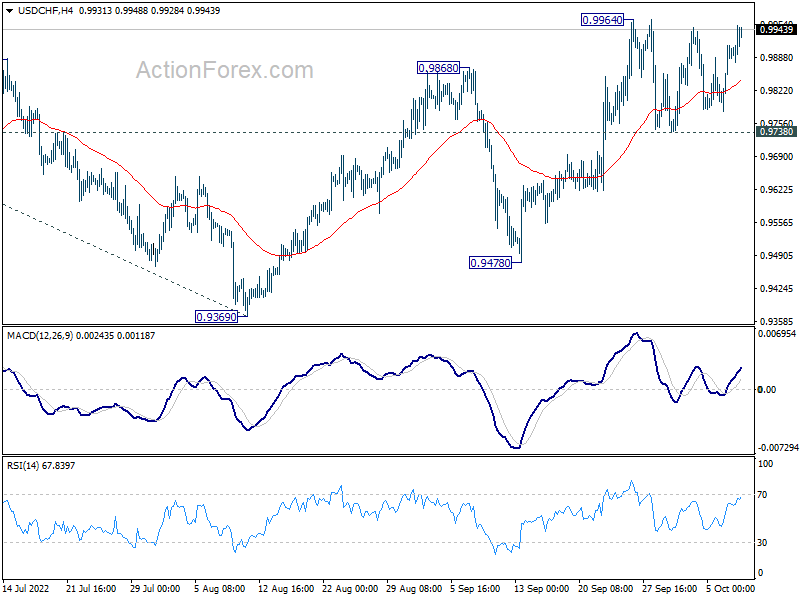
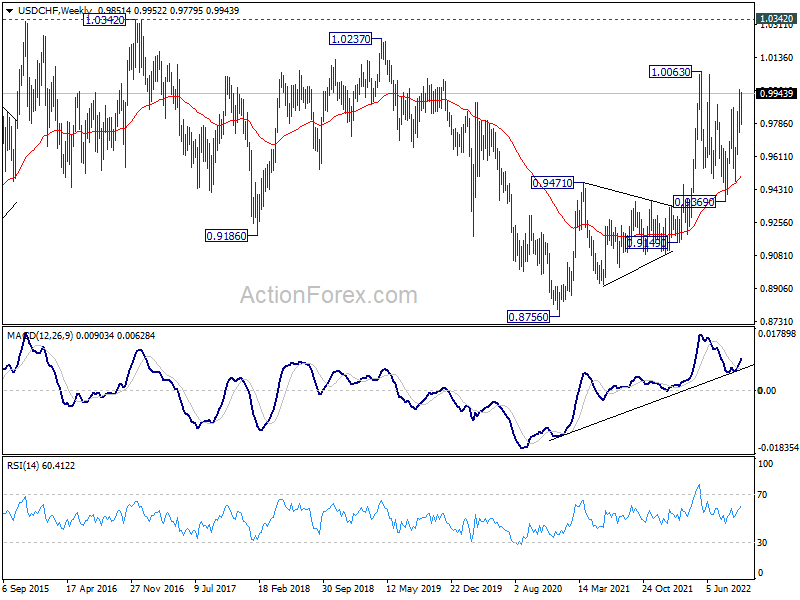
In the bigger picture, current development suggests that up trend from 0.8756 (2021 low) is still in progress. Sustained break of 1.0063 will target 100% projection of 0.9149 to 1.0063 from 0.9369 at 1.0283, and then 1.0342 (2016 high). For now, this will remain the favored case as long as 0.9369 support holds, even in case of deep pull back.
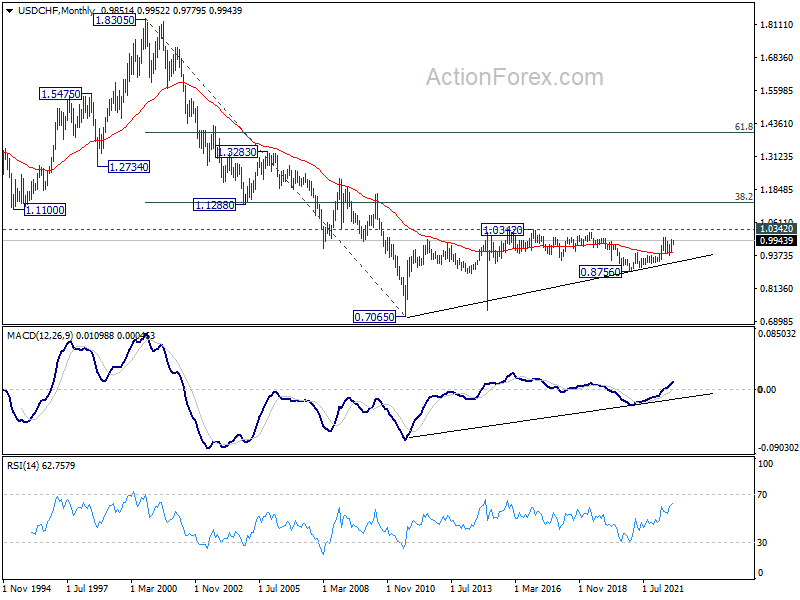
In the long term picture, outlook is mixed with deeper than expected fall from 1.0063, but some support was seen from 55 week EMA (now at 0.9492). Overall, though, USD/CHF is seen as in sideway pattern from 1.0342 (2016 high). Range trading should continue until further development.
EUR/USD Weekly Outlook
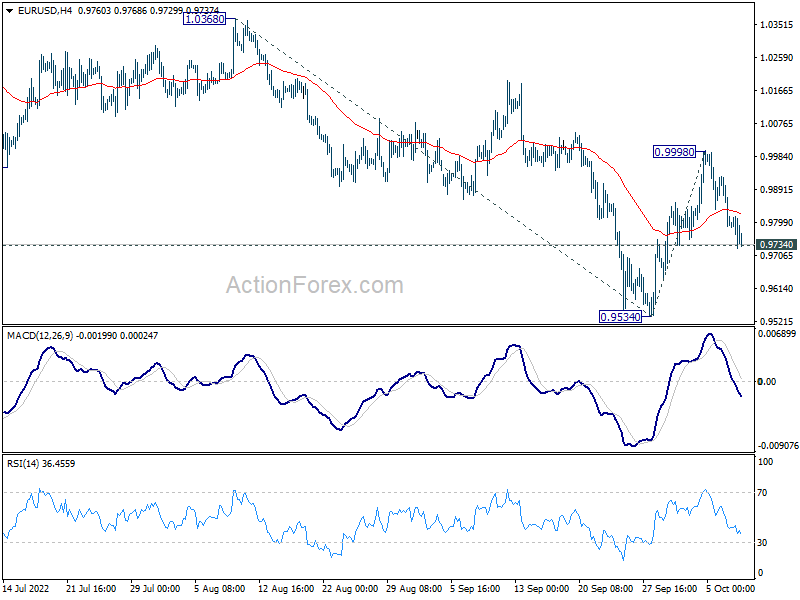
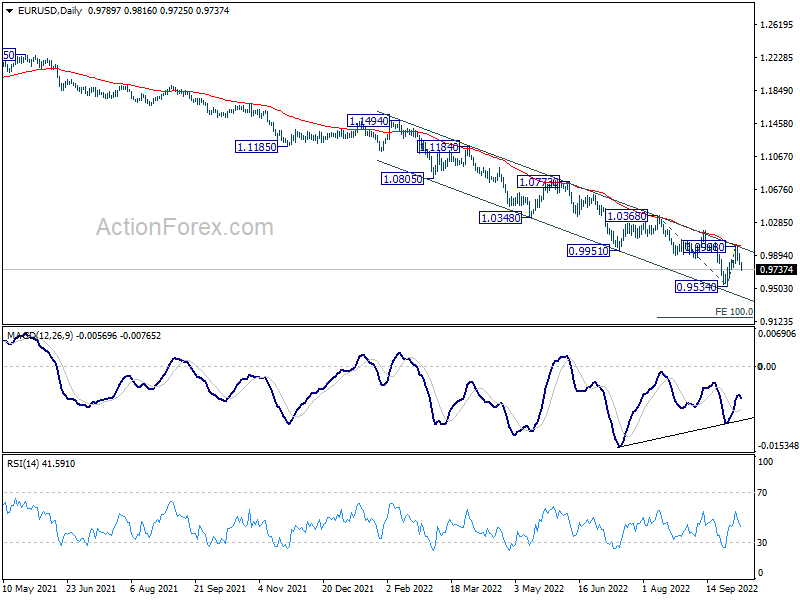
EUR/USD rose to 0.9998 last week but reversed just ahead of parity. Immediate focus stays on 0.9734 minor support this week. Firm break there will argue that larger down trend is ready to resume through 0.9534. Next target is 100% projection of 1.0368 to 0.9534 from 0.9998 at 0.9163. For now, risk will stay on the downside as long as 0.9998 resistance holds, in case of recovery.
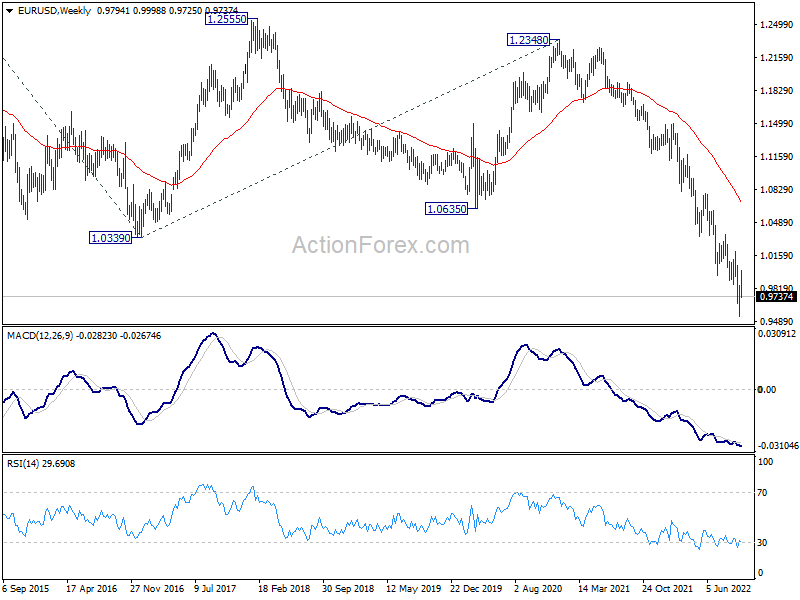
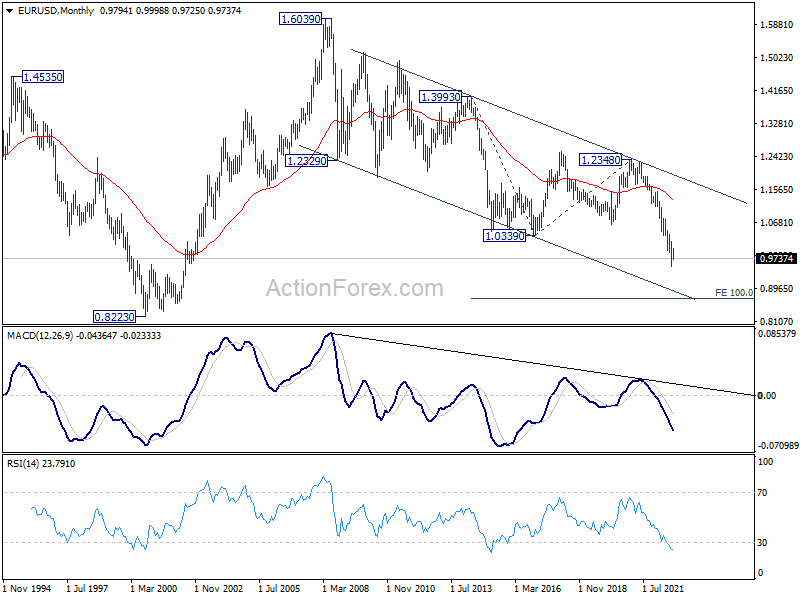
In the bigger picture, down trend from 1.6039 (2008 high) is still in progress. Next target is 100% projection of 1.3993 to 1.0339 from 1.2348 at 0.8694. In any case, break of 0.9998 resistance is needed to be the first sign of medium term bottoming. Otherwise, outlook will stay bearish even with strong rebound.
In the long term picture, long term down trend from 1.6039 (2008 high) is extending. Next target is 100% projection of 1.3993 to 1.0339 from 1.2348 at 0.8694. This will now remain the favored case as long as 1.0635 support turned resistance holds.
GBP/USD Weekly Outlook
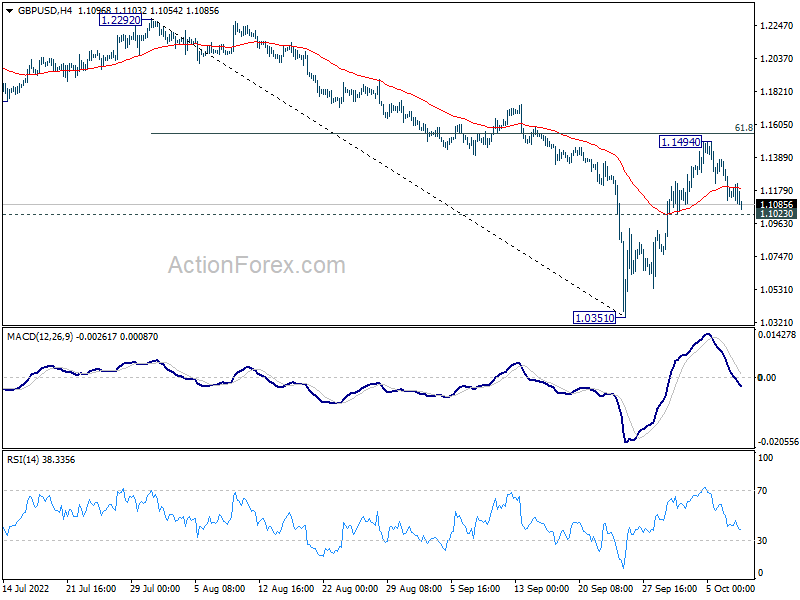
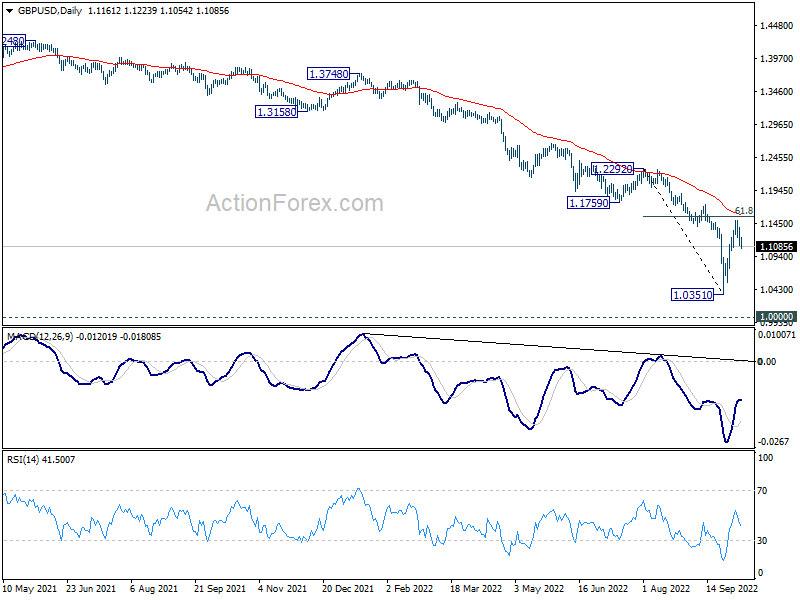
GBP/USD rebounded further to 1.1494 last week but retreated. Initial bias remains neutral this week first. On the downside, break of 1.1023 minor support will indicate that rebound from 1.0351 is over. Intraday bias will be back on the downside for retesting 1.0351. On the upside, firm break of 61.8% retracement of 1.2292 to 1.0351 at 1.1551 will pave the way to 1.2292 resistance.
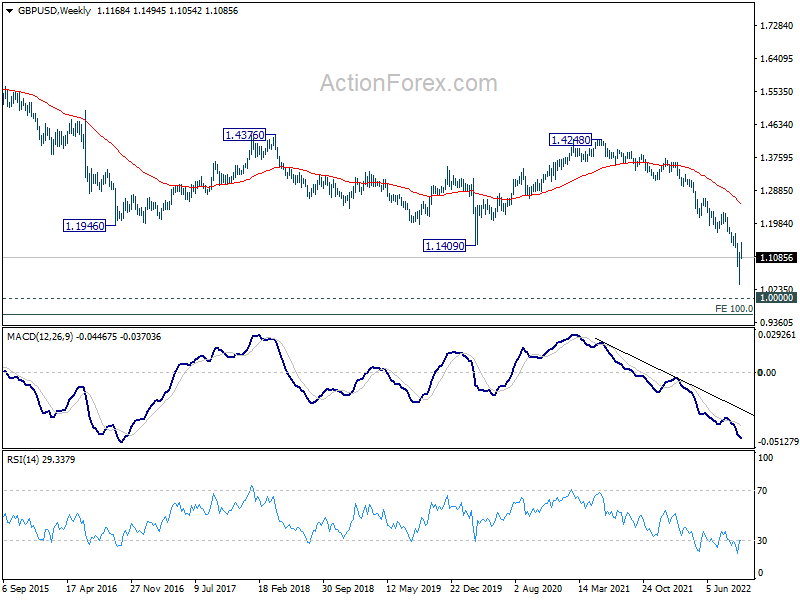
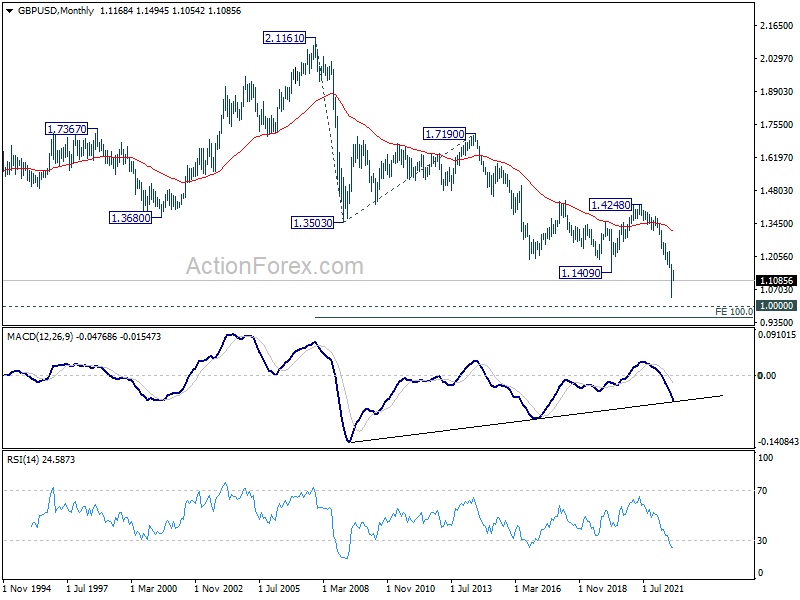
In the bigger picture, fall from 1.4248 (2018 high) is resuming long term down trend from 2.1161 (2007 high). Next target is 100% projection of 2.1161 to 1.3503 from 1.7190 at 0.9532. There is no scope of a medium term rebound as long as 1.1759 support turned resistance holds.
In the longer term picture, long term down trend from 2.1161 (2007) high is still in progress. Next target is 100% projection of 2.1161 to 1.3503 from 1.7190 at 0.9532.
USD/CHF Weekly Outlook
USD/CHF stayed in consolidation from 0.9964 last week and outlook is unchanged. Initial bias remains neutral this week first. On the upside, above 0.9964 will resume the rally from 0.9369 to retest 1.0063 high. For now, outlook will stay bullish as long as 0.9738 support holds, in case of retreat.
In the bigger picture, current development suggests that up trend from 0.8756 (2021 low) is still in progress. Sustained break of 1.0063 will target 100% projection of 0.9149 to 1.0063 from 0.9369 at 1.0283, and then 1.0342 (2016 high). For now, this will remain the favored case as long as 0.9369 support holds, even in case of deep pull back.
In the long term picture, outlook is mixed with deeper than expected fall from 1.0063, but some support was seen from 55 week EMA (now at 0.9492). Overall, though, USD/CHF is seen as in sideway pattern from 1.0342 (2016 high). Range trading should continue until further development.