

Sample Category Title
Australia Westpac consumer sentiment dropped to 83.7, RBA averted a much bigger fall
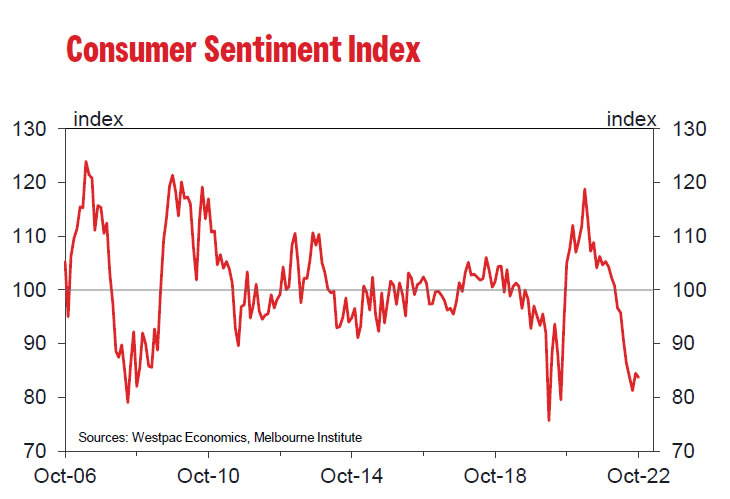
Australia Westpac Consumer Sentiment Index dropped -0.9% mom to 83.7 in October. Westpac said the index remains in "deeply pessimistic territory", at a level comparable to the lows "briefly reached during the pandemic", and during the Global Financial Crisis.
It added RBA's smaller than expected 25bps rate hike "averted a much bigger fall" in sentiment. Sentiment amongst those sampled before the RBA decision showed a "depressing" 77.4 index read. But the post RBA "relief rebound" is "unlikely to be repeated in future months".
Westpac expects four more consecutive 25bps rate hikes at RBA's November, December, February and March meetings.
Japan Suzuki: Will take appropriate action on excessive Yen moves
Japanese Finance Minister Shunichi Suzuki reiterated today, "we will take appropriate action if there are any excessive moves" in Yen's exchange rate. The comment came as Yen threatens to decline further towards the lowest level since 1998 again.
Suzuki also said, Japan is closely watching current FX moves with a "strong sene of urgency". He planned to explain the stance on intervention at G20 meeting. He said that Japan have gained "certain understanding" from the US regarding intervention.
Fed Brainard: Monetary policy will be restrictive for some time
Fed Vice Chair Lael Brainard said in a speech, "monetary policy will be restrictive for some time to ensure that inflation moves back to target over time."
"It will take time for the cumulative effect of tighter monetary policy to work through the economy broadly and to bring inflation down."
"In light of elevated global economic and financial uncertainty, moving forward deliberately and in a data-dependent manner will enable us to learn how economic activity, employment, and inflation are adjusting to cumulative tightening in order to inform our assessments of the path of the policy rate." She said.
GBP/USD Corrects, US Dollar Regains Strength
Key Highlights
- GBP/USD started a fresh decline from the 1.1500 resistance zone.
- It traded below a key bullish trend line with support at 1.1175 on the 4-hours chart.
- EUR/USD, AUD/USD, and NZD/USD faced an increase in selling pressure.
- The UK Claimant count could change -11.4K in Sep 2022.
GBP/USD Technical Analysis
The British Pound struggled to clear the 1.1500 resistance zone against the US Dollar. GBP/USD formed a short-term top and started a fresh decline below the 1.1400 level.
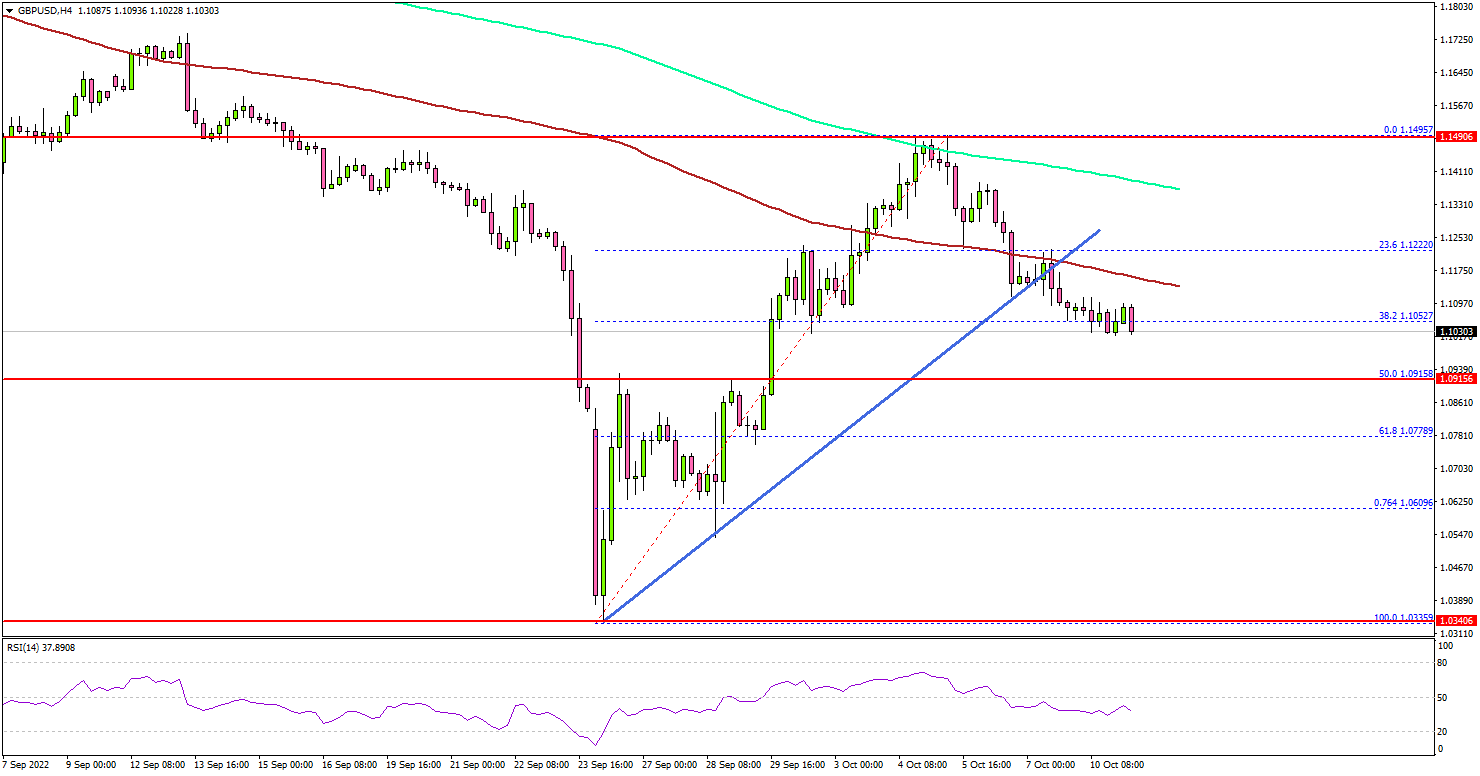
Looking at the 4-hours chart, the pair declined below the 1.1350 and 1.1300 levels. There was a clear move below a key bullish trend line with support at 1.1175. The pair declined below the 23.6% Fib retracement level of the upward move from the 1.0335 swing low to 1.1495 high.
The pair settled below the 1.1200 level, the 100 simple moving average (red, 4-hours), and the 200 simple moving average (green, 4-hours).
On the downside, an initial support is near the 1.0950 level. The main support sits at the 1.0915 level. It is close to the 50% Fib retracement level of the upward move from the 1.0335 swing low to 1.1495 high.
A downside break below the 1.0915 zone might send the pair towards the 1.0800 level. If the pair stays above the 1.0915 support, it could start a fresh increase. An immediate resistance is near the 1.1175 level.
The next major resistance is near the 1.1250 level. A clear move above the 1.1250 level might send the pair towards the 1.1320 level. The next major hurdle could be near the 1.1500 level.
Looking at EUR/USD, the pair started a fresh decline after it failed to clear the 1.0000 level. If the bears remain in action, the pair might slide below 0.9650.
Economic Releases
- UK Claimant Count Change for Sep 2022 – Forecast -11.4K, versus 6.3K previous.
- UK ILO Unemployment Rate for August 2022 (3M) – Forecast 3.6%, versus 3.6% previous.
Elliott Wave View: USDCAD Should Continue to Extend Higher
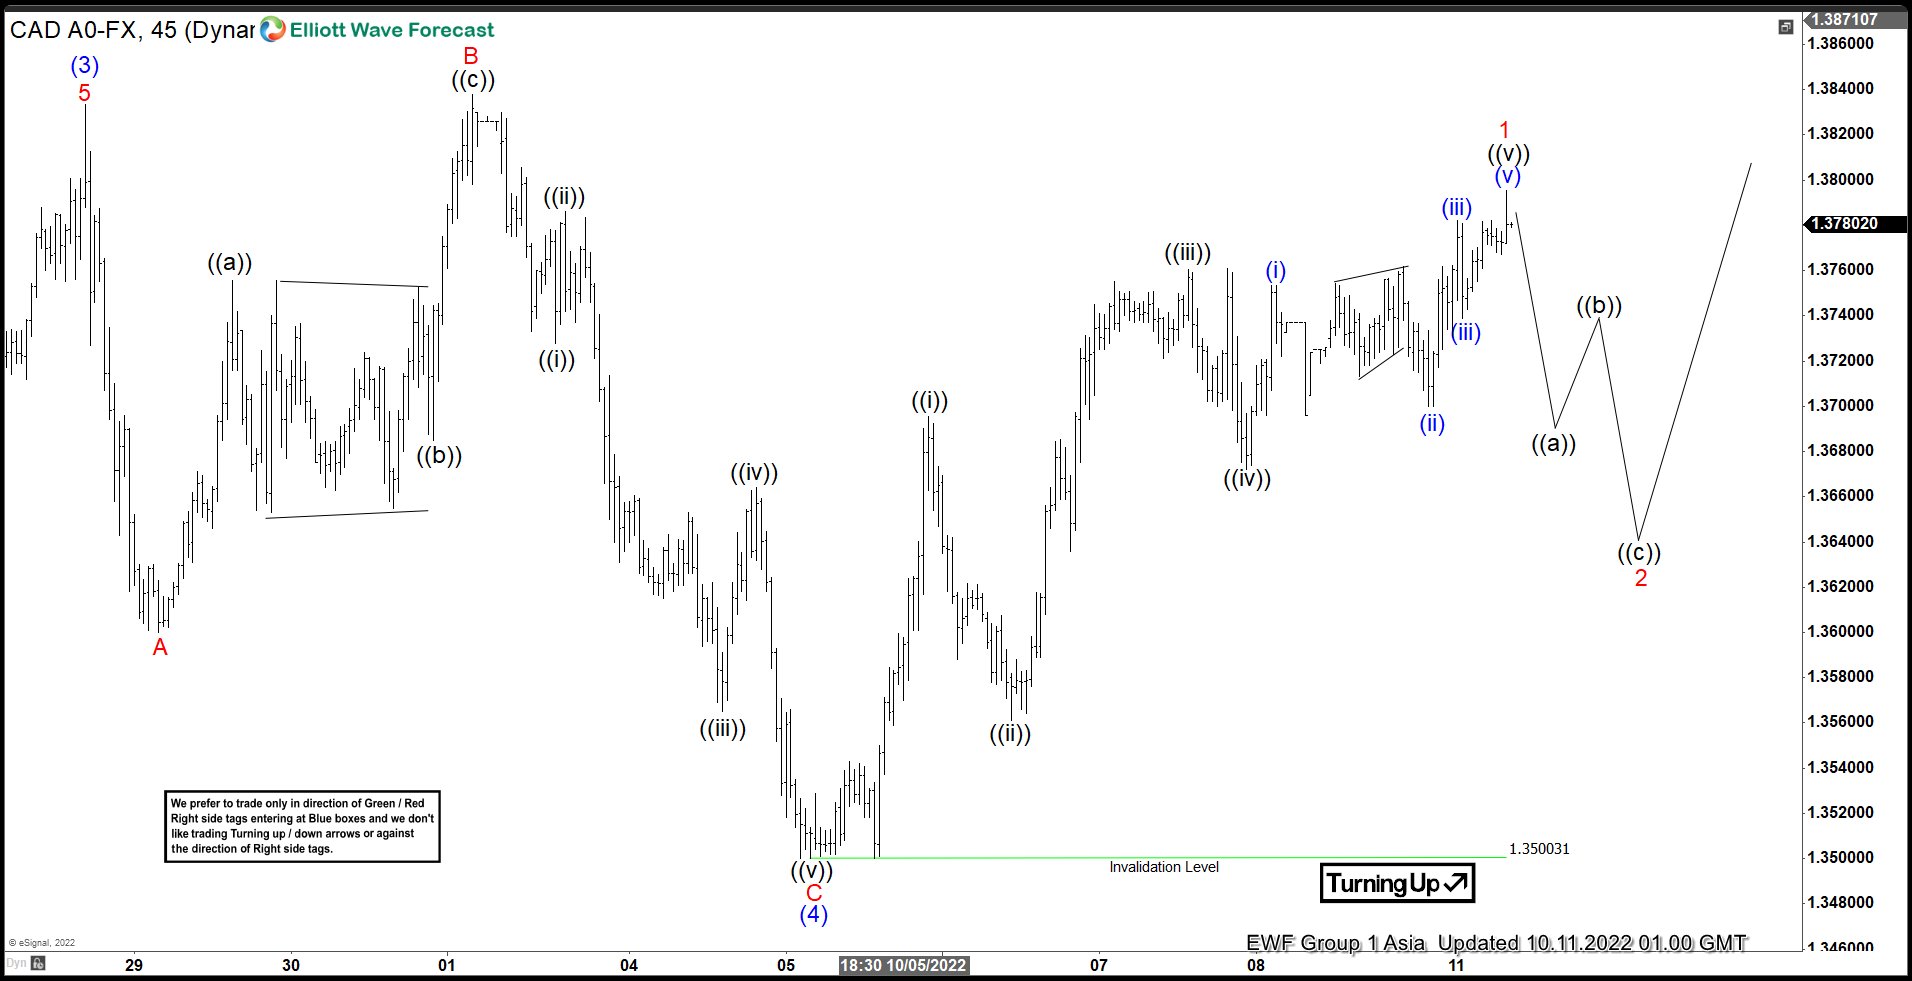
Short term Elliott Wave view on USDCAD suggests the cycle from 8.11.2022 low is in progress as a 5 waves impulse structure. Up from 8.11.2022 low, wave (1) ended at 1.3208 and dips in wave (2) ended at 1.295. Pair then resumes higher in wave (3) towards 1.3833. Pullback in wave (4) ended at 1.35 with internal subdivision as a zigzag structure. Down from wave (3), wave A ended at 1.36, rally in wave B ended at 1.383, and wave C lower ended at 1.35. This completed wave (4) in higher degree.
Wave (5) higher is in progress with internal subdivision as another 5 waves in lesser degree. Up from wave (4), wave ((i)) ended at 1.3695 and pullback in wave ((ii)) ended at 1.356. Pair then resumes higher in wave ((iii)) towards 1.376 and dips in wave ((iv)) ended at 1.367. Expect pair to end wave ((v)) soon and this should complete wave 1 in higher degree. Afterwards, pair should pullback in wave 2 to correct cycle from 10.5.2022 low before the rally resumes. Near term, as far as pivot at 1.35 low stays intact, expect dips to find support in 3, 7, or 11 swing for further upside.
USDCAD 45 Minutes Elliott Wave Chart
USDCHF Wave Analysis
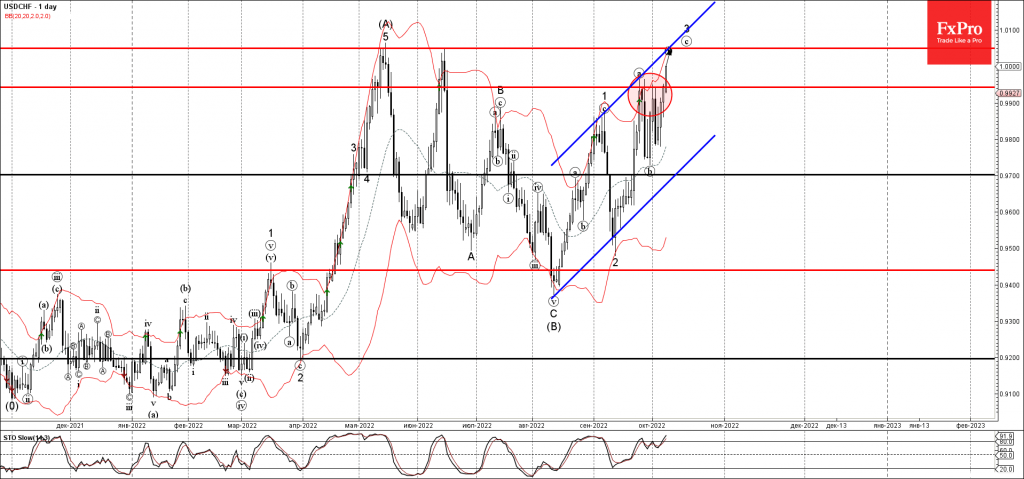
- USDCHF under bullish pressure
- Likely to rise to resistance level 1.0050
USDCHF under the bullish pressure after the earlier breakout of the key resistance level 0.9940 (which has been reversing the pair from the end of September).
The breakout of the resistance level 0.9940 accelerated the active short-term impulse waves (c) and 3.
USDCHF can be expected to rise further toward the next resistance level 1.0050 (former monthly high from May and June).
AUDUSD Wave Analysis
- AUDUSD under bearish pressure
- Likely to fall to support level 0.6200
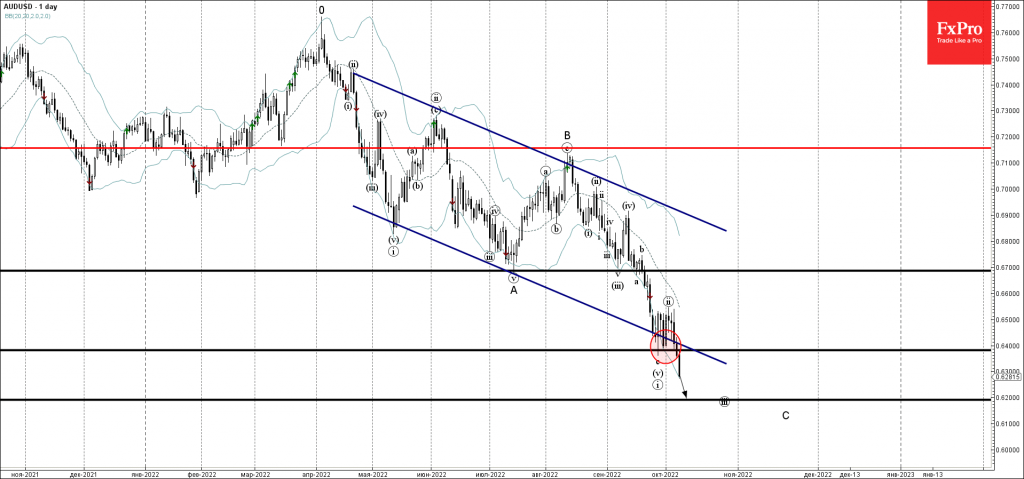
AUDUSD under the bearish pressure after the earlier breakout of the support zone lying at the intersection of the support level 0.6400 (low of the earlier impulse wave (i)) and the support trendline of the daily down channel from April.
The breakout of this support zone accelerated the active short-term impulse waves (iii) and C.
AUDUSD can be expected to fall further toward the next support level 0.6200 (target for the completion of the active impulse wave (iii)).
Eco Data 10/11/22
[php_everywhere instance="1"]
EUR Under Pressure Again
Early in another week of October, the major currency pair is falling. At the moment, EUR/USD is balancing around 0.9720.
Global capital markets are trying to escape risks amid recession concerns and this fact makes the “greenback” attractive again. On the other hand, the Euro is getting a huge hit from external economic stress – the upcoming heating season in Europe and many problems around it.
Last Friday’s statistics on the US labour market in September turned out to be better than expected. As a result, the US FOMC has a good reason to continue tightening its monetary policy – the employment sector is stable.
The Unemployment Rate dropped from 3.7% in August to 3.5% in September, while the Non-Farm Payrolls shoed 263K against the expected reading of 248K.
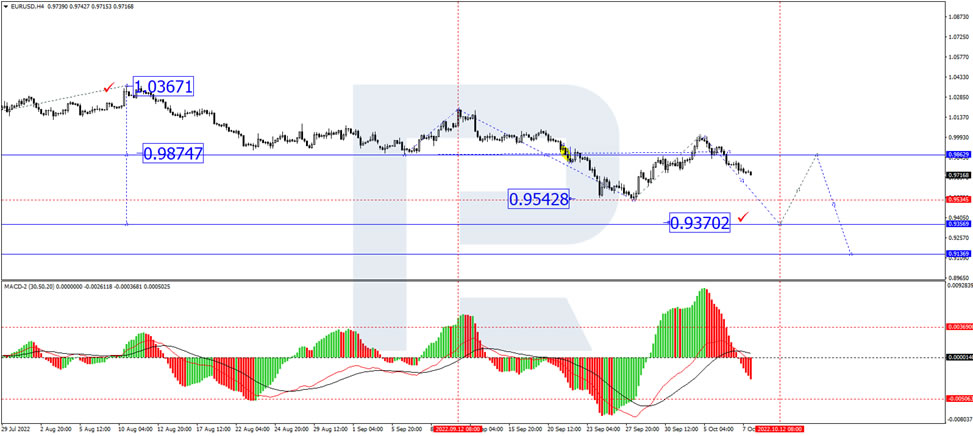
In the H4 chart, after rebounding from 0.9990, EUR/USD is forming a new descending wave towards 0.9360; right now, it is forming the first structure of this wave with the predicted target at 0.9680 and may later consolidate there. In the future, the asset may break the range to the downside and resume falling to reach 0.9360. From the technical point of view, this scenario is confirmed by MACD Oscillator: having broken 0 downwards, its signal line continues falling to update the lows.
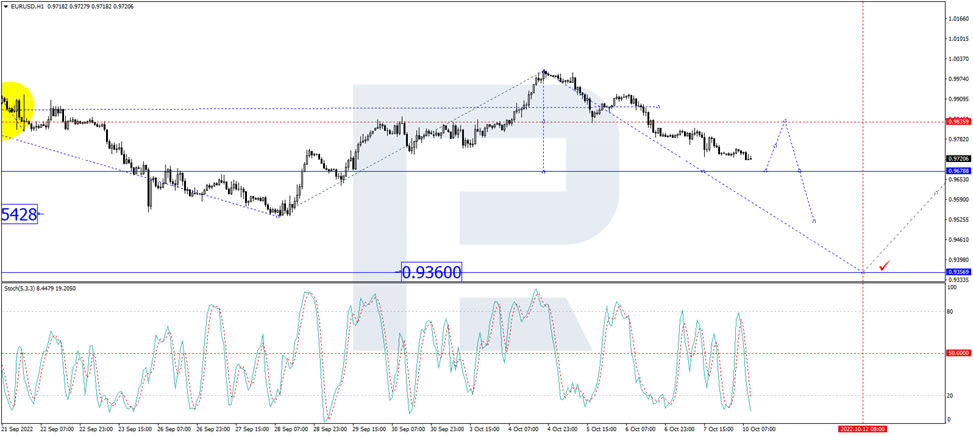
As we can see in the H1 chart, having finished the descending structure at 0.9815 and forming a new consolidation range there, EUR/USD has broken it downwards; right now, it is still falling and forming another descending structure towards 0.9700. After that, the instrument may start a new correction to test 0.9815 from below and then resume falling with the target at 0.9630. From the technical point of view, this idea is confirmed by the Stochastic Oscillator: its signal line is falling towards 20.
Sunset Market Commentary
Markets
The Bank of England gave an update on its temporary and targeted intervention in the long term UK Gilt market. Since Wednesday 28 September, it offered to buy up to £5bn of bonds on a daily basis to restore market functioning and reduce risk from contagion to credit conditions for UK households and business. They were forced to intervene after the announcement of lavish fiscal spending plans in a mini budget by UK Chancellor Kwarteng. The bond purchases would cease on October 14. Up until now, the BoE spent £5bn out of a maximum £40bn. Therefore, they are willing to deploy unused capacity in case necessary this week. Secondly, the BoE launches a Temporary Expanded Collateral Repo Facility (TECRF; until November 10) to enable banks to help to ease liquidity pressures facing their client LDI funds through liquidity insurance operations (more collateral acceptable than under the Sterling Monetary Framework). Other liquidity-enhancing facilities include long term repo operations and the short term repo facility. In other related news, UK Chancellor Kwarteng said that he will deliver his medium-term fiscal strategy with forecasts endorsed by the UK budget watchdog on October 31 instead of November 23. That enables the Bank of England to fully take them into account when they meet next on November 3. Today’s announcement didn’t help to stop the rot in the Gilt market. UK sovereign yields added 10 to 17 bps across the curve with the very long end underperforming. The UK 30-yr yield surpassed the 4.5% mark for the first time since the start of the buying operations end last month. Sterling manages to hold its nerve against a rather weak euro with the pair going nowhere near EUR/GBP 0.8775.
Trading on other markets occurs in lower volumes with US investors off for Columbus Day. Eco calendars are blank. European stock markets opened bad in response to the US on Friday and Asia this morning. Russian retaliation against Ukraine surprisingly didn’t add to the grim atmosphere. On the contrary, most bourses managed to erase opening losses to currently trade flat on the day. EUR/USD still abides to the laws of gravity with the pair giving up the 0.97 big figure. The end of September sell-off lows stands at 0.9536. The German yield curve steepens with yields dropping 3 bps at the front end and rising up to 5 bps at the very long end. We retain comments by hawkish Dutch ECB governor Knot who argued in favour of at least two more significant rate hikes while adding that he doesn’t expect QT to start before 2023.
News Headlines
Norwegian inflation quickened considerably in September. Headline prices rose 1.4% m/m, double the pace expected, to be up 6.9% y/y (vs 6.2%). The Norges Bank had penciled in 6%. Core inflation came in at 1% m/m and a record 5.3% on a yearly basis. The Norwegian krone rallied from EUR/NOK 10.44 to 10.36 currently and Norwegian swap yields add up to 10 bps at the front of the curve. At the most recent meeting, the Norges Bank hiked by 50 bps to 2.25%. It added that a more gradual approach (ie 25 bps moves) may be appropriate for policy going forward. Markets highly doubt the NB’s ability to slow down the tightening pace and question the projected terminal rate of 3% “in the course of the winter”. Current market pricing suggests a peak policy rate of 3.75/3.5%.
The Hungarian forint sank to yet another record low vs the euro (and the dollar). EUR/HUF jumps 5 big figures to 427.78 after Hungary revealed its trade gap widened to 1.3bn euros in August, the biggest since the euro was introduced. It’s part of a twin deficit, with government budget shortages also swelling to a record 2.7bn HUF in the January-September period. Soaring energy prices and unrelenting HUF weakness will probably deepen both deficits in coming months. The numbers put PM Orban’s Hungary in a tough spot and heap pressure to phase out several costly spending measures, including price caps on the likes of fuel, food and household energy. Other CE currencies (Polish zloty, Czech crown) are also under pressure during today’s risk-off session but losses are less dramatic.