Sample Category Title
USD/JPY Daily Outlook
Daily Pivots: (S1) 144.29; (P) 144.60; (R1) 145.14; More...
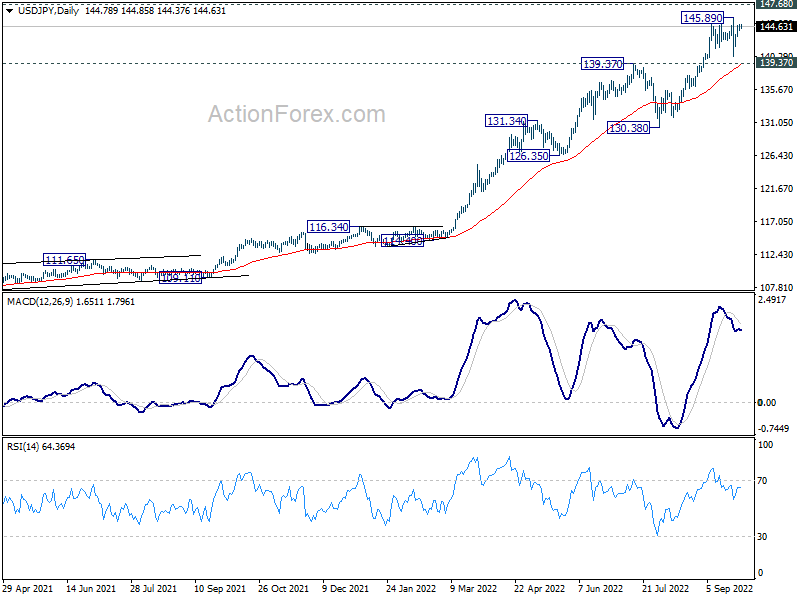
USD/JPY is still bounded in consolidation and intraday bias stays neutral. Further rally is expected as long as 139.37 resistance turned support holds. Break of 145.89 will target 147.68 long term resistance. On the downside, however, decisive break of 139.37 will confirm short term topping. Deeper decline would be seen back towards 130.38 support.
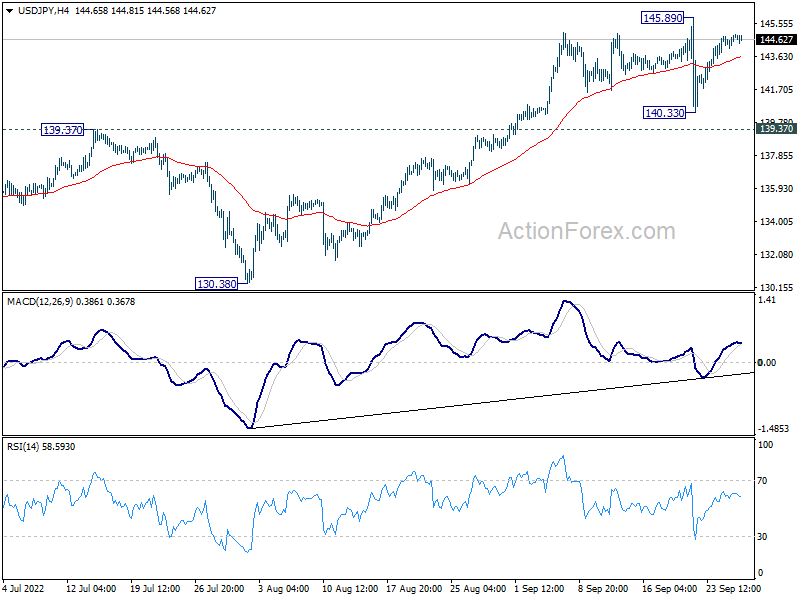
In the bigger picture, up trend from 101.18 is still in progress, as part of the whole up trend from 75.56 (2011 low). Further rise should be seen to 147.68 (1998 high). For now, break of 130.38 support is needed to be the first indication of medium term topping. Otherwise, outlook will stay bullish even in case of deep pull back.
USD/CAD Daily Outlook
Daily Pivots: (S1) 1.3651; (P) 1.3713; (R1) 1.3787; More...
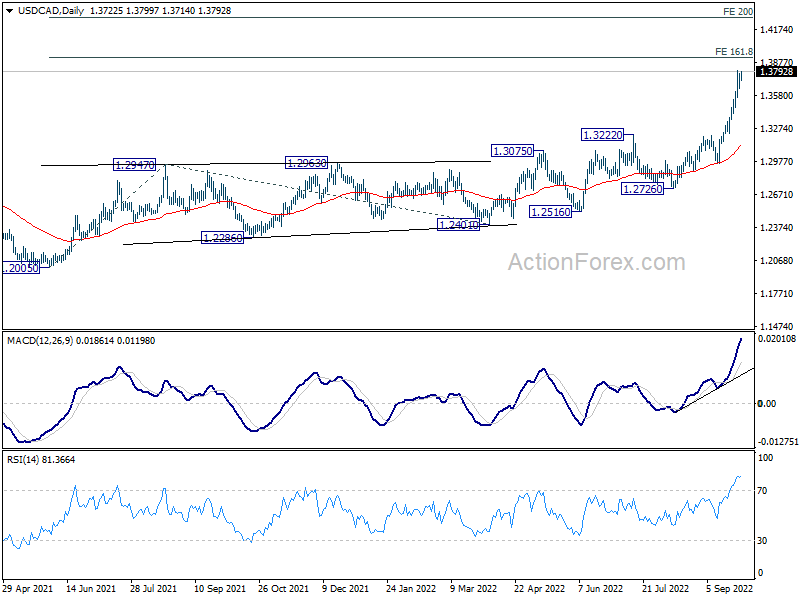
Intraday bias in USD/CAD stays on the upside for the moment. Current rally should target 161.8% projection of 1.2005 to 1.2947 from 1.2401 at 1.3925. Firm break there will target 200% projection at 1.4285. On the downside, below 1.3638 minor support will turn intraday bias neutral and bring consolidations first, before staging another rally.
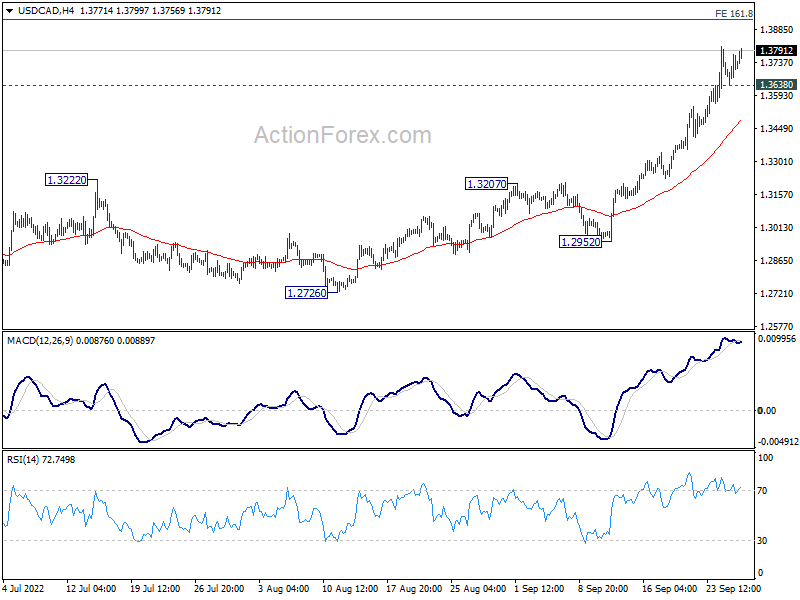
In the bigger picture, up trend from 1.2005 (2021 low) is still in progress. Based on current impulsive momentum, it could be resuming long term up trend from 0.9056 (2007 low). Whether it is or it isn't, retest of 1.4689 (2016 high) should be seen next. This will now remain the favored case as long as 1.3222 resistance turned support holds.
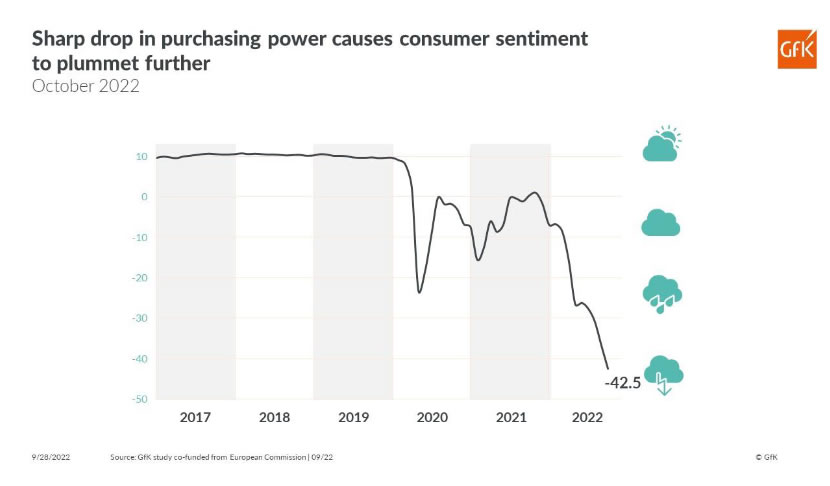
Germany Gfk Consumer Sentiment dropped to -42.5, new record low
Germany Gfk Consumer Sentiment for October dropped from -36.5 to -42.5, below expectation of -38.8. That's also a new record low. In September, economic expectations dropped from -47.6 to -21.9, lowest since 2009. Income expectations dropped from -45.3 to -67.7, a record low since 1991. Propensity to buy dropped from -15.7 to -19.5, lowest since 2008.
"The current very high inflation rates of almost eight percent are leading to large real income losses among consumers and thus to significantly reduced purchasing power," explains Rolf Bürkl, GfK consumer expert.
"Many households are currently forced to spend significantly more money on energy or to set money aside for significantly higher heating bills. Accordingly, they need to cut back on other expenses, such as new purchases. This is sending consumer sentiment plummeting to a new record low."
The CAD vs. the World: Mid-Term Scenarios for the Currency
In the middle of September 2022, the Canadian dollar has fallen to a 2-year low against the USD. What are the reasons behind this performance? On the one hand, we have rising inflation in the United States, recession fears, and anticipation of more aggressive Fed monetary policy decisions. On the other hand, softer economic data for August in Canada hints at a possible pause in the Bank of Canada's rate hikes. As a result, traders may see the Canadian dollar’s weakness in the upcoming months. Let’s look at the situation in detail.
Canada’s Economic Outlook and BOC Monetary Policy
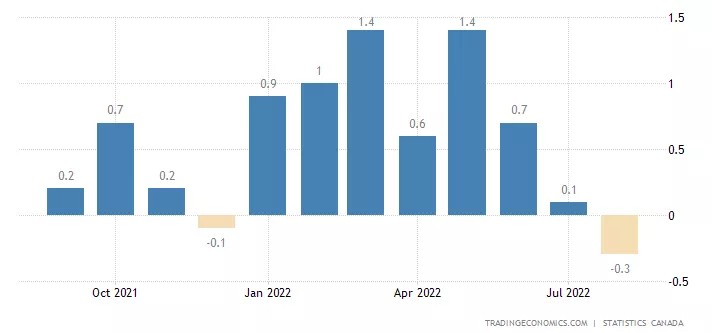
The economic data for August showed the first results of the Bank of Canada’s tight monetary policy. In August, the employment fell by 39.7K (vs. the forecast of +15K), and the unemployment rate was higher than the consensus (5.4% vs. 5.0%). At the same time, the headline CPI growth declined by 0.3%, lower than the expectations by two basis points.
Meanwhile, the Bank of Canada unveiled a massive rate hike by 75 basis points on September 7, pushing the rate to 3.25%. One may expect that the shift in the employment and inflation trends to the downside will push the Canadian regulator towards softer policy decisions. However, certain moments require attention. First, the losses in the labor market mainly were contributed by the education sector (50 000 jobs lost). That happens because the teachers' contracts expire before autumn. As a result, the figures might have returned to normal once the school year started.
As for the slowdown in inflation, at least three months of consecutive declines should happen to confirm the trend. It's essential to remember that the risks of higher inflation add to the uncertainty around energy prices amid the crisis in Europe and drought in China, the US, and Europe that can push global food prices higher.
Given the above, it's doubtful that the Bank of Canada will start monetary policy easing in the next few months. According to the BOC statement, the outlook for short-term inflation remains high. If the BOC shifts its inflation outlook to the downside, it will signal changes in its policy. For now, the market is pricing in the 50-basis-point rate hike by the Canadian regulator during the meeting on October 26. More interest rate increases are expected up until August 2023.
Despite the fact that the Canadian regulator will stick to the hawkish stance, there’s another dominant power that presses the CAD and other currencies. Of course, we are talking about the American currency. The hawkish Fed policy and global instability in the markets push investors, businesses, and households to turn to a more flexible and liquid USD. This way, they are hedging their capital against global risks.
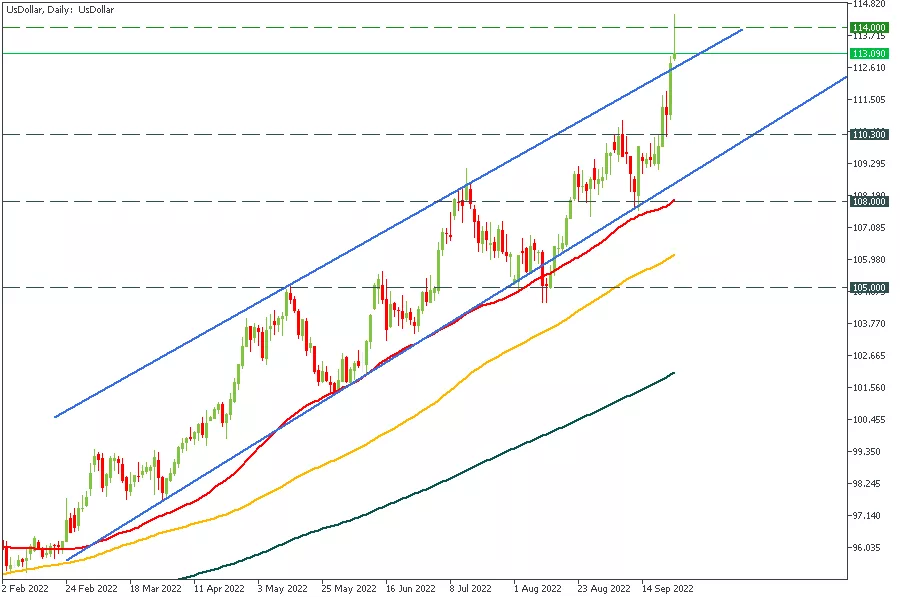
On September 26, the US Dollar index broke above the upper border of the ascending trading channel and tested the 114 level.
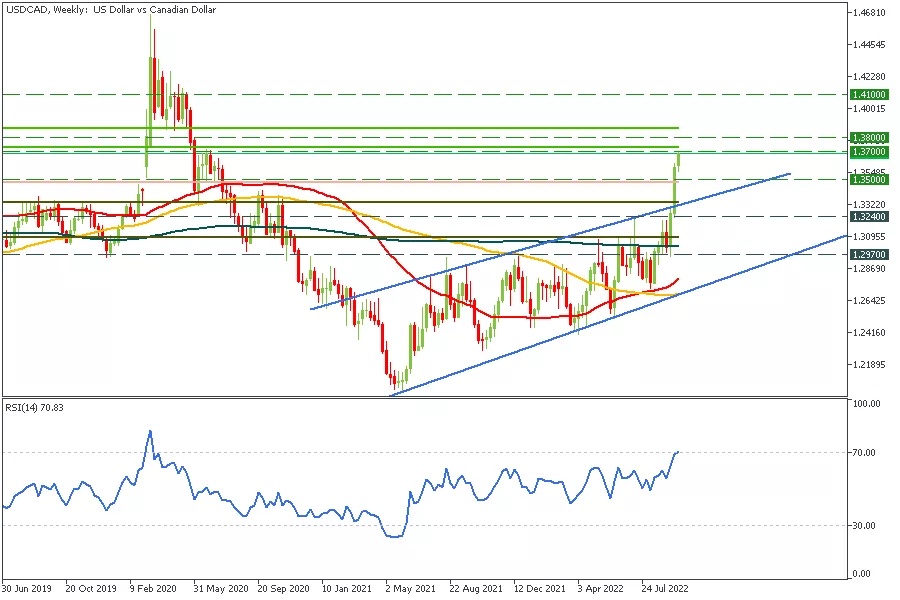
As for USDCAD, the pair tested the resistance zone of June 2020 on September 26. Looking at the weekly timeframe, we can see that the pair has almost tested the weekly pivot resistance line near 1.3700. After the breakout of this level, we may expect a further rise towards 1.38. Here, we can see a pullback towards the recent border of the channel at 1.3350. However, if the breakout of the 1.3800 level happens, the next target for buyers will lie at 1.4100. On the downside, the support lies at 1.3500.
What about crosses?
So, USDCAD is set to rise. But what about other currency pairs? Apparently, the current economic situation in Canada, compared to the unstable situation in Europe and Great Britain, supports the loonie in crosses. The charts below will provide you with a mid-term outlook for the most famous cross pairs.
GBPCAD
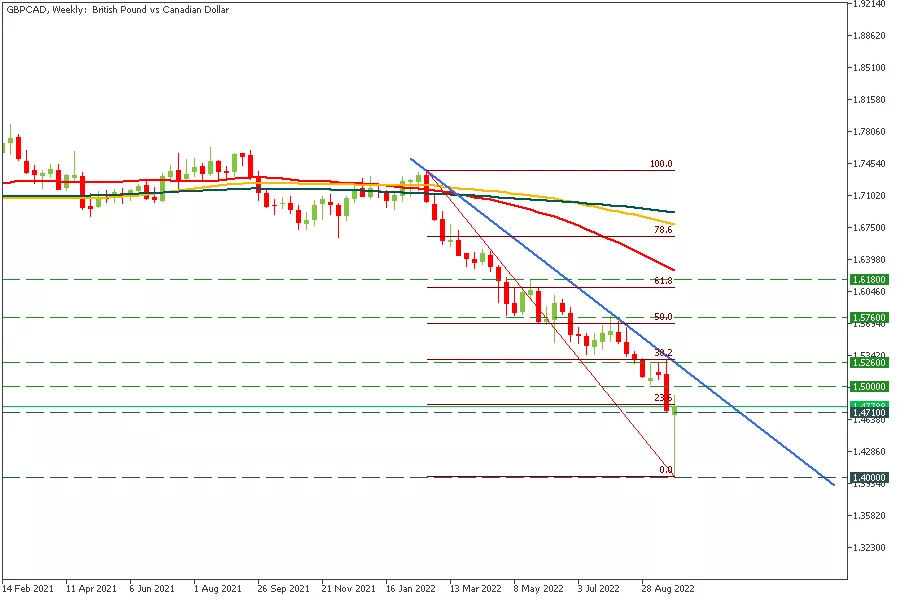
The pair lost more than 4.5% on Monday with a long squeeze due to the GBP weakness. We can expect it to restore its positions and move higher towards the resistance lines at 1.5000 and 1.5260 (38.2 Fibo level). Here we may see a retest of the ground below 1.4710 or a prolonged consolidation, given the pound's weakness. If the Canadian dollar softens, the breakout of the 1.5260 level with a further rise towards 1.5760 (50 Fibo level) will be in focus.
EURCAD
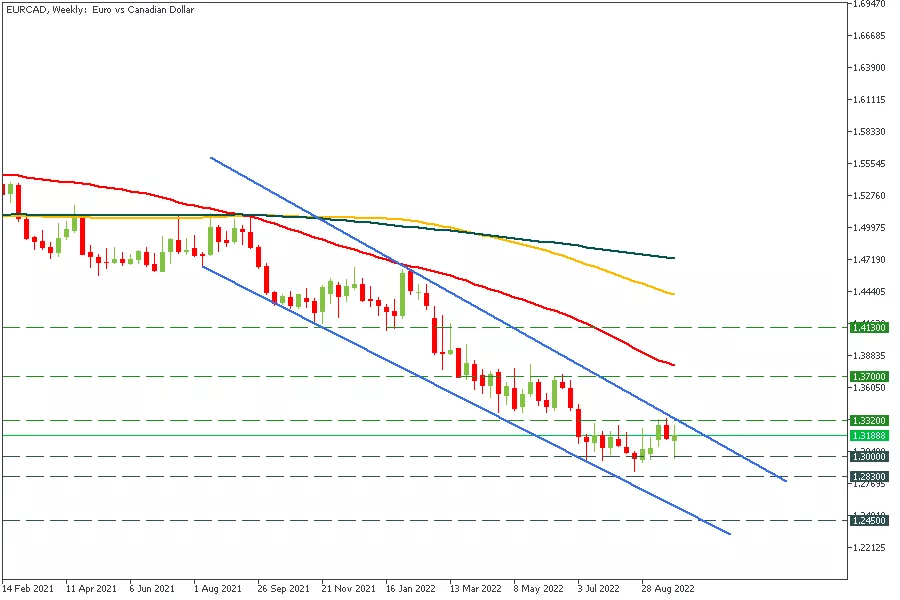
The pair has been moving within the descending channel. After consolidating 1.3320 and 1.3000 levels, we may expect a further plunge to the support zone at 1.3000-1.2830. The next support will lie at 1.2450. However, RSI shows a bullish divergence, so the breakout of the resistance at 1.3320 will confirm the strengthening of the pair towards 1.37 (50-week SMA).
CADJPY
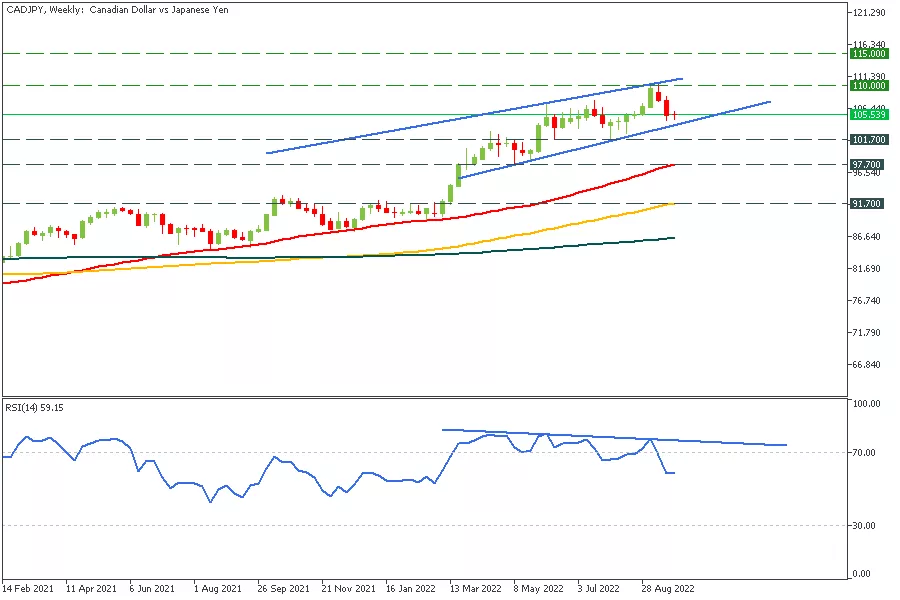
The pair has formed a bearish divergence with RSI. If it breaks the lower border of the channel and the support at 101.70, the support at 97.70 will be in focus. On the contrary, a strike above 110 will push the pair to 115.
Conclusion
The Canadian dollar seems like a good “buy” option for cross pairs’ traders these days as Canada’s economy remains relatively strong compared to European and British ones. Still, you must follow the employment and inflation updates and the BOC monetary policy decisions, which will be the primary determinants of the loonie's mood. The CAD will go lower if the BOC changes its attitude towards rate hikes.
RBA Board to Raise the Cash Rate by 50 Basis Points Next Week
We confirm our view that the cash rate will increase by 50 basis points next week – global interest rates have risen further and the cash rate is still below the RBA’s estimate of neutral.
The Reserve Bank Board meets next week on October 4.
We expect it will decide to raise the cash rate by a further 50bps to 2.85%. Readers will be aware that on September 19 we changed our forecast for the October meeting from a 25bp increase to a 50bp increase.
Global interest rates have lifted significantly since the last Board meeting on September 6 and the speech to the Australian Business Economists on September 8.
Westpac has raised its forecast for the terminal federal funds rate from 3.375% to 4.625% (up 125bps). This change occurred in the aftermath of the August inflation report for the US on September 14 (up 75bps) and the FOMC meeting on September 21 (up a further 50bps).
While we have argued strongly that the RBA Board should slow the pace of increases once it has reached a neutral setting there was always some uncertainty as to whether the current starting point for the meeting, 2.35%, was sufficiently close to neutral to justify the scale back.
The Governor and Deputy Governor have opined on several occasions that real neutral is at least zero and using long run measures of inflationary expectations as a guide to the nominal component (2.5%) then neutral is at least 2.5%.
Given this view and in light of the rise in global rates, it seems sensible to push the cash rate to 2.85% in October, taking it comfortably above the neutral benchmark before scaling back the pace of rate increases.
Note that the RBA Governor’s appearance before the House of Representatives Standing Committee on Economics on September 16 came after the US inflation print and the upgraded outlook for the federal funds rate and may be a more reliable guide to the Board’s inclinations.
At that inquiry, in our view, he appeared to be more hawkish than at the two earlier public events.
He emphasised his key challenge: “The general inflation psychology does appear to be shifting. It’s easier for firms to put their prices up, and the public is more accepting of this.”
He was more circumspect: “… at some point we’ll obviously not need to be increasing rates by 50bps at each meeting, and we’re getting closer to that point.”
And since the hearing we have seen another upgrade of the outlook for the federal funds rate by a further 50bps following the September FOMC meeting.
By lifting our forecast for the October meeting from 25 to 50bps we lifted our forecast for the RBA terminal rate by 25bps to 3.6% compared to a 125bp increase to our federal funds rate outlook to 4.625%.
Consequently, we now have the federal funds rate peaking 1.025% higher than the RBA peak.
The adjustment to the spread is taken in the currency and the margin between US and Australian long term bond rates. Relative to before the US inflation report we have revised down our end 2022 target rate for the AUD from USD0.73 to USD 0.65 – a US8c downward revision in the AUD.
We also revised down our target spread between AUD and USD long bonds from 40 basis points to 10 basis points.
The adjustments reflect the forecast widening of the terminal cash rate / federal funds rate spread by 100bp.
That widening results from our strong expectation that the RBA WILL slow the pace of the tightening at the November Board meeting to 25bps.
The Board will have responded to the sharp increase in the outlook for global rates; pushed the cash rate firmly into contractionary territory and slowed the pace to reflect its concerns about the lag to the impact on the economy of the accumulated rate hikes.
Rate hikes are expected to continue out to February 2023 as the December inflation report is likely to show consumer prices lifting strong in the December quarter, we expect a 2.5% jump in the headline and a still hefty 1.2% rise for underlying inflation.
If we are wrong and the terminal differential between the cash rate and the federal funds rate has to narrow by further than the 100 bp’s we now envisage, then it is likely to mean an extension of the RBA’s 25bp increases beyond February.
White House Downplaying Prospects of Agreement à la Plaza 1985
Markets
The core bond relief couldn’t even last for a full day. The most eyepopping move occurred in UK markets, where the 2y yield at some point fell almost 40 bps but eventually closed 7.7 bps higher. The long end surged another 45 bps. Short term yields in the US were still down 4.1-6.1 bps but faced losses that were more than double earlier in the day. Europe’s swap curve steepened with gains of 2.4 bps (2y) to 14 bps (10y; now comfortably above 3%). This impressive intraday yield turnaround occurred organically, starting around noon but was reinforced by reports about allegedly sabotaged leaks to the Nord Stream pipelines (pushing gas prices up by 25% at some point) and warnings that Russia may cut supplies via Ukraine – the last link that still delivers some to western Europe. Fed’s Bullard stressing the pressing need for more decisive rate action in order to restore credibility added oil to the fire. Stocks gave up initial gains to finish 0.4% lower in Europe. In the US only the Nasdaq was able to close in the green (+0.25%). Dollar weakness also reversed during the day. The trade-weighted closed at 114.1. EUR/USD finished just south of 0.96. The yen continued to flirt with 145; the level that prompted FX interventions last week. Sterling recovered a tad of previous losses. EUR/GBP was down from 0.899 to 0.894. Cable rose to 1.073.
It’s business as usual in Asian dealings. King dollar roars again, helped by the White House downplaying prospects of an agreement à la Plaza 1985 to counter the strong greenback. That’s no surprise as this helps to dampen inflation. EUR/USD is testing the previous intraday YtD low/support at 0.955. DXY advances to 114.6. The yuan falls to the lowest level against the dollar since 2008 (7.22). “Business as usual” also includes higher core bond yields (US adds 2-3 bps across the curve) and declining equities (South Korea underperforms with losses of more than 3%).
It’s again speech fest on the economic calendar today. Central bankers from both sides of the Atlantic participate in the inaugural Frankfurt Forum on US-European Geonomics today. The (role of the) euro and the dollar are among the discussion topics. We don’t think it will affect the current market dynamics though. The US10y already tested the symbolically important 4% hurdle this morning and we look out for a break higher. After securing the 3% barrier, the 10y European swap rate is headed for the 2011 high at 3.67%. EUR/USD is back at the lower bound of the downward trend channel and lost support of the 2001 interim high (0.9594). We cannot exclude a break lower given the unabating dollar strength. Equity futures point to a lower opening to the tune of 0.7%.
News Headlines
The Irish government yesterday announced what it called two budgets in one. The government upwardly revised its forecast for 2022 modified domestic demand to 7.7%, but this is expected to slow sharply in 2023 (1.2%). For this year the government expects a budget surplus of €1 bln and the surplus is expected to rise further to €6.4 bln next year, due to higher revenues, including revenues from VAT, income tax and corporate tax. This surplus allowed the government to take measures to ease the cost of living crisis. A total of €11 bln spending is made available consisting of €4.1 bln one-off measures and €6.9bln permanent budget measures. The one-off measures include businesses receiving up to €10.000 p/m for energy bills while households will receive €600 electricity credits. The permanent measures include raising the threshold for the highest income tax rate from € 36 800 to 40.000, amongst others.
The IMF on Wednesday said that the new proposals of the UK government would likely increase inequality. An IMF spokesman in response to a query from Reuters was quoted: ‘Given elevated inflation pressures in many countries, including the UK, we do not recommend large and untargeted fiscal packages at this juncture, as it is important that fiscal policy does not work at cross purposes to monetary policy.’ The Fund suggested that the government in its November budget should consider ways to provide support that is more targeted and reevaluate tax measures for higher income earners.
Fed May be Making a Second Big Mistake, as Geopolitical Tensions with Russia Escalate
The Russian natural gas is now bubbling somewhere in the Baltic Sea, being wasted in front of the horrified eyes of hundreds of millions of Europeans suffering from a historical energy crisis.
Why? Well, we don’t know exactly why, but two explosions were detected in the area, and damaged the Nord Stream pipeline system.
Does it look like an accident? Regarding the geopolitical context: not really. And Germany and the US suspect that it’s a sabotage from Russians rather than a technical issue.
Good thing is, there was no gas flowing through the pipeline anyway, as Russia cut the European gas weeks ago.
Bad things is, damaging the infrastructures clearly pushes the tensions between the West and Russia to a no-turning point, and dashes hopes of seeing an improvement anytime soon – both on the geopolitical and on the energy front.
The European natural gas prices, which have been coming down since the end of August peak, jumped 17% yesterday, while crude oil gained 2.30% on news that Russia now wants OPEC+ to cut output as deadlines to implement Russian fuel bans approach.
Interestingly, even if the barrel of crude flirted with the $80 offers following the tasty mix of Russian news, gains in crude remained limited.
This is a sign that the pricing in oil markets is mostly driven by the demand sign concerns as the rapid policy tightening from the Federal Reserve (Fed) - which leads to an unbearable rally in the US dollar, and applies an unsustainable pressure on other currencies and their central bank policies - is now destroying the global oil demand prospects, and even the news of lower OPEC output can’t bring the oil bulls back to the market.
But it’s all good, says Bloomberg, Europe has enough liquified natural gas to get through winter without Russia. And then?
Here, have some more tensions
Plus, if the escalation on the energy front is not enough, governments of the four Moscow-occupied areas of Ukraine have all declared victories in the referendums with, of course, an unprecedented majority of residents saying YES to joining Russia.
After the chaos in Britain and the far-right victory in Italy, we now have mounting tensions with Ukraine – and we are only Wednesday!
FX markets continue boiling
The mounting tensions with Ukraine and the spike in nat gas prices fuel the European inflation expectations, but in vain. The EURUSD is pushing lower against the US dollar as recession worries mount.
Bloomberg Economics say that we will see at least a 1% drop in the European GDP starting from the Q4, and we could see the economic contraction fall as much as 5% ‘if the coming months turn especially icy’ and the European nations ‘fail to share fuel supplies’.
These numbers are as bad as the 2009 recession. But what was better in 2009 is: central banks had room to act to save the day, by slashing rates to zero, and pumping trillions in the system by buying huge quantities of sovereign bonds and saying ‘WHATEVER IT TAKES’. Now it’s different. The European Central Bank (ECB) is expected to hike the interest rates by 75bp in the next two meetings, the German 10-year yield spikes above 2.20% from below 0% at the start of the year. And even then, the euro is set to test the 0.95 against the US dollar and slip below this level.
Similarly, the pound remains under a decent selling pressure as the Bank of England (BoE) officials are pushing the can down a very steep road, saying that it’s more appropriate to wait 5 WEEKS before taking action.
Meanwhile, the IMF now warns the UK that they DO NOT RECOMMEND splashing untargeted fiscal money while inflation remains elevated in the world, and in the UK. They emphasize that it is important that fiscal policy doesn’t work at cross purposes to monetary policy.
The IMF basically says: you, guys, are going to get severely burnt if you continue doing what you are doing.
But in vain. Liz Truss probably won’t stop until she gets burnt. Good news is, she will get burnt very, VERY quickly. But until then, we will see the UK dive a bit further. The speed at which the UK’s yield curve shifts higher is almost as scary as the little girls in the Japanese horror movies.
And beyond the troubled euro, pound, and horror movies
Even the safe haven assets are out of action right now. I no longer talk about yen as a safe haven currency, as the Bank of Japan’s (BoJ) uncomfortably dovish stance will certainly continue pushing the dollar-yen higher, with temporary pauses if the BoJ intervenes directly in the FX markets - which could create interesting dipbuying opportunities for those who have the guts to swim against the BoJ.
The dollar-swissy, on the other hand, is about to test parity. The Swiss franc is still cool, but not as COOL as the US dollar.
Elsewhere, gold trades in tandem with other risk assets, under the unbearable pressure of a relentlessly stronger US dollar. If gold prices follow an ABCD pattern since 2011, we could even see the price of an ounce fall to $1260 an ounce.
I am not saying that will happen, but technically it is possible. What could save gold, which failed to be a good hedge against both a market rout, a war and skyrocketing global inflation this year? An eventual slowdown in rising yields… maybe?
Fed is probably making a second big mistake
But even then, the Fed officials are pushing hard to make sure no one breaths.
James Bullard said that he sees interest rates going to the 4.5% range, which is a full percentage point higher than this projection back in April.
Neel Kashkari, who was normally a dovish Fed member, also falls for the dark side saying that the Fed moves are ‘appropriately’ aggressive.
While Charles Evans sees interest rates peaking at 4.50-4.75%, but at least he says he is getting ‘a little nervous about going too far, and too fast with the rate hikes’.
And it’s possible. Squeezing the world economy like a lemon may not be the greatest idea, and going this fast given the world context – the war, the energy crisis – will not make up to the fact that the Fed waited too long before acting against inflation last year.
So, it is well possible that after having wrongly insisting that inflation was ‘transitory’, the Fed could now make a second Big Mistake of tightening beyond-appropriate.
Europe’s Gas Crisis Escalates
Market movers today
Market's focus remains on central bank speeches, with ECB's Lagarde as well as Fed's Powell, Bostic, Bullard and Evans on the wires today.
Economic data calendar is quieter, August retail sales data will be released for Sweden and Norway while consumer confidence indicators are due for release for Germany, France and Sweden.
The 60 second overview
Gas: European natural gas prices rose yesterday following the wrecking of three major natural gas pipelines. At the time of writing, the cause of the incident remains unclear, but the natural gas market will monitor closely results of investigations to gauge the implications for European energy security.
UK: Bank of England's Chief Economist, Huw Pill, yesterday warned a significant monetary policy response was needed to counter fiscal easing, but played down the possibility of intermeeting action.
Oil: Oil prices rebounded yesterday as the oil market weighs the possibility OPEC+ may announce more production cuts at next week's meeting amid the recent slide in oil prices and following the mostly symbolic 100kb/d output cut last month.
FI: Global rates seem to be in a search for an anchor of stability or even just some sort of handle as uncertainty is extremely elevated and Gilts markets are setting the scene. Gilts were again in focus, in particular in the latter part of the session where the long end sold off rapidly. 30y Gilts rose above 5% for the first time in 20y (+44bp on the day) amid today's 30y green bond issuance. German 10y bunds rose 11bp on the day to 2.23%. The German ASW spreads have widened markedly during the past week and the Bund ASW is not above 95bp.
FX: EUR/USD dropped below 0.96 yesterday, where broad USD rose further and spike in natural gas prices weighed on EUR. USD/JPY inched closer to the 145 level again as 10Y US Treasury yields continue to climb. EUR/SEK and EUR/NOK were broadly stable over the day.
Credit: Credit spreads as measured by CDS indices ended yesterday wider mirroring the overall soft sentiment, with iTraxx Main wider by 4bp to 138bp while Crossover was wider by 15bp to 670bp. For reference, iTraxx Main is now back at the Covid-peak, while Crossover has another c.40bp to go. The Euro primary market saw continued drip wise issuance, with Sydbank printing a EUR500m 3NC2 senior non-preferred deal.
Nordic macro
Sweden: Riksbank Deputy Governor Jansson speaks about monetary policy at a breakfast seminar 08.00 CET. It should be less interesting as he has to stick to the Board's common message ahead of the release of the Minutes later this week.
The NIER September confidence survey is more likely to be a market mover, with manufacturing confidence still very high, private services and construction close to neutral while retail is clearly below normal and consumer confidence at a 30-year low. Expect further declines in most cases. Hiring plans and price expectations will be in focus. Both are at cyclical highs with a tendency to turn lower.
August retail sales may not sound so hot, but may reveal another leg down from the -3.9 % yoy reported in July. There are signs of significant August weakness in for instance clothing and shoe sales as suggested by the STIL flash apparel index. That in turn would suggest a downside risk for the broader consumption indicator.
Norway: Retail sales has naturally been under pressure from the shift in consumption in favour of services following the reopening of the economy, as well as a general erosion of purchasing power due to stronger inflation and higher interest rates. Of course, a continued slide in private consumption is an important assumption for Norges Bank's recent signals of a more moderate tightening cycle.
Technical Outlook and Review
USD/JPY:
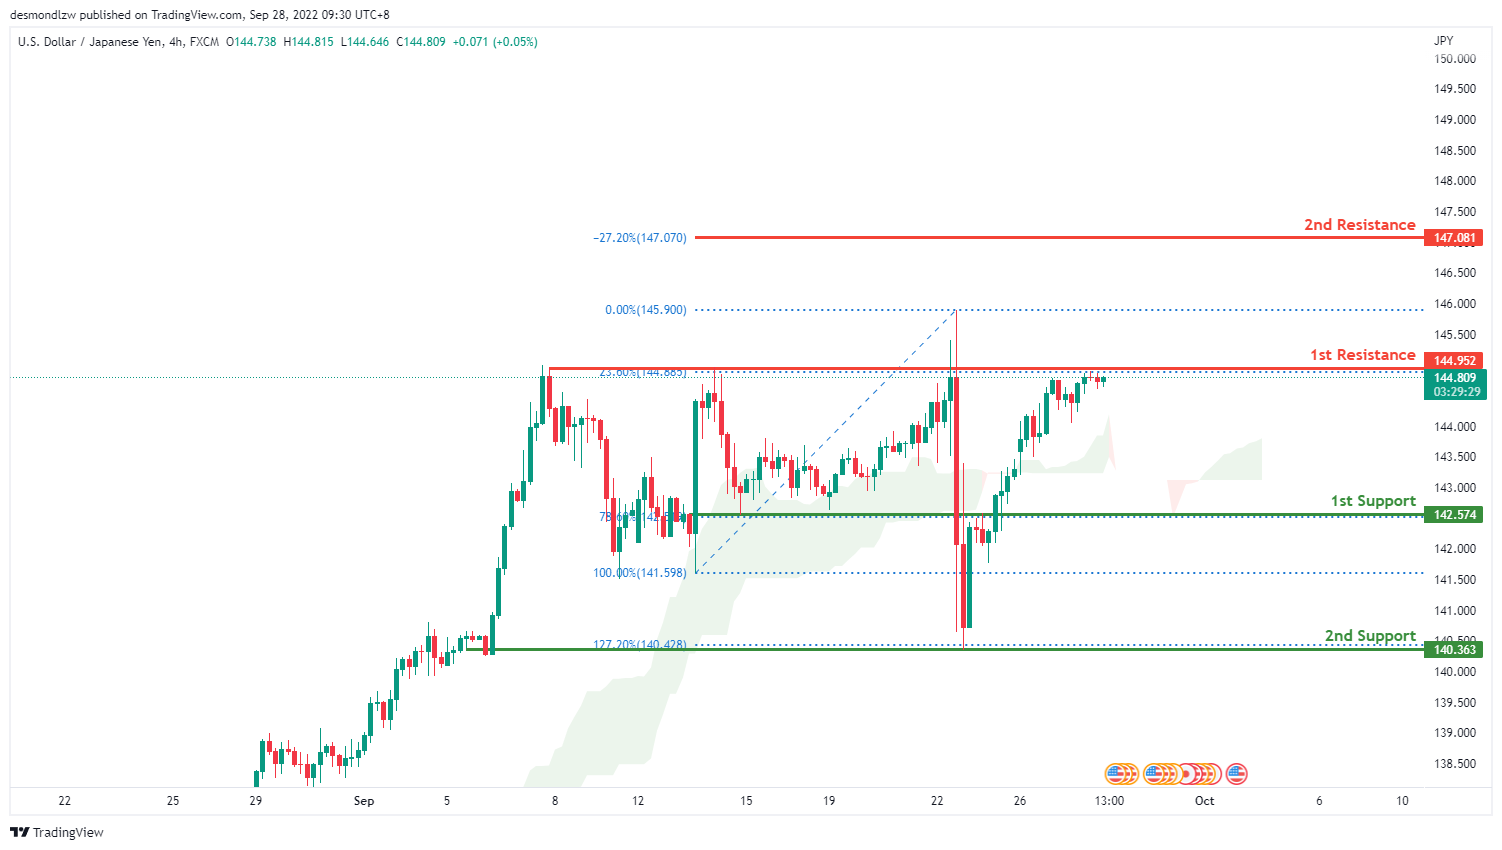
On the H4 chart, price has pushed through very strongly through the 1st support at 142.574 where the 78.6% Fibonacci line lies. Price has tapped and looks to be consolidating below the 1st resistance at 144.952 where the 23.6% Fibonacci line lies. Looking for price to potential break through the 1st resistance and head towards the 2nd resistance at 147.070 where the -27.2% Fibonacci expansion line is. Alternatively, price could reflect back down from the 1st resistance back down towards the 1st support at 142.574 where the 78.6% Fibonacci line is.
Areas of consideration:
- H4 time frame, 1st resistance at 144.952
- H4 time frame, 1st support at 142.574
DXY:
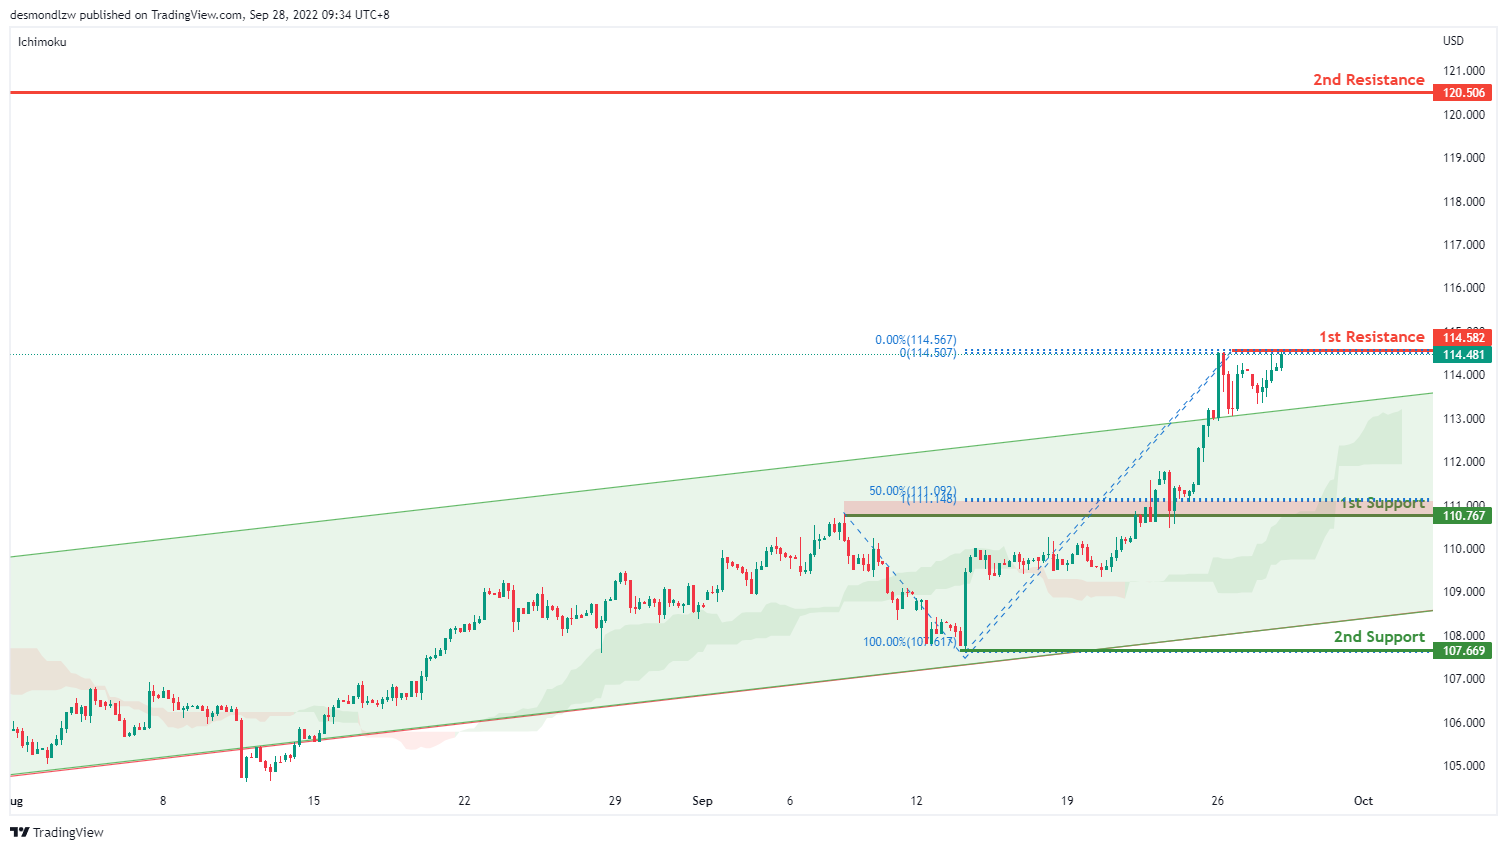
On the H4, price is still respecting the bullish channel and we are bullish bias. Price is currently testing the first resistance at 114.582 where the previous swing high sits. If it breaks this level, there is a confirmation for strong bullish momentum and price might test the second resistance at 120.506 where the previous swing high sits. Alternatively price could pull back to test the first support at 110.767 where the 50% retracement and 100% projection sits. If price breaks this support it should test the second support at 107.669 where the previous swing low sits
Areas of consideration:
- H4 time frame, 1st resistance at 114.582
- H4 time frame, 1st support at 110.767
EUR/USD:
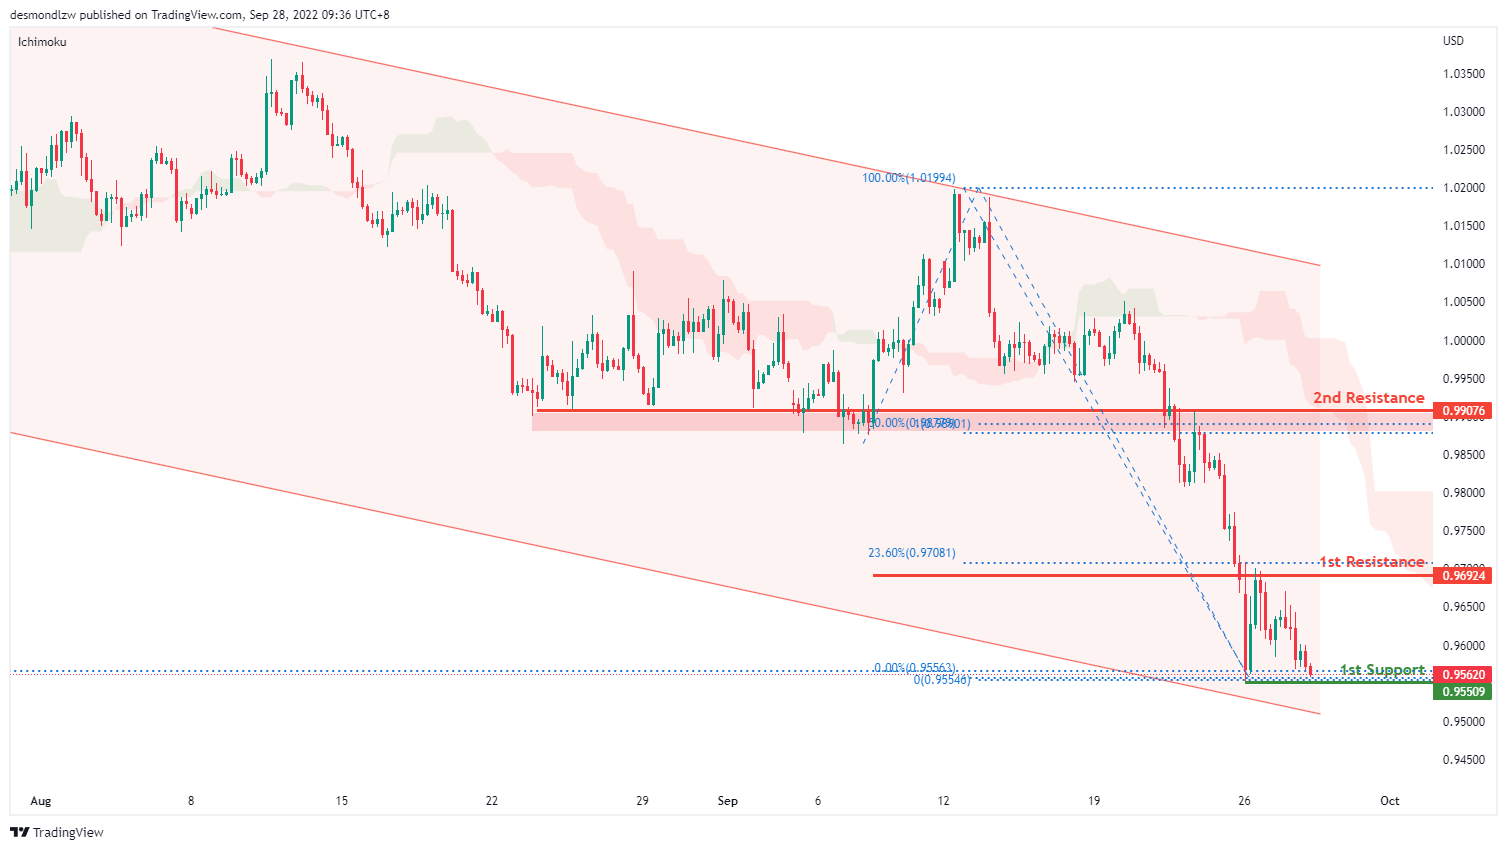
On the H4, price is moving within the channel in a descending manner- we are bearish biased. Price is testing the first support at 0.9550 where the previous swing low and 161.8% extension sits. If it breaks this level, we have a strong bearish confirmation to bring price down to 0.8497 levels where the previous swing low sits. Alternatively it might pull back to test the first resistance at 0.9692 where the 23.6% retracement and 145% extension sits, then the second resistance at 0.9907 where the 50% retracement and 100% projection sits.
Areas of consideration :
- H4 1st resistance at 0.9692
- H4 1st support at 0.9550
GBP/USD:
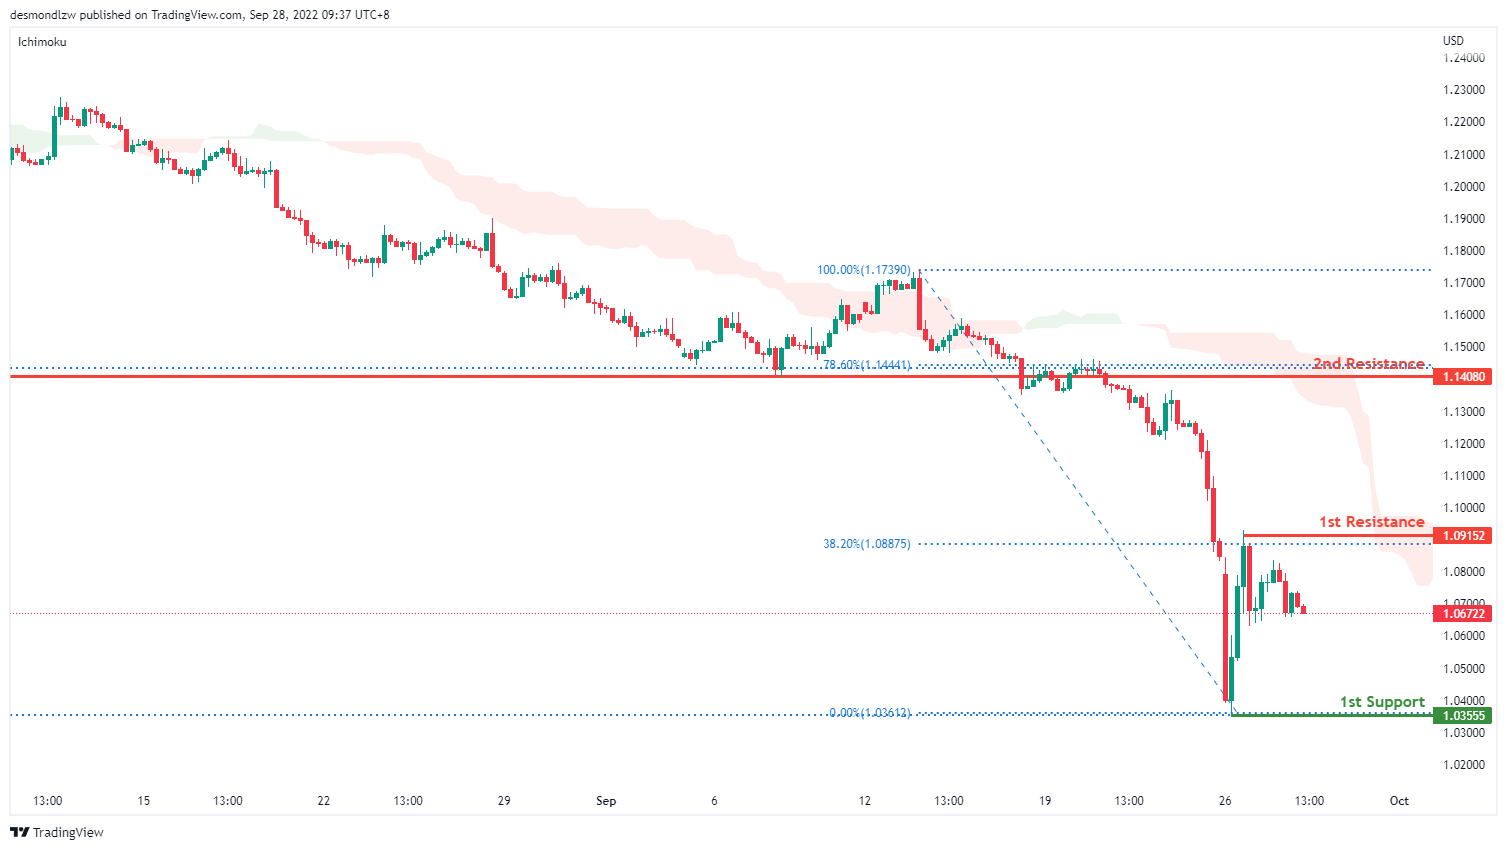
On the daily time frame, prices are still moving in a bearish momentum hence we are bearish biased. Price has already tested the previous swing low at 1.0355 where the 138.2% extension sits. If bearish momentum continues, it should bring price to 0.9665 where the 161.8% extension sits. Alternatively price could pull back to test the first resistance at 1.0915 where the 38.2% retracement sits then the second resistance at 1.1408 where the previous swing low and 78.6% retracement sits
Areas of consideration:
- H4 1st resistance at 1.0915
- H4 1st support at 1.0355
USD/CHF:
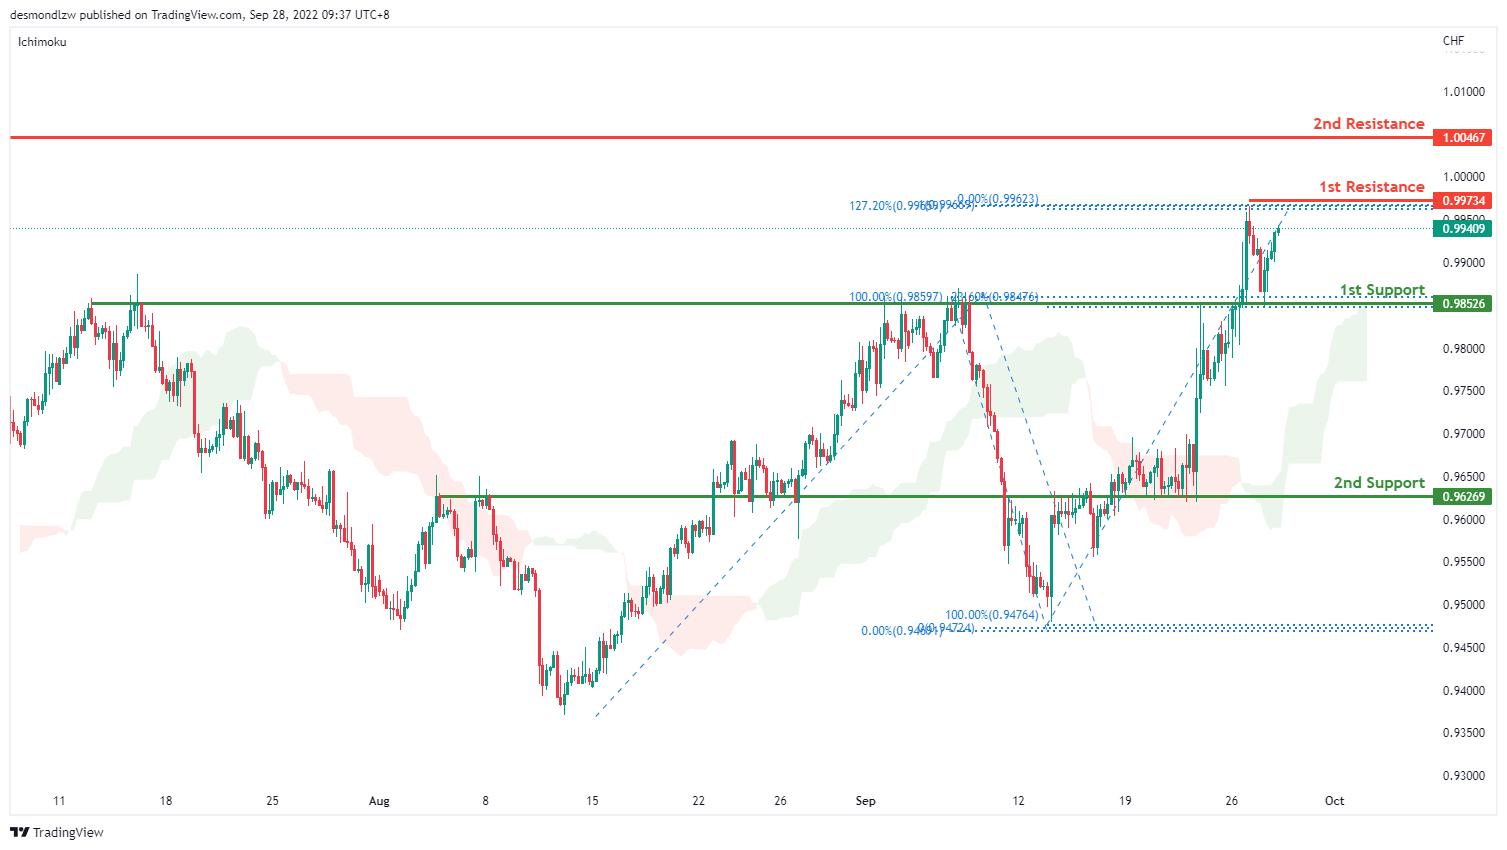
On the H4, prices have broken the descending channel and are moving above the ichimoku cloud- we are currently bullish biased. Price has broken the first support and is moving toward the first resistance at 0.9973 where the 100% projection,127.2% extension and swing high sits. If bullish momentum continues, it should bring price to the second resistance at 1.0046 where the previous swing high sits. Alternatively, price could pull back to test the first support at 0.9852 where the 23.6% retracement and overlapping resistance sits. If it breaks the first support, it should bring price to the second support at 0.9626 where the previous swing low sits.
Areas of consideration
- H4 1st support at 0.9852
- H4 1st resistance at 0.9973
XAU/USD (GOLD):
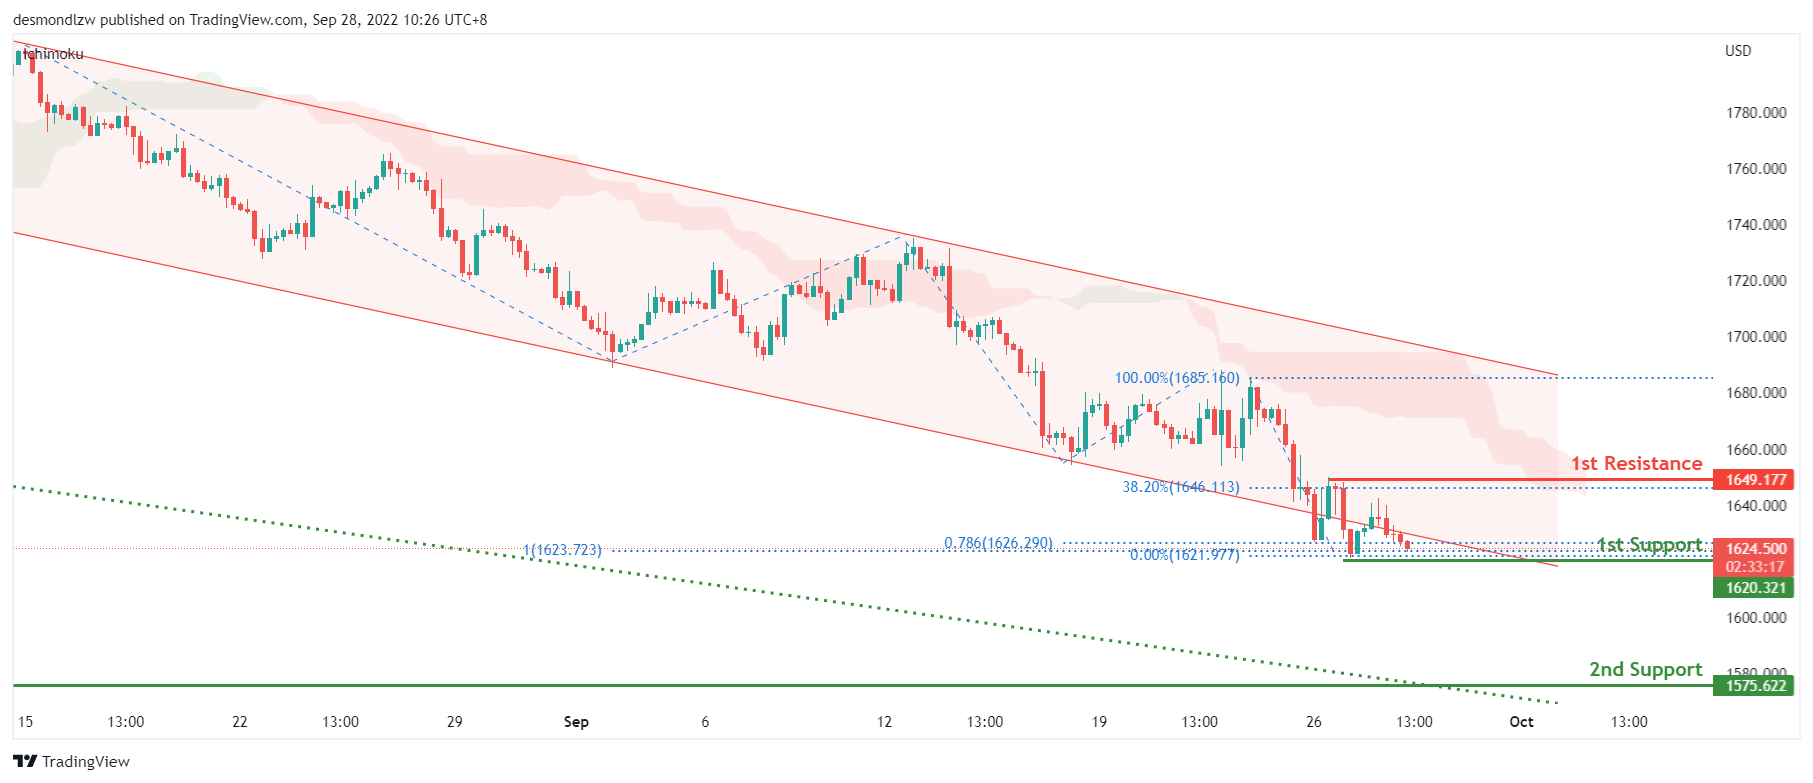
On the H4, with the price breaking lower from the bearish channel and maintaining below the ichimoku cloud, leading to a bearish bias that price may drop to the 2nd support of 1575, which is in line with the swing low from March 2020. The 1st support of 1620, which is in line with the 100% fibonacci extension level needs to be broken to trigger the next move down to the 2nd support level.
Areas of consideration:
- H4 time frame, 1st resistance at 1649
- H4 time frame, 1st support at 1620
- H4 time frame, 2nd support at 1575
AUD/USD:
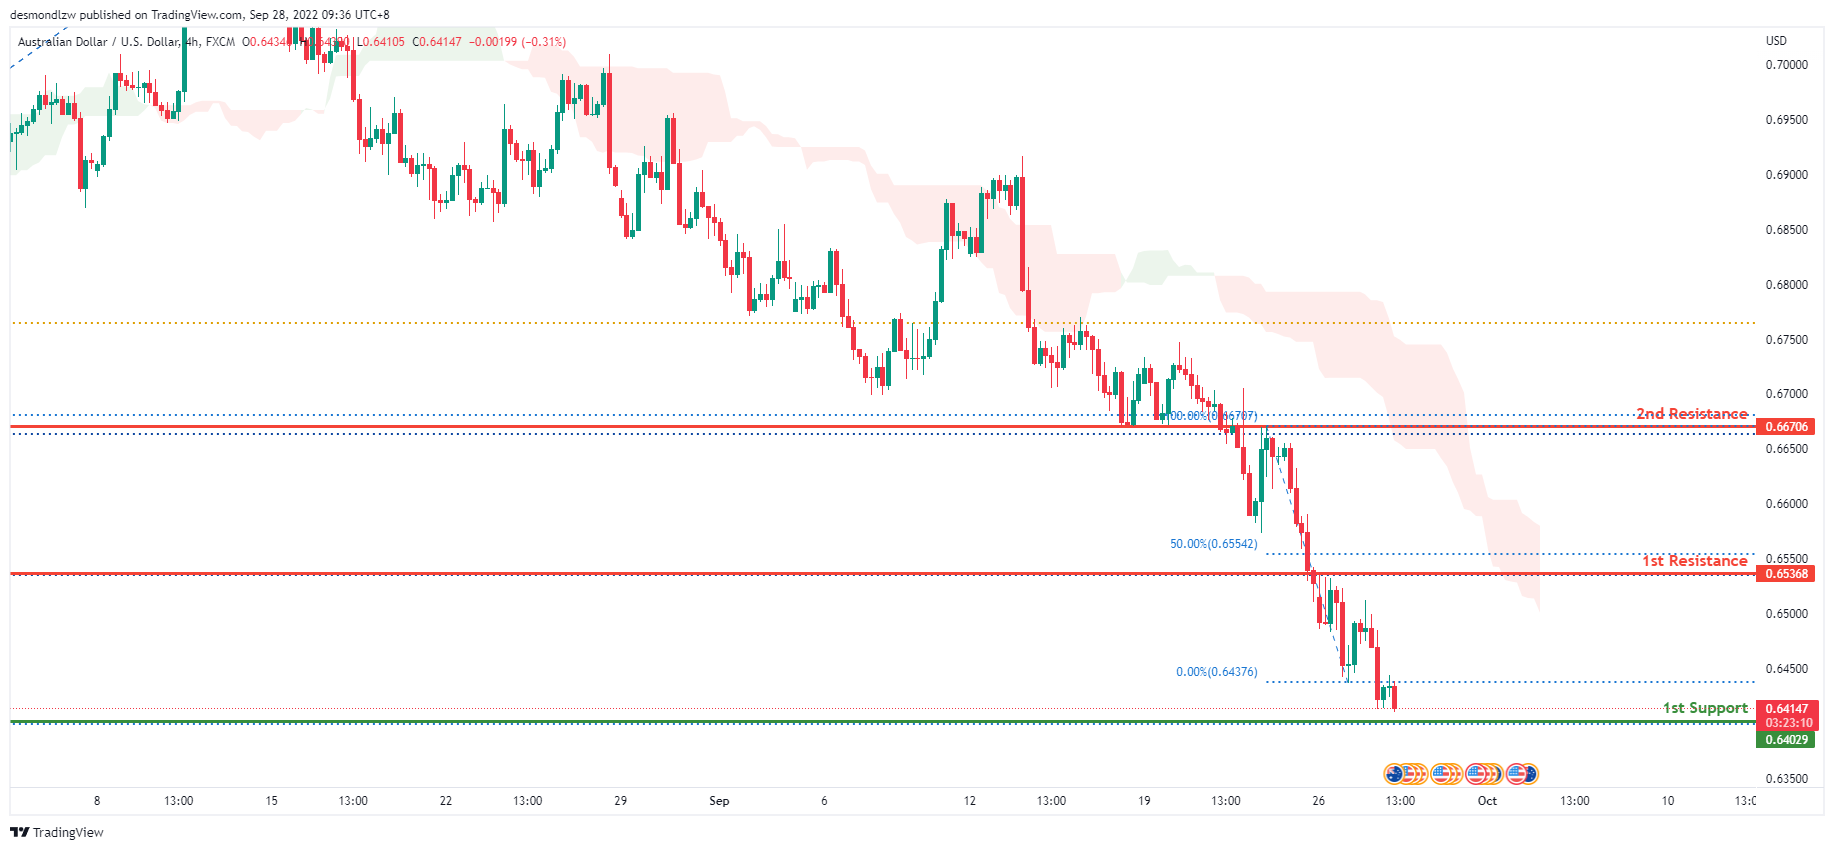
On the H4, the price is moving in a strong bearish trend. To add on confluence to this bias, price is below the Ichimoku cloud which indicates a bear market. Price has broken below the 1st resistance where the 100% Fibonacci line lies. Price has also tried multiple times to break back up the 1st resistance and failed to do so. With such a strong bearish momentum, expect price to tap the 1st support at 0.64029 where the 161.8% Fibonacci extension line lies within the day.
Areas of consideration
- H4, 1st resistance at 0.65368
- H4, 1st support at 0.64029
NZD/USD:
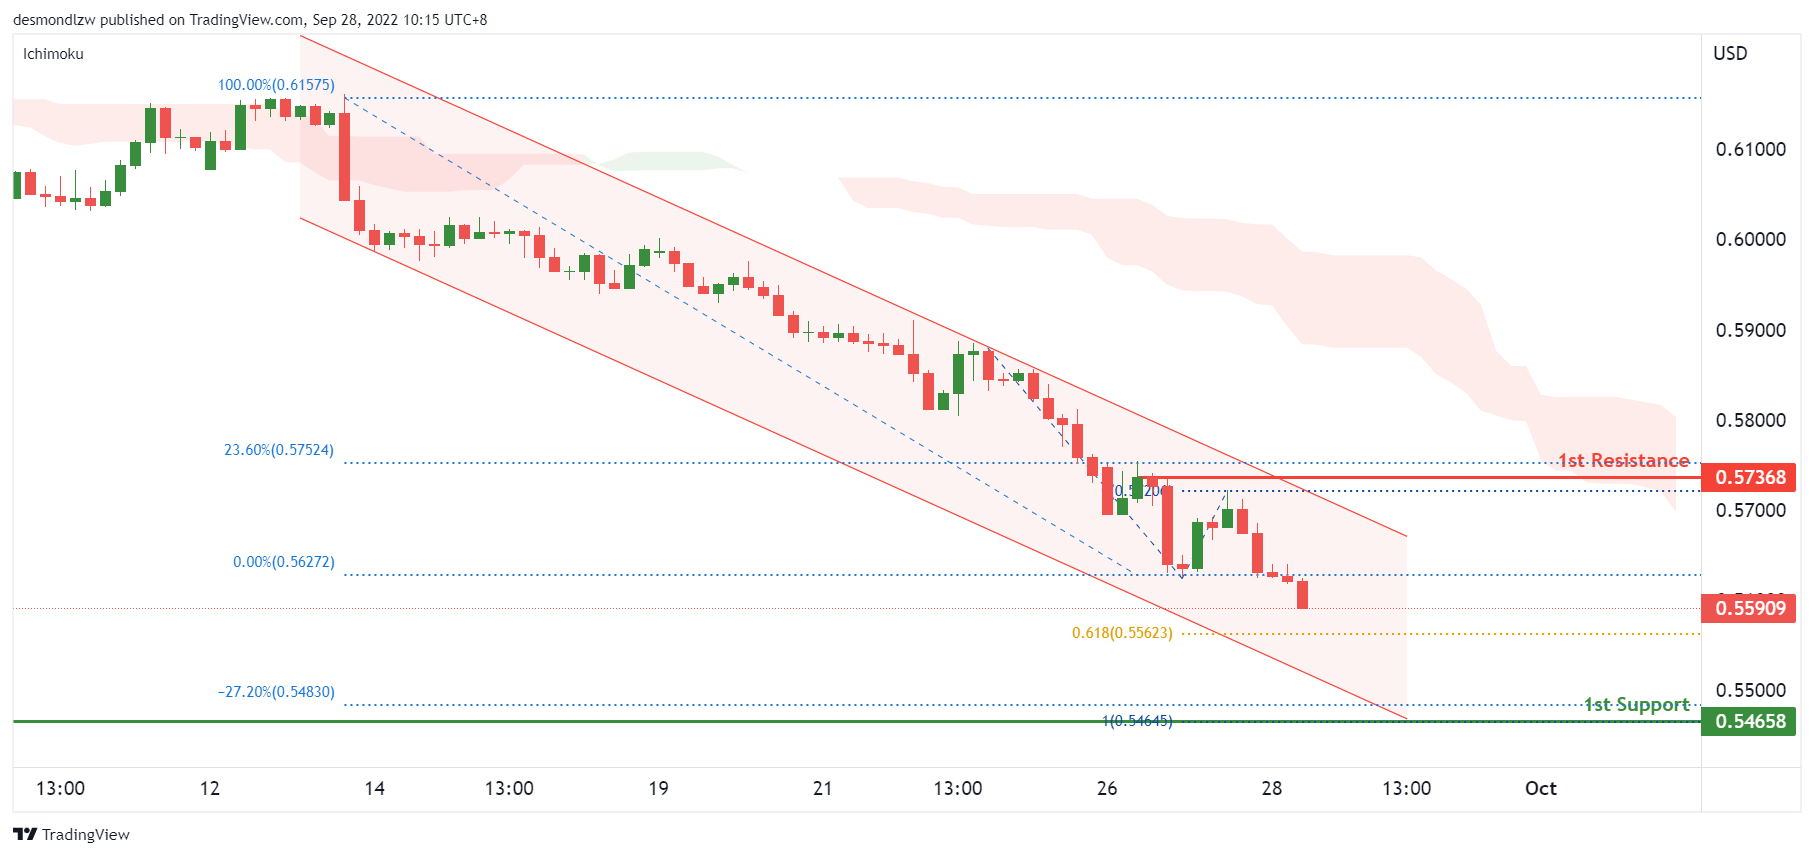
On the H4, with the price continuing to move within the descending channel and below the ichimoku cloud, we maintain a bearish bias that the price may drop to the 1st support at 0.5464, which is in line with the 27.20% fibonacci expansion level, 100% fibonacci extension and swing low from March 2020. There is a risk level at 0.5562 which is where our intermediate support and the 61.8% fibonacci extension is, which needs to be broken to trigger the next move down to the support level .
Areas of consideration:
- H4 time frame, 1st support at 0.5465
- H4 time frame, 1st resistance at 0.5736
USD/CAD:
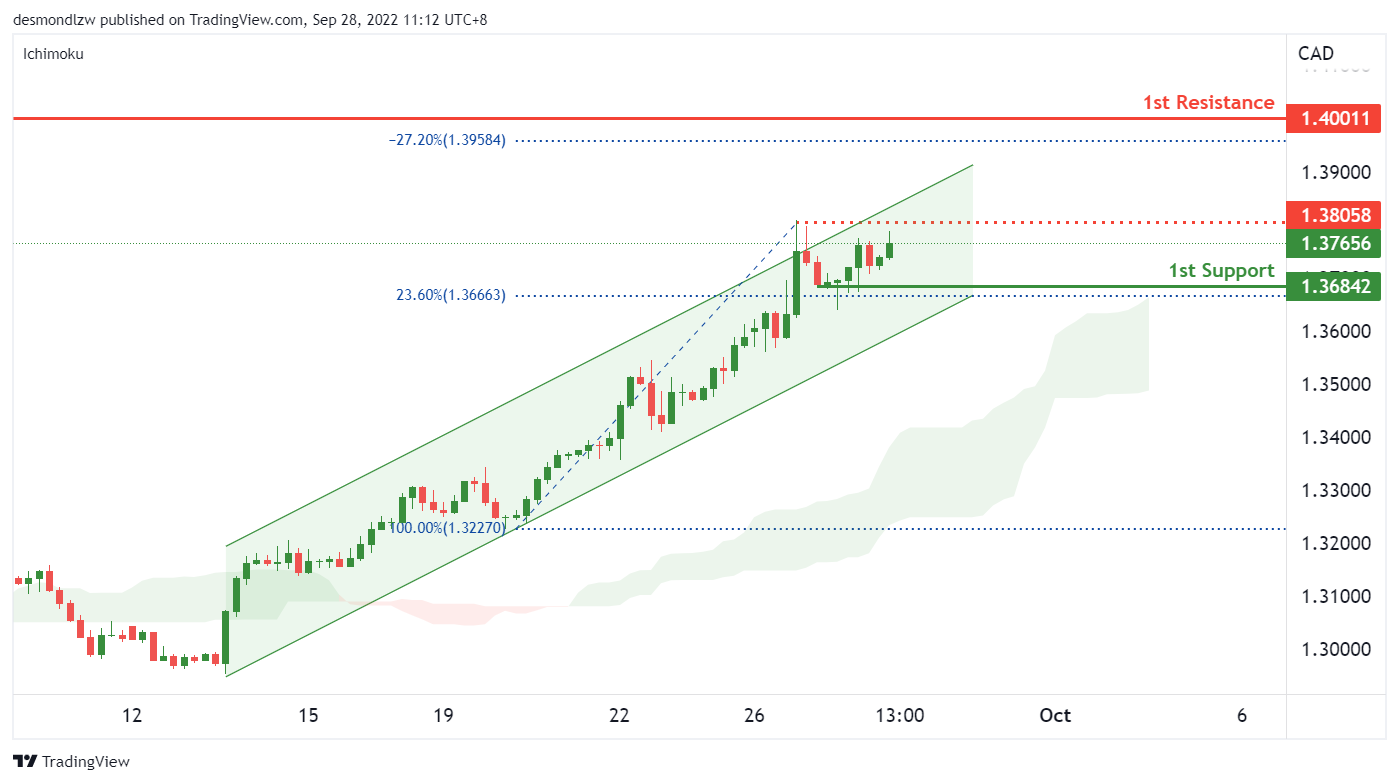
On the H4, with the price trading within the ascending channel and staying above the ichimoku cloud, we have a bullish bias that the price may rise to the 1st resistance at 1.40, major swing high from May 2020 and in line with the 27.20% fibonacci expansion. There is a risk level at 1.38 which is our intermediate resistance, this level needs to be broken to trigger the next move up to our resistance level.
Areas of consideration:
- H4 time frame, 1st resistance at 1.40
- H4 time frame, 1st support at 1.3684
OIL:
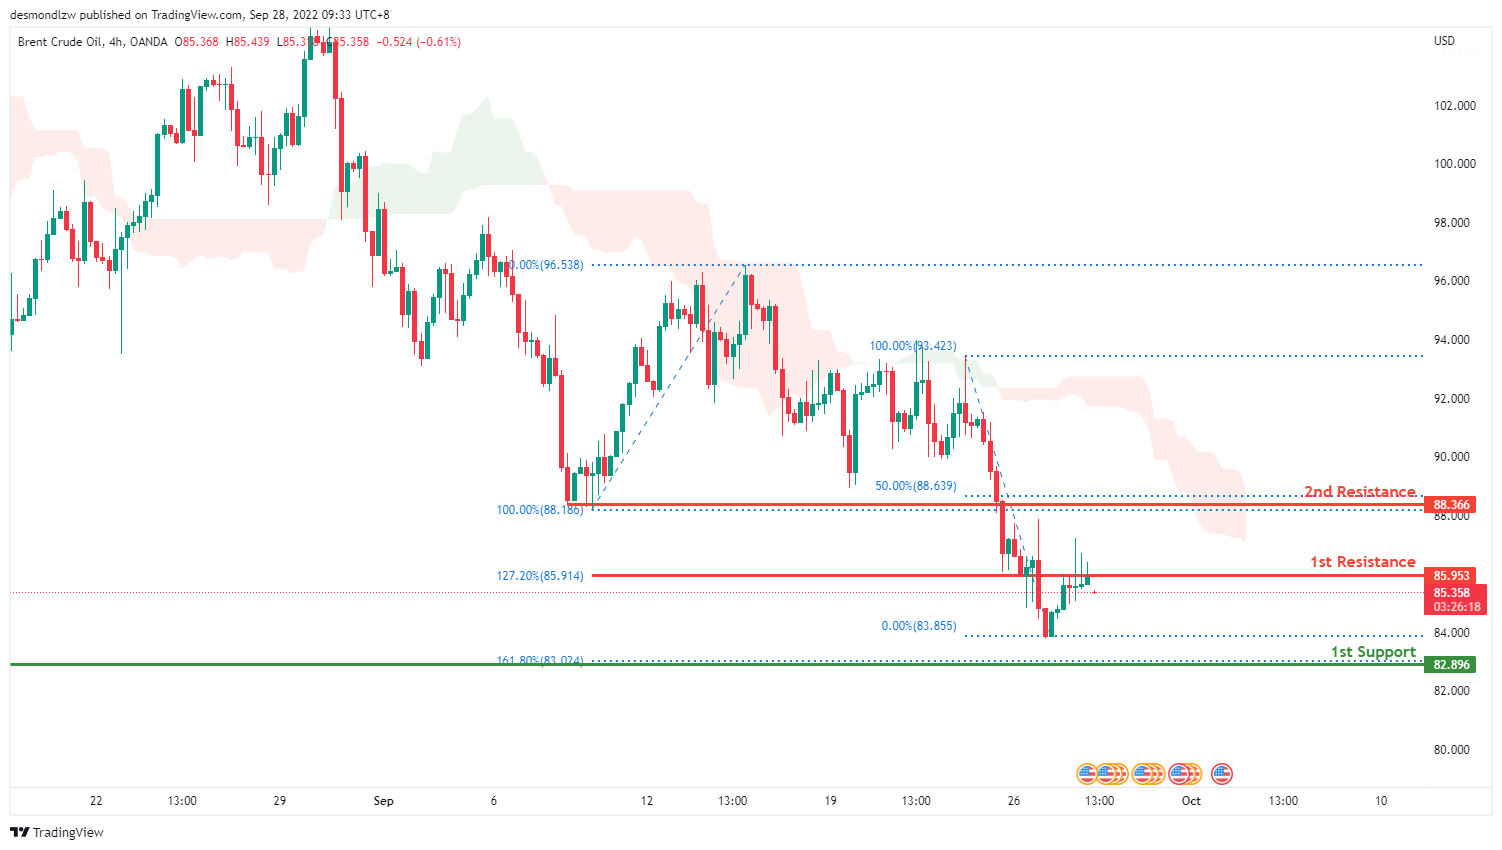
On the H4, oil is on a bearish trend and to add confluence to this, the price is below the ichimoku cloud which indicates a bear market. Price has broken through the 1st resistance at 85.380 where the 141.4% Fibonacci extension lies. Price also tried multiple times to break back up through the 1st resistance but failed to do so. Expect price to go to the 1st support at 82.896 where the 161.8% Fibonacci extension line is.
Areas of consideration:
- H4 time frame, 1st resistance at 85.953
- H4 time frame, 1st support at 82.896
Dow Jones Industrial Average:
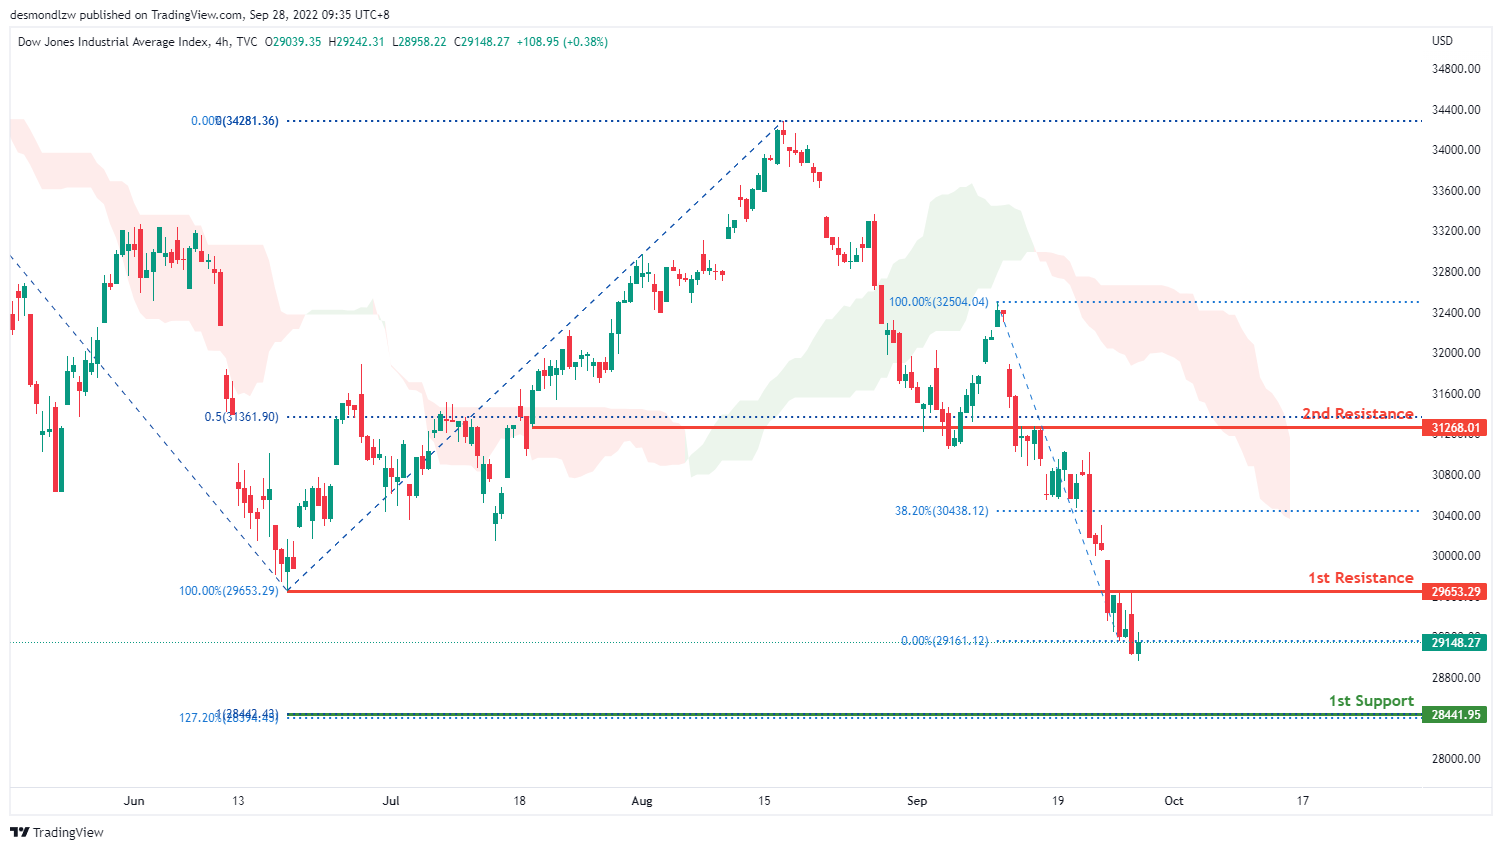
On the H4, price is on a very bearish trend. To add confluence to this, price is below the ichimoku cloud which indicates a bearish market. Price has also broke through the 1st resistance at 29653.29, where the 100% Fibonacci line and previous swing low lies. Price also tried multiple times to break back up but failed to do so. If this bearish momentum continues, expect price to continue heading downwards towards the 1st support at 28458.52 where the 127.2% Fibonacci extension and 100% Fibonacci projection line is.
Areas of consideration:
- H4 time frame, 1st support at 28458.52
- H4 time frame, 1st resistance at 29653.29
DAX:
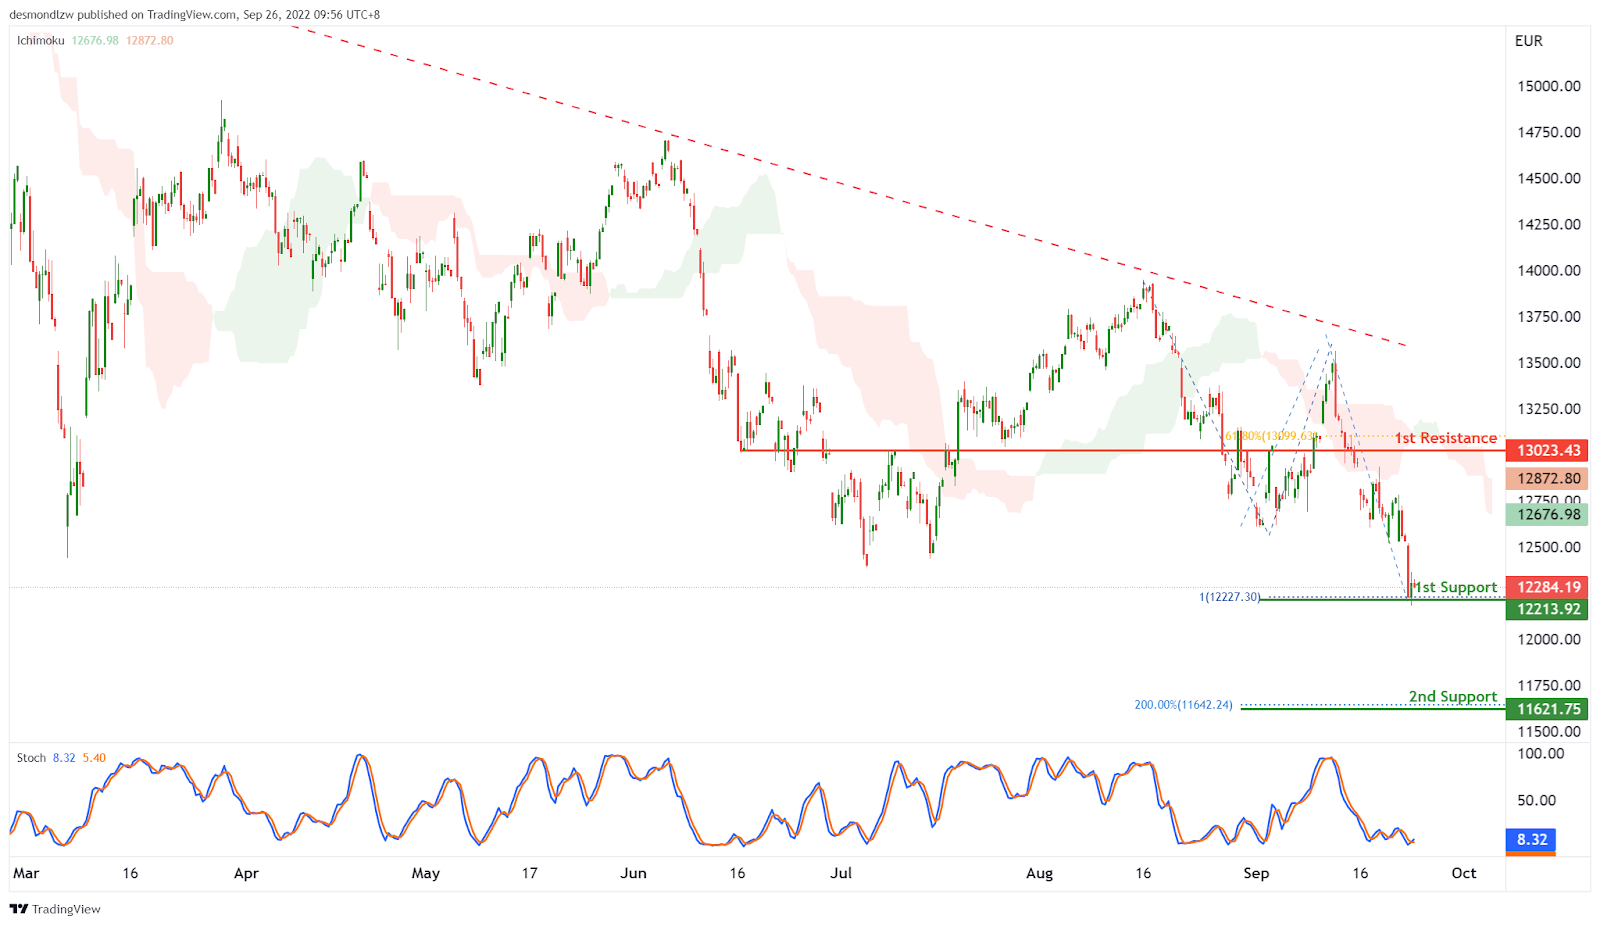
On the H4, with the price moving below the descending trendline and below ichimoku cloud, we have a bearish bias that the price may drop from the 1st support at 12213.92, which is in line with the swing lows and 100% fibonacci projection. If the 1st support is broken, the next support level could be at 11621.75, where the 200% fibonacci extension is. Alternatively, the price may rise to the 1st resistance at 13023.43, where the 61.8% fibonacci retracement and overlap resistance are.
Areas of consideration:
- H4 time frame, 1st support at 12213.92
- H4 time frame, 2nd support at 11621.75
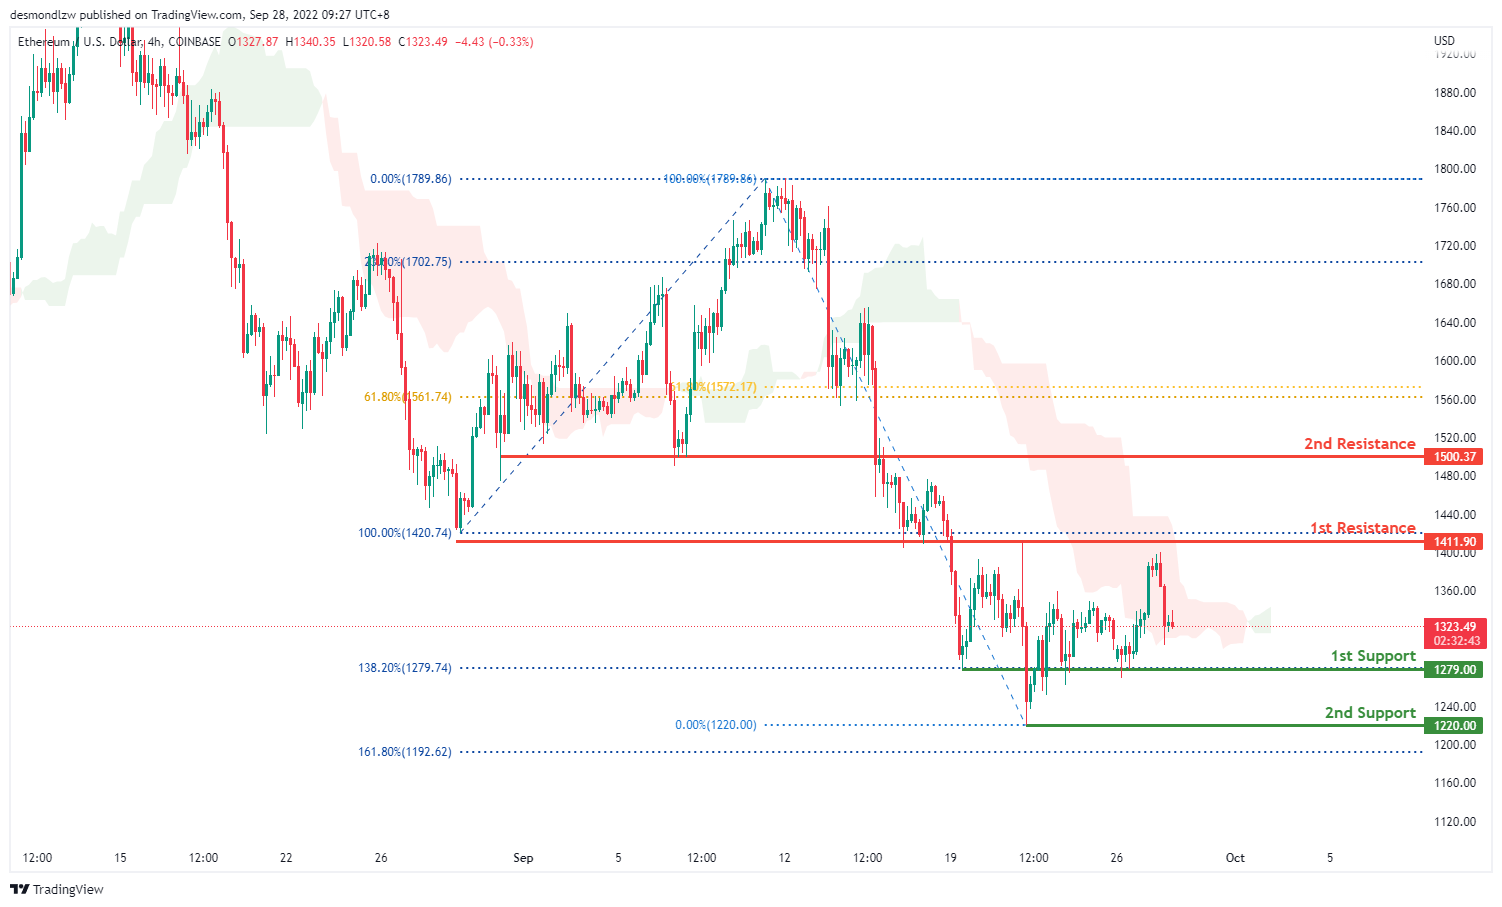
ETHUSD:
On the H4, overall price is very bearish on ETHUSD. Price has reflected off the 1st support at 1279.74 where the 138.2% Fibonacci line lies 3 times which indiciates a retail triple bottom. Price nearly tapped onto the 1st resistance at 1411.90 where the 100% Fibonacci projection is before reversing back down towards the 1st support at 1279.00 where the 138.2% Fibonacci extension line lies. Watching for price to potentially break through the 1st support and head towards the 2nd support at 1220.00 where the 0% Fibonacci line and low is.
Areas of consideration:
- H4 time frame, 1st resistance of 1411.90
- H4 time frame, 1st support at 1279.00
BTCUSD:
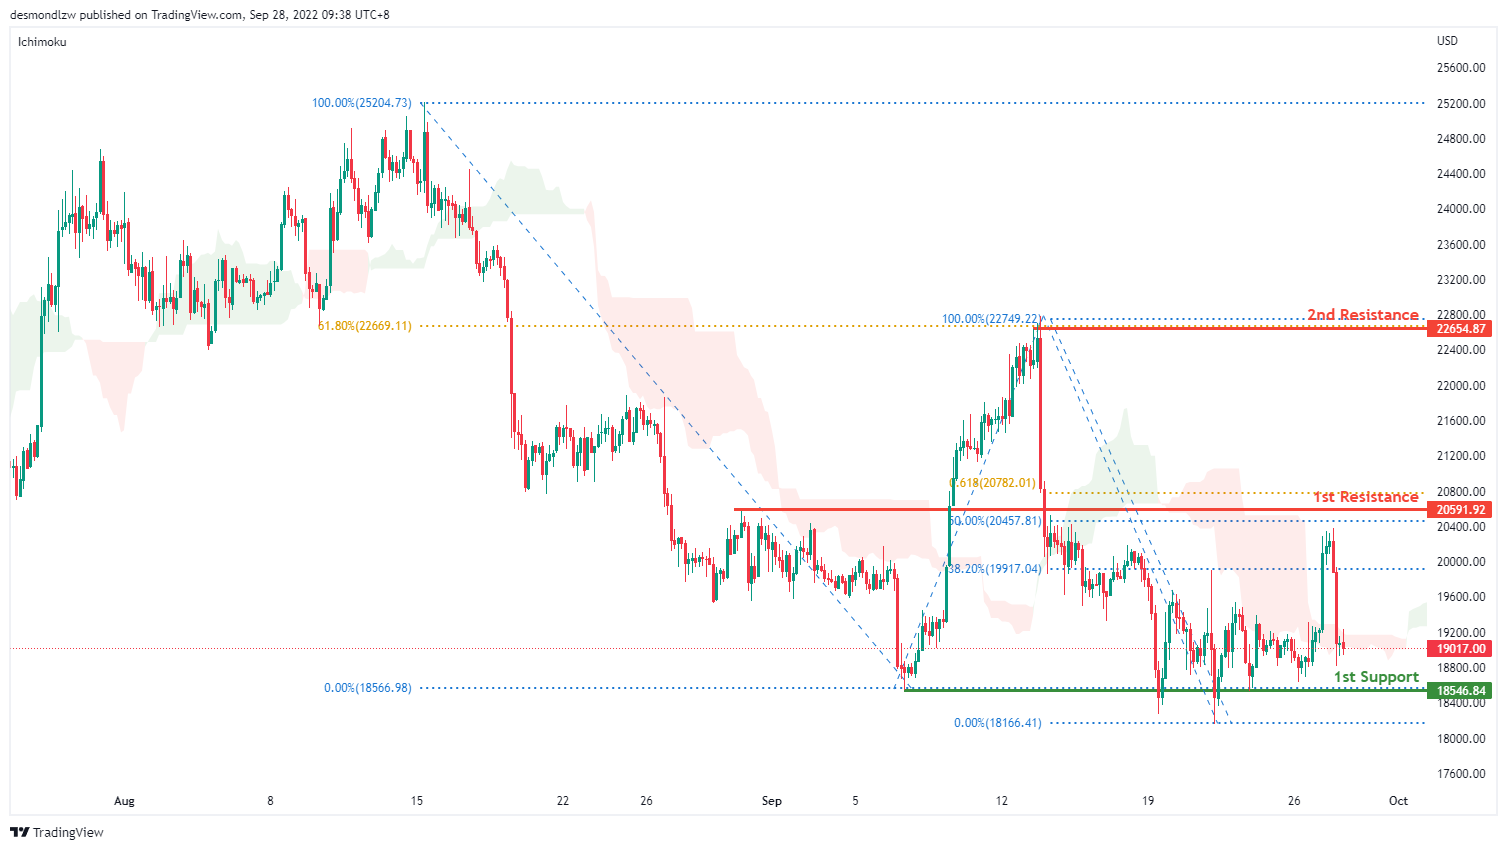
On the H4, price has pulled back to test the first support at 18546.84 where my previous swing low sits. If price breaks this level, bearish momentum would bring price to test the 17648.80 levels where the previous swing low sits. Alternatively price could pull back to test the first resistance at 20591.92 where the 50% retracement and 61.8% projection sits. If it breaks this level, it should move to the second resistance at 22654.87 where the 100% projection and 61.8% retracement sits.
Areas of consideration:
- H4 time frame, 1st support at 18546.84
- H4 time frame, 1st resistance at 20591.92
S&P 500:
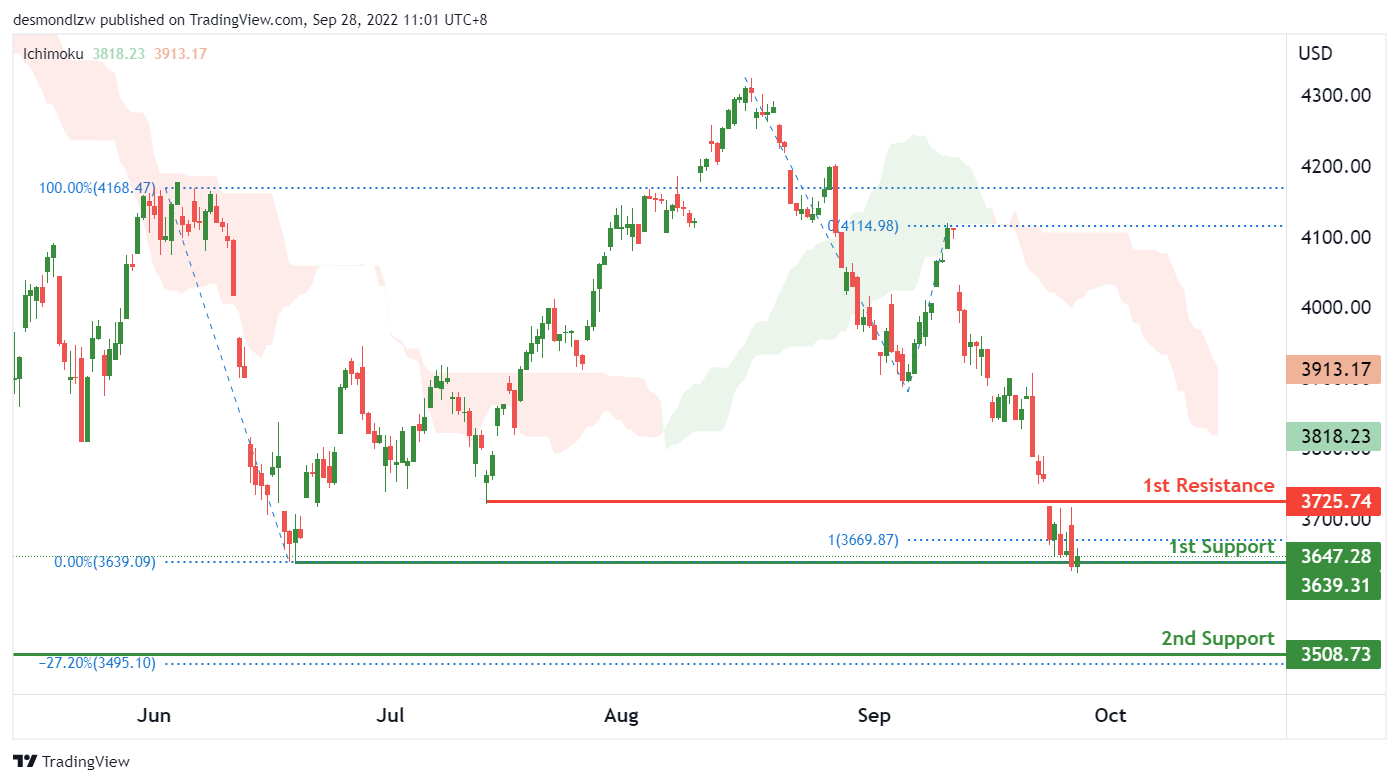
On the H4, with the price on a strong bearish trend and below the ichimoku cloud, we have a bearish bias that price may drop to the 2nd support of 3508, which is in line with the 27.2% fibonacci expansion and previous swing low from November 2020. The 1st support of 3639and previous swing low from June 2022 needs to be broken to trigger the next move down to the 2nd support level.
Areas of consideration:
- H4 time frame, 1st resistance at 3725
- H4 time frame, 1st support at 3639
- H4 time frame, 2nd support at 3508
AUD/USD Daily Report
Daily Pivots: (S1) 0.6395; (P) 0.6454; (R1) 0.6494; More...
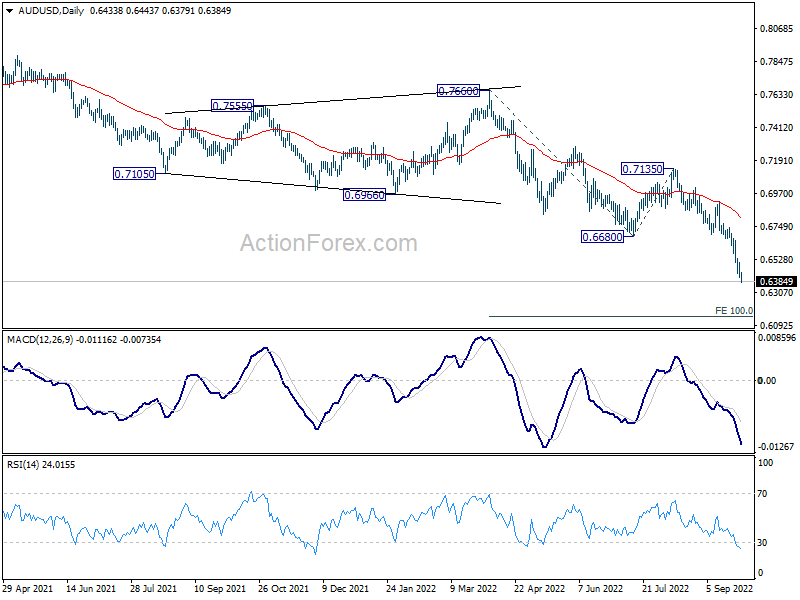
AUD/USD's down trend continues today and hits as low as 0.6379 so far. Intraday bias stays on the downside. Next target is 100% projection of 0.7660 to 0.6680 from 0.7135 at 0.6155. On the upside, above 0.6512 minor resistance will turn intraday bias neutral and bring consolidations first, before staging another decline.
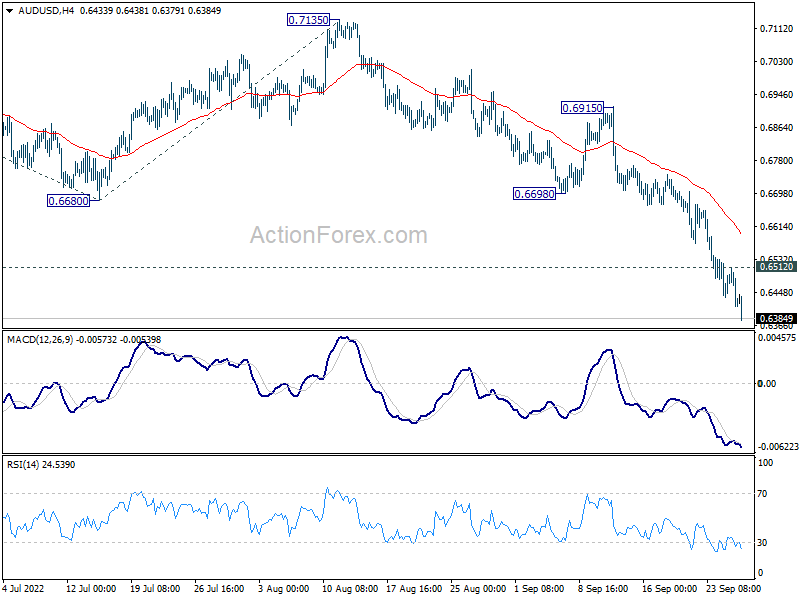
In the bigger picture, down trend form 0.8006 (2021 high) is expected to continue as long as 0.7135 resistance holds. With 61.8% retracement of 0.5506 (2020 low) to 0.8006 at 0.6461 firmly taken out, next target is 0.5506 low. Medium term momentum will now be closely monitored to gauge the chance of break of 0.5506.