Sample Category Title
EUR/AUD Daily Outlook
Daily Pivots: (S1) 1.4761; (P) 1.4843; (R1) 1.4963; More...
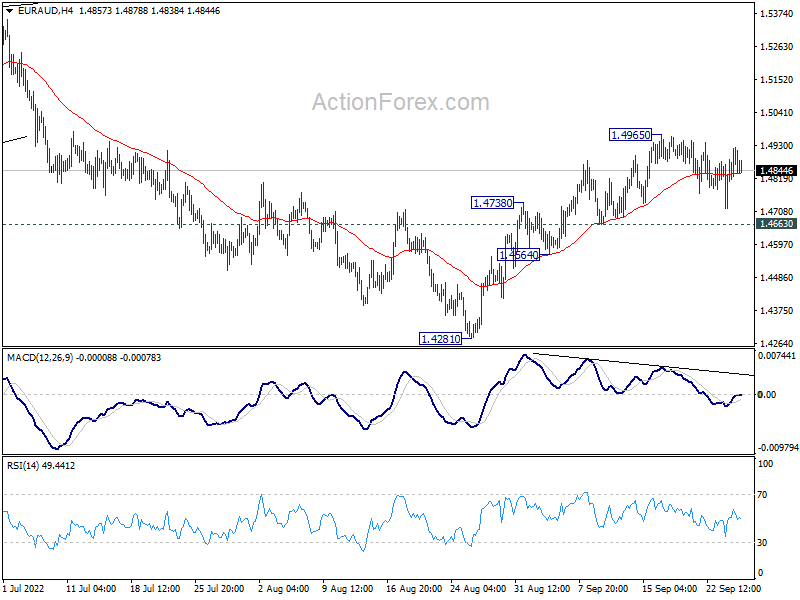
Intraday bias in EUR/AUD remains neutral as consolidation from 1.4965 is extending. Further rally is in favor as long as 1.4663 minor support holds. On the upside, break of 1.4965 will resume the rise from 1.4281 towards 1.5396 resistance. On the downside, however, break of 1.4663 minor support will turn bias back to the downside for retesting 1.4281 low.
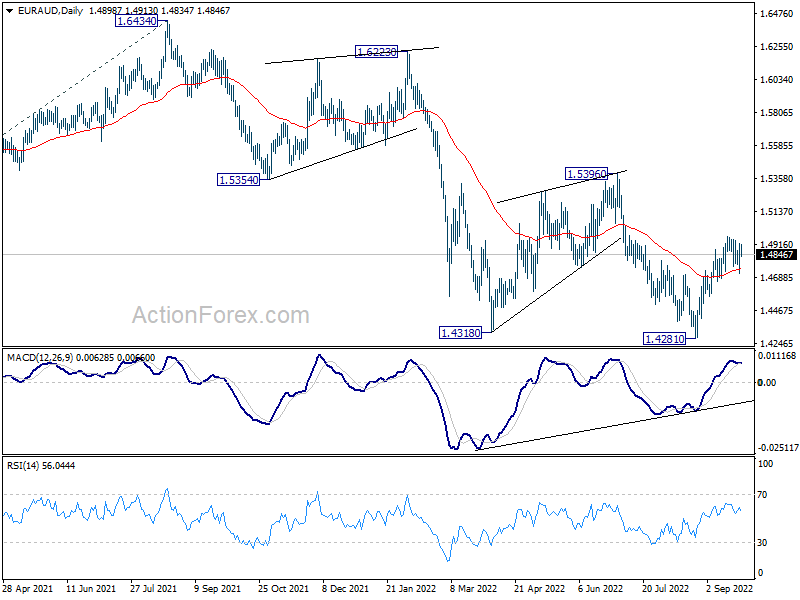
In the bigger picture, down trend from 1.9799 is still in progress. Break of 1.4318 low will target 61.8% projection of 1.9799 to 1.5250 from 1.6434 at 1.3623, which is close to 1.3624 long term support (2017 low). This will remain the favored case now as long as 1.5396 resistance holds.
EUR/CHF Daily Outlook
Daily Pivots: (S1) 0.9465; (P) 0.9543; (R1) 0.9588; More....
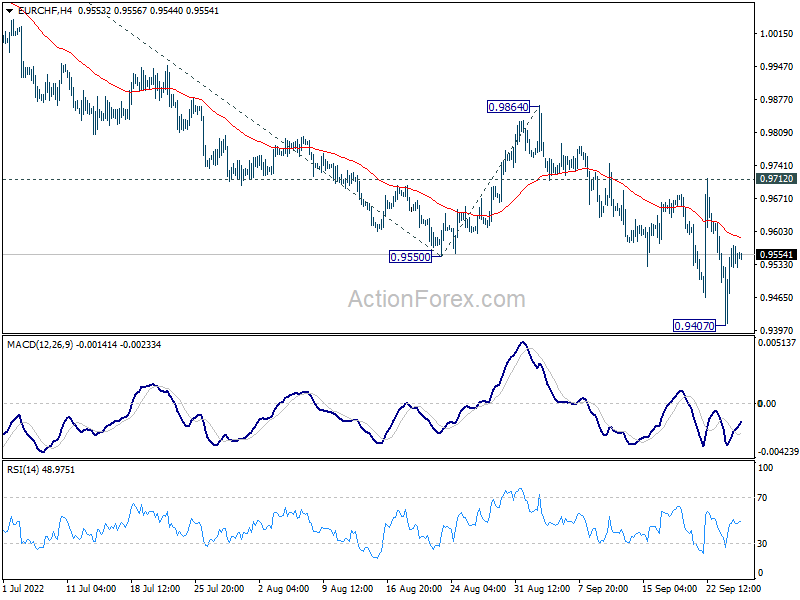
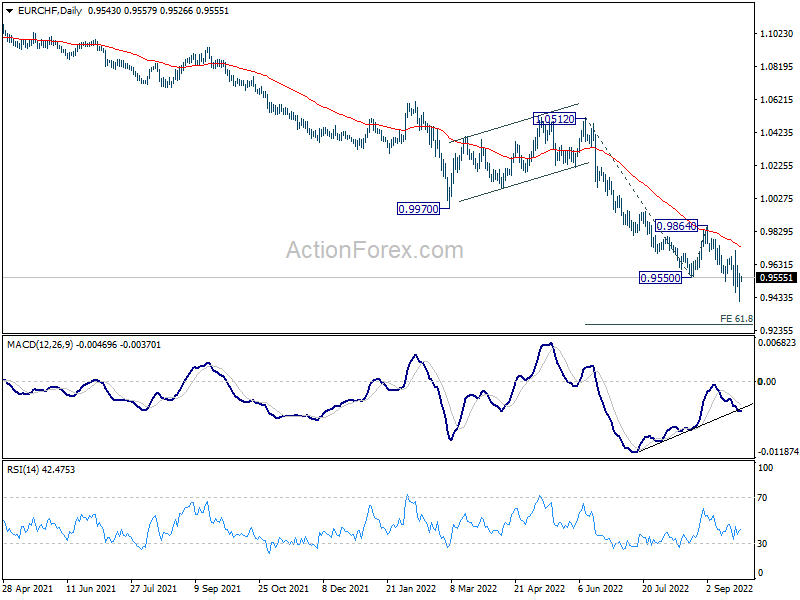
Intraday bias in EUR/CHF is turned neutral again with current recovery, but outlook remains bearish with 0.9712 resistance intact. Break of 0.9407 will resume larger down trend. Next target is 61.8% projection of 1.0512 to 0.9550 from 0.9864 at 0.9269.
In the bigger picture, long term down trend from 1.2004 (2018 high) is still in progress. Next target is 138.2% projection of 1.2004 to 1.0505 to 1.1149 at 0.9033. On the upside, break of 0.9864 resistance is needed to be the first sign of medium term bottoming. Otherwise, outlook will stay bearish in case of strong rebound.
EUR/USD Daily Outlook
Daily Pivots: (S1) 0.9538; (P) 0.9624; (R1) 0.9694; More...
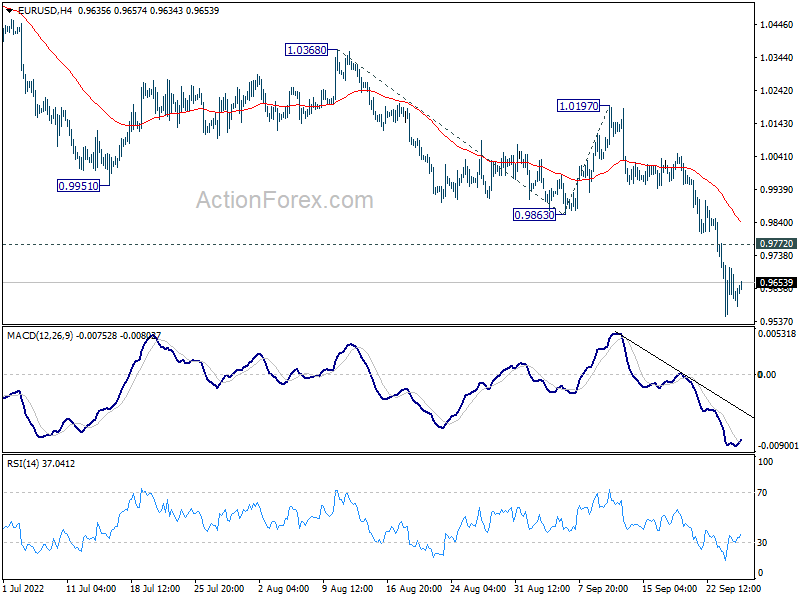
EUR/USD's decline is still in progress and intraday bias stays on the downside for the moment. Current down trend should target 161.8% projection of 1.0368 to 0.9863 from 1.0197 at 0.9380 next. On the upside, above 0.9772 minor resistance will turn intraday bias neutral and bring consolidations first, before staging another decline.
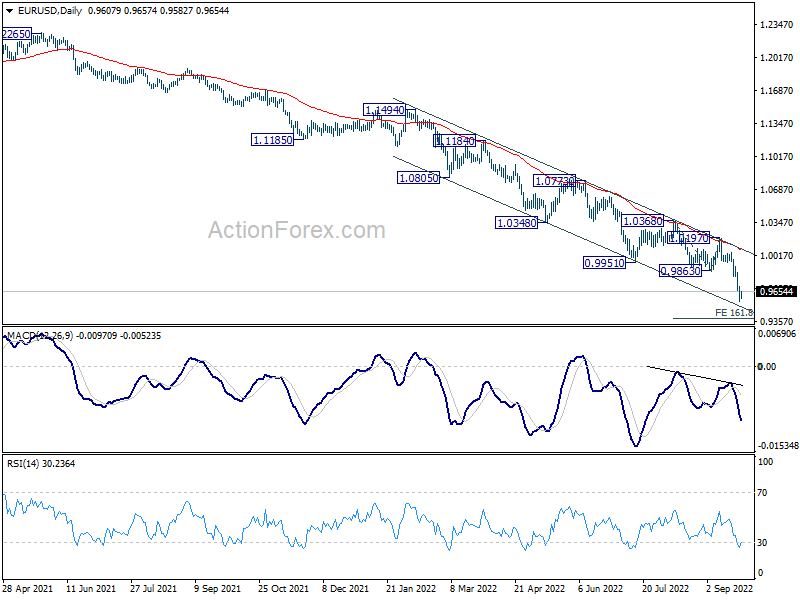
In the bigger picture, down trend from 1.6039 (2008 high) is still in progress. Next target is 100% projection of 1.3993 to 1.0339 from 1.2348 at 0.8694. In any case, break of 1.0197 resistance is needed to be the first sign of medium term bottoming. Otherwise, outlook will stay bearish even with strong rebound.
GBP/USD Daily Outlook
Daily Pivots: (S1) 1.0381; (P) 1.0655; (R1) 1.0962; More...
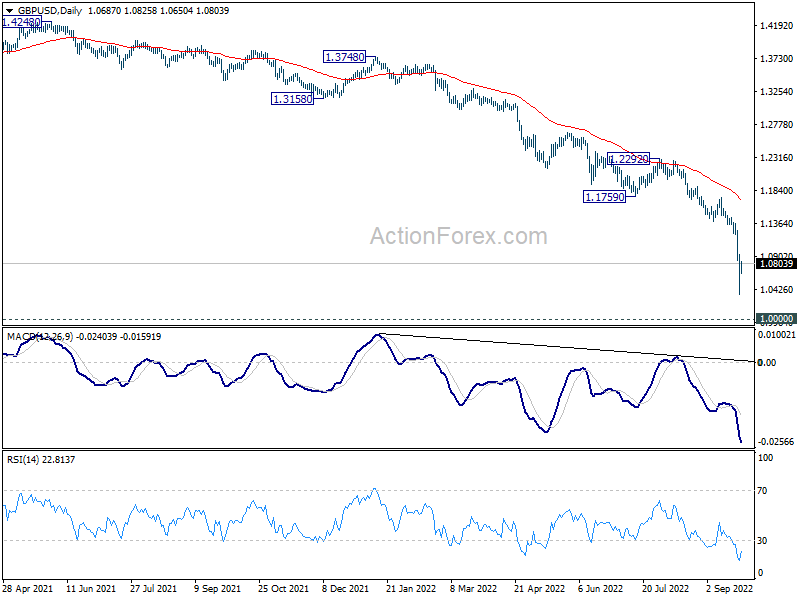
Intraday bias in GBP/USD remains neutral for consolidation above 1.0351. Risk will stay on the downside as long as 1.1404 support turned resistance holds. Break of 1.0351 will resume larger down trend towards parity next.
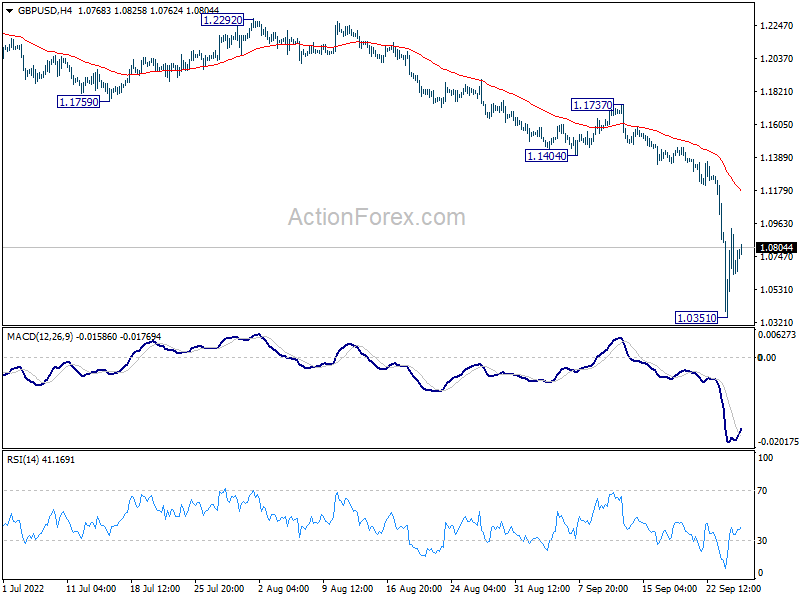
In the bigger picture, fall from 1.4248 (2018 high) is resuming long term down trend from 2.1161 (2007 high). Next target is 100% projection of 2.1161 to 1.3503 from 1.7190 at 0.9532. There is no scope of a medium term rebound as long as 1.1759 support turned resistance holds.
USD/CHF Daily Outlook
Daily Pivots: (S1) 0.9832; (P) 0.9899; (R1) 1.0006; More
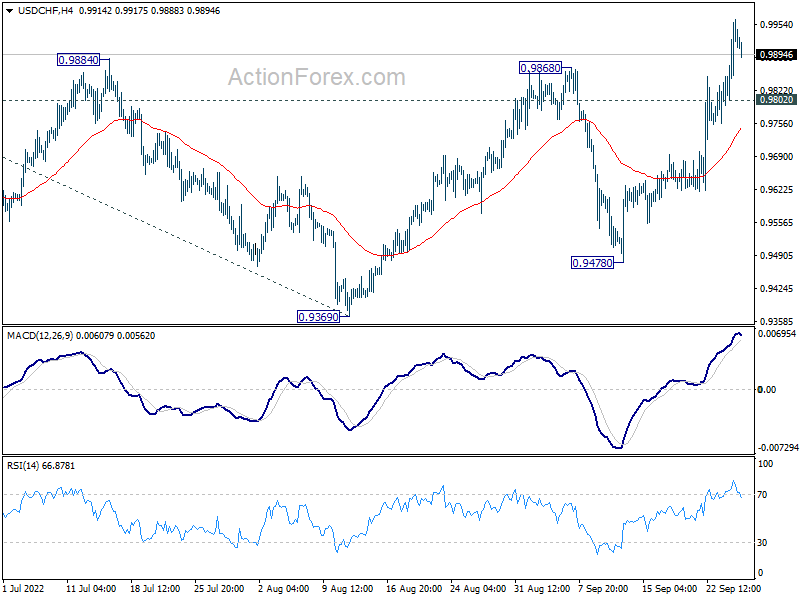
Intraday bias in USD/CHF stays on the upside, and further rise would be seen to retest 1.0063 high. Decisive break there will confirm resumption of larger up trend. On the downside, below 0.9802 minor support will turn intraday bias neutral and bring consolidations, before staging another rally.
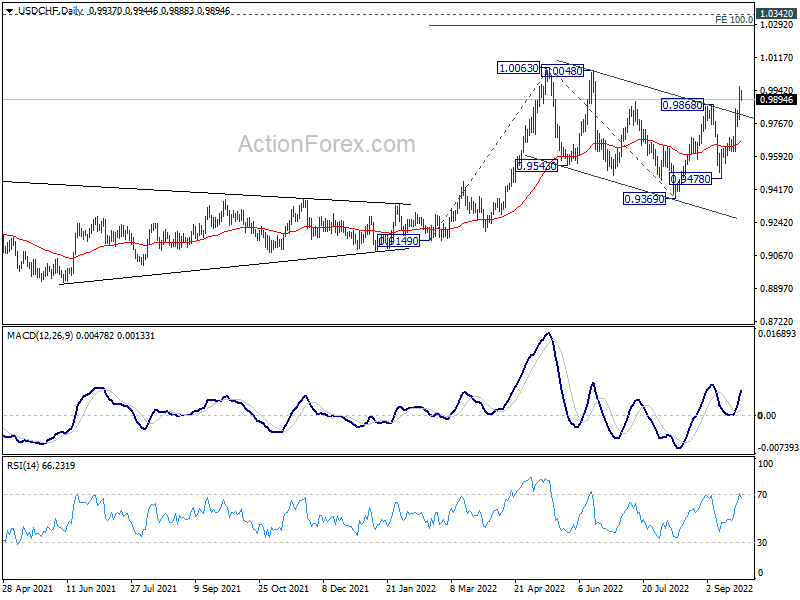
In the bigger picture, current development suggests that up trend from 0.8756 (2021 low) is still in progress. Sustained break of 1.0063 will target 100% projection of 0.9149 to 1.0063 from 0.9369 at 1.0283, and then 1.0342 (2016 high). For now, this will remain the favored case as long as 0.9369 support holds, even in case of deep pull back.
USD/JPY Daily Outlook
Daily Pivots: (S1) 143.71; (P) 144.25; (R1) 145.27; More...
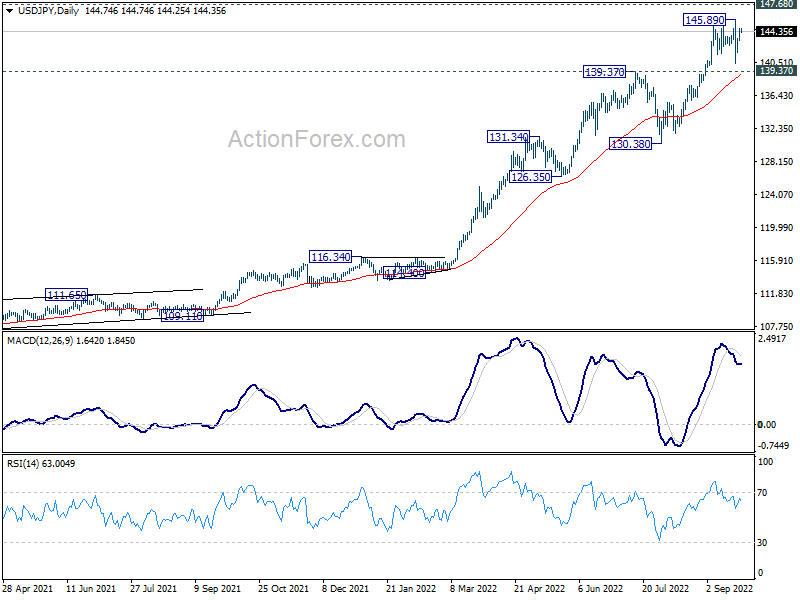
Range trading continues in USD/JPY and intraday bias remains neutral. Further rally is expected as long as 139.37 resistance turned support holds. Break of 145.89 will target 147.68 long term resistance. On the downside, however, decisive break of 139.37 will confirm short term topping. Deeper decline would be seen back towards 130.38 support.
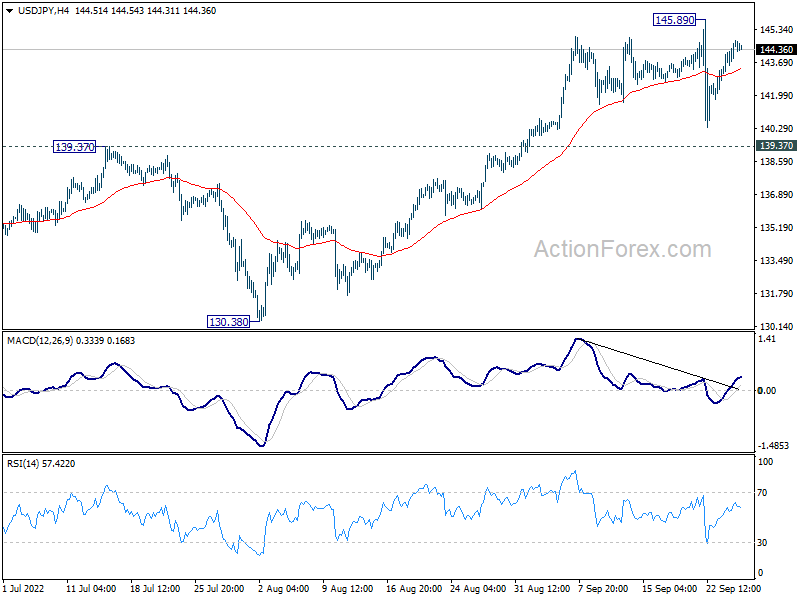
In the bigger picture, up trend from 101.18 is still in progress, as part of the whole up trend from 75.56 (2011 low). Further rise should be seen to 147.68 (1998 high). For now, break of 130.38 support is needed to be the first indication of medium term topping. Otherwise, outlook will stay bullish even in case of deep pull back.
AUD/USD Daily Report
Daily Pivots: (S1) 0.6415; (P) 0.6477; (R1) 0.6515; More...
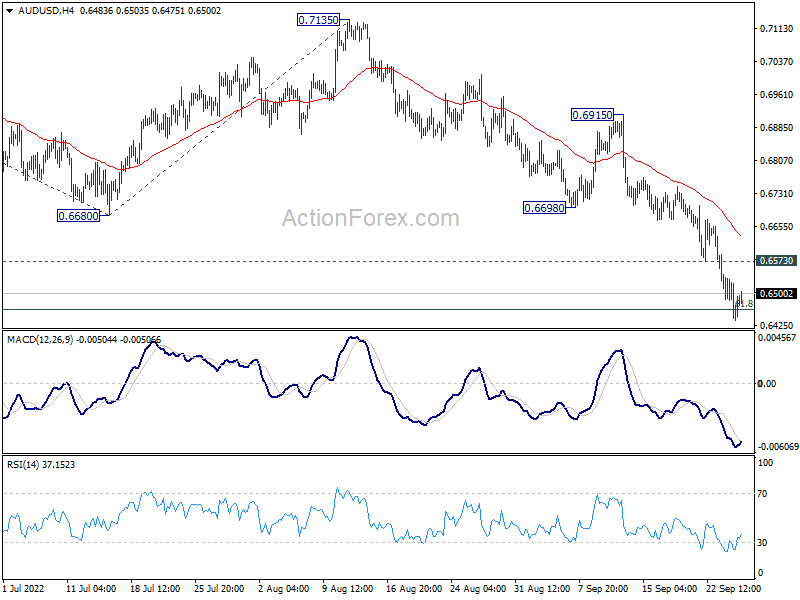
Intraday bias in AUD/USD stays on the downside for the moment. Firm break of 0.6461 long term fibonacci level will target 100% projection of 0.7660 to 0.6680 from 0.7135 at 0.6155. On the upside, above 0.6573 minor resistance will turn intraday bias neutral and bring consolidations, before staging another decline.
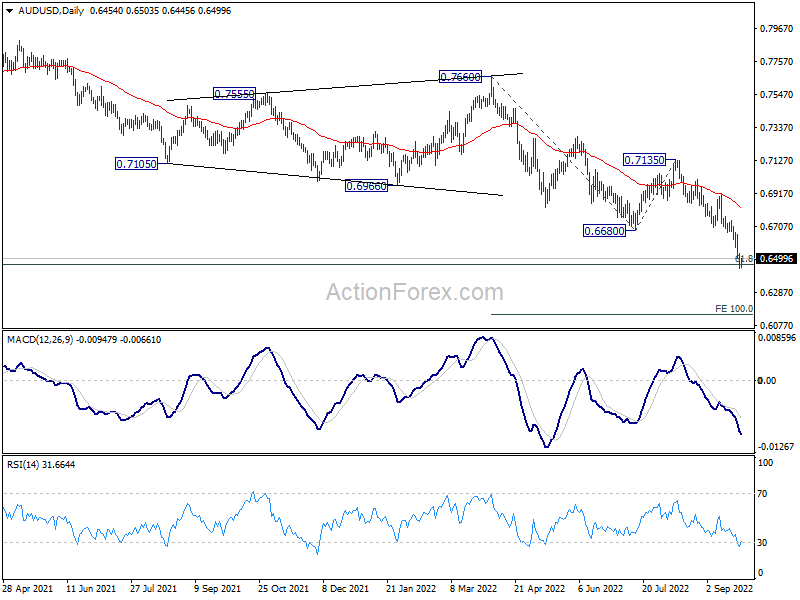
In the bigger picture, down trend form 0.8006 (2021 high) is expected to continue as long as 0.7135 resistance holds. 61.8% retracement of 0.5506 (2020 low) to 0.8006 at 0.6461 is already met. Sustained break there will pave the way back to retest 0.5506.
USD/CAD Daily Outlook
Daily Pivots: (S1) 1.3596; (P) 1.3703; (R1) 1.3845; More...
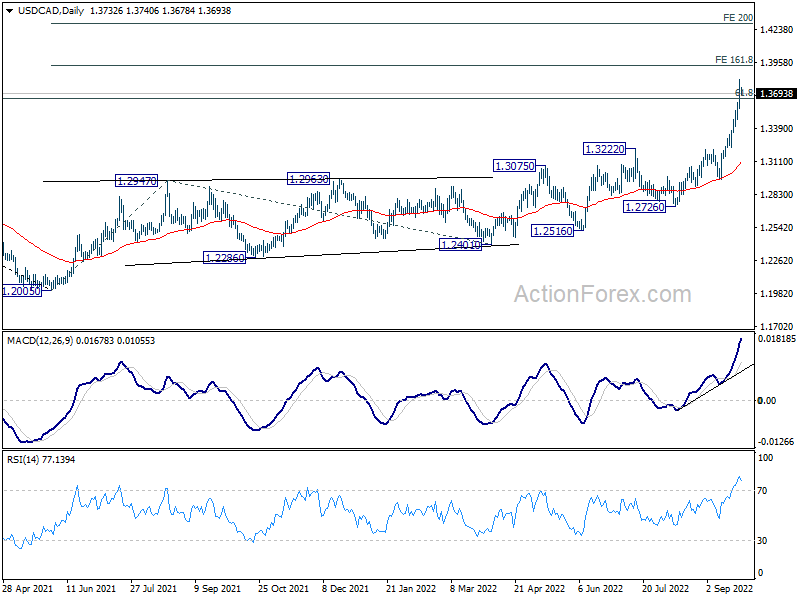
USD/CAD's rally continued and hit as high as 1.3807 so far. Intraday bias stays on the upside for 161.8% projection of 1.2005 to 1.2947 from 1.2401 at 1.3925. Firm break there will target 200% projection at 1.4285. On the downside, below 1.3543 minor support will turn intraday bias neutral and bring consolidations first, before staging another rally.
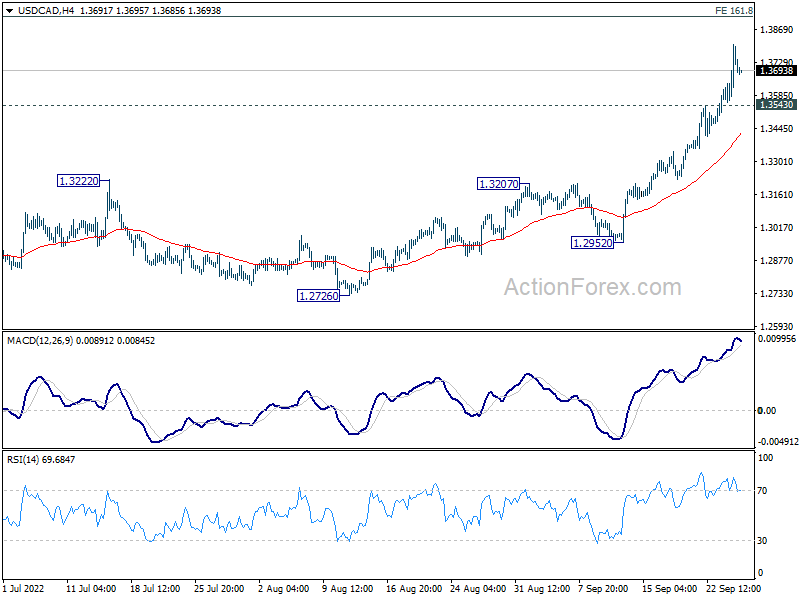
In the bigger picture, up trend from 1.2005 (2021 low) is still in progress. 61.8% retracement of 1.4667 to 1.2005 (2021 low) at 1.3650 is already met. Next target is 1.4667 (2020 high). This will now remain the favored case as long as 1.3222 resistance turned support holds.
Dollar Takes a Breather While Gold Extends Decline
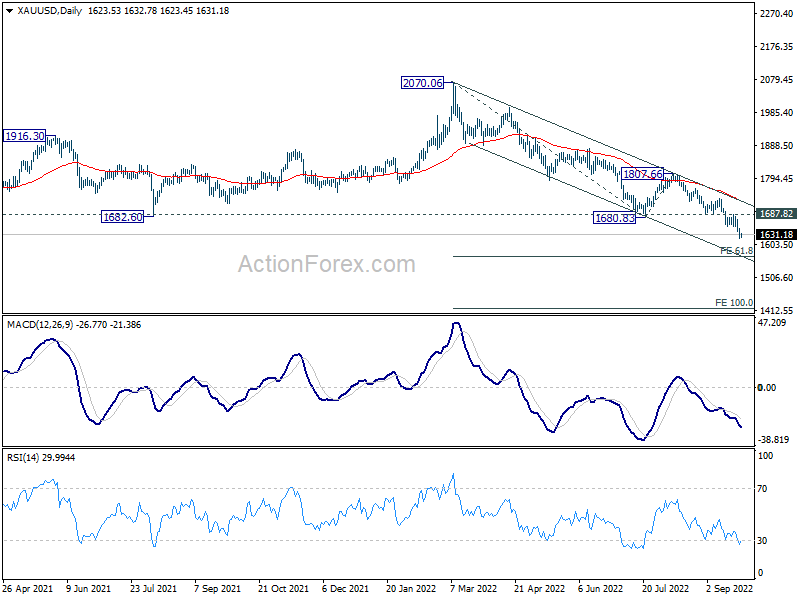
The currency markets have turned into consolidation mode temporarily. Sterling further stabilized after BoE said in a statement that the assessment of the government's growth plan will be done at next "scheduled" meeting, ruling out an emergency meeting. Dollar is also taking a breather even though 10-year yield rose to the highest level since 2010. Yen is steady, awaiting traders to test Japan's determination on intervention again.
Technically, while the currency markets turned steady, Gold is extending recent down trend. It now seems that 55 month EMA (now at 1651.12) couldn't provide enough support for a bounce. Outlook will stay bearish as long as 1687.82 resistance holds. Next near term target is 61.8% projection of 2070.06 to 1680.83 from 1807.66 1567.11. Decisive break there could prompt downside acceleration to 100% projection at 1418.43. That could happen if US 10-year yield breaks through 4% handle firmly.
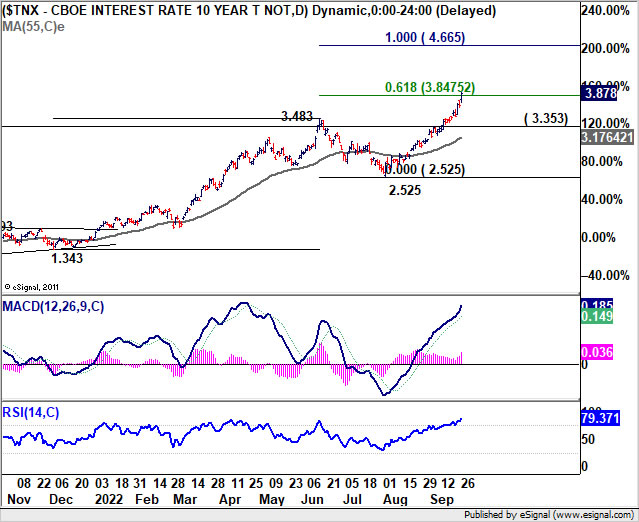
In Asia, at the time of writing, Nikkei is up 0.45%. Hong Kong HSI is down -1.06%. China Shanghai SSE is up 0.26%. Singapore Strait Times is down -0.57%. Japan 10-year JGB yield is up 0.0003 at 0.253. Overnight, DOW dropped -1.11%. S&P 500 dropped -1.03%. NASDAQ dropped -0.60%. 10-year yield rose 0.181 to 3.878.
Fed Mester: Monetary policy needs to be in a restrictive stance
Cleveland Fed President Loretta Mester said yesterday, "when there is uncertainty, it can be better for policymakers to act more aggressively because aggressive and pre-emptive action can prevent the worst-case outcomes from actually coming about."
"Further increases in our policy rate will be needed," Mester said. "In order to put inflation on a sustained downward trajectory to 2%, monetary policy will need to be in a restrictive stance, with real interest rates moving into positive territory and remaining there for some time."
"There will be some pain and bumps along the way as the growth in output and employment slow and the unemployment rate moves up," Mester said. "But the current persistent high inflation is also very painful for many households and businesses."
Fed Bostic: UK growth plan adds uncertainty to the economy
Atlanta Fed President Raphael Bostic said market reaction to UK government's new growth plan, with sharp volatility in Sterling, was a "real concern". There's "a fear that the new actions will add uncertainty to the economy."
The key question will be what does this mean for ultimately weakening the European economy, which is an important consideration for how the U.S. economy is going to perform," he added.
But for now, Bostic gave no indication on how Fed could respond to the development in the UK. "The more important thing is that we need to get inflation under control," he said. "Until that happens, we're going to see I think a lot of volatility in the marketplace in all directions."
SNB Maechler: More signs that price increases are spreading
SNB board member Andrea Maechler said yesterday, "We have tightened monetary policy and raised interest rates to send a clear signal that we will do everything to bring down inflation over time."
"There are ever more signs that price increases are spreading to goods and services which have not been affected so far," she said. "We are acting to make sure that inflation does not become entrenched."
On the question of further rate hike, she said, "I never speak of interest rate expectations. I can only say what the market expects, and it expects the SNB and other central banks to further increase their rates."
RBNZ Orr said tightening cycle very mature, AUD/NZD topping soon?
RBNZ Governor Adrian Orr today, "We believe we still have some work to do, but the good news is because we've done so much already, the tightening cycle is very mature, it's well advanced."
There's s "a little bit more to do before we can drop to our normal happy place, which is to watch, worry and wait for signs of inflation up or down," he said.
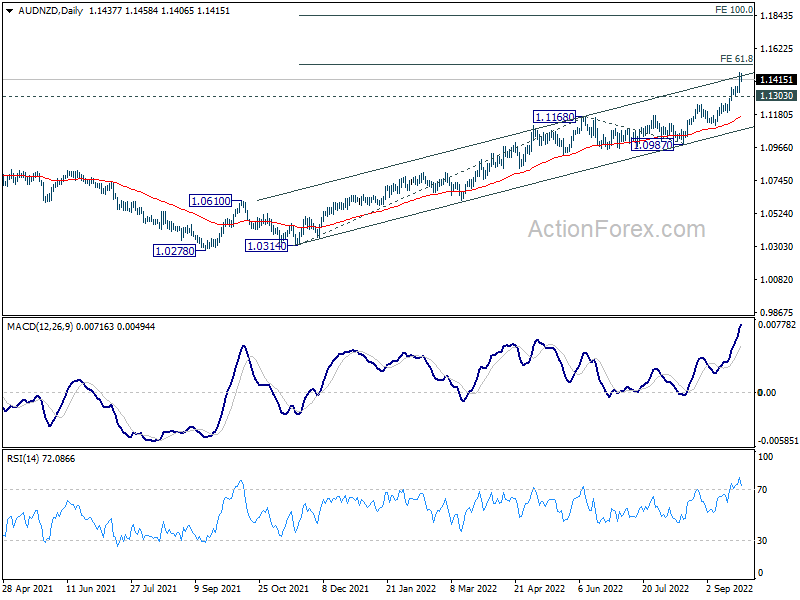
AUD/NZD's rally picks up some momentum recently on expectations that RBA is catching up with RBNZ on tightening. However, the cross is now pressing medium term channel resistance, and in proximity to 61.8% projection of 1.0314 to 1.1168 from 1.0987 at 1.1515. Overbought condition could finally limit upside. Break of 1.1303 will argue that it has turned into a corrective phase.
Nevertheless, firm break of 1.1515 could prompt further upside acceleration to 100% projection at 1.1841.
World Bank cut China growth forecasts to 2.8% in 2022
For 2022, the World Bank downgraded China's growth forecasts sharply from 5.0% (April's) to just 2.8%. On the other hand, ASEAN-5 growth forecasts was upgraded from 4.9% to 5.4%. East Asia & Pacific (excluding China) growth was upgraded from 4.8% to 5.3%. However, East Asia & Pacific as a whole was down graded from 5.0% to 3.2%,
The World Bank said in the release: "Growth in much of East Asia and the Pacific has been driven by recovery in domestic demand, enabled by a relaxation of COVID-related restrictions, and growth in exports. China, which constitutes around 86% of the region's output, uses targeted public health measures to contain outbreaks of the virus, inhibiting economic activity."
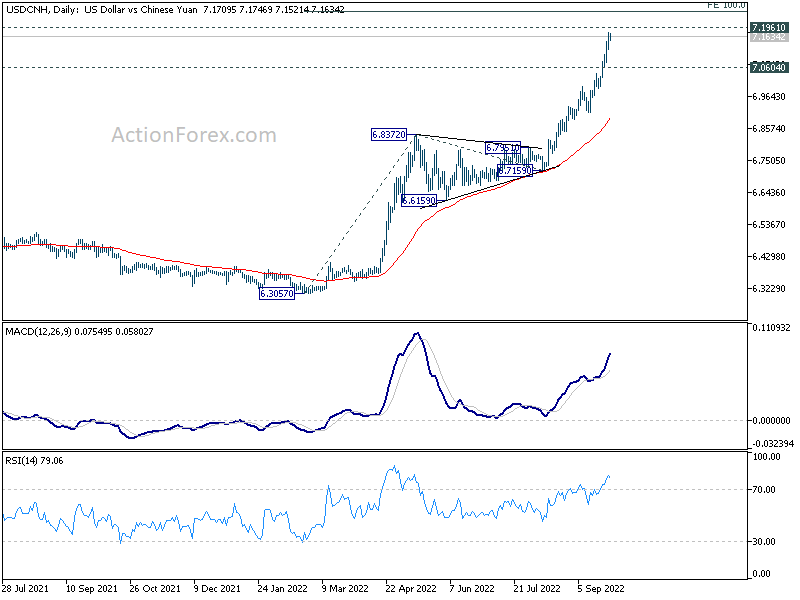
Selloff in Yuan is still in force, with USD/CNH approaching 2020 high at 7.1961. There is so far no clear support for the Yuan at 7 psychological level. Break of 7.1961 will mark the highest level for the pair, lowest for offshore Yuan, since 2008. Technically, USD/CNH might top only after hitting 100% projection of 6.3057 to 6.8372 from 6.7159 at 7.2474.
On the data front
Japan corporate service price index rose 1.9% yoy in August, below expectation of 2.2% yoy. Eurozone will release M3 money supply today. US will release durable goods orders, house price index, consumer confidence and new home sales.
USD/CAD Daily Outlook
Daily Pivots: (S1) 1.3596; (P) 1.3703; (R1) 1.3845; More...
USD/CAD's rally continued and hit as high as 1.3807 so far. Intraday bias stays on the upside for 161.8% projection of 1.2005 to 1.2947 from 1.2401 at 1.3925. Firm break there will target 200% projection at 1.4285. On the downside, below 1.3543 minor support will turn intraday bias neutral and bring consolidations first, before staging another rally.
In the bigger picture, up trend from 1.2005 (2021 low) is still in progress. 61.8% retracement of 1.4667 to 1.2005 (2021 low) at 1.3650 is already met. Next target is 1.4667 (2020 high). This will now remain the favored case as long as 1.3222 resistance turned support holds.
Economic Indicators Update
| GMT | Ccy | Events | Actual | Forecast | Previous | Revised |
|---|---|---|---|---|---|---|
| 23:50 | JPY | Corporate Service Price Index Y/Y Aug | 1.90% | 2.20% | 2.10% | 2.00% |
| 08:00 | EUR | Eurozone M3 Money Supply Y/Y Aug | 5.50% | 5.50% | ||
| 12:30 | USD | Durable Goods Orders Aug | -0.10% | -0.10% | ||
| 12:30 | USD | Durable Goods Orders ex Transportation Aug | 0.30% | 0.20% | ||
| 13:00 | USD | S&P/Case-Shiller Home Price Indices Y/Y Jul | 16.90% | 18.60% | ||
| 13:00 | USD | Housing Price Index M/M Jul | 0.00% | 0.10% | ||
| 14:00 | USD | Consumer Confidence Sep | 104.5 | 103.2 | ||
| 14:00 | USD | New Home Sales Aug | 500K | 511K |
Technical Outlook and Review
USD/JPY:
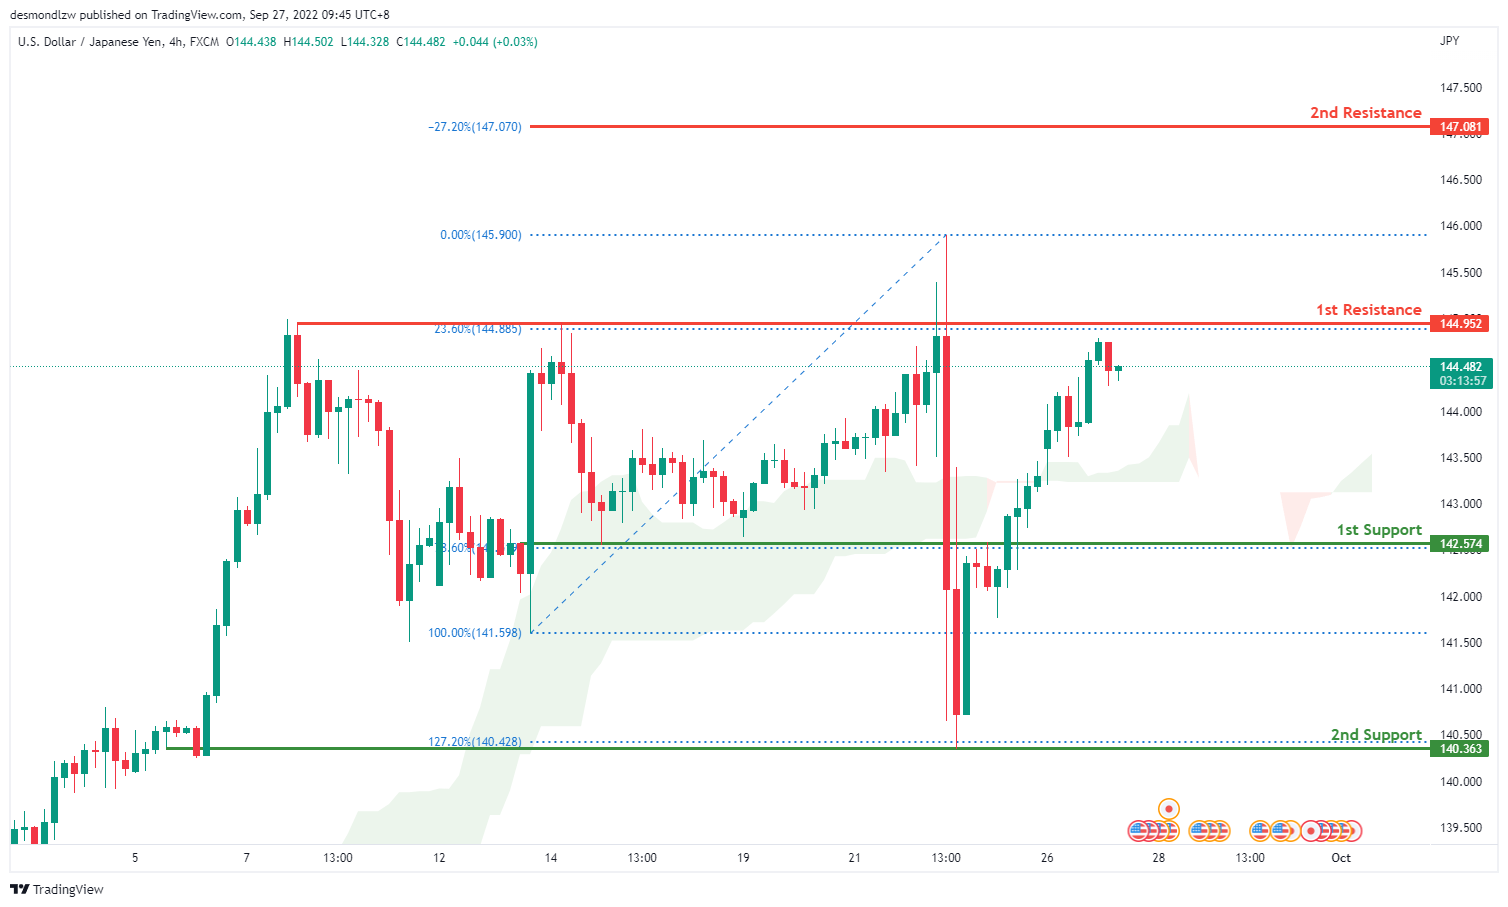
On the H4 chart, price has pushed through very strongly through the 1st support at 142.574 where the 78.6% Fibonacci line lies. If this strong bullish momentum continues, price could potential break above the 1st resistance at 144.952 where the 23.6% Fibonacci line lies and head towards the 2nd resistance at 147.070 where the -27.2% Fibonacci expansion line is. Alternatively, price could reflect back down from the 1st resistance back down towards the 1st support.
Areas of consideration:
- H4 time frame, 1st resistance at 144.952
- H4 time frame, 1st support at 142.574
DXY:
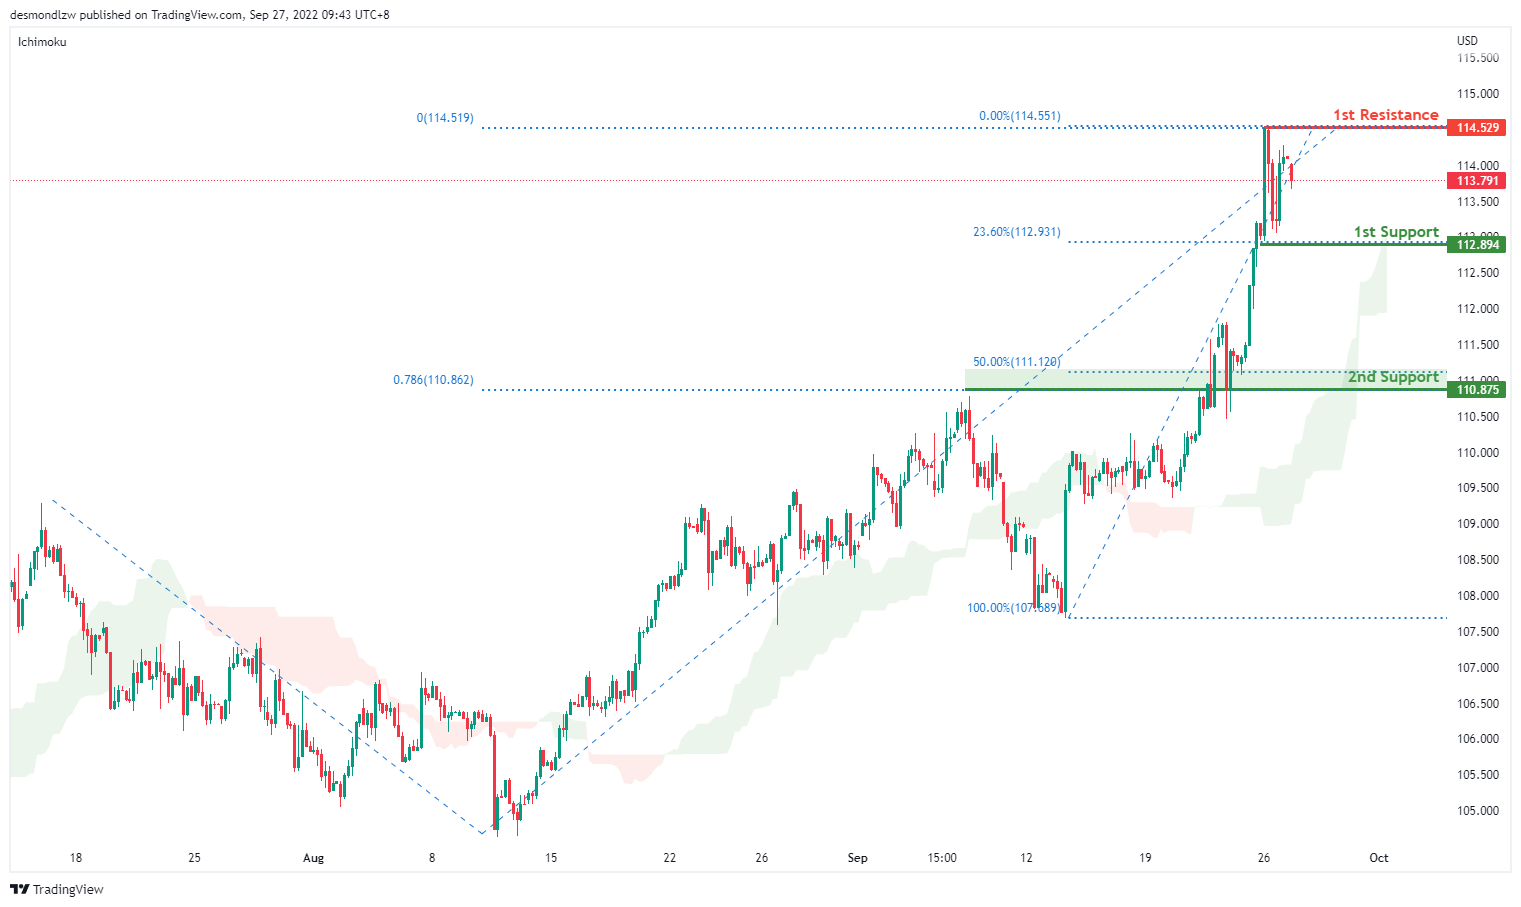
On the H4, price is still respecting the bullish channel and we are bullish bias. Price has pulled back slightly to test the first support at 112.894 where the 23.6% retracement sits. If price breaks this support it should test the second support at 110.875 where the 50% retracement, 78.6% projection and overlap support sits. Alternatively, bullish momentum could bring price back up to first resistance at 114.529 where the previous swing high sits
Areas of consideration:
- H4 time frame, 1st resistance at 114.529
- H4 time frame, 1st support at 112.894
EUR/USD:
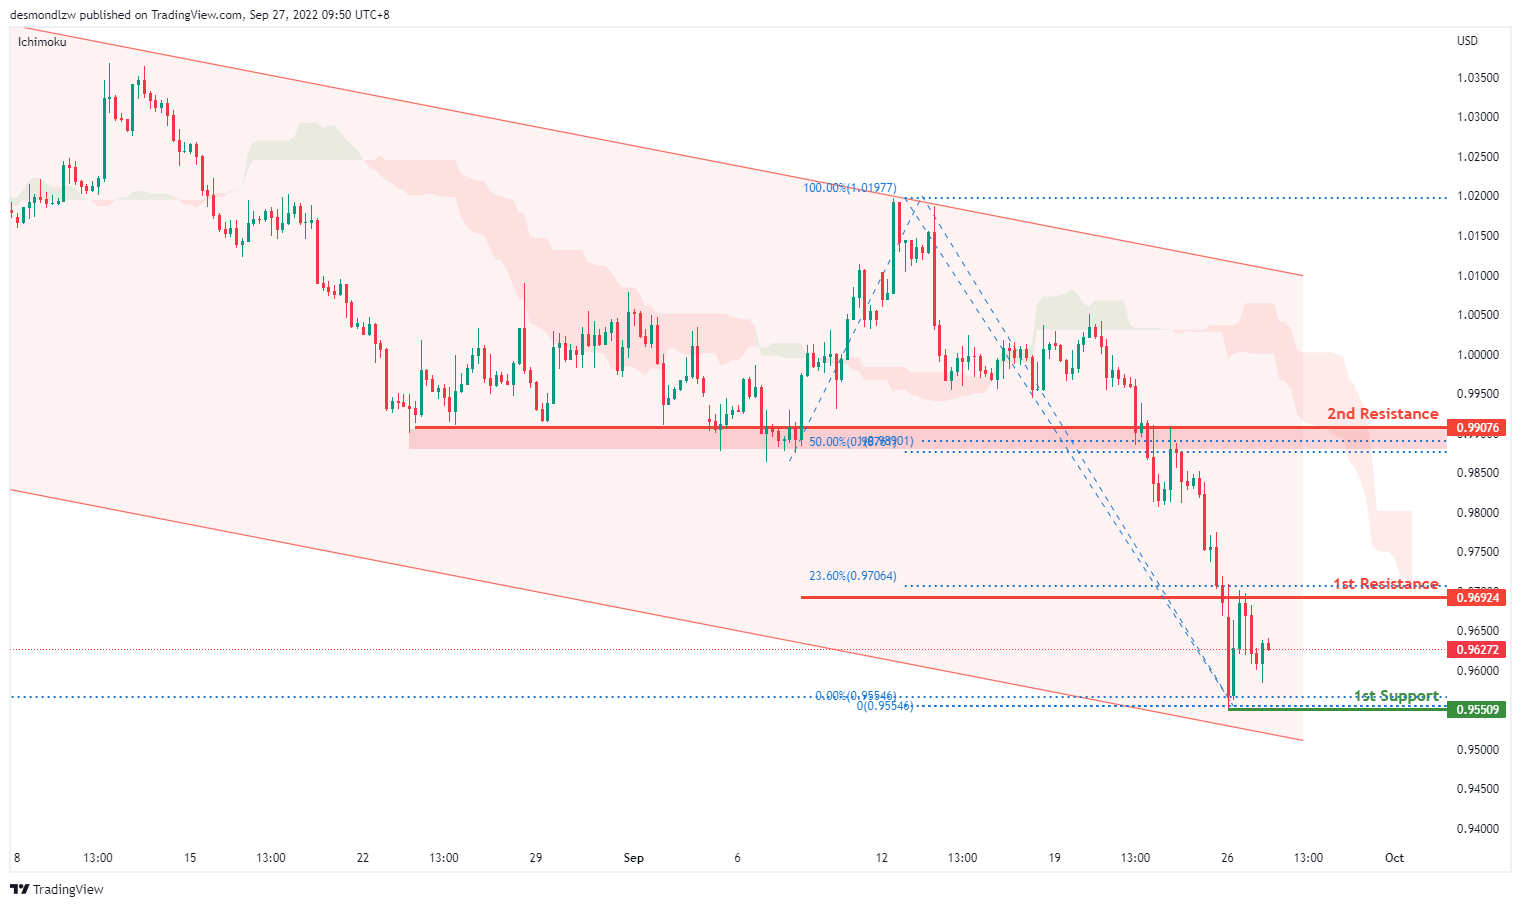
On the H4, price is moving within the channel in a descending manner- we are bearish biased. Price has bounced off the first support and it looks like it’s moving to test the first resistance at 0.9692 where the 23.6% retracement and 145% extension sits. If price breaks this level, it will bring prices to the second resistance at 0.9907 where the 50% retracement and 100% projection sits. Alternatively it could continue with its bearish momentum to bring the price back down to 0.9550 where the previous swing low and 161.8% extension sits.
Areas of consideration :
- H4 1st resistance at 0.9692
- H4 1st support at 0.9550
GBP/USD:
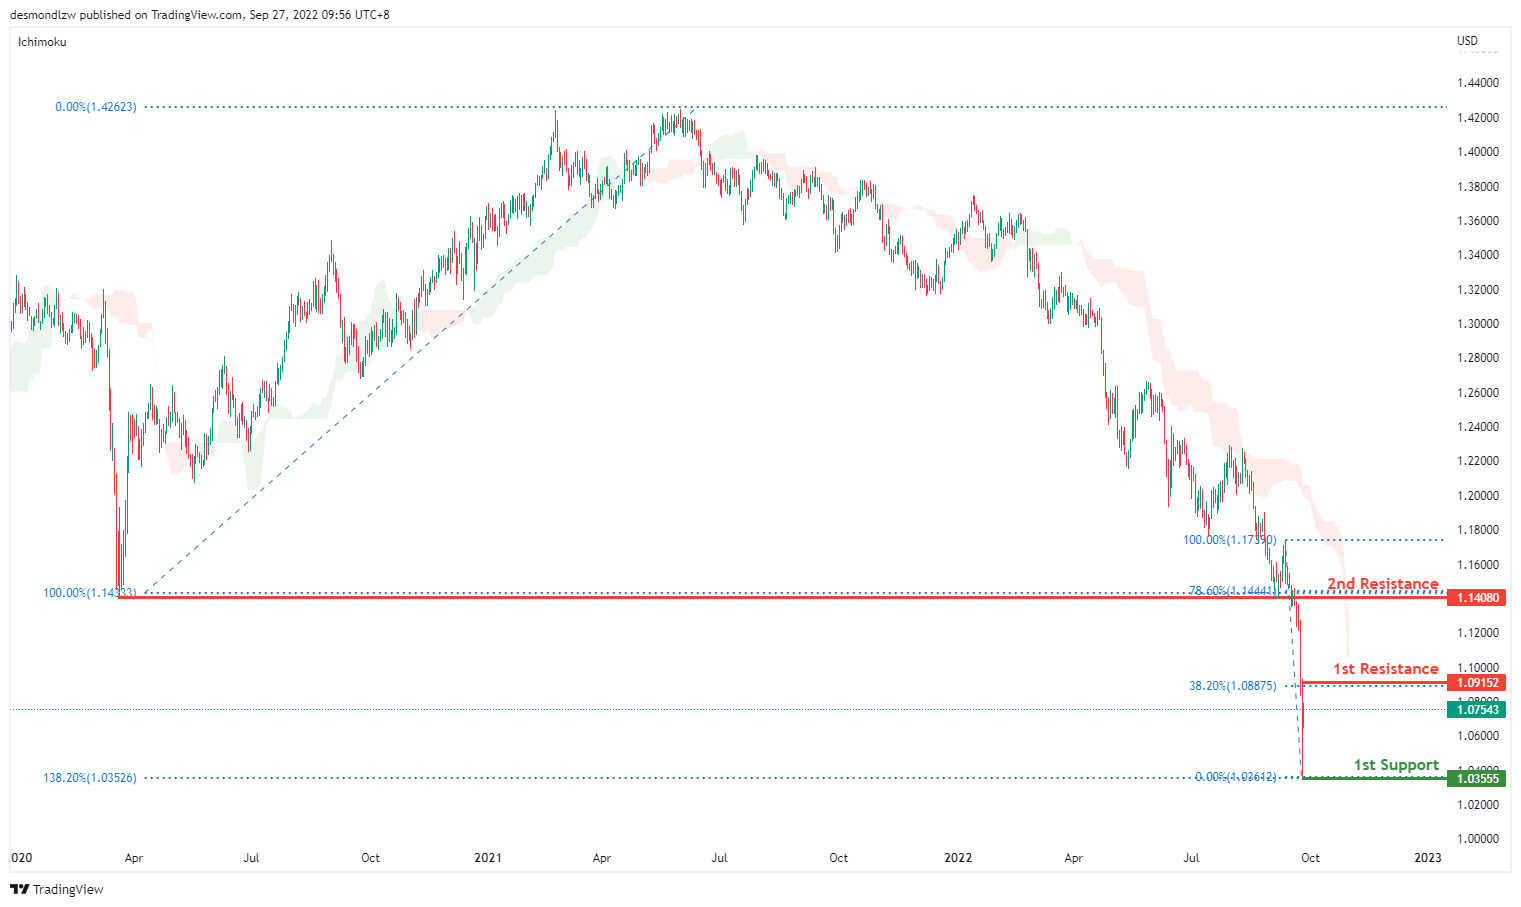
On the daily time frame, prices are still moving in a bearish momentum hence we are bearish biassed. Price has already tested the previous swing low at 1.0355 where the 138.2% extension sits. If bearish momentum continues, it should bring price to 0.9665 where the 161.8% extension sits. Alternatively price could pull back to test the first resistance at 1.0915 where the 38.2% retracement sits then the second resistance at 1.1408 where the previous swing low and 78.6% retracement sits
Areas of consideration:
- H4 1st resistance at 1.0915
- H4 1st support at 1.0355
USD/CHF:
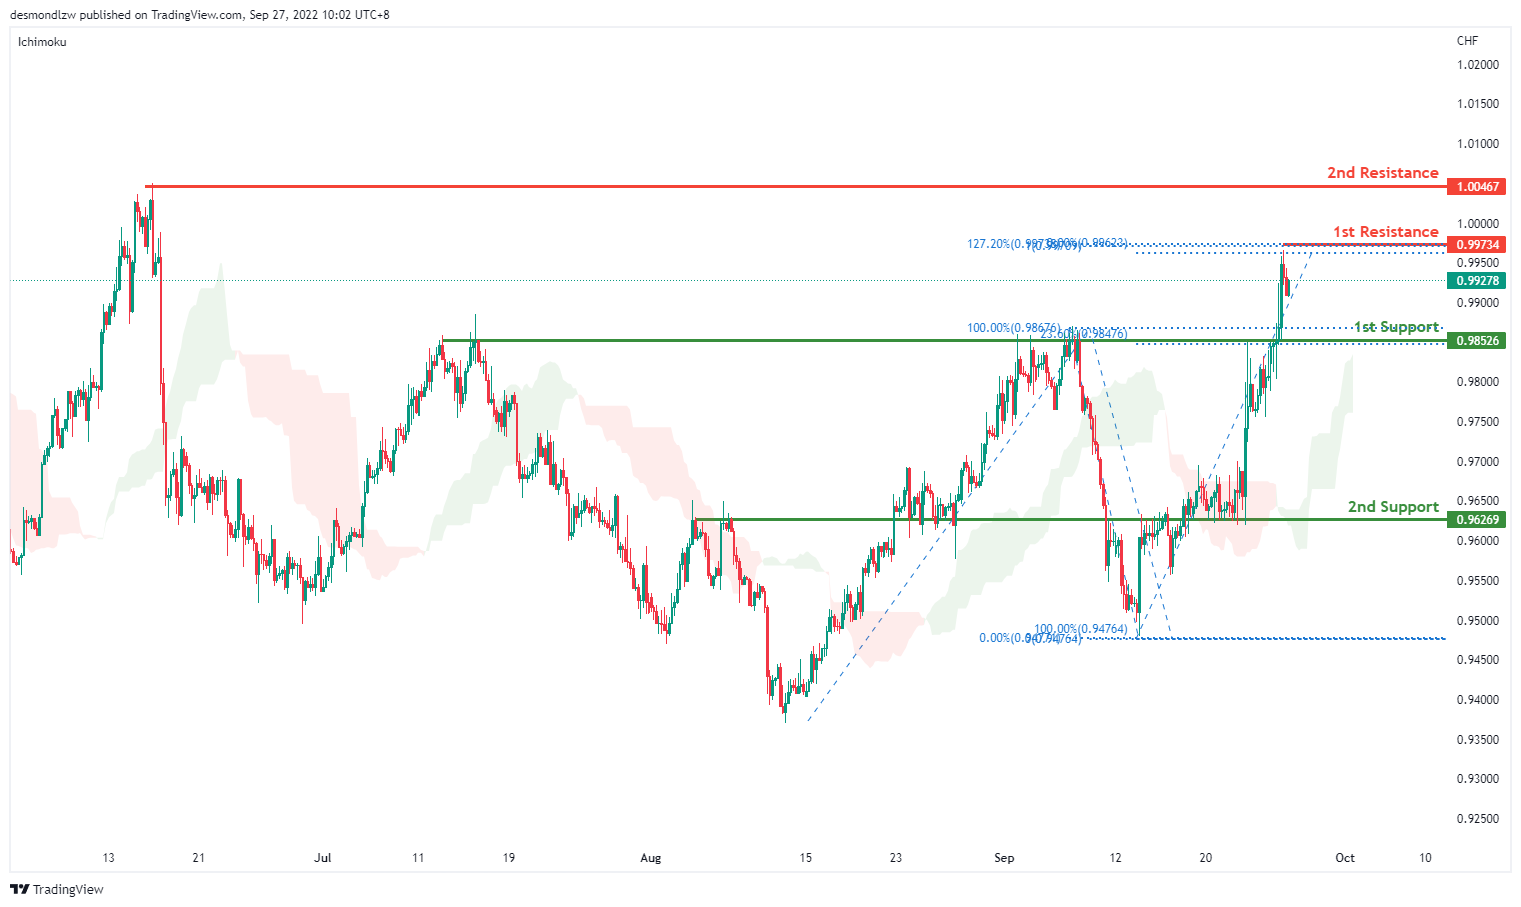
On the H4, prices have broken the descending channel and we are currently bullish biased. Price has broken the first support and is moving toward the first resistance at 0.9973 where the 100% projection,127.2% extension and swing high sits. If bullish momentum continues, it should bring price to the second resistance at 1.0046 where the previous swing high sits. Alternatively, price could pull back to test the first support at 0.9852 where the 23.6% retracement and overlapping resistance sits. If it breaks the first support, it should bring price to the second support at 0.9626 where the previous swing low sits.
Areas of consideration
- H4 1st support at 0.9852
- H4 1st resistance at 0.9973
XAU/USD (GOLD):
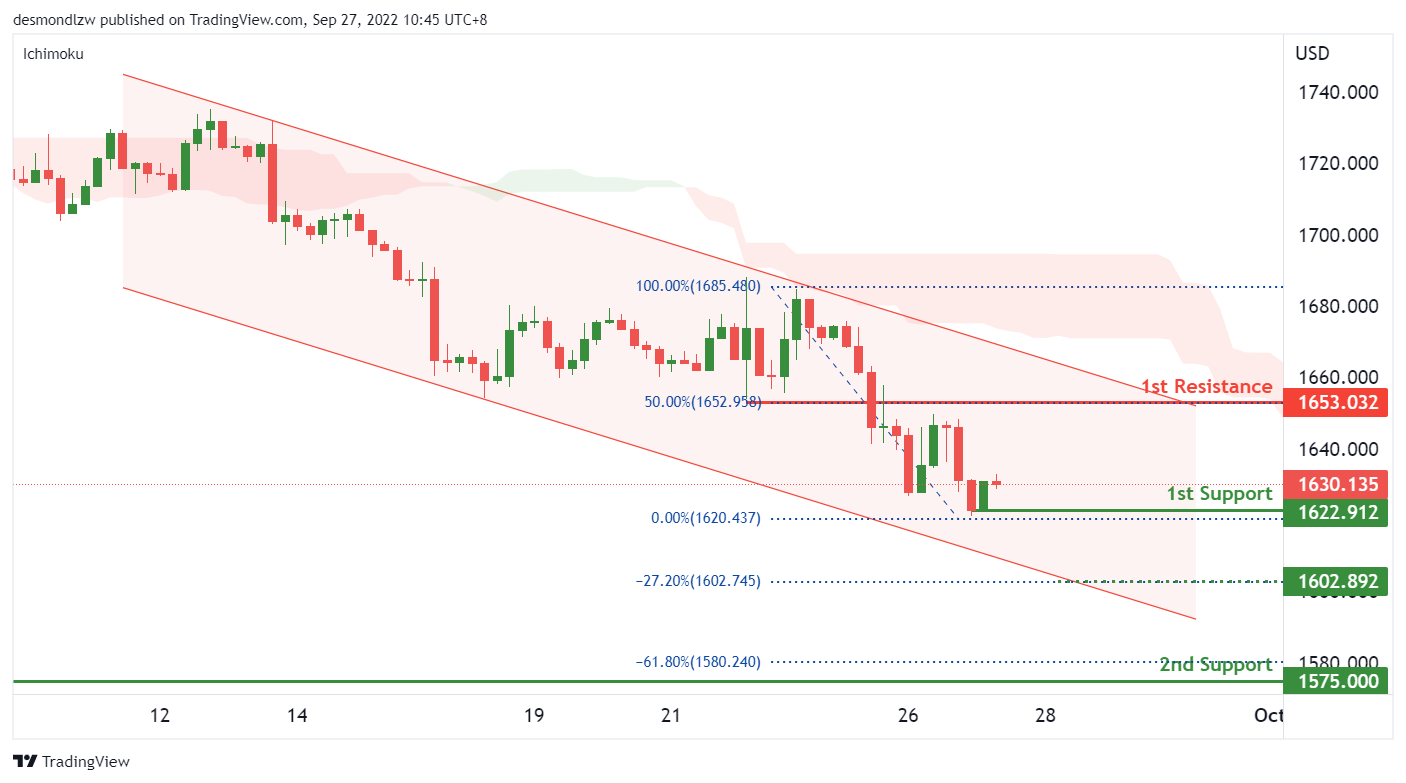
On the H4, with the price is trading within the bearish channel and maintaining below the ichimoku cloud, leading to a bearish bias that price may drop to the 2nd support of 1575, which is in line with the swing low from March 2020 and 61.80% fibonacci expansion level. The 1st support of 1622.91 needs to be broken to trigger the next move down to the 2nd support level, with a risk level at 1602 which is inline with the 27.20% fibonacci expansion level.
Areas of consideration:
- H4 time frame, 1st resistance at 1653
- H4 time frame, 1st support at 1622.91
- H4 time frame, 2nd support at 1575
AUD/USD:
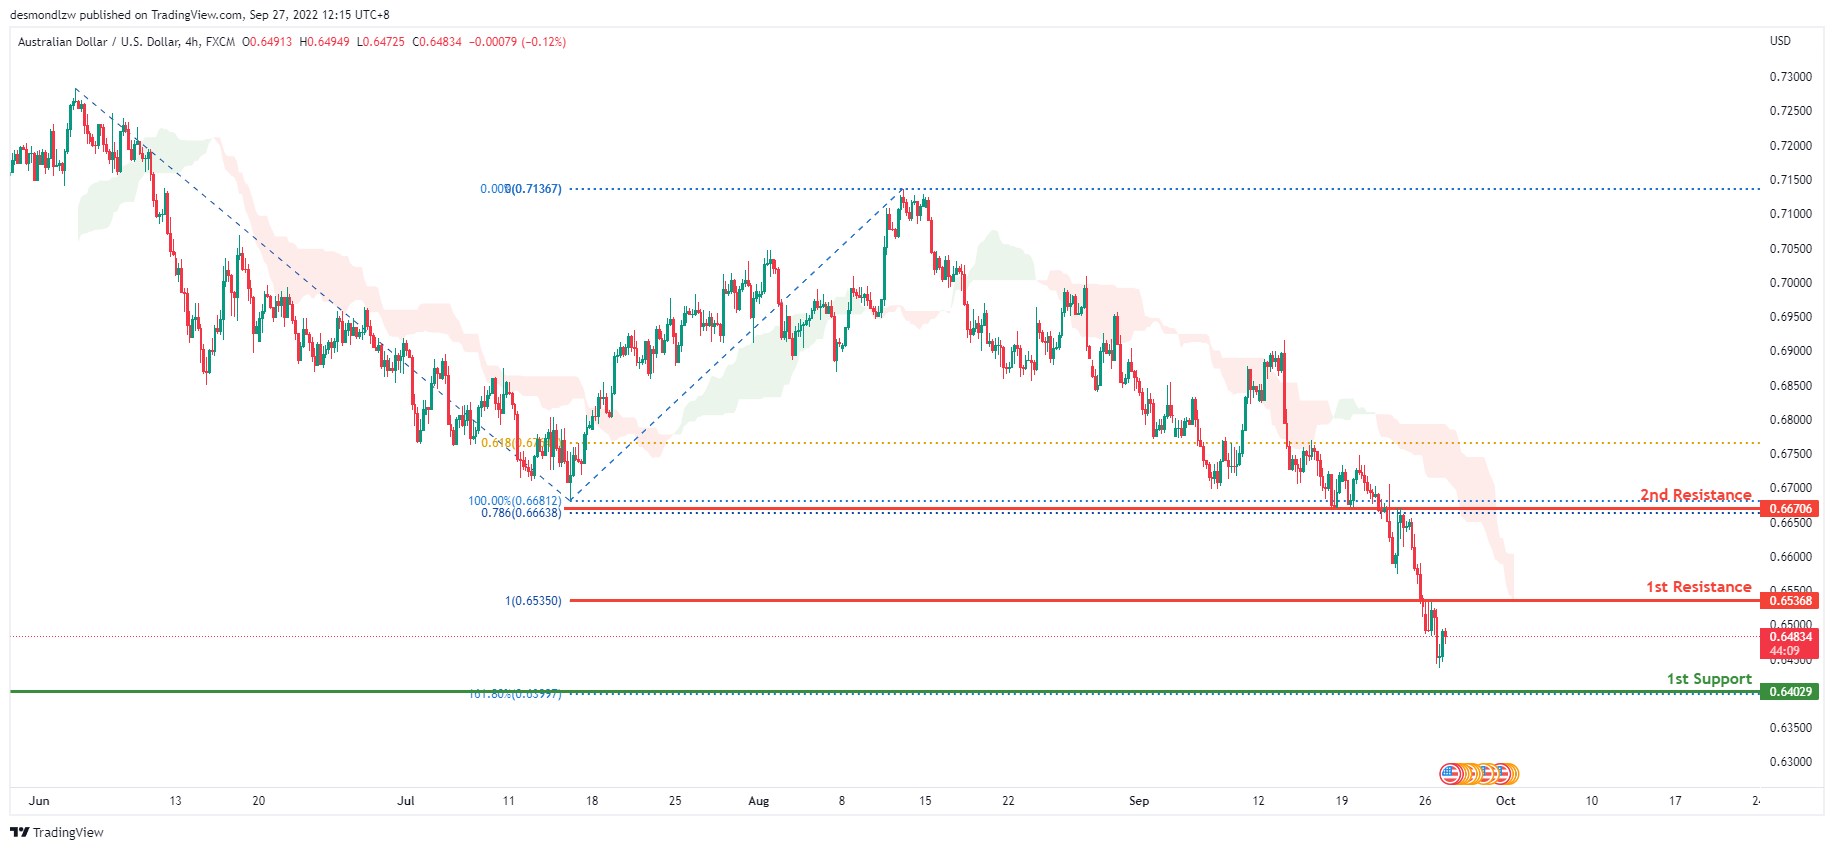
On the H4, the price is moving in a strong bearish trend. To add on confluence to this bias, price is below the Ichimoku cloud which indicates a bear market. Price has broken below the 1st resistance where the 100% Fibonacci line lies, expecting price to continue bearish to head towards the 1st support at 0.64029 where the 161.8% Fibonacci extension line lies.
Areas of consideration
- H4, 1st resistance at 0.65368
- H4, 1st support at 0.64029
NZD/USD:
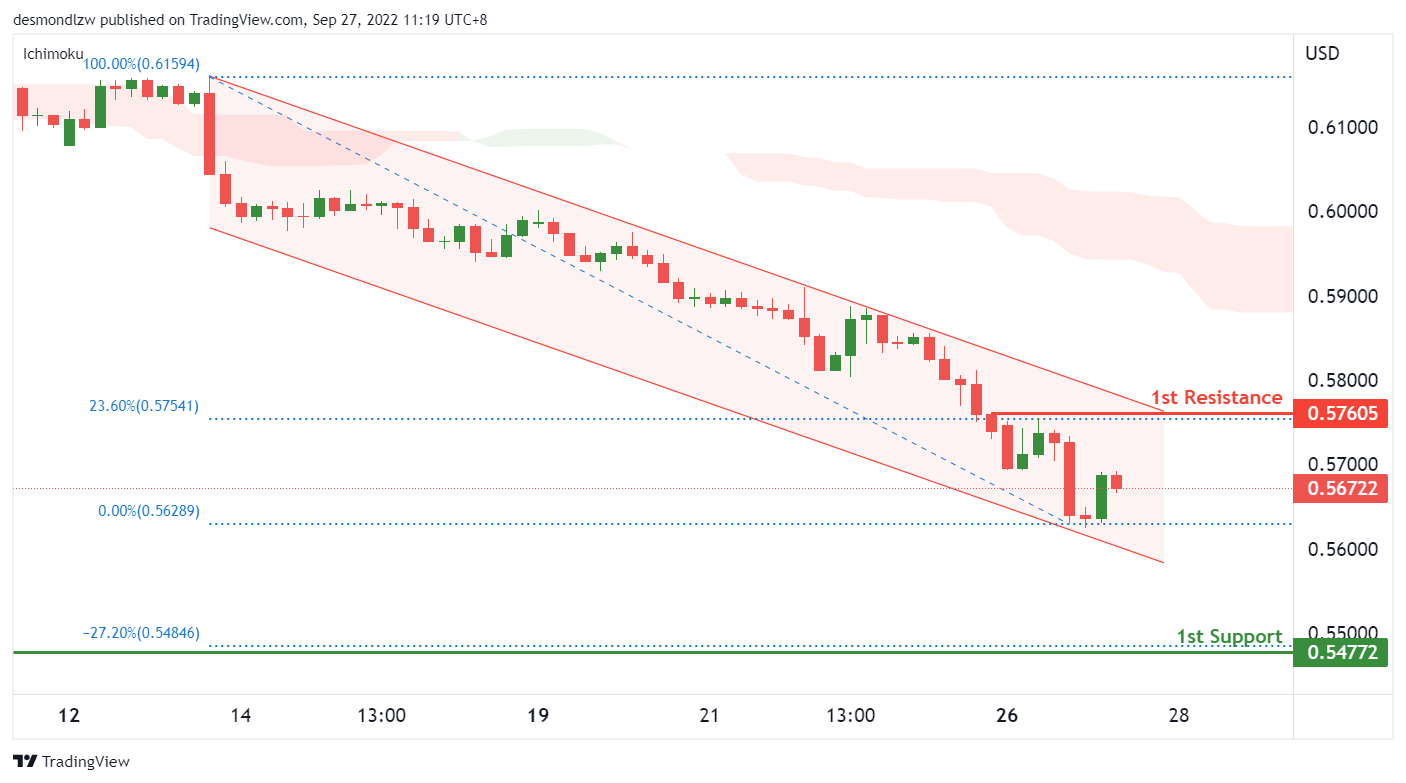
On the H4, with the price moving within the descending channel, below ichimoku cloud, we have a bearish bias that the price may drop to the 1st support at 0.5477, which is in line with the 27.20% fibonacci expansion level and swing low from March 2020. There is a risk level at 0.5630 which is where our intermediate support is, which needs to be broken to trigger the next move down to the support level .
Areas of consideration:
- H4 time frame, 1st support at 0.5477
- H4 time frame, 1st resistance at 0.5760
USD/CAD:
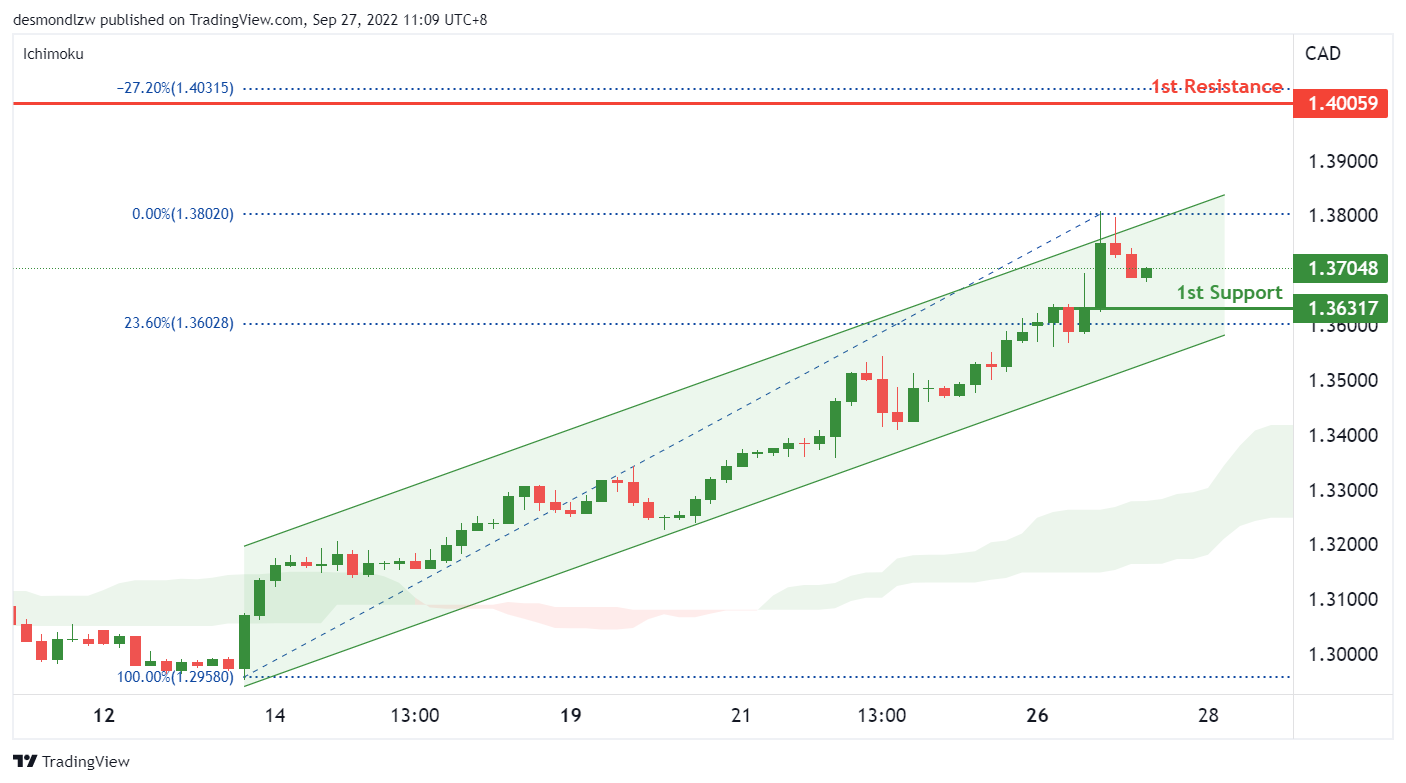
On the H4, with the price having trading within the ascending channel and staying above the ichimoku cloud, we have a bullish bias that the price may rise to the 1st resistance at 1.40, major swing high from May 2020. There is a risk level at 1.38 which is where our intermediate resistance, this level needs to be broken to trigger the next move up to our resistance level.
Areas of consideration:
- H4 time frame, 1st resistance at 1.40
- H4 time frame, 1st support at 1.3631
OIL:
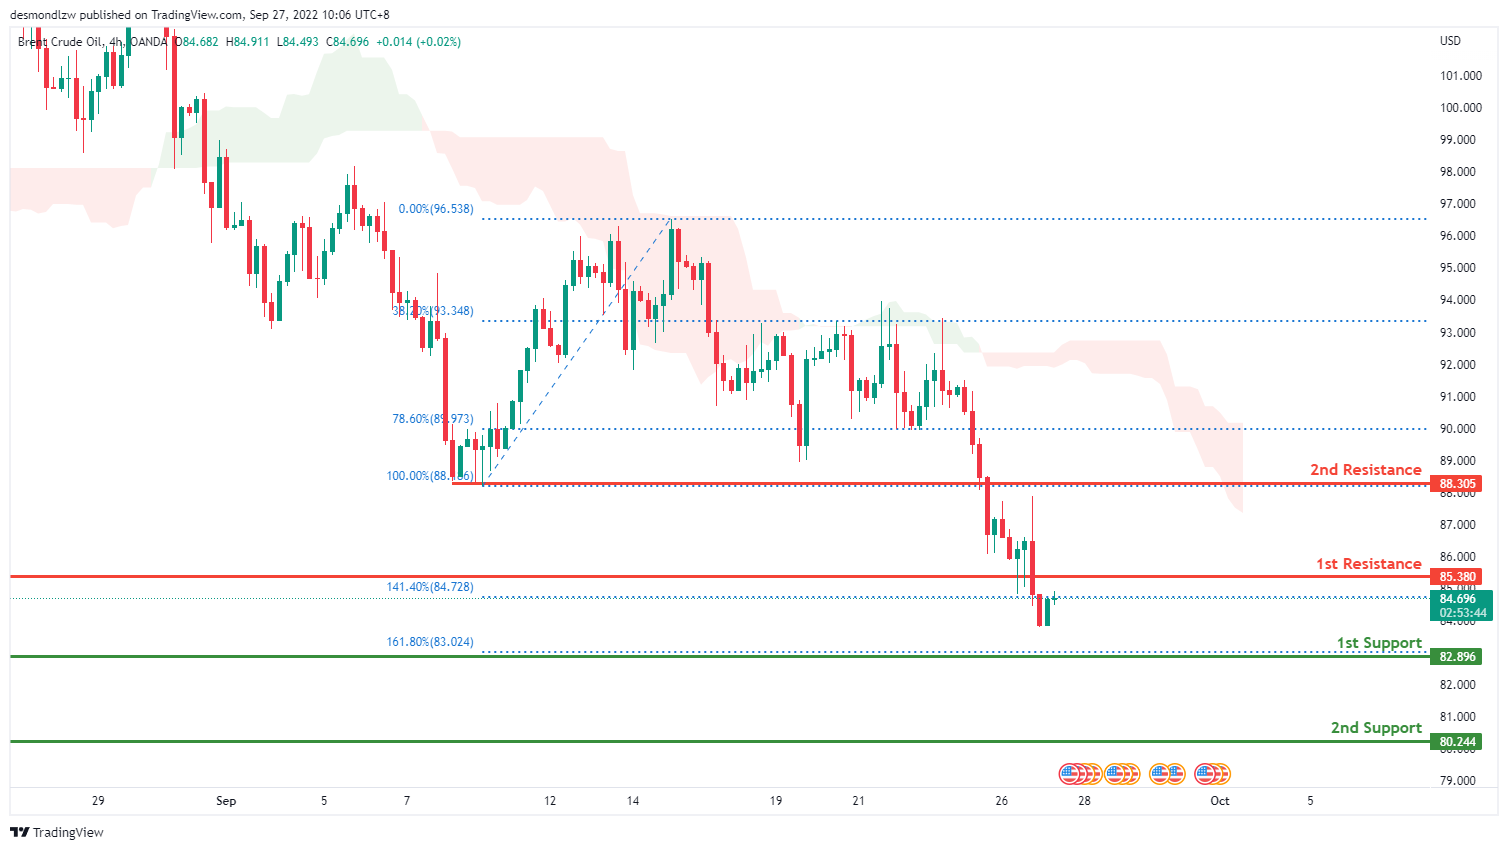
On the H4, oil is on a bearish trend and to add confluence to this, the price is below the ichimoku cloud which indicates a bear market. Price has broken through the 1st resistance at 85.380 where the 141.4% Fibonacci extension lies. If the bearish momentum continues, expect price to go to the 1st support at 82.896 where the 161.8% Fibonacci extension line is.
Areas of consideration:
- H4 time frame, 1st resistance at 85.380
- H4 time frame, 1st support at 82.896
Dow Jones Industrial Average:
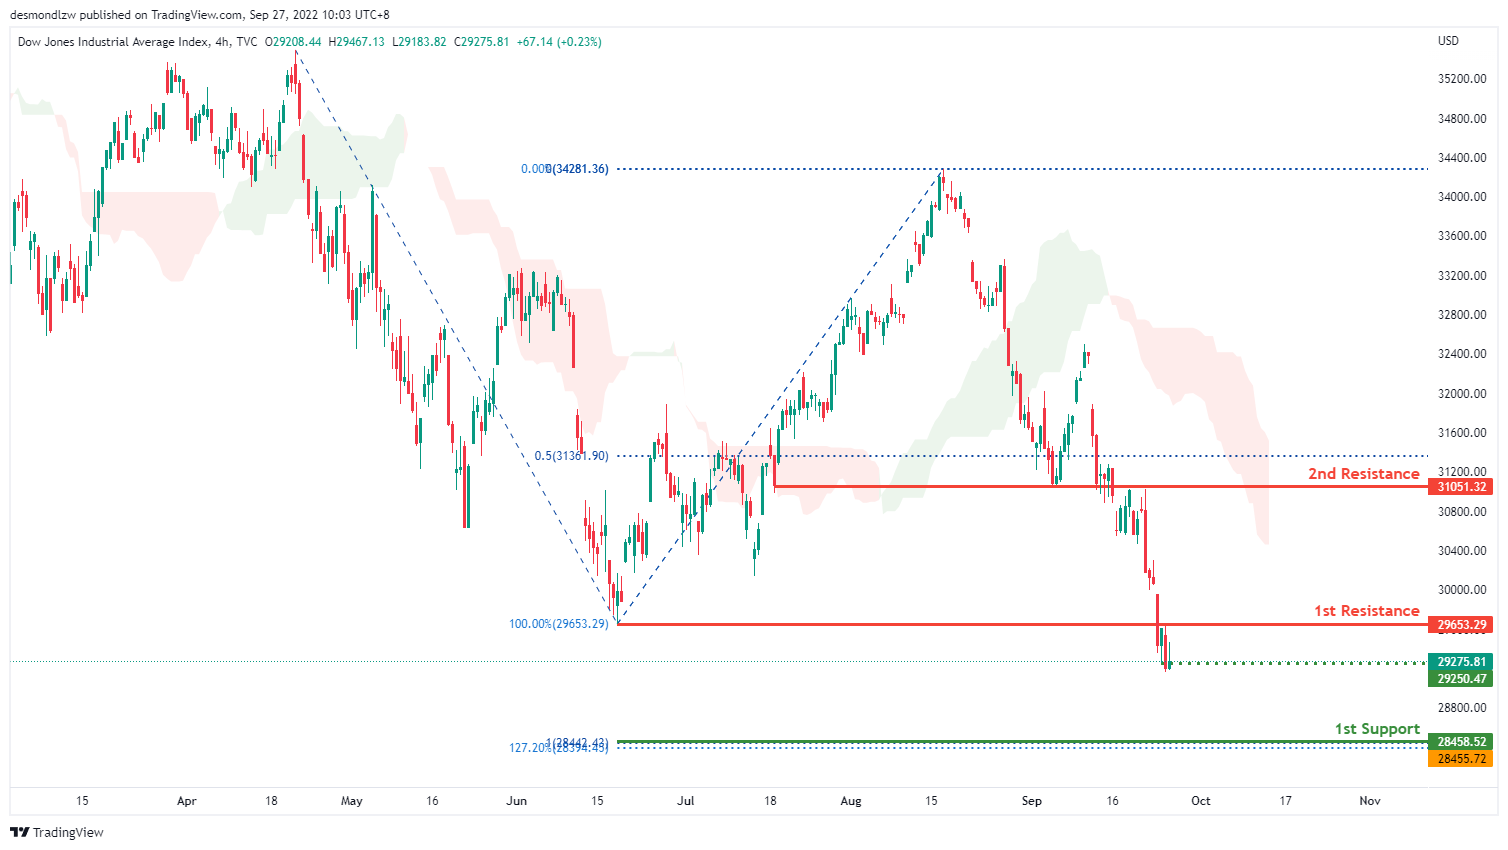
On the H4, price is on a very bearish trend. To add confluence to this, price is below the ichimoku cloud which indicates a bearish market. Price has also broke through the 1st resistance at 29653.29, where the 100% Fibonacci line and previous swing low lies. Price might continue heading downwards towards the 1st support at 28458.52 where the 127.2% Fibonacci extension and 100% Fibonacci projection line is.
Areas of consideration:
- H4 time frame, 1st support at 28458.52
- H4 time frame, 1st resistance at 29653.29
DAX:
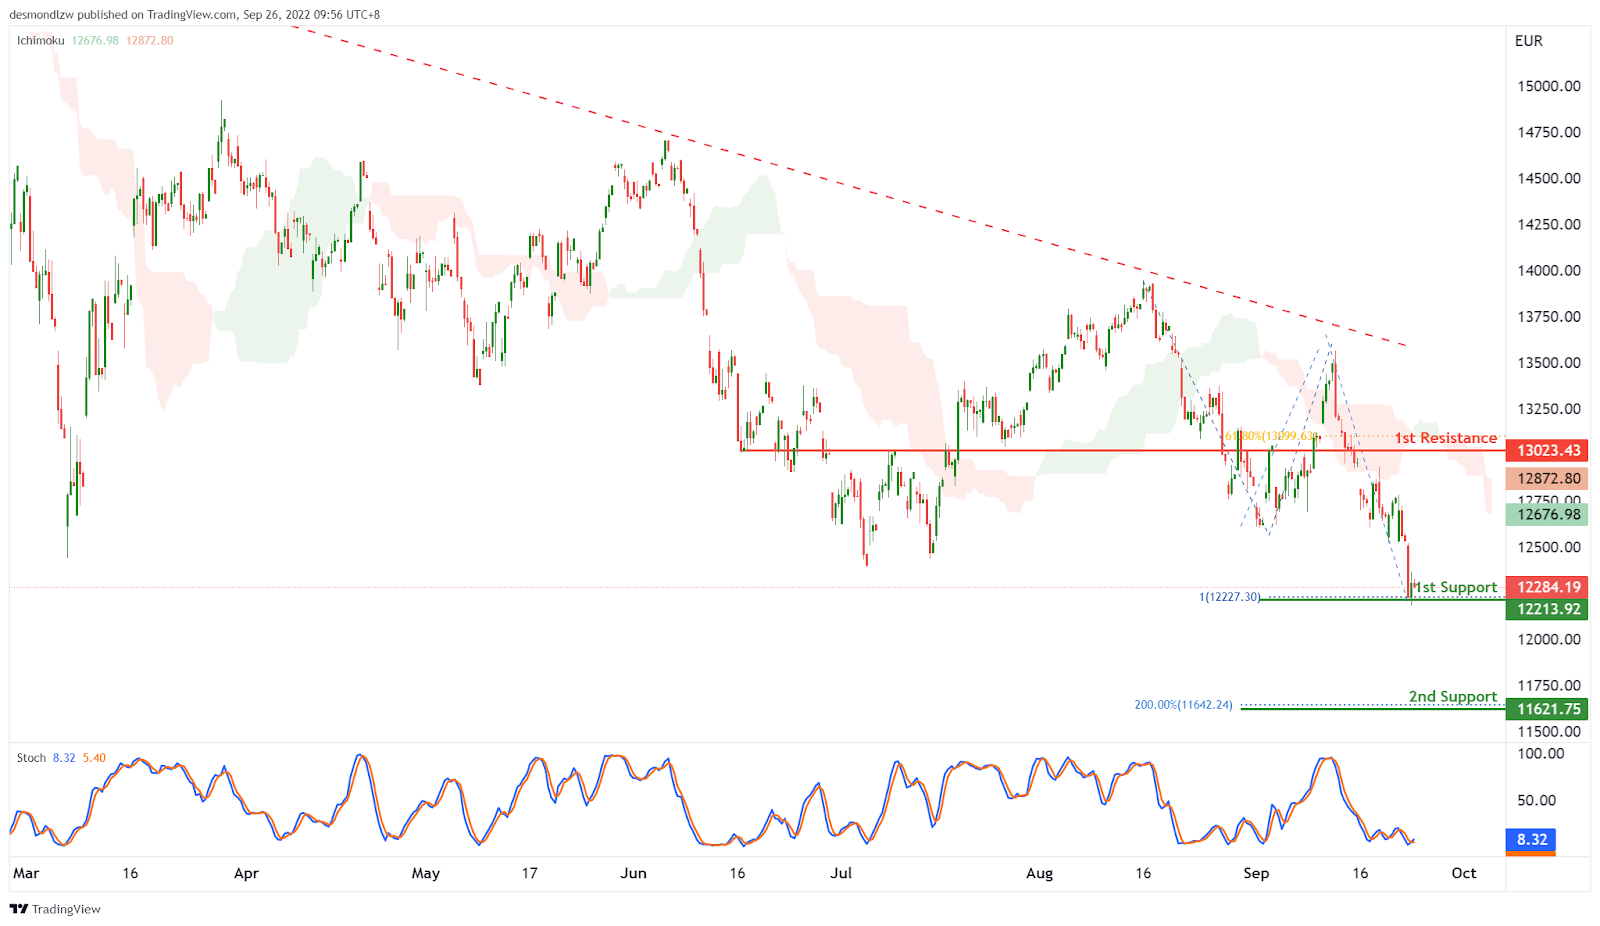
On the H4, with the price moving below the descending trendline and below ichimoku cloud, we have a bearish bias that the price may drop from the 1st support at 12213.92, which is in line with the swing lows and 100% fibonacci projection. If the 1st support is broken, the next support level could be at 11621.75, where the 200% fibonacci extension is. Alternatively, the price may rise to the 1st resistance at 13023.43, where the 61.8% fibonacci retracement and overlap resistance are.
Areas of consideration:
- H4 time frame, 1st support at 12213.92
- H4 time frame, 2nd support at 11621.75
ETHUSD:
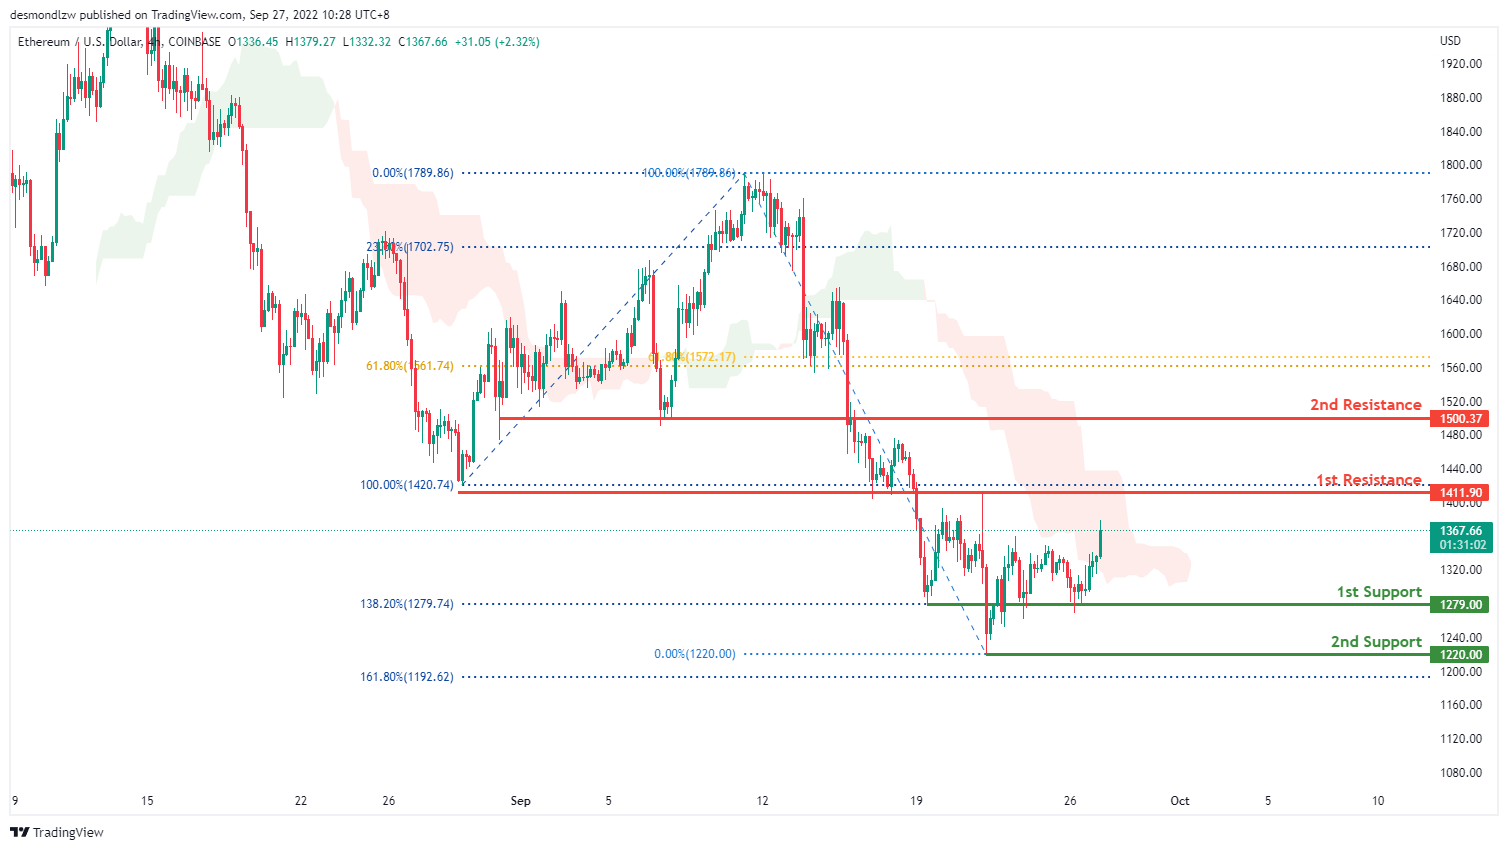
On the H4, overall price is very bearish on ETHUSD. Price has reflected off the 1st support at 1279.74 where the 138.2% Fibonacci line lies 3 times which indiciates a retail triple bottom which can indicate a bullish trend forming on the short term. Looking for price to continue heading upwards towards the 1st resistance at 1411.90 where the 100% Fibonacci projection line lies.
Areas of consideration:
- H4 time frame, 1st resistance of 1411.90
- H4 time frame, 1st support at 1279.00
BTCUSD:
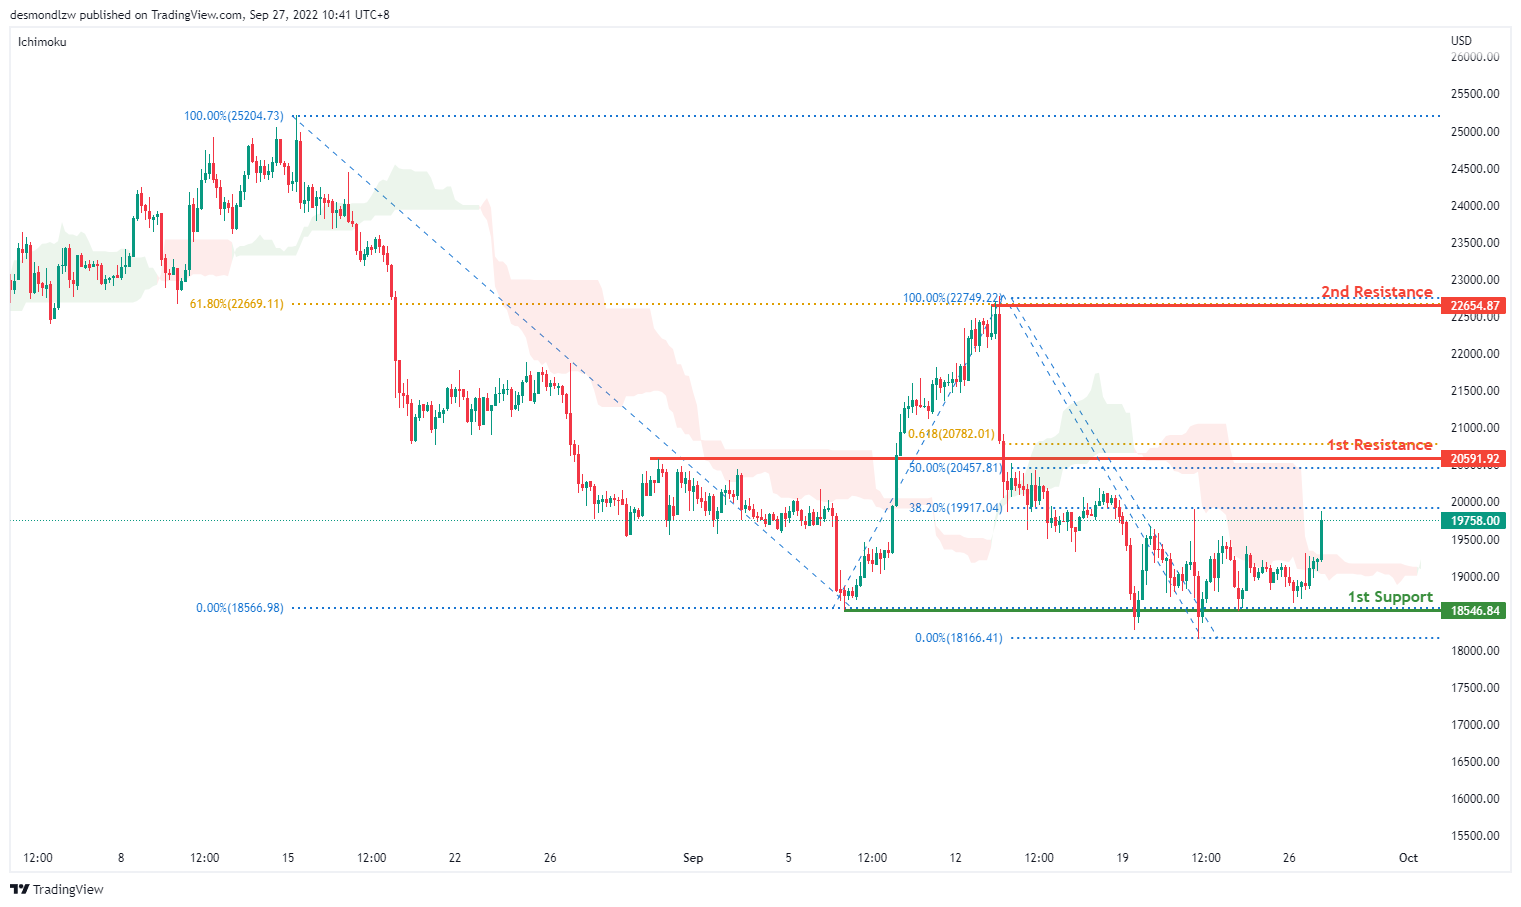
On the H4, with the price having broken the ichimoku cloud, we are bullish bias. Price looks like it’s moving toward the first resistance at 20591.92 where the 50% retracement and 61.8% projection sits. If it breaks this level, it should move to the second resistance at 22654.87 where the 100% projection and 61.8% retracement sits. Alternatively, price could pull back to test the first support at 18546.84
Areas of consideration:
- H4 time frame, 1st support at 18546.84
- H4 time frame, 1st resistance at 20591.92
S&P 500:
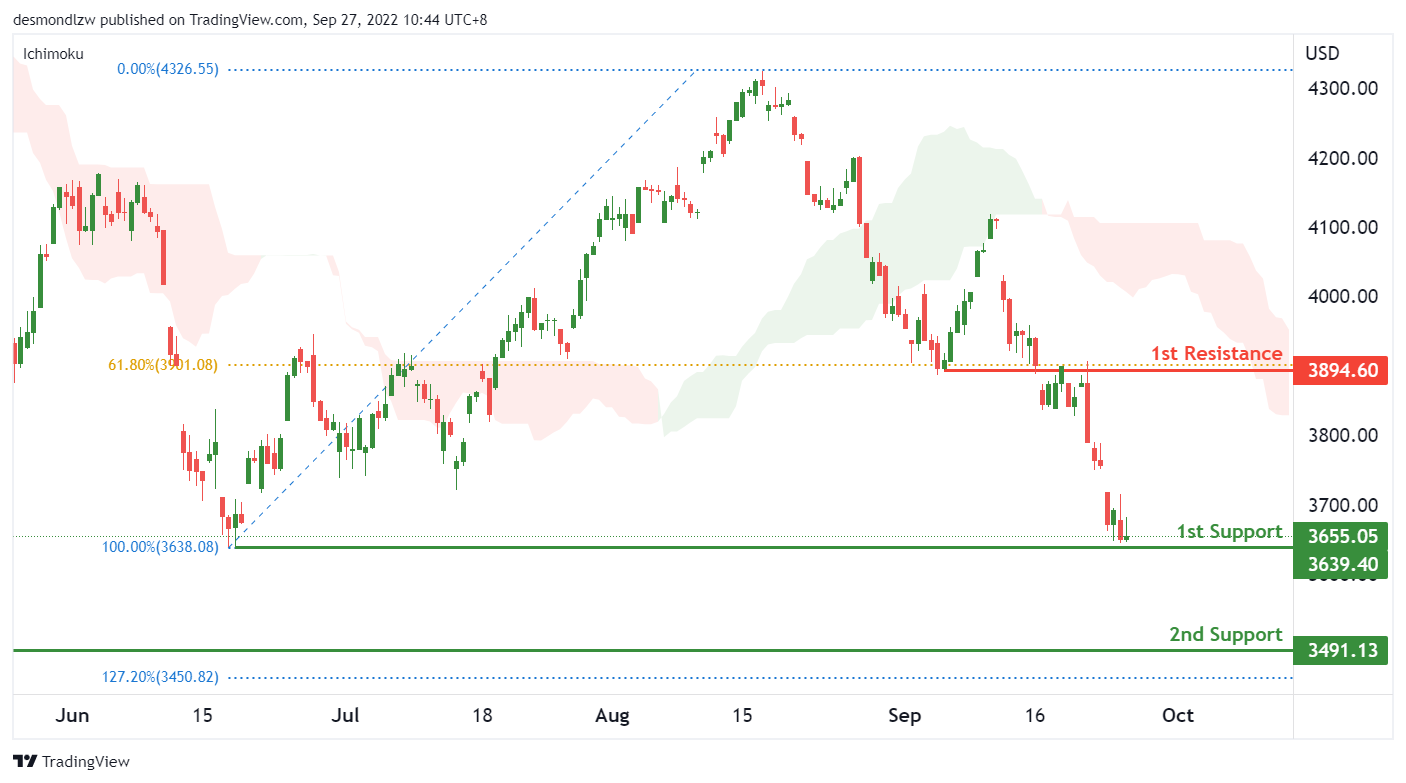
On the H4, with the price on a strong bearish trend and below the ichimoku cloud, we have a bearish bias that price may drop to the 2nd support of 3491.13, which is in line with the 127.2% fibonacci extension and previous swing low from November 2020. The 1st support of 3639.40 and previous swing low from June 2022 needs to be broken to trigger the next move down to the 2nd support level.
Areas of consideration:
- H4 time frame, 1st resistance at 3894.60
- H4 time frame, 1st support at 3639.40
- H4 time frame, 2nd support at 3491