Sample Category Title
USD/JPY Outlook: Extended Consolidation to Precede Fresh Bulls
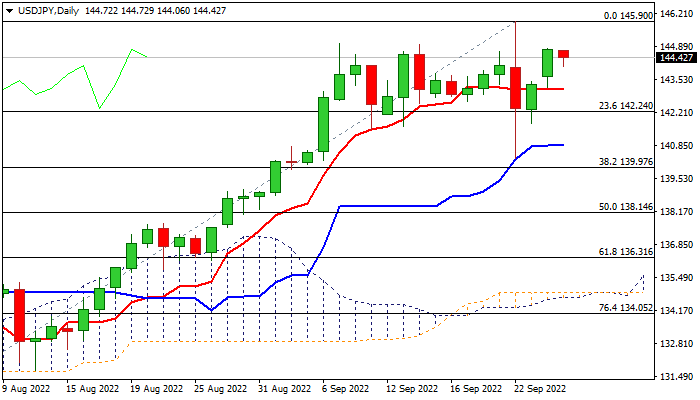
The USDJPY edges lower in Asian/early European session on Tuesday, after two-day rally lost steam on approach to initial barrier at 145.00 (former tops), as risk appetite starts to return to play.
Overall picture remains bullish, but near-term action is losing momentum, after large swings on Japan’s intervention failed to register a clear break out of near-term congestion, suggesting that the intervention did not manage to provide a substantial support to Japanese yen, while the dollar remains well supported by safe-haven flows and hawkish Fed.
Daily Tenkan-sen and Kijun-sen are in bullish setup but turned sideways, signaling prolonged consolidation before bulls regain full control.
Daily Tenkan-sen offers initial support at 143.12, followed by 142.24 (Fibo 23.6% of 130.39/145.90 rally), where dips should find solid ground.
Only break below daily Kijun-sen (140.85) would weaken near-term structure and risk test of pivotal 140.00 support zone (psychological/Fibo 38.2% of 130.39/145.90.
Res: 144.78; 145.00; 145.90; 146.76.
Sup: 144.06; 143.54; 143.12; 145.55.
Update to Our Fed Funds Forecast: When the Facts Change, We Change Our Minds
Summary
- We had been forecasting that the FOMC would raise its target range for the federal funds rate by 100 bps more between now and early next year. But two developments have caused us to revise our forecast higher.
- First, the economy is showing signs of resiliency, which will necessitate more monetary tightening to slow growth sufficiently to bring inflation back toward the Fed's target of 2%.
- Second, the FOMC appears willing to do "whatever it takes" to rein in inflation. In that regard, the so-called dot plot now shows that the vast majority of Committee members believe that 100 bps to 125 bps of further tightening is warranted by the end of the year. Furthermore, most policymakers expect a few more rate hikes early next year.
- We now look for the FOMC to hike its target range for the fed funds rate by 75 bps at the November 2 meeting and by 50 bps at the policy meeting on December 14. We think the Committee will tighten further early next year with 25 bps rate hikes at both the February 1 and the March 22 meetings. If realized, the target range for the fed funds rate would top out at 4.75%-5.00% in March 2023.
- In our view, the FOMC will not cut rates at the first sign of economic weakness to ensure that inflation is moving convincingly back toward target. But with the economy in recession, the unemployment rate rising and inflation receding considerably, we expect the FOMC will reverse course in the fourth quarter of next year. Specifically, we look for the Committee to cut rates by 50 bps in Q4-2023 with another 175 bps of easing by Q3-2024.
Skyrocketing inflation has caused the Federal Open Market Committee (FOMC) to tighten monetary policy significantly this year. Specifically, the FOMC has raised its target range for the federal funds rate by 300 bps since March, the fastest pace of rate hikes in more than 40 years. We had been looking for the Committee to hike rates by another 100 bps by early next year. But recent developments have led us to believe that even more tightening lies ahead, and we now forecast that the FOMC will raise rates by another 175 bps before it is finished tightening policy.
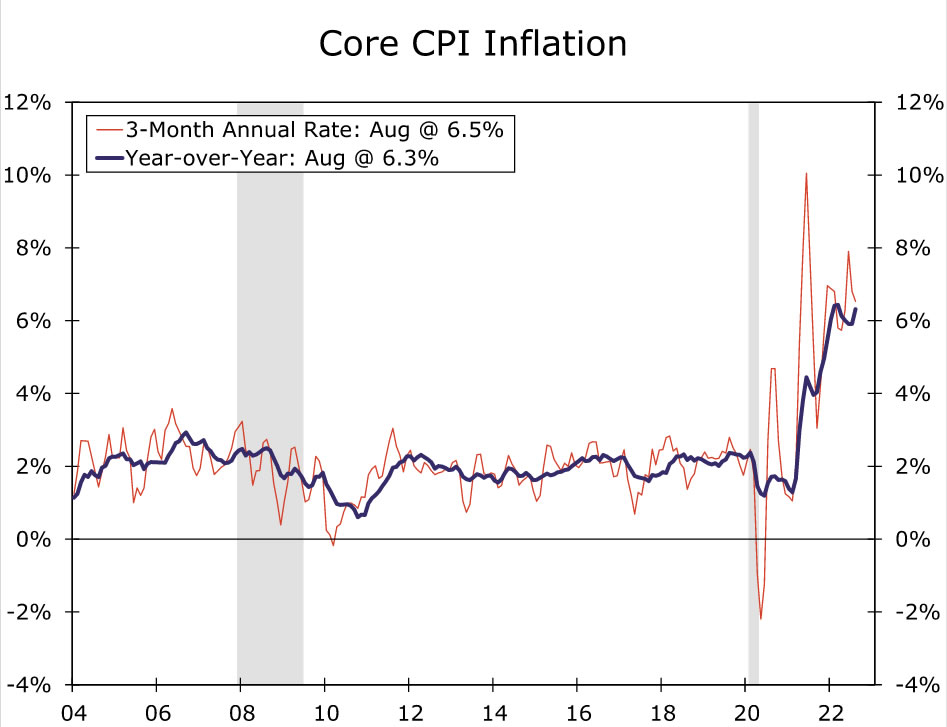
The update to our forecast reflects, at least in part, the apparent resiliency of the U.S. economy in recent weeks. Nonfarm payrolls rose by 315K in August, well above the average monthly increase of roughly 190K that the economy generated during the long expansion of 2010-2019. Tightness in the labor market has pushed wages significantly higher, with average hourly earnings up more than 5% over the past year. Not only have sizable wage gains helped to sustained consumer spending—real consumer spending likely rose again in August—but they are not consistent with an inflation rate of 2%, which is the Fed's target rate. In that regard, the core CPI rose at an annualized rate of 6.5% between May and August (Figure 1).
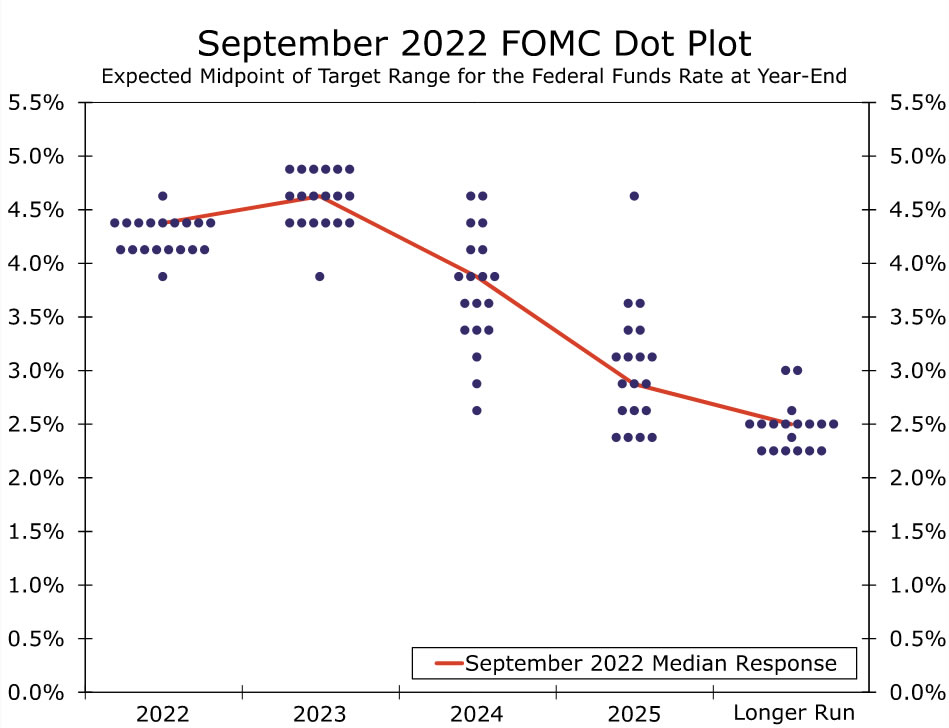
Our updated forecast for the fed funds rate also reflects the Fed's apparent willingness to do "whatever it takes" to rein in inflation. As expressed by Fed Chair Jerome Powell in his August 26 speech in Jackson Hole, "the FOMC's overarching focus right now is to bring inflation back down to our 2 percent goal." This commitment was visibly expressed in the "dot plot" that the Committee released at the conclusion of its policy meeting on September 21. The vast majority of FOMC members see the target range for the fed funds rate ending the year at either 4.00%-4.25% or 4.25%-4.50% (Figure 2). In short, the vast majority of policymakers envision either 100 bps or 125 bps of rate hikes over the final two policy meetings of 2022. Furthermore, most Committee members envision more tightening in 2023. Our previous forecast does not seem to be consistent with the FOMC's most recent thinking and increased resolve to wring out inflation.
Our updated forecast for the federal funds rate is shown in Figure 3. We now look for the Committee to raise rates by 75 bps at the November 2 meeting and by another 50 bps at the December 14 meeting, which would take the range for the federal funds rate to 4.25%-4.50% by mid-December. But with the core rate of PCE inflation also up 4.5% in December by our estimates, the real federal funds rate (i.e., the nominal fed funds rate deflated by the rate of core PCE inflation) would still not be positive. In our view, the FOMC would need to get the real fed funds rate into positive territory to slow the economy sufficiently to bring inflation convincingly back toward 2%. This movement into positive territory occurs early in 2023 as the FOMC continues to tighten policy—we look for 25 bps rate hikes at the meetings on February 1 and March 22—and as inflation slowly recedes. We look for the real fed funds rate to climb to about 1% in the second quarter, which we estimate will be restrictive enough to push the economy into recession by mid-year.
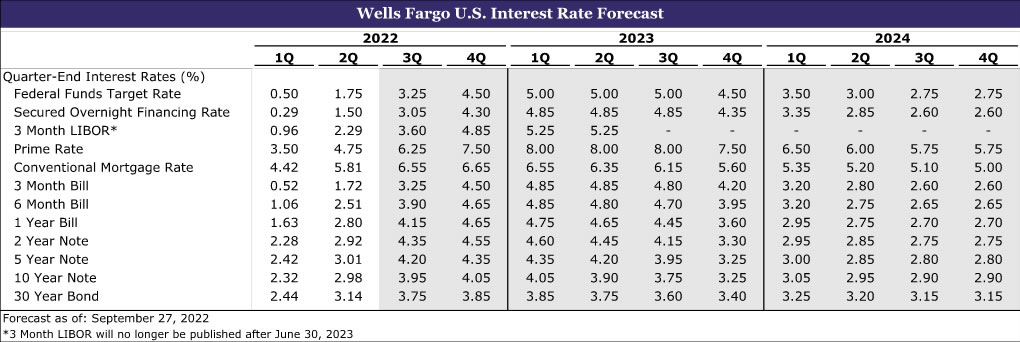
As we noted in our last monthly U.S. Economic Outlook, the FOMC has been quick to cut rates at the first signs of trouble during the past few cycles. However, we believe the Committee will be slower to ease policy during this cycle to ensure that inflation is indeed moving unmistakably back toward the Fed's target of 2%. But with the economy in recession, the unemployment rate rising and inflation receding considerably, we look for the FOMC to reverse course in the fourth quarter of next year. Specifically, we look for the Committee to cut rates by 50 bps in Q4-2023 with another 175 bps of easing by Q3-2024. Without rate cuts, the real fed funds rate would rise further, which would not be warranted in recession, as inflation continues to recede.
We plan to publish a full forecast revision, which will include some tweaks to our growth and inflation projections, on September 30. This forecast will be posted on our website.
Fed Evans agrees to get to the peak funds rate by March
Chicago Federal Reserve President Charles Evans told CNBC, "There are lags in monetary policy and we have moved expeditiously. We have done three 75 basis point increases in a row and there is a talk of more to get to that 4.25% to 4.5% by the end of the year, you're not leaving much time to sort of look at each monthly release. "
"I still believe that our consensus, the median forecasts, are to get to the peak funds rate by March — assuming there are no further adverse shocks. And if things get better, we could perhaps do less, but I think we are headed for that peak funds rate," Evans said.
"That offers a path for employment, you know, stabilizing at something that still is not a recession, but there could be shocks, there could be other difficulties," he added.
Has the Crypto Market First Felt the Risk Appetite?
Market picture
Bitcoin rose 1.1% on Monday, and on Tuesday morning, it “shot up” another 5.5%, adding 7.5% over the past 24 hours. This growth momentum has brought the price of the first cryptocurrency back above $20K, in stark contrast to the dynamics of falling markets and a strengthening dollar.
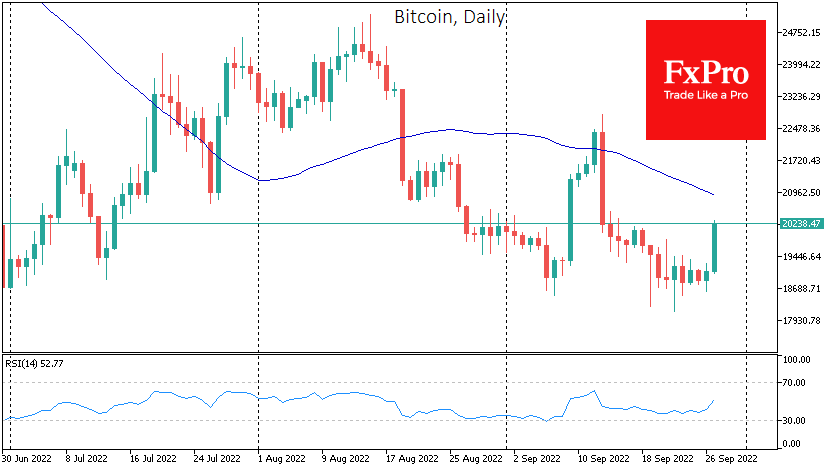
Ethereum added almost as much – 7% – rising to $1,385. Against this backdrop, total crypto market capitalisation jumped 5.5% to $970 billion, with top altcoins adding between 2.3% (XRP) and 8.1% (Solana).
While the Dow Jones index closed at its lowest since November 2020, the Nasdaq100 turned to growth after nearing the lows of June, and cryptocurrencies showed a strong surge. The outperformance of the riskiest assets is more typical of periods of great monetary stimulus. Therefore, the most relevant question is whether we are now seeing the first signs of a market reversal or a trap for naive bulls.
News background
According to CoinShares, investments in cryptocurrencies rose for the second consecutive week last week. Net inflows were $8 mln, Bitcoin investments were up $3 mln, and Ethereum investments were up $7 mln. Investments in funds that allow shorts on bitcoin were down $5 mln, the first decline in 8 weeks.
Bitcoin will continue to trade in a range of $17K to $25K, Glassnode expects. Intense US Federal Reserve monetary policy pressure and an unfavourable macroeconomic climate offset any essential positive developments in the crypto industry.
Dan Morehead, CEO of crypto hedge fund Pantera Capital, believes billions of people will use blockchain in the coming years, increasing the value of cryptocurrencies.
The SEC has demonstrated that it intends to “damage or destroy the cryptocurrency industry in the US”, said LBRY, a decentralised content publishing platform.
Technology giant Apple has allowed the sale of collectable tokens (NFTs) in apps on its devices, but the commission will be 30%, sparking outrage in the crypto community.
US 100 Index Bounces Off 200-Week SMA, But for How Long?
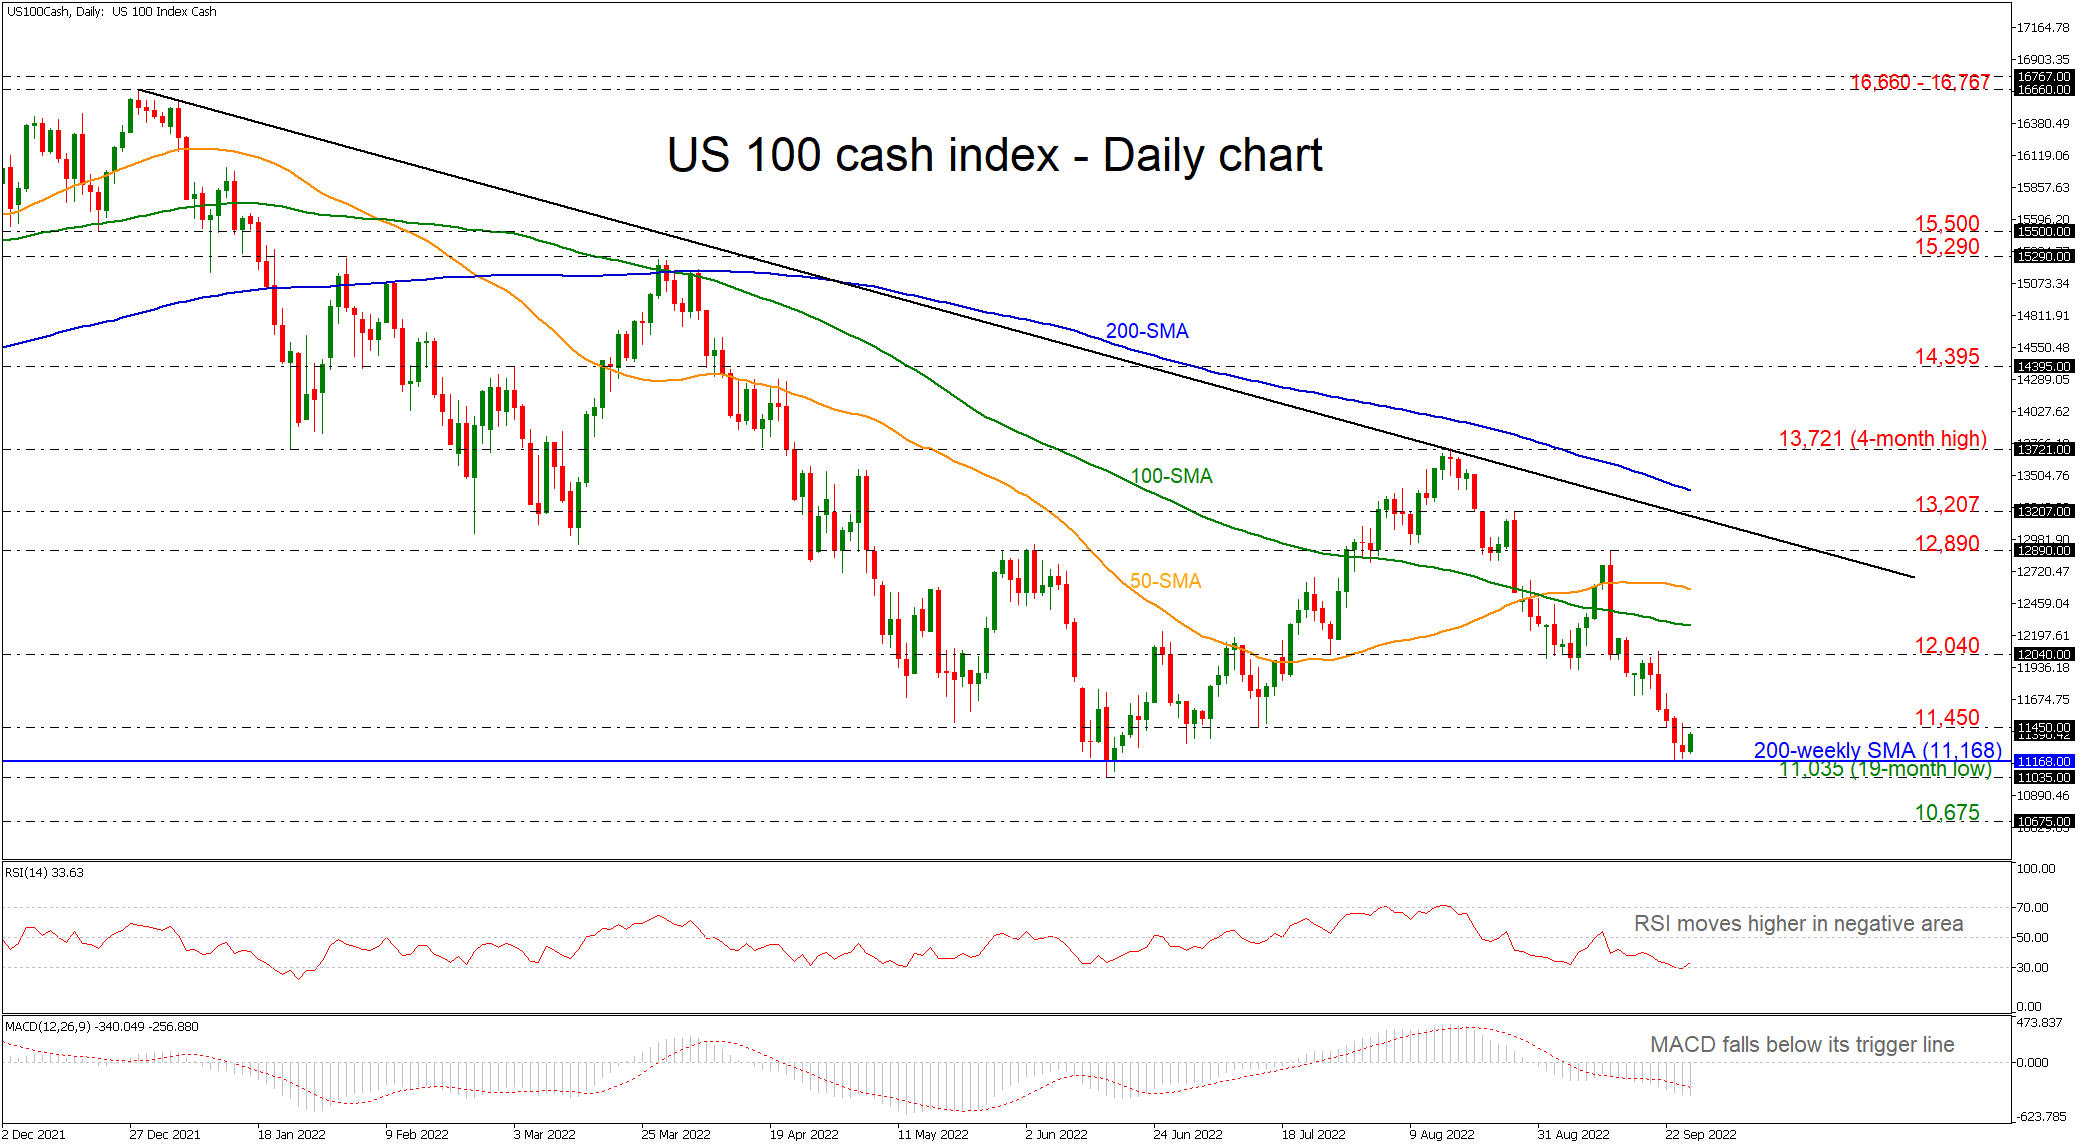
The US 100 cash index is finding strong support level at the 200-weekly simple moving average (SMA) at 11,168, but any declines below that line would suggest sharp losses in the long-term. The RSI is reversing higher near the oversold zone, while the MACD is extending its negative momentum below its trigger and zero lines.
Should buyers drive above the 11,450 level, they could encounter initial strengthened resistance from the 12,040 barrier and the 100-day SMA at 12,278 ahead of the 50-day SMA at 12,566. A step above may meet further constrictions from the 12,890 resistance before meeting the long-term descending trend line.
Otherwise, if sellers take control again, initial support could come from the 200-weekly SMA before tumbling towards the 19-month trough of 11,035. Diving further, immediate limitations may arise from the 10,675 mark, registered in September 2020.
All in all, the US 100 index is rebounding off the weekly SMA at the moment; however, the broader outlook is still bearish.
EURJPY Battles With 50-Day SMA as Decline Halts
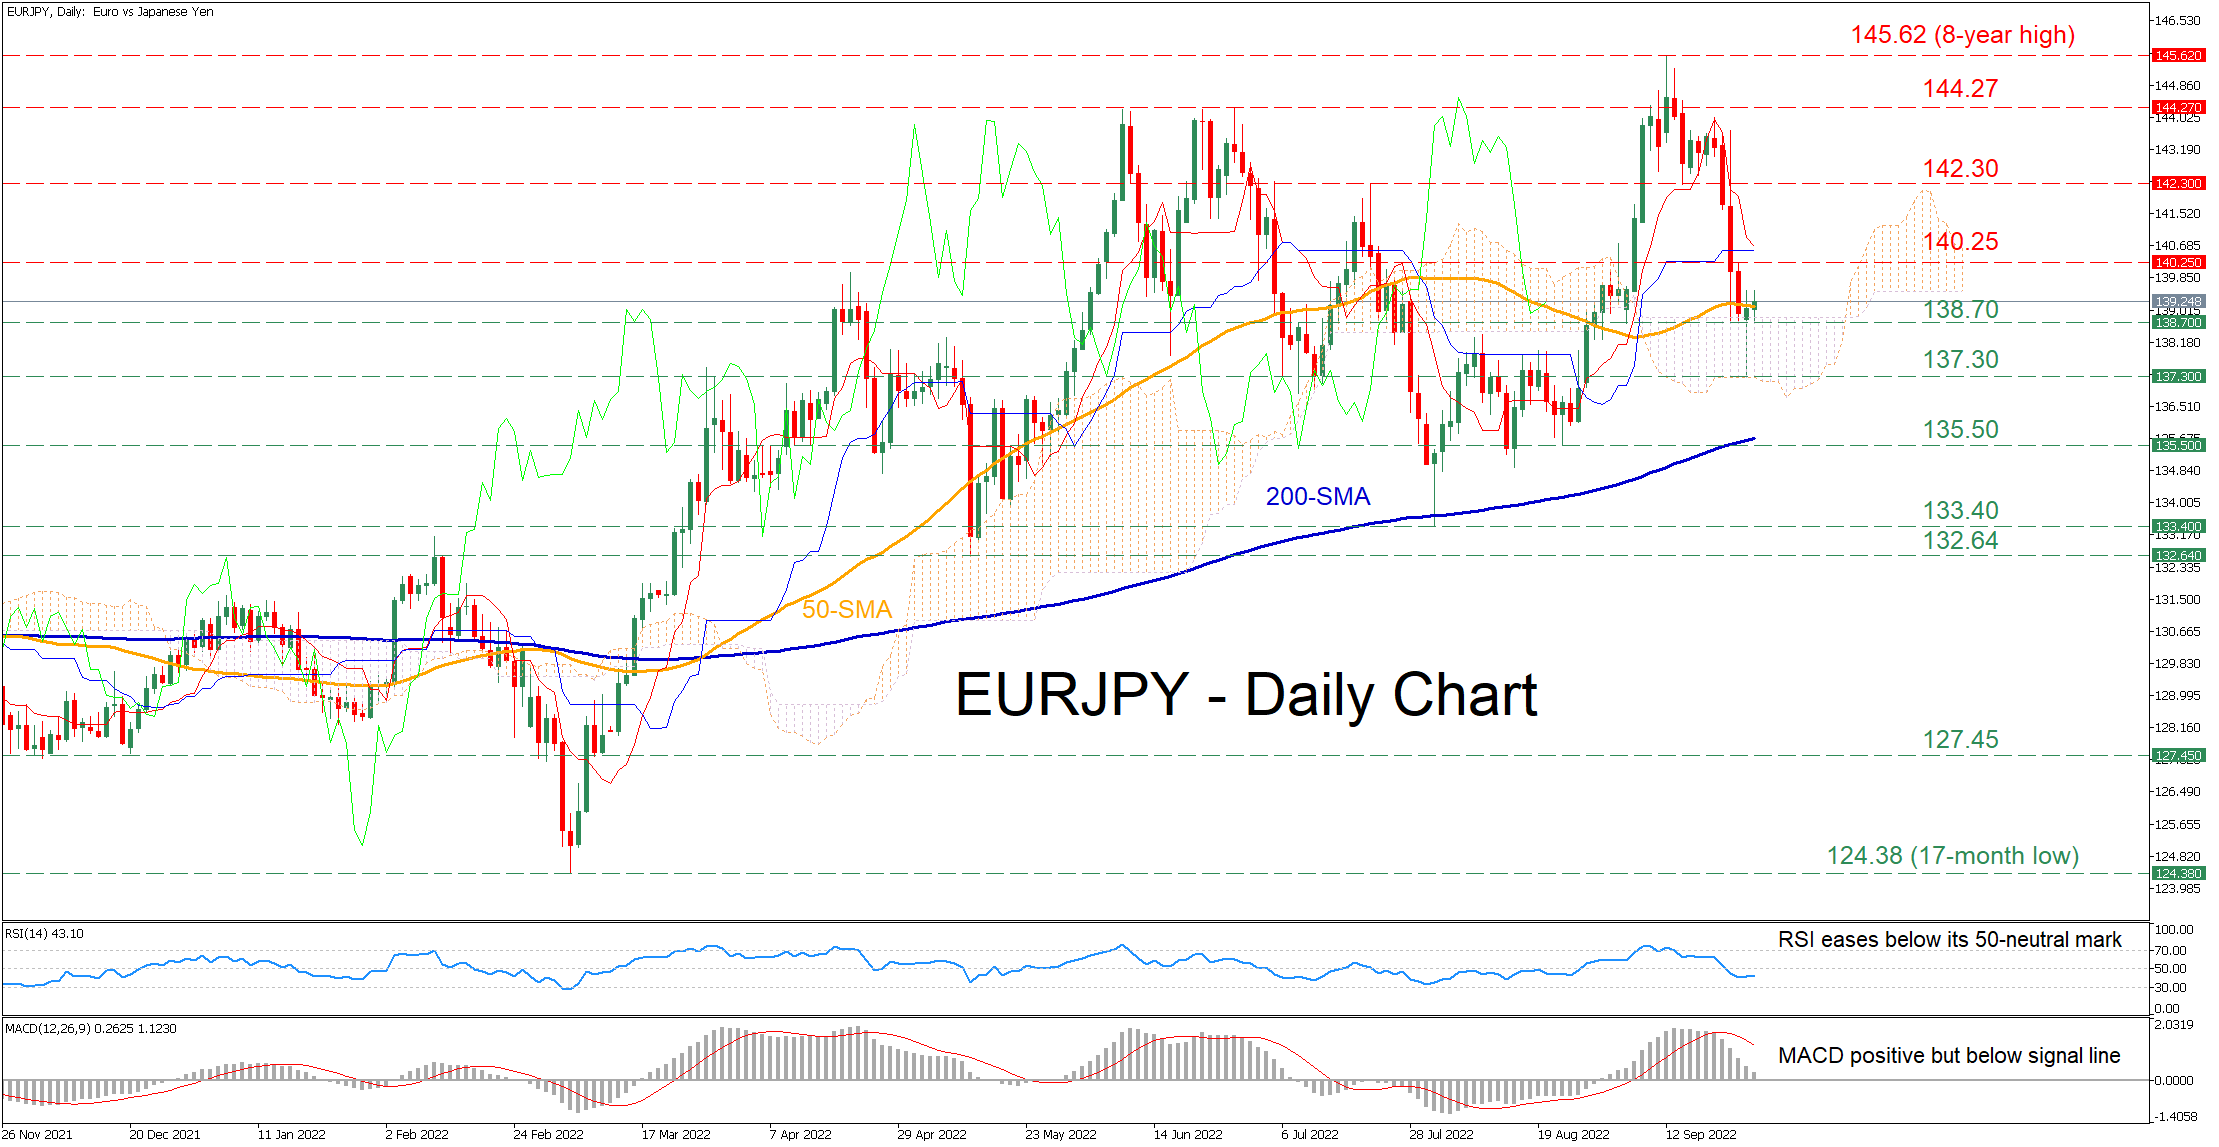
EURJPY has been experiencing a sharp drop after its latest advance came to a halt at the eight-year high of 145.62. However, in the last couple of sessions, the pair has managed to stop its bleeding as the 50-day simple moving average (SMA) has been acting as a strong floor.
The short-term oscillators currently suggest that near-term risks are tilted to the downside. Specifically, the RSI is flatlining below its 50-neutral mark, while the MACD histogram is retreating below its red signal line but remains in the positive zone.
If the price profoundly crosses below its 50-day SMA, the recent support zone of 138.70, which overlaps with the upper boundary of the Ichimoku cloud, might act as the first line of defence. Should that floor collapse, the pair could descend towards the recent low of 137.30. Any further drop could then cease at 135.50 before the July low of 133.40 comes under examination.
To the upside, bullish moves could encounter immediate resistance at the 140.25 barrier. A break above the latter could turn the spotlight to 142.30, which has acted both as resistance and support in the last two months. Failing to halt there, the bulls may aim at the June peaks of 144.27 before the eight-year high of 145.62 appears on the radar.
Overall, despite its recent retreat, EURJPY retains its positive short-term picture. Nevertheless, a clear close beneath the 50-day SMA could ignite further selling interest, increasing sellers' hopes for a sustained downfall.
GBPUSD Takes a Breather after Record Low
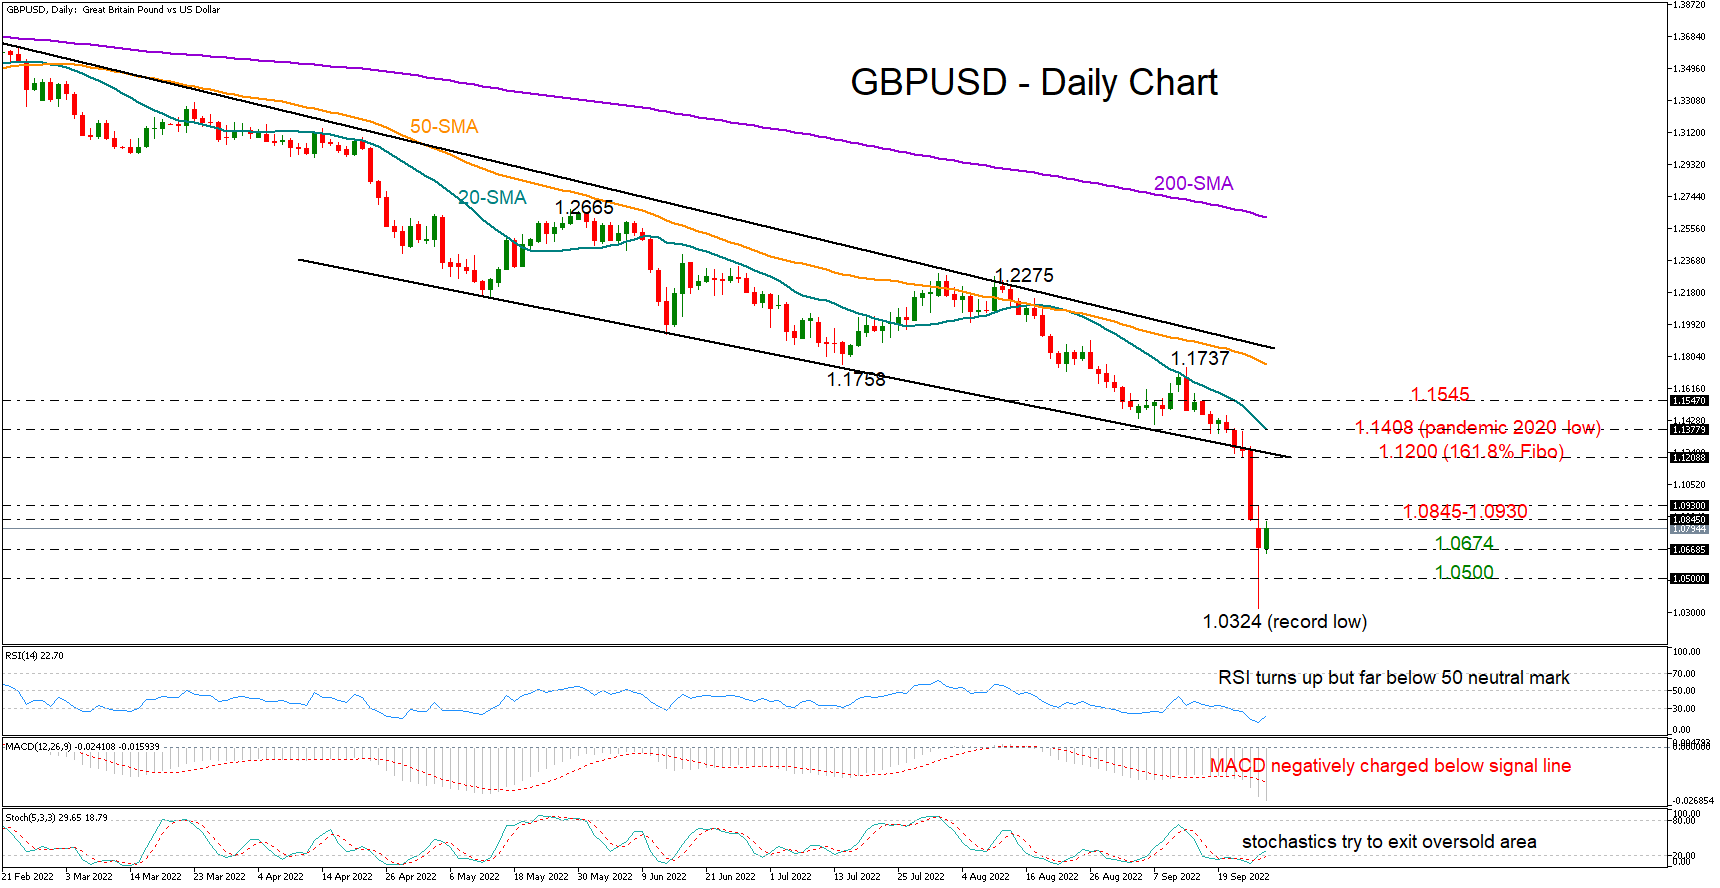
GBPUSD survived Monday’s freefall to the uncharted territory with minor damage, minimizing its losses from a record low of 1.0324 to 1.0683.
The pair is currently aiming for a climb above Friday’s closing price of 1.0845 as the RSI and the stochastics seem to have bottomed in the oversold area, signaling a potential upside reversal. Yet, with the indicators still well dipped in the bearish territory and the price itself far below the broken bearish channel, downside risks may keep lingering in the background in the short term.
An extension above the nearby resistance of 1.0845 – 1.0930 could provide direct access to the key 1.1200 zone, a break of which is needed to clear the way towards the 20-day simple moving average (SMA) at 1.1377 and the pandemic low of 1.1408. The 1.1545 barrier has been capping bullish actions since early this month and may again come into play ahead of the previous high of 1.1737 if the recovery continues.
On the downside, the 1.0674 zone is acting as support for the second consecutive day. If that floor collapses, the 1.0500 psychological mark may attempt to cancel any downfalls towards the 1.0324 record low. Should the bears re-activate the long-term downtrend, traders will immediately bring the case of parity under examination.
In brief, although GBPUSD is trying to heal its wounds from a record low, the pair is not out of the woods yet. Traders will wait for a continuation of the rebound above the 1.0845-1.0930 region before they increase their buying orders.
More Turmoil to Come?
Stock markets have steadied in Asia and early European trade on Tuesday but that is not reflective of the mood in the markets at the moment so it may struggle to hold.
The volatility in FX markets at the start of the week has been extreme but it's also been building for weeks as authorities desperately try to arrest the decline in their currencies, particularly against the US dollar.
On Monday it was the UK that was front and centre following the mini-budget on Friday that showed total disregard for the environment in which it was being implemented. Promising much higher borrowing to fund huge tax cuts at a time of double-digit inflation that hasn't even peaked is beyond bold and the backlash is well underway.
There's nothing wrong with being ambitious on the economy but timing is everything and when the cost is much higher interest rates, there won't be many winners and the economy simply won't see the benefit. The question now is whether the pressure both externally and from within will force a rethink in order to settle things down.
The Bank of England did little to help. After speculation all day of an impending announcement, the central bank only sought to reassure markets that they stand ready to act but probably not until the next meeting in early November when it is armed with new macroeconomic projections. Needless to say, that reassured no one and sterling plummeted again after recovering amid the rumours of the announcement.
BoJ intervenes amid rising yields
It's not just the UK that's contending with a haemorrhaging currency, the Japanese Ministry of Finance was forced to intervene last week for the first time in 24 years in order to support the yen. Of course, while the UK's problems appear largely self-inflicted, Japan is suffering as a result of a growing rate divergence that is worsening month to month.
So much so that the Bank of Japan was forced to intervene itself overnight with another bond-buying operation to the tune of 250 billion yen. The problem with yield curve control is that when yields are rising everywhere, pulling those in Japan with them, the upper limit is frequently tested necessitating intervention which in turn weakens the currency. It seems Japan is now stuck in an intervention doom loop until central banks elsewhere see peak inflation and therefore rates, or the BoJ loosens its grip and allows yields to move a little higher.
Oil pares losses ahead of next week's OPEC+ meeting
Oil prices are recovering following the sell-off over the last couple of sessions. The prospect of a deeper economic slowdown, perhaps even global recession, has naturally turned traders more bearish on the price of oil as demand would naturally slump in those circumstances relative to prior expectations.
Of course, there is another side to that equation, supply. The message from OPEC+ earlier this month was quite clear; it stands ready to adjust supply if fundamentals change or volatility continues and prices no longer reflect the situation. While it has so far resisted the urge to hold an unscheduled meeting, the next showdown is next week so we should soon have a more updated view in light of everything we've seen recently.
In the meantime, we could see further pressure on oil prices if economic woes continue to dominate and traders want to test the resolve of the alliance in the face of severe global economic risk. In the midst of an inflation and cost-of-living crisis, you have to wonder why the group would want to keep prices artificially high in the short term as it will only make a global recession all the more likely.
Gold bouncing back but risks remain to the downside
Gold is rebounding after another terrible start to the week that saw it plunge back to $1,620, its lowest level since April 2020. It just goes from bad to worse for the yellow metal as traders continue to flock to the greenback and yields keep rising. The question for gold traders is how close are we to peak rate pricing and inflation. Obviously, the same question is being asked in all corners of the markets and so far, no one really has the answer.
With that in mind, it's hard to build a bullish case for gold. Once we see signs of hitting that peak, we could see a recovery amid continued demand for safe havens. In terms of levels, it's hard to say where that will come. The first test to the upside now is $1,640 followed by $1,650 and $1,680 but there still could be further pain ahead, with $1,600 being the next obvious test.
What's driving the recovery in Bitcoin?
Bitcoin is staging a remarkable recovery amid a mild reprieve elsewhere on Tuesday which will no doubt excite a crypto crowd after another rough period. Turmoil elsewhere appears to have lifted bitcoin which has largely traded as a high-risk asset. This will undoubtedly stoke conversations about its role in the new economy, perhaps even reignite claims of its safe haven status. Naturally, I'm far from convinced but it's certainly intriguing to watch unfold given the chaos we're seeing elsewhere.
Daily Technical Analysis
EUR/USD
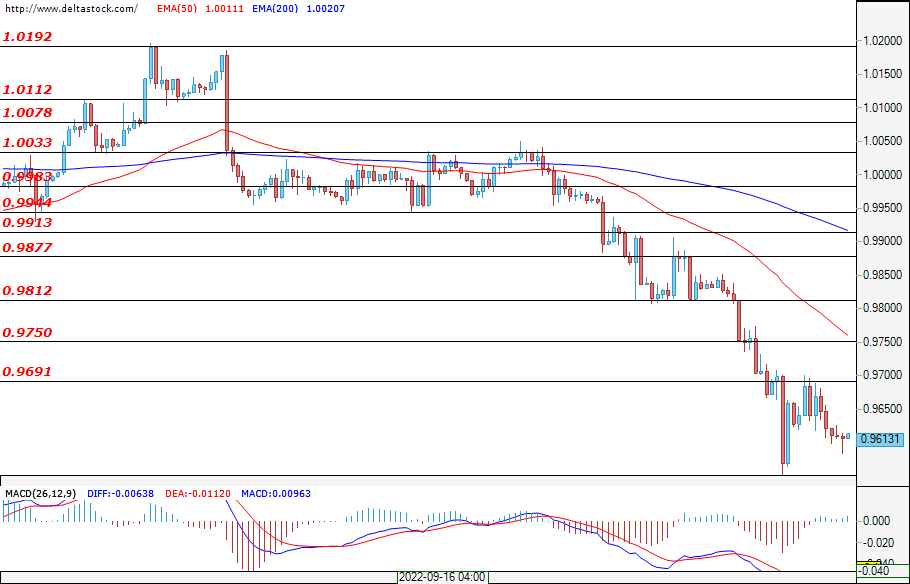
The single European currency continues to lose ground against the dollar. During yesterday's trading session, EUR/USD moved away from the resistance at 0.9691 and the scenario of reaching the support at 0.9410 looks increasingly possible. The level of the aforementioned support was last reached at the beginning of the 21st century. During today's trading session, traders will have their eyes set on J. Powell's speech, which starts at 11:30 GMT. Other macroeconomic news that could have a strong effect on the currency pair are: Consumer Confidence Index (14:00 GMT) and New Home Sales (14:00 GMT).
USD/JPY
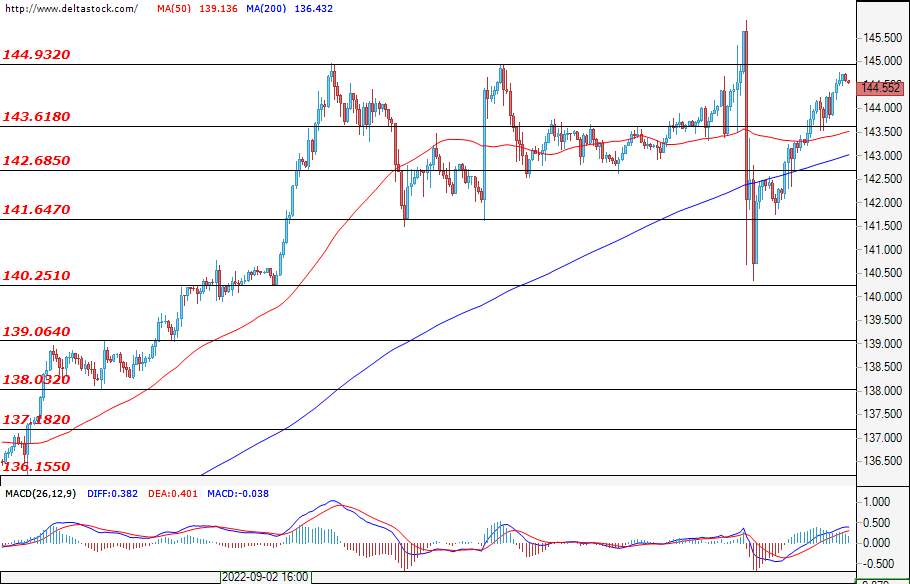
During yesterday's trading session, the Ninja managed to consolidate the resistance breach at 143.61 and at the time of writing the analysis is headed for the next one at 145. On the other hand, if the bears manage to increase the selling, they could try to recover their positions and returned to the support level at 143.61. Today, no macroeconomic news is expected from Japan that could have a strong effect on the yen.
GBP/USD
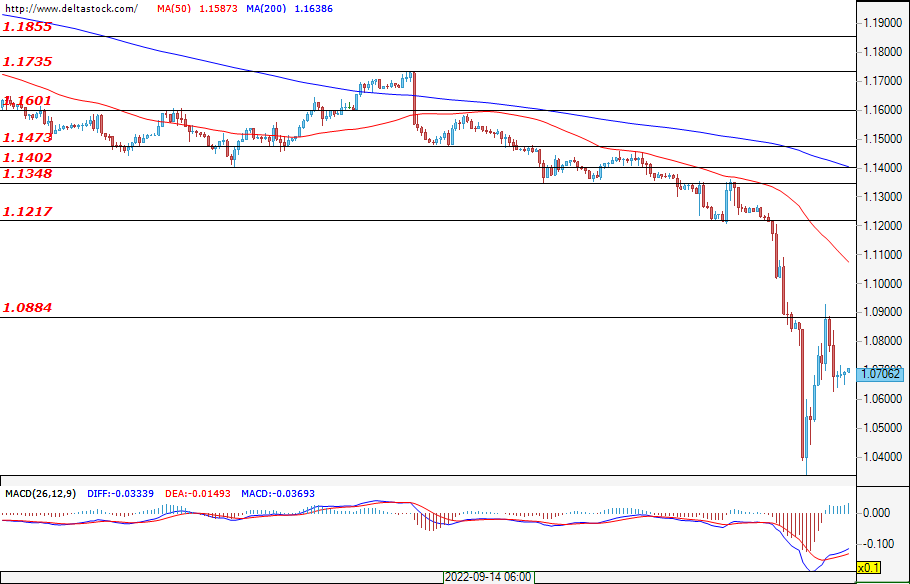
After yesterday's crash in the pound, the bulls managed to rally and recoup some of their losses. Despite the bulls' efforts, the pound is still stuck at the lows since 1985. If the bulls manage to maintain their momentum we could see an attempt to breach the resistance at 1.088. If the bears dampen the hopes of the bulls, we could witness a breach of the support at 1.033.
EUGERMANY40
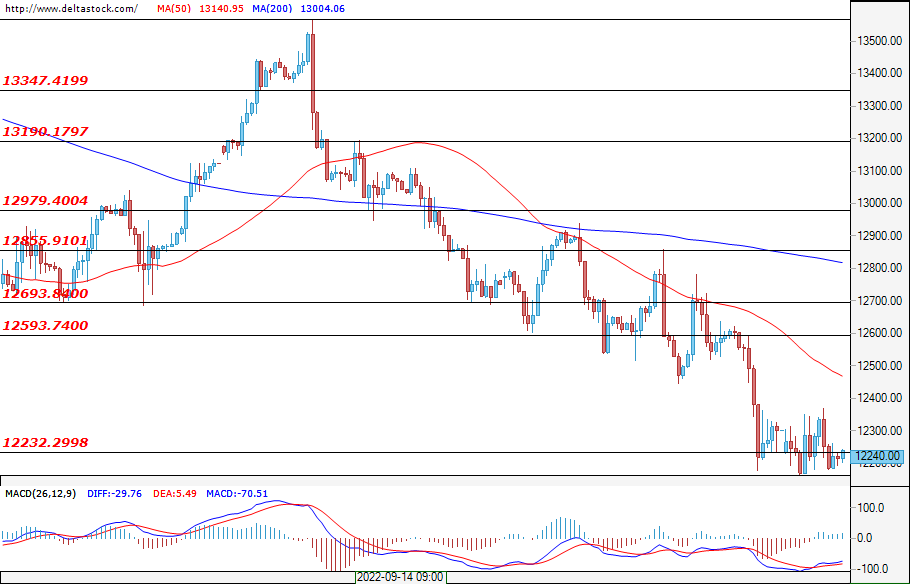
At the time of writing analysis, the German index continues to hover around the level at 12230. If the bears manage to prevail, we could witness a test of the support at 12120. A strong bullish attack, on the other hand, would bring the EUGERMANY40 level to the resistance at 12593.
US30
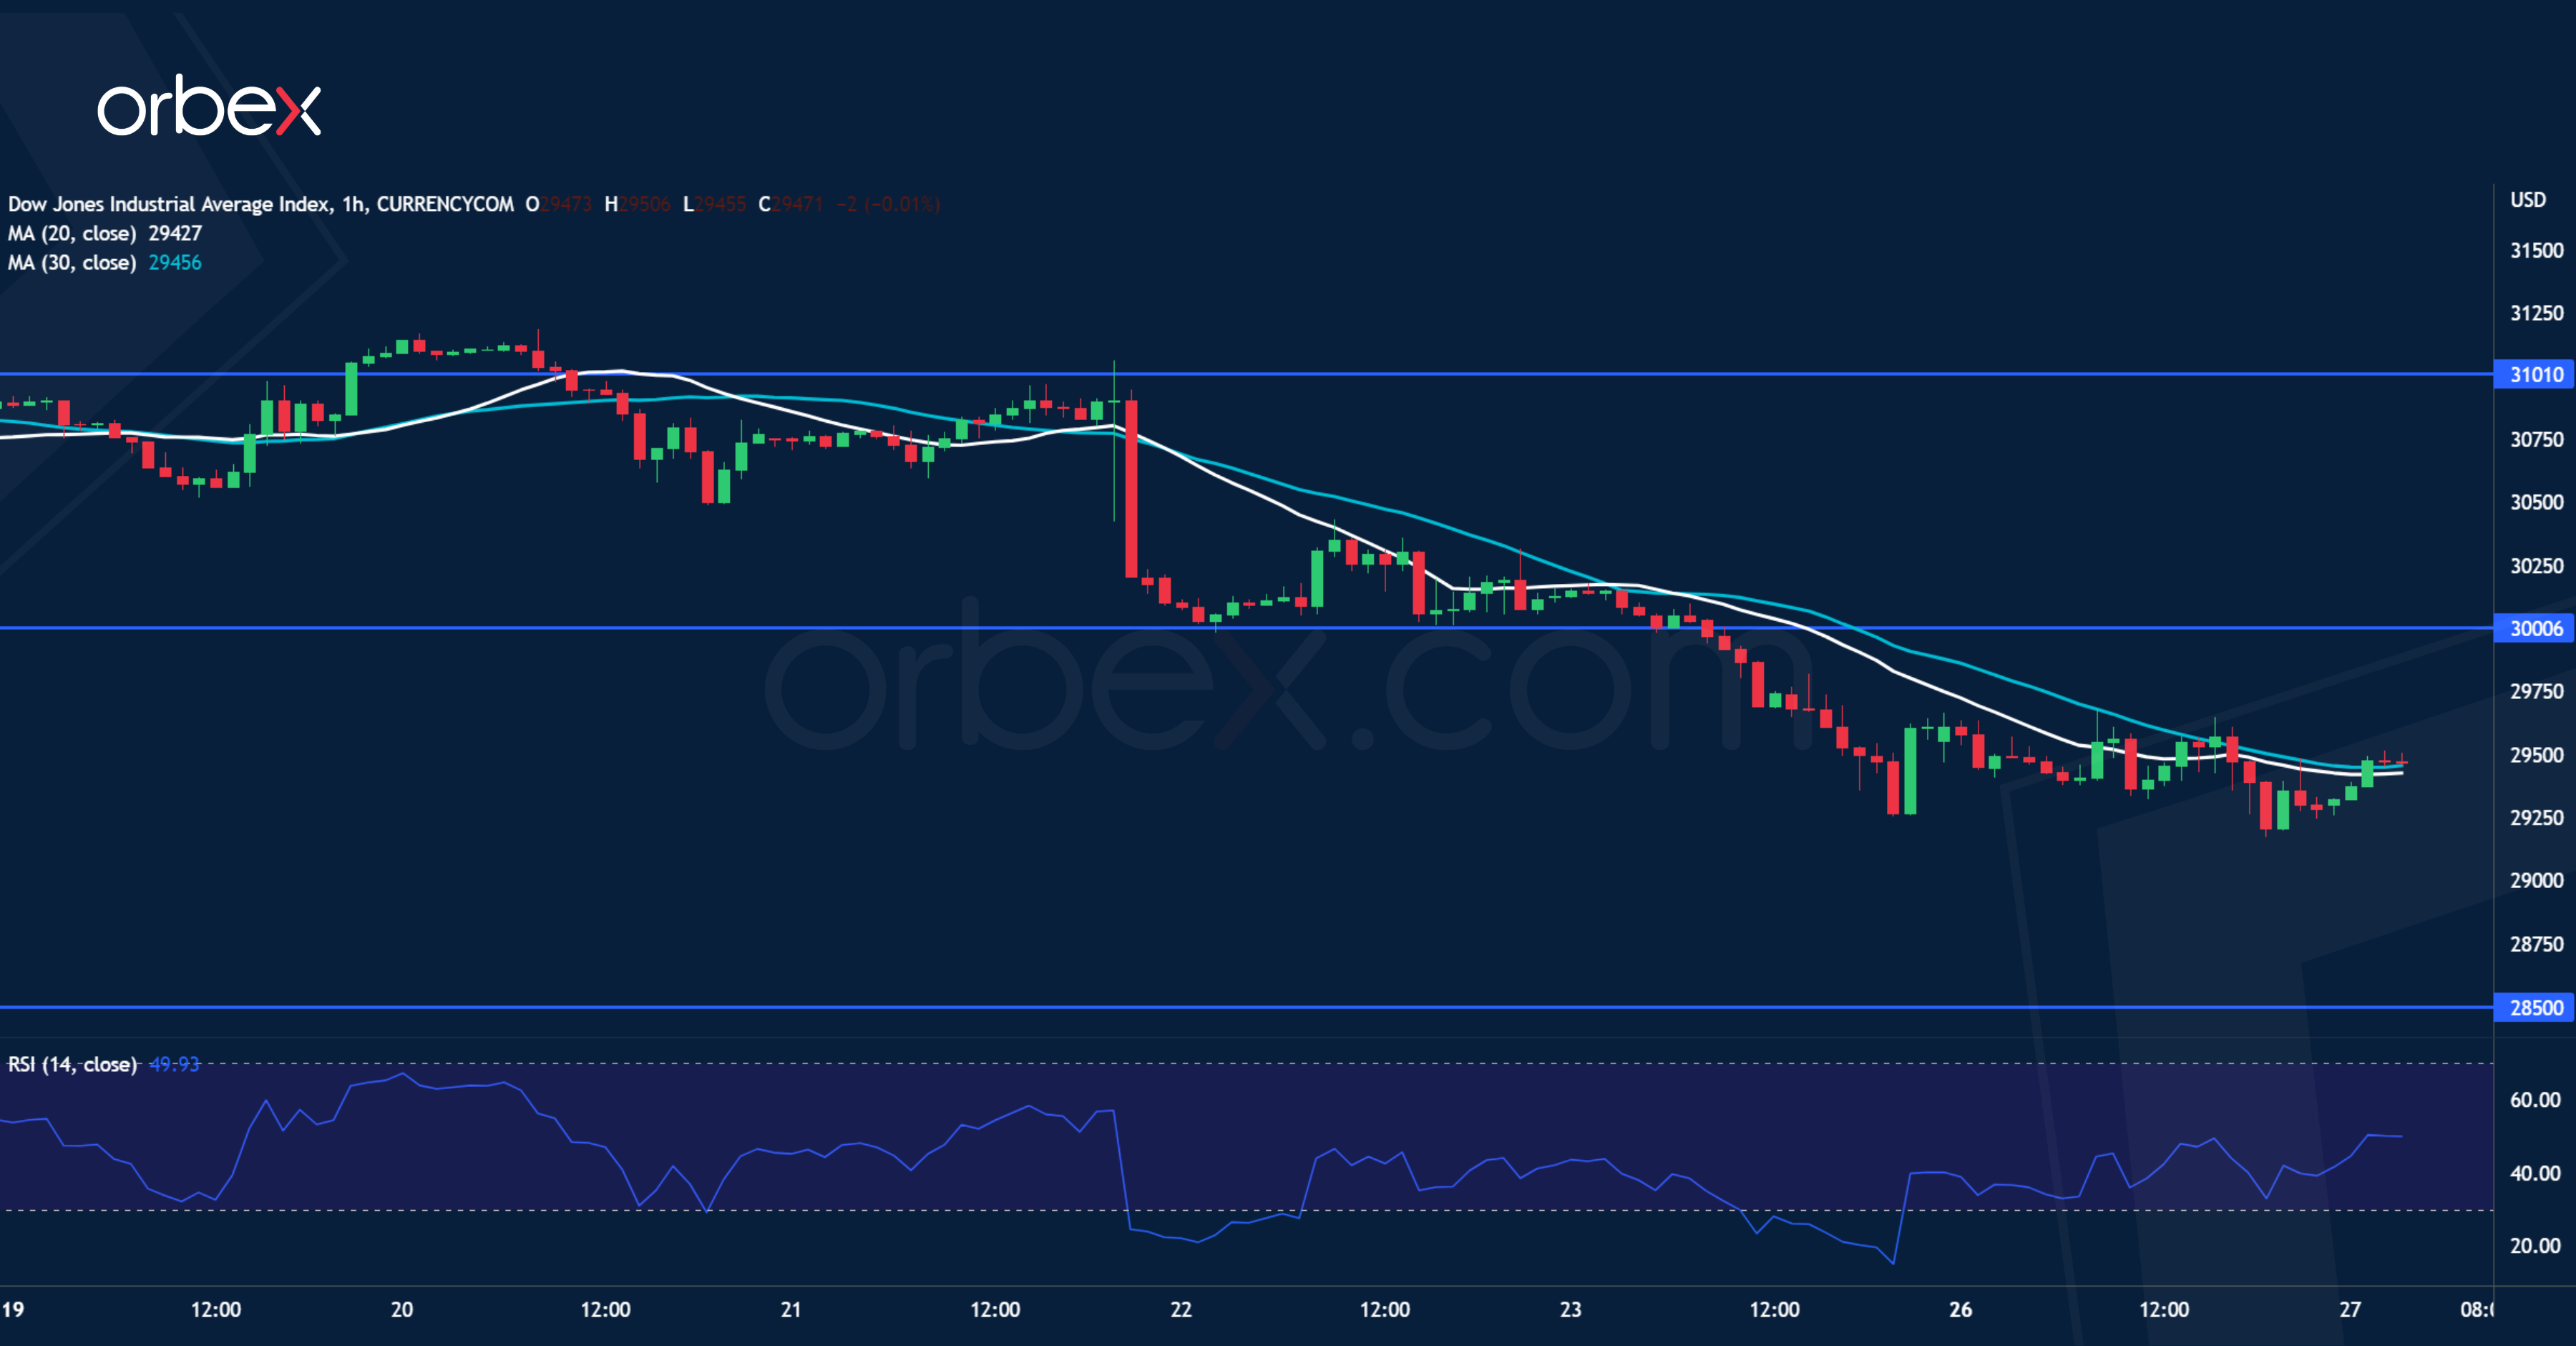
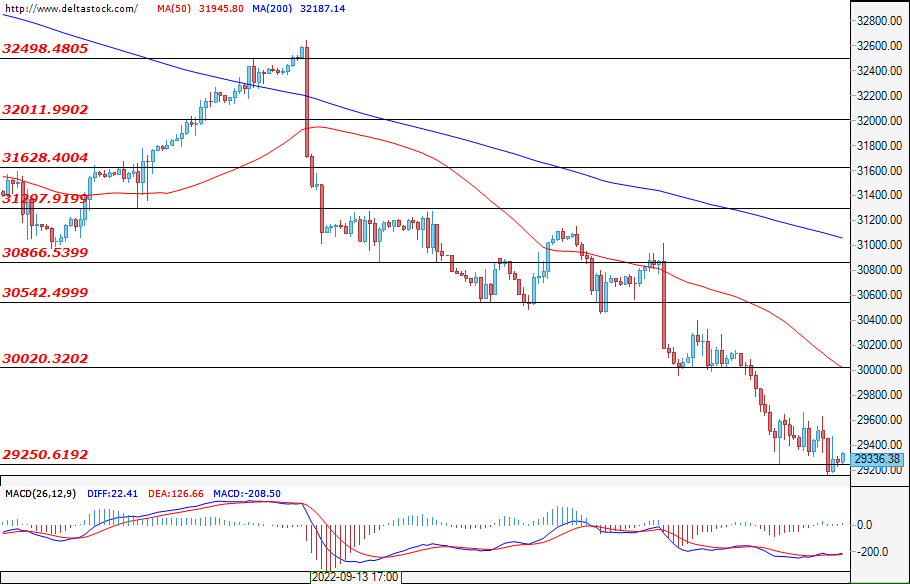
In the blue chip index we are also witnessing a consolidation taking shape. The level around which the US30 moves is 29250. As here we see an attempt by the bulls to consolidate the breakout of the aforementioned consolidation. Today's news on the Consumer Confidence Index (14:00 GMT) and New Home Sales (14:00 GMT) as well as the Fed Chairman Jerome Powell's speech (11:30 GMT) would have a strong effect on the index.
Dow Jones 30 Breaks Critical Floor
The Dow Jones 30 slips over concerns of a Fed tightening overdose. A break below June’s low at 29800 may have sealed the fate of the index by putting it on a bearish track. The breakout also confirms the bearish MA cross on the daily chart, indicating an acceleration to the downside. 28500 could be the next target. A brief bounce may draw more selling interests as the downtrend resumes its course, while trapped bulls may seek to bail out in the supply zone near the psychological level of 30000, exacerbating volatility in the process.