Sample Category Title
Japan PMI manufacturing dipped to 51.0, services rose to 51.9
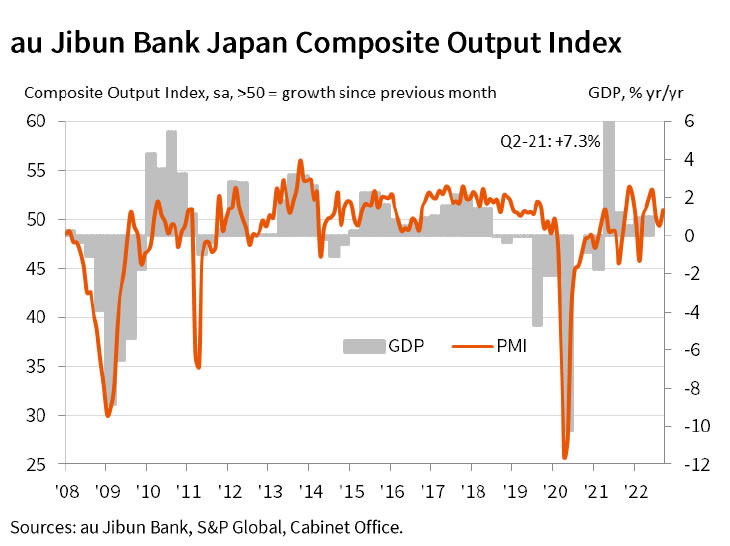
Japan PMI Manufacturing dropped slightly from 51.5 to 51.0 in September, below expectation of 51.1. That's the lowest reading since January 2021. Manufacturing Output Index dropped from 49.2 to 48.9. PMI Services, on the other hand, rose from 49.5 to 51.9. PMI Composite rose from 49.4 to 50.9.
Joe Hayes, Senior Economist at S&P Global Market Intelligence, said: "Business are reporting concerns around the economic outlook amid steep cost pressures and the rising likelihood of a global economic downturn. The remarkable weakness we've seen in the year-to-date in the yen continues to push up price pressures, with companies struggling to fully pass on these higher costs burdens to clients. Subsequently business confidence slumped to a 13-month low".
Fed Bostic: Economy can slow in a relatively orderly way
Atlanta Federal Reserve President Raphael Bostic said on CBS's "Face the Nation" program, "Inflation is high. It is too high. And we need to do all we can to make it come down."
He added the US need to have a "slowdown", but "we are going to do all that we can at the Federal Reserve to avoid deep, deep pain."
"We're still creating lots of jobs on a monthly basis, and so I actually think that there is some ability for the economy to absorb our actions and slow in a relatively orderly way," he said.
EUR/USD Nosedives to New 20-Year Low, Dollar Rallies
Key Highlights
- EUR/USD declined heavily below the 0.9900 support zone.
- It broke a major bullish trend line at 0.9970 on the 4-hours chart.
- GBP/USD also declined sharply below the 1.1000 support zone.
- Gold and crude oil price traded to a new monthly low.
EUR/USD Technical Analysis
The Euro failed to remain stable above the parity level against the US Dollar. EUR/USD started a strong decline and traded below many important support levels to set a new 20-year low.
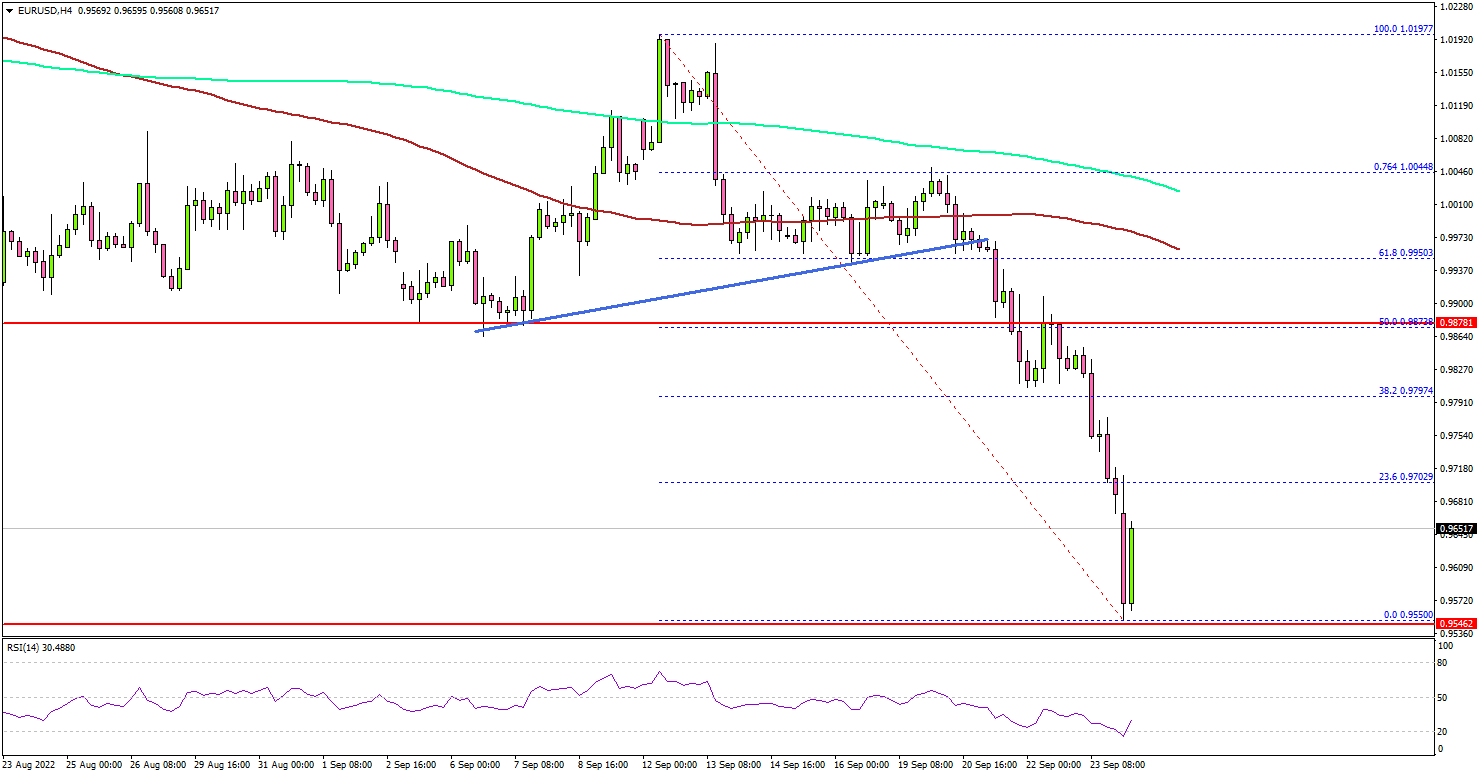
Looking at the 4-hours chart, the pair traded below the 0.9980 support level and a major bullish trend line. It opened the doors for a sharp move below the 0.9900 support zone.
The pair settled below the 0.9900 level, the 100 simple moving average (red, 4-hours), and the 200 simple moving average (green, 4-hours). The decline gained pace below the 0.9800 support zone and the pair even traded below 0.9700.
There was a more than 250 pips decline and the pair traded to a new 20-year low at 0.9550. It is now correcting losses and trading above the 0.9600 level. On the upside, an initial resistance sits near the 0.9700 zone.
The first major resistance is near the 0.9750. A clear move above the 0.9750 level could open the doors for a fresh increase to 0.9800. Any more gains might send the pair towards the 0.9880 resistance level.
On the downside, an initial support is near the 0.9600 level. The main support sits at the 0.9550 level. A downside break below the 0.9550 zone might send the pair towards the 0.9500 level. The next major support is near the 0.9320 level, below which the pair could even test the 0.9250 level.
Looking at gold price, the price extended its decline and traded below the $1,660 support zone. Similarly, crude oil price declined below the $80 support.
Economic Releases
- German IFO Business Climate Index for Sep 2022 – Forecast 87.1, versus 88.5 previous.
- German IFO Current Assessment Index for Sep 2022 - Forecast 96.0, versus 97.5 previous.
Eco Data 9/26/22
[php_everywhere instance="1"]
Forex and Cryptocurrencies Forecast
EUR/USD: In Search of a New Bottom
Last week, all the attention of the markets was focused on the FOMC meeting of the US Federal Reserve, which took place on September 21. The probability of another rate hike by 75 basis points (bp) had been estimated at 74%, and by 100 bps at 26%. The first forecast turned out to be correct: the rate was increased from 2.50% to 3.25%. But this was enough for the DXY dollar index to fly up and exceed 113.00 points, updating another 20-year high. Accordingly, as expected by the majority (75%) of experts, EUR/USD has renewed another 20-year low, reaching the bottom at 0.9667.
Russian President Vladimir Putin contributed to the weakening of the euro and the fall of the pair, announcing the mobilization of part of the military reserve to reinforce the Russian troops that invaded Ukraine. Mr. Putin also repeated the threat to use nuclear weapons, which further increased tension in the region. In addition, the heating season begins in Europe, and Russia continues to put pressure on it, using problems with energy supplies as a "weapon".
At the last meeting, the Fed gave the markets a clear hawkish signal about its next steps. It will continue its quantitative tightening (QT) policy, including reducing its balance sheet, and the interest rate will remain high in 2023. As for the current year, 2022, according to CME Group estimates, the probability that it will exceed 4.00% by the end of Q4 is almost 60%.
According to US Central bank officials, defeating inflation is now a priority. To implement it, the regulator is ready to accept the threat of a recession, including a drop in production and consumption, as well as problems in the labor market.
Investors fleeing risks on side with the dollar as a safe haven. US stock indices have been going down for the second week in a row. The S&P500 fell below its July lows, and the Dow Jones reached its June lowest values.
The last chord of the week for EUR/USD sounded at 0.9693. At the time of writing the review, Friday evening, September 23, the votes of the experts are distributed as follows. 55% of analysts say that the pair will continue to move south in the near future, while the remaining 45% expect a correction to the north. As for the trend indicators on D1, 100% is colored red, the picture is the same among the oscillators, while 25% signal that the pair is oversold.
The pair's immediate support is the September 23 low at 0.9667, with bears targeting 0.9500. The resistance levels and targets of the bulls look like this: 0.9700-0.9735, 0.9800-0.9825, 0.9900, the immediate task is to return to the range of 0.9950-1.0020, the next target area is 1.0130-1.0200.
We are in for a lot of macro-economic statistics this week. The week will be opened by data on GDP (Q3) and IFO business climate in Germany, which will be released on Monday September 26. Data from the US consumer market will be received the next day, and the US GDP (Q2) will become known on Thursday, September 29. Statistics on sales and the labor market in Germany, as well as on the consumer markets of the Eurozone (CPI) and the United States, will be published in turn on the last day of the five-day period and the month, September 30. In addition, ECB President Christine Lagarde will deliver a speech this week on September 26, and Federal Reserve Chairman Jerome Powell will speak on September 27.
GBP/USD: Back to the Past: Return to 1985
The Bank of England raised the pound rate by 50 bp up to 2.25% the day after the Fed meeting, on Thursday September 22. However, as expected, this did not help the British currency much. More precisely, given the current macroeconomic situation, it did not help at all. In just 10 days, from September 13 to 23, GBP/USD flew about 900 points, falling to its lowest level in 37 years. The bottom was found on Friday at 1.0838, which was in line with 1985 levels.
Disappointing economic data from the United Kingdom continues to weigh heavily on the pound. Business activity in the private sector continued to fall. The Preliminary Composite PMI, with a forecast of 49.0 points, actually fell from 49.6 to 48.4 over the month. In addition, a survey by the Confederation of British Industry (CBI), which speaks on behalf of 190,000 businesses, showed that the balance of retail sales fell to -20 in September from +37 in August.
According to the Bank of England's own forecasts, the country is close to a deep recession. And according to the estimates of the British Chamber of Commerce (BCC), the recession is already in full swing, and inflation will reach 14% by the end of the year. Next year also does not bode well: according to strategists at Goldman Sachs, inflation could reach 22% by the end of 2023.
To combat it, the Bank of England has moved to more aggressive rate hikes. But the tightening of monetary policy takes place simultaneously with an increase in budget spending. Moreover, the government will most likely not have enough of its own funds to pay businesses and households the announced partial compensation of electricity bills. Therefore, it will have to take large loans, which will not benefit the national currency either. (We have already reported that British energy regulator Ofgem announced that average annual bills will rise by 80% from October, and the number of households in fuel poverty could reach 12 million people in January).
The pair closed last week at 1.0867. But the range 1.0800-1.0838 is unlikely to become a strong enough support. Having broken it, the bears will rush to the historical low of 1985 of 1.0520, to which there are only about 300 points left. Given the pace of the fall of the pair, it can reach this goal in one to two weeks. Of course, a correction is not ruled out due to the oversold pound. If the pair turns north, it will meet resistance in the zones and at the levels of 1.1000-1.1020, 1.1100, 1.1215, 1.1350, 1.1475, 1.1535, 1.1600, 1.1650, 1.1710-1.1740. The return of the pair to the heights around 1.1800-1.2000 seems unlikely in the coming weeks.
Experts' forecast for the coming week looks quite unique: all 100% side with the British currency. As for the indicators on D1, all 100% point exactly in the opposite direction. However, 50% of the oscillators are in the deep oversold zone, which confirms experts' expectations regarding a correction to the north.
The event calendar can mark Friday, September 30, when UK GDP (Q2) data will be released.
USD/JPY: Miracle from the Ministry of Finance and the Bank of Japan
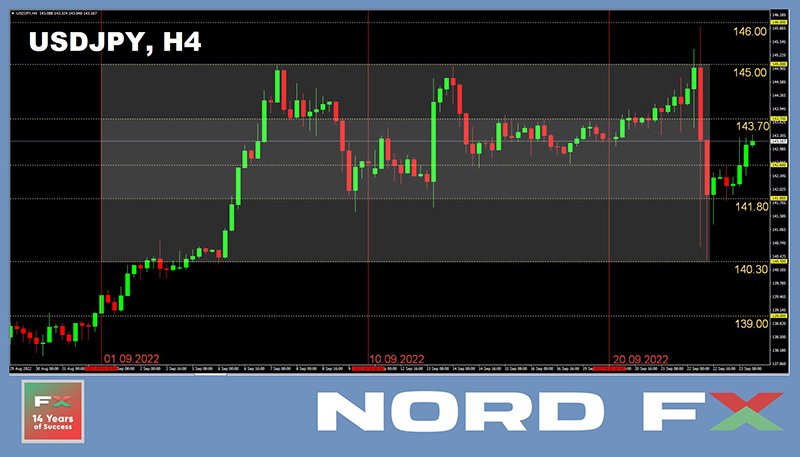
As we predicted, the Bank of Japan (BOJ) remained true to itself at its meeting on September 22 and kept its interest rate at a negative, ultra-dove level of -0.1%. However, we still have to admit our mistake. We wrote last week that the Japanese financial authorities should not expect a miracle. But a miracle did happen. As USD/JPY crept up to 146.00, the Treasury's seemingly steely nerves snapped and it ordered the BOJ to intervene in support of the yen.
As a result, the pair avalanched 550 pips, showing the most volatility since the start of the COVID-19 pandemic in March 2020. Then the shock passed, the situation calmed down a bit, and the pair returned to the values of the beginning of the working week, ending it at the level of 143.30.
This pullback confirms some analysts' view that the yen's strength is unlikely to be long-term and that USD/JPY will return to storm the 146.00 high again. "In the absence of major changes in fundamentals or (unlikely) concerted action against the US dollar, the chances of a sustained rebound in the Japanese yen are limited," Scotiabank macro strategists say. "The key issue here, of course, is the divergence in monetary policy settings between the US and Japan, which has caused the Japanese yen to plummet since the Fed first began raising interest rates in earnest in the spring."
Scotiabank believes that markets are likely to retest the 146.00 level to test the resolve of the Bank of Japan. And the Japanese Central Bank will have to spend billions of USD to protect this level. Moreover, it may even ask the ECB, the Bank of England and the Fed to act as their agent outside of business hours in Tokyo. However, it is likely that the Bank of Japan will try to fight off the strong dollar alone.
Experts' median forecast for the near future is as follows. 45% of experts side with the bulls, 45% have taken the opposite position, the remaining 10% remain neutral. Oscillators on D1 have 40% on the green side, 10% on the red side, and 50% are colored neutral gray. Among the trend indicators, the ratio is 9 to 1 in favor of the green ones.
The nearest resistance for the pair, as in the last two weeks, is 143.75. The objectives of bulls No. 1 and No. 2 are to gain a foothold above 145.00 and then storm the height of 146.00. This is followed by 146.78, the level reached before the joint actions of Japan and the US to support the yen in 1998. Supports for the pair are located at the levels and in the zones 143.00, 142.60, 142.00-142.20, 140.60, 140.00, 138.35-139.05, 137.50, 135.60-136.00, 134.40, 132.80, 131.70.
No important statistics on the state of the Japanese economy are expected to be released this week. However, there are two events that are of particular interest in the light of the decision to intervene. A press conference by BOJ Chairman Haruhiko Kuroda is scheduled for Monday, September 26, and the report on the last meeting of the Bank of Japan's Monetary Policy Committee will be published on Wednesday, September 28. In both cases, the market will try to understand how serious the regulator is about supporting its national currency.
CRYPTOCURRENCIES: Bearish Sentiment Persists
So is bitcoin digital gold after all? According to a survey conducted by Paxos among regular buyers of physical gold, almost a third of respondents consider BTC as the best alternative to the precious metal. However, judging by how both of these assets have been behaving lately, the best alternative for both of them is the US dollar. Physical gold peaked at $2,070 on March 08, 2022, after which it went down, having lost about 20% of its value so far. As for its digital counterpart, the all-time high of $67,273 occurred on November 10, 2021, and the loss is now approximately 71%. If we compare these figures, it turns out that XAU/USD was falling by 0.10% daily, while BTC/USD was falling twice as fast, by 0.22% per day. Draw your own conclusions. We only note that it is not gold and bitcoin that are to blame for what is happening, but the gaining strength of the dollar, which is growing along with the increase in the interest rate of the US Federal Reserve. So, another rate hike led to a fall in cryptocurrency quotes last week. Gold, on the other hand, although made a couple of jumps, returned to its previous price this time. After all, unlike BTC, it is a protective asset, not a risky one. Although, it is also receding step by step under the pressure of the American currency.
When it comes to precious metals, few people use derogatory epithets. Even though their price is falling as well. But in relation to cryptocurrencies, as much as you like. So, for example, the philosopher and author of the cult work "The Black Swan" Nassim Taleb called bitcoin a "tumor" that appeared due to the wrong policy of the Fed. "I believe we had 15 years […] of Disneyland which basically destroyed the economic structure. The Fed missed the mark by cutting interest rates too much. Zero interest for a long period of time damages the economy, bubbles are created, tumors like bitcoin are created," he said, calling for a return to "normal economic life."
Well-known bitcoin investor and analyst Willy Woo agrees that it is the US government that is now running the "ship". True, on the contrary, he would like this "tumor" to be larger, but its growth is held back for political reasons. As he noted, it is currently theoretically possible to sell unlimited amounts of BTC due to futures contracts, although in reality the offer is limited to 21 million coins. "Futures markets can control the BTC rate," the investor says. "CME (Chicago Mercantile Exchange) has set up a kind of bitcoin casino where you can play in US dollars. Wall Street hedge funds loved it. What are the current restrictions on the sale of bitcoin? None, because fiat has no restrictions."
Willy Woo believes that due to the structure of the futures market, major players can suppress BTC by exerting pressure in the form of selling an asset: "Bitcoin should not be killed. Just the ability to short BTC is enough to suppress the exchange rate. Bitcoin will not be able to make a global impact without a high price. The SEC's policy is now aimed at increasing liquidity and the predominance of futures by approving futures ETFs, while spot ETFs are being rejected. Everything has turned into a political game now," the investor sighs sadly.
DataDash analyst and founder Nicholas Merten expects the US Central bank to continue raising interest rates until it achieves a solid victory over inflation. And this, in turn, will push the quotes of digital assets further down. According to Merten, this is influenced not only by macroeconomic, but also by technical factors.
Thus, BTC's 200-week moving average (WMA) has become a resistance level, not a support level. Bitcoin has almost always remained above this indicator throughout its existence, with rare breakdowns to the downside, marking the bottom of the cycle. Currently, the 200-week WMA is around $23,250, and bitcoin is failing to rise above this level.
Merten concluded that BTC's recent exchange rate movement could signal the end of a 10-year bull market, and it can no longer be a leading asset compared to other commodities and stocks. According to the analyst, the next bottom of BTC could be around $14,000, which would mean an 80% correction from the all-time high, as in the case of previous bear markets. "$14,000 is a potential low at the moment. However, investors should consider an even sharper fall to $10,000."
An analyst with the nickname DonAlt agrees with Merten, he believes that BTC will update the 2022 lows amid weak stock market performance. DonAlt predicts the coin will fall below the $18,000-20,000 range and form a new cycle low. "It often happens with such ranges that after it is broken, an increase occurs. And now there is a good chance to break through the $18,000-20,000 range and then form a bullish momentum. The only question is how low bitcoin can go because it can easily go all the way to $15,000." "My forecast is based on the S&P 500 and looks terrible," DonAlt writes. "It looks like this index is in for a big drop."
We paid a lot of attention to the main competitor of bitcoin, ethereum, in the previous review. This was due to a very important event: the global update The Merge took place in the ETH network on September 15, including the transition of the altcoin from the Proof-of-Work protocol to Proof-of-Stake (PoS). Ethereum has fallen by about 20% since then. And we have repeatedly warned about this possibility, citing the opinions of various experts.
The coin's price had roughly doubled from its yearly lows in June, by far outpacing bitcoin's rise, ahead of the network upgrade. And Vijay Ayyar, vice president of the Luno crypto exchange, believes that the Merger had already been "factored into the price" of ETH, and "the actual event has become a "news selling" situation. According to Ayyar, traders are now moving investments from ethereum and other altcoins back to bitcoin, Ayyar said, "as bitcoin is expected to do better in a few months." At the same time, the specialist believes that any "change in the macroeconomic environment in terms of inflation or unexpected interest rates" could lead BTC to fall below $18,000, and the coin will test levels up to $14,000.
However, inflation and rising rates are not the only factors that may affect the quotes of digital assets. So now investors are wondering if ethereum's regulatory status could change after the Merge. The reason for concern was the words of Gary Gensler, Chairman of the US Securities and Exchange Commission. This official said last week that cryptocurrencies operating under the Proof-of-Stake model that applies to ETH can be classified as securities. Thus, these assets fall under the competence of the regulatory authorities. Gensler did not specifically name ethereum, but it is clear that in this case the coin will attract the close attention of the SEC, and it is unknown how this may end. For example, DataDash's Nicholas Merten expects the asset to retest the $800-$1,000 range, although he doesn't rule out a move lower.
At the time of this writing (Friday evening, September 23), bitcoin and ethereum have partially recouped the fall caused by the Fed's decision. BTC/USDis trading at $18,900 ( ETH/USD is $1,320). The total capitalization of the crypto market is $0.929 trillion ($0.959 trillion a week ago). Like seven days ago, Crypto Fear & Greed Index is 20 points and is still in the Extreme Fear zone.
EUR/USD Weekly Outlook
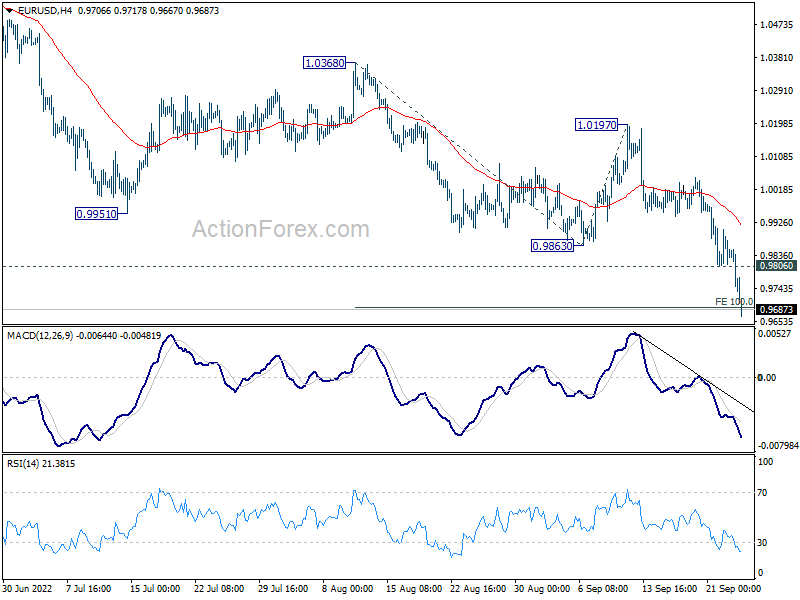
EUR/USD's down trend resumed last week and met 100% projection of 1.0368 to 0.9863 from 1.0197 at 0.9692 already. Initial bias stays on the downside this week for 161.8% projection at 0.9380. On the upside, above 0.9806 minor resistance will turn intraday bias neutral and bring consolidations first, before staging another decline.
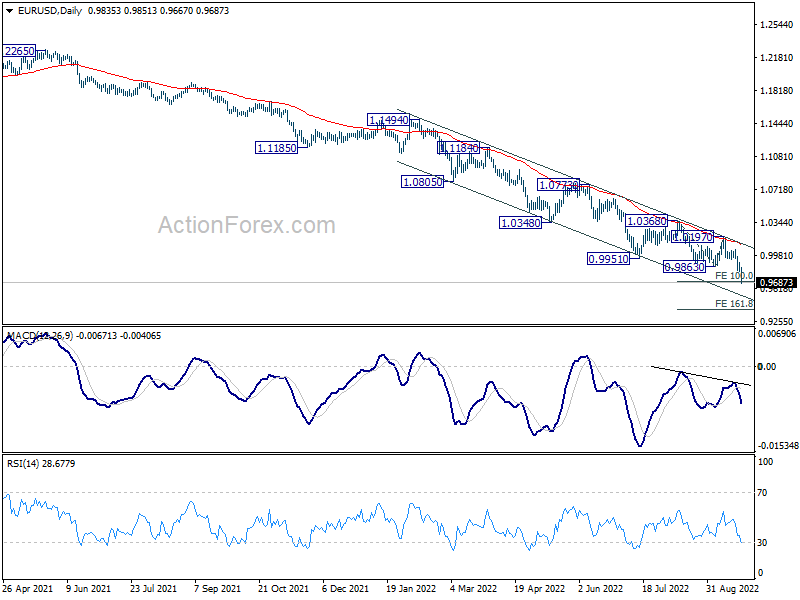
In the bigger picture, down trend from 1.6039 (2008 high) is still in progress. Next target is 100% projection of 1.3993 to 1.0339 from 1.2348 at 0.8694. In any case, break of 1.0197 resistance is needed to be the first sign of medium term bottoming. Otherwise, outlook will stay bearish even with strong rebound.
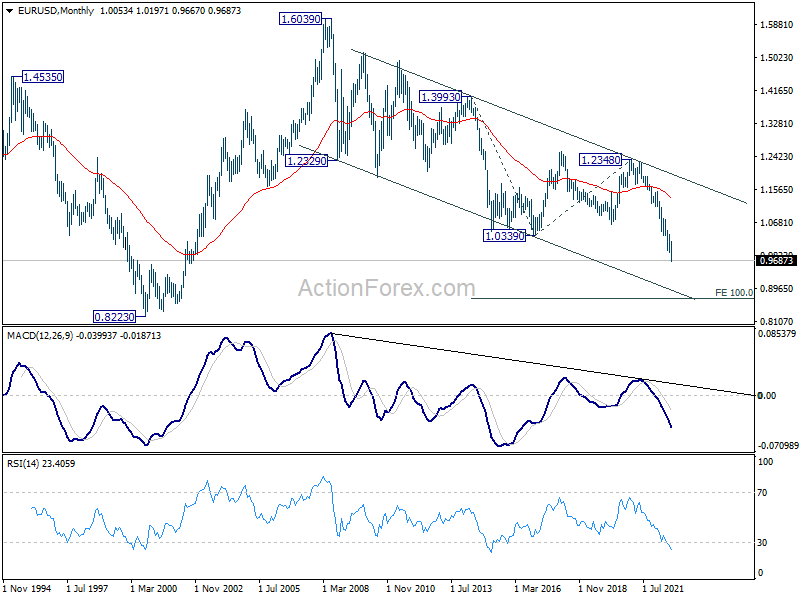
In the long term picture, long term down trend from 1.6039 (2008 high) is extending. Next target is 100% projection of 1.3993 to 1.0339 from 1.2348 at 0.8694. This will now remain the favored case as long as 1.0635 support turned resistance holds.

USD/JPY Weekly Outlook
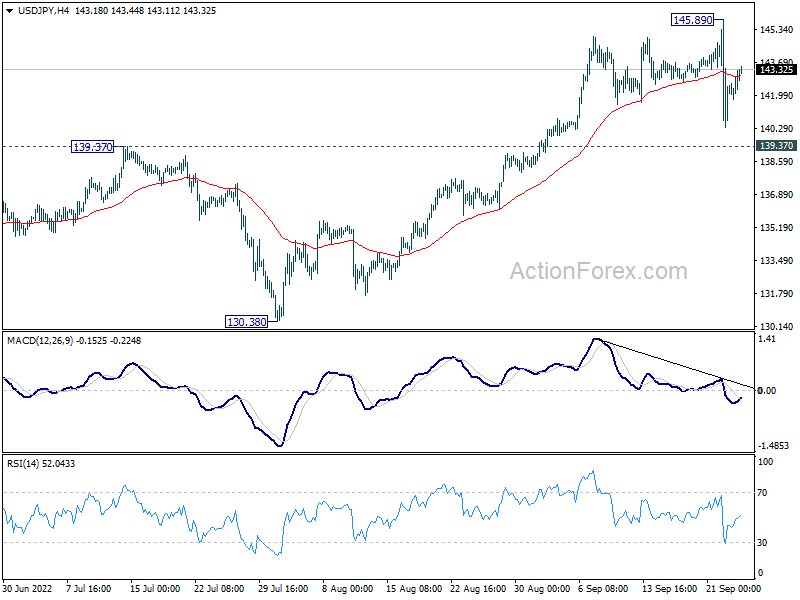
USD/JPY edged higher to 145.89 last week but retreated sharply since then. Yet, downside is contained above 139.37 resistance turned support, and thus there is no indicate of topping yet. Initial bias remains neutral this week first. Break of 145.89 will target 147.68 long term resistance. On the downside, however, decisive break of 139.37 will confirm short term topping, on bearish divergence condition in 4 hour MACD. Deeper decline would be seen back towards 130.38 support.
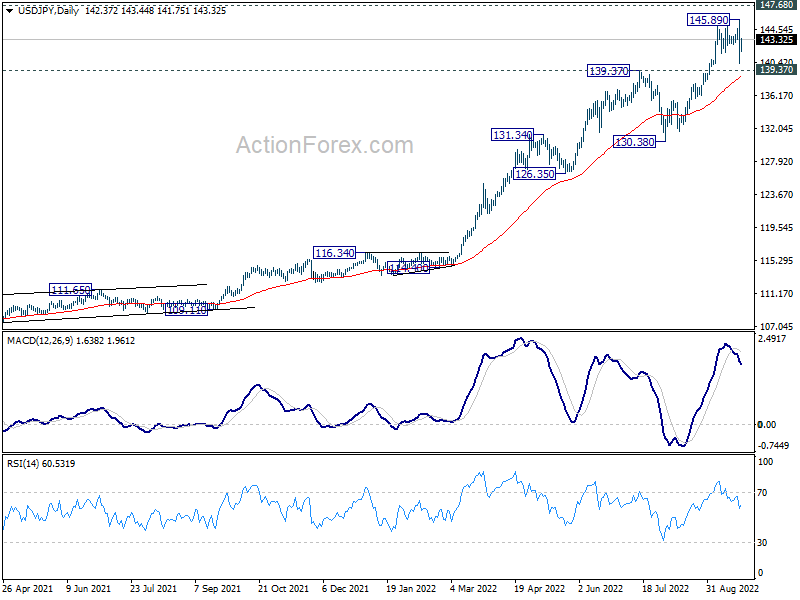
In the bigger picture, up trend from 101.18 is still in progress, as part of the whole up trend from 75.56 (2011 low). Further rise should be seen to 147.68 (1998 high). For now, break of 130.38 support is needed to be the first indication of medium term topping. Otherwise, outlook will stay bullish even in case of deep pull back.
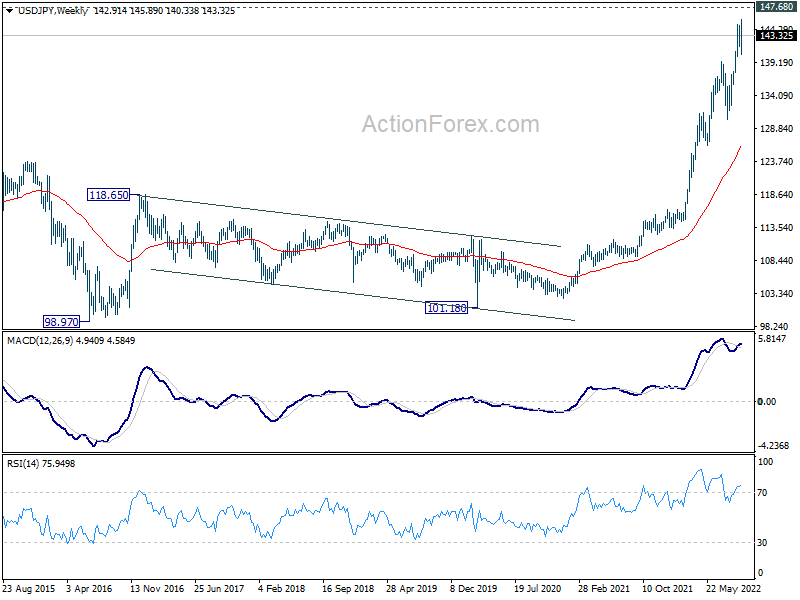
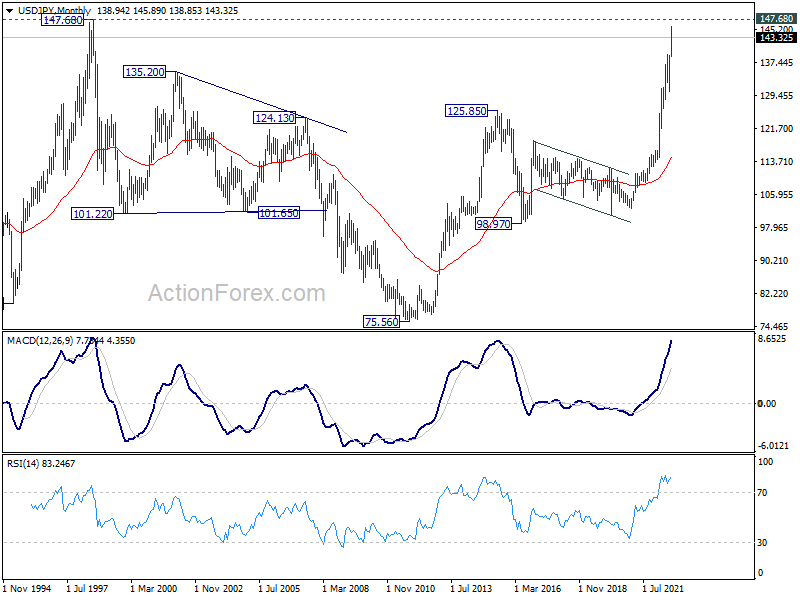
In the long term picture, rise from 101.18 is seen as part of the up trend from 75.56 (2011 low). Further rally is expected to 100% projection of 75.56 (2011 low) to 125.85 (2015 high) from 98.97 at 149.26, which is slightly above 147.68 (1998 high). This will remain the favored case as long as 130.38 support holds.
GBP/USD Weekly Outlook
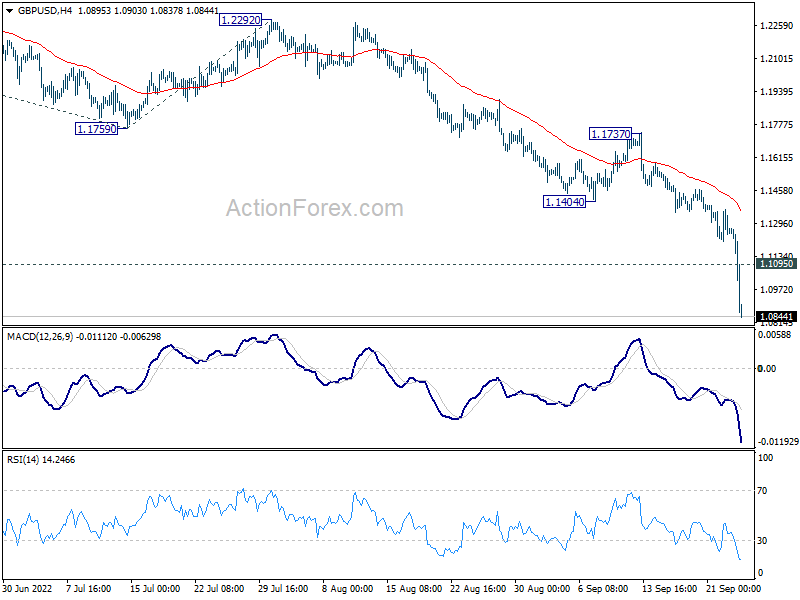
GBP/USD's down trend accelerated to as low as 1.0837 last week and there is no sign of bottoming yet. Break of the near term channel support indicates downside acceleration. Next target is 1.0675 long term projection level, and then 100% projection of 1.3748 to 1.1759 from 1.2292 at 1.0303. On the upside, above 1.1095 minor resistance will turn intraday bias neutral and bring consolidations first, before staging another decline.
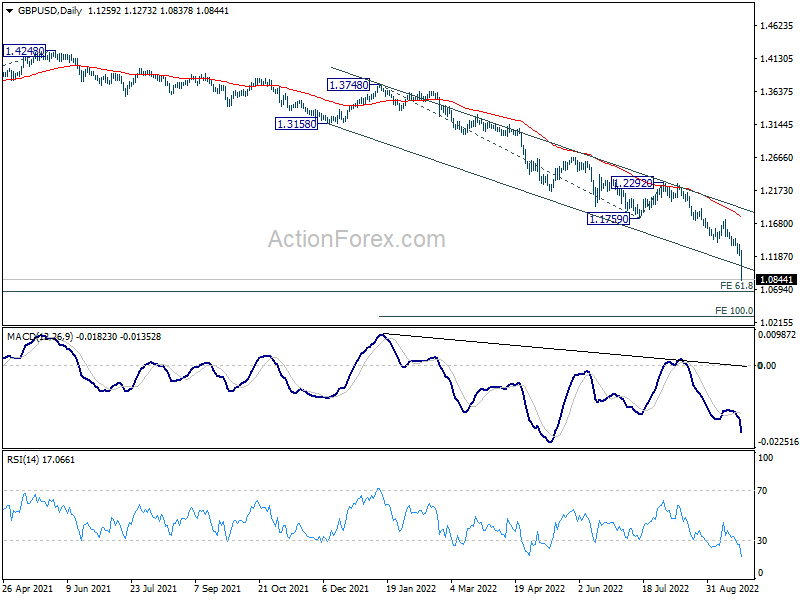
In the bigger picture, fall from 1.4248 (2018 high) is resuming long term down trend from 2.1161 (2007 high). Next target is 61.8% projection of 1.7190 (2014 high) to 1.1409 (2020 low) from 1.4248 (2021 high) at 1.0675. Firm break there will target parity. This will remain the favored case for now as long as 1.2292 resistance holds.
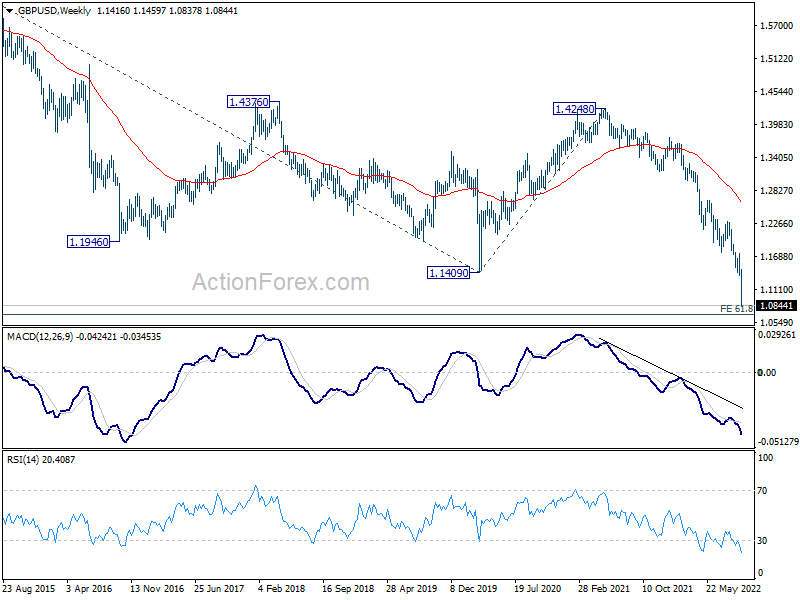
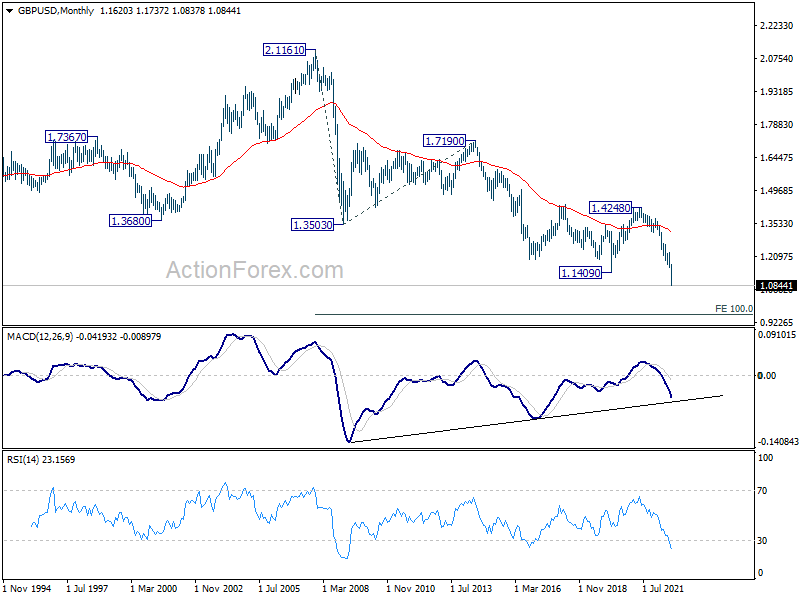
In the longer term picture, long term down trend from 2.1161 (2007) high is still in progress. Next target is 100% projection of 2.1161 to 1.3503 from 1.7190 at 0.9532.
USD/CHF Weekly Outlook
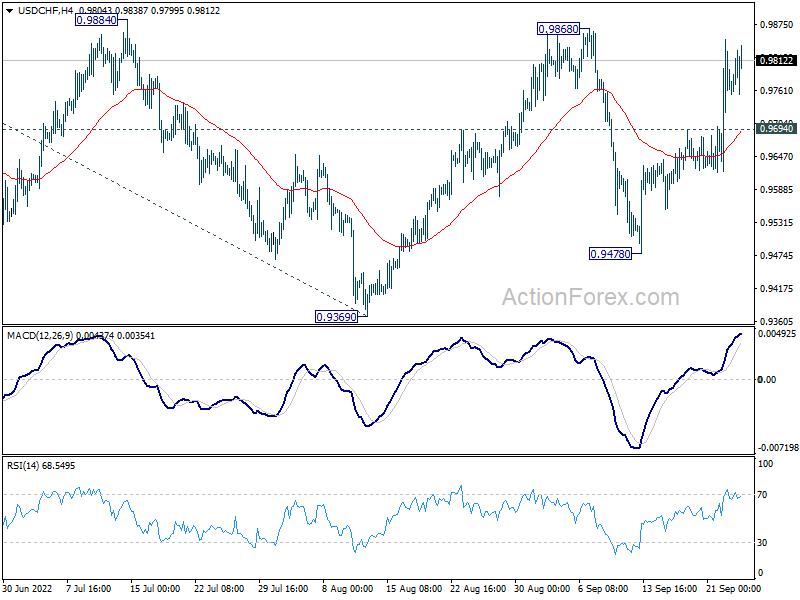
USD/CHF's rebound from 0.9478 extended higher last week. Initial bias stays on the upside this week for 0.9868 resistance. Firm break of 0.9868 resistance will argue that larger up trend is ready to resume through 1.0063. Overall, the corrective pattern from 1.0063 high could still extend. Below 0.9619 minor support will turn bias back to the downside for 0.9478 and below.
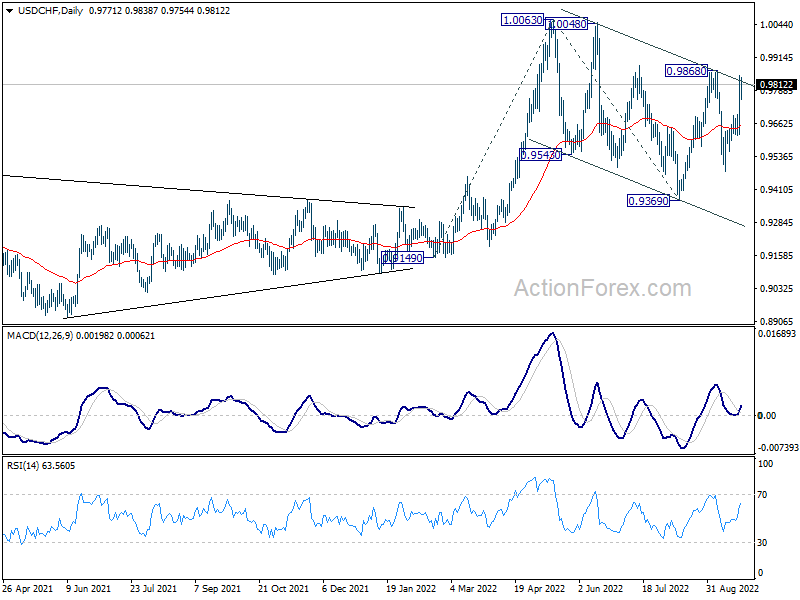
In the bigger picture, current development suggests that up trend from 0.8756 (2021 low) is still in progress. Sustained break of 1.0063 will target 100% projection of 0.9149 to 1.0063 from 0.9369 at 1.0283, and then 1.0342 (2016 high). For now, this will remain the favored case as long as 0.9369 support holds, even in case of deep pull back.
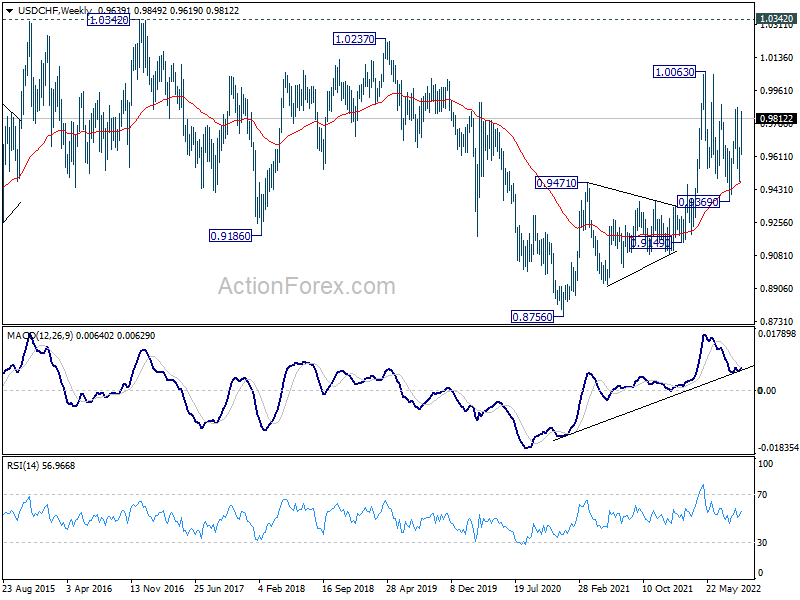
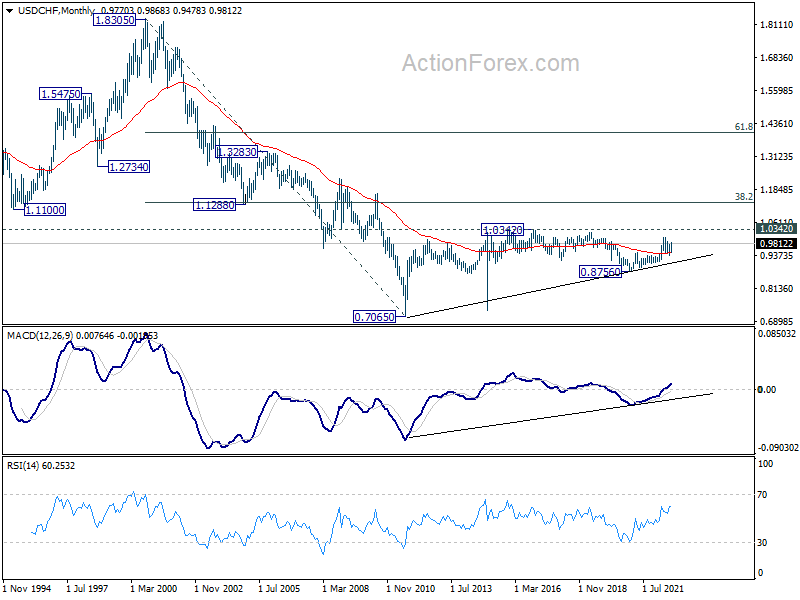
In the long term picture, outlook is mixed with deeper than expected fall from 1.0063, but some support is seen from 55 week EMA (now at 0.9460). Overall, though, USD/CHF is seen as in sideway pattern from 1.0342 (2016 high). Range trading should continue until further development.
AUD/USD Weekly Outlook
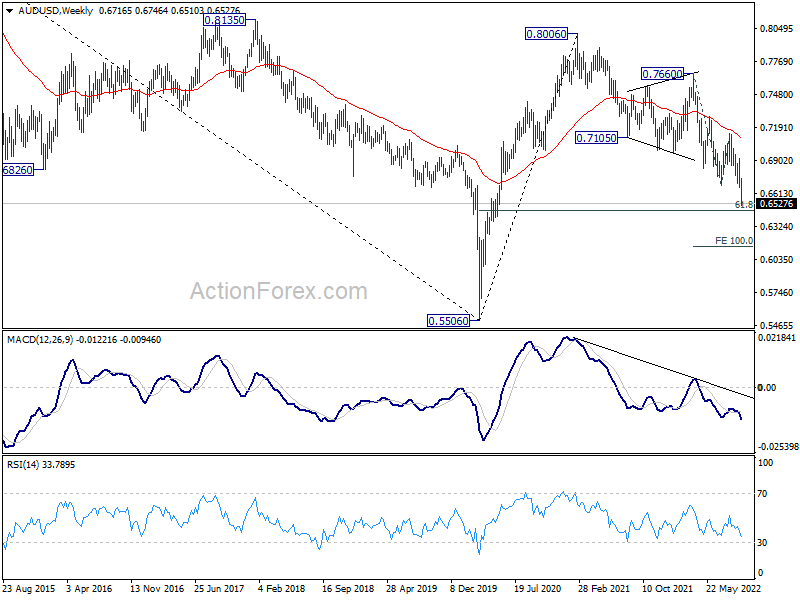
AUD/USD's down trend resumed by breaking through 0.6680 low decisively, and hit as low as 0.6510. Initial bias is on the downside this week. Next target is 0.6461 long term fibonacci level. Break there will target 100% projection of 0.7660 to 0.6680 from 0.7135 at 0.6155. On the upside, above 0.6669 minor resistance will turn intraday bias neutral and bring consolidations, before staging another decline.
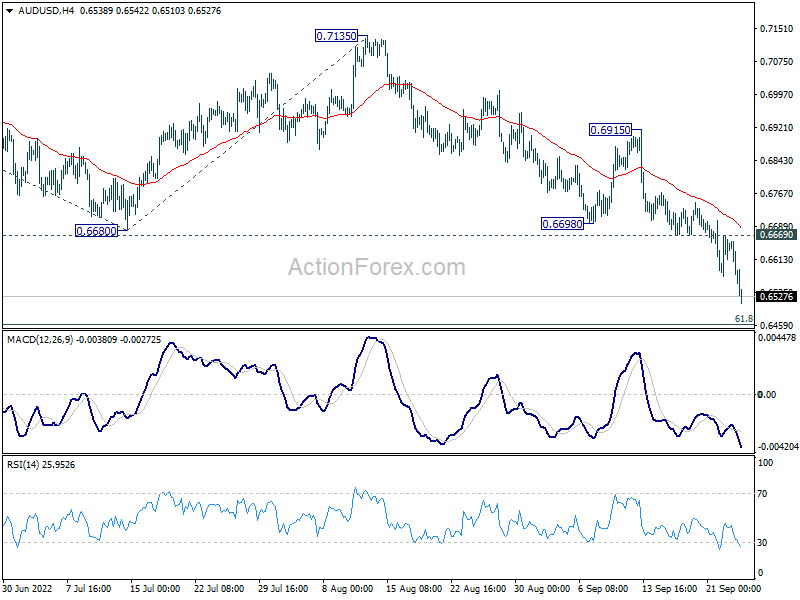
In the bigger picture, down trend form 0.8006 (2021 high) is expected to continue as long as 0.7135 resistance holds. Next target is 61.8% retracement of 0.5506 (2020 low) to 0.8006 at 0.6461. Sustained break there will pave the way back to retest 0.5506.
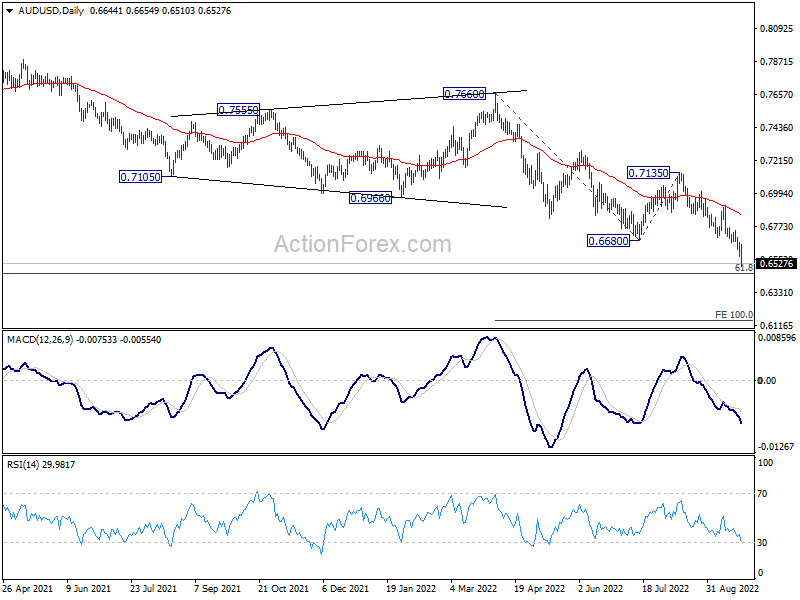
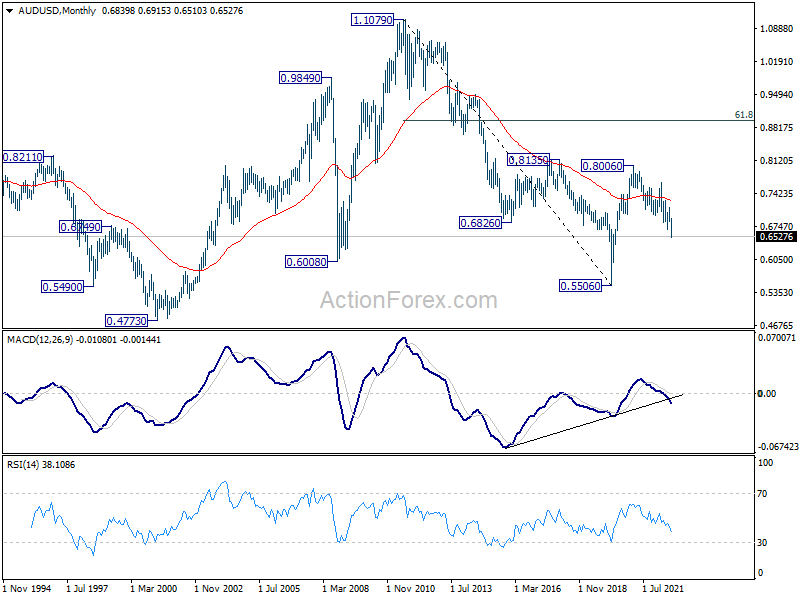
In the long term picture, rejection by 0.8135 resistance suggests that the long term down trend from 1.1079 (2011 high) is not ready to reverse. Yet, the structure of the fall from 0.8006 still is not clearly impulsive. Hence, break of 0.5506 low is not envisaged for now. The long term outlook stays neutral first, and will be reassessed later after the fall from 0.8006 completes.