

Sample Category Title
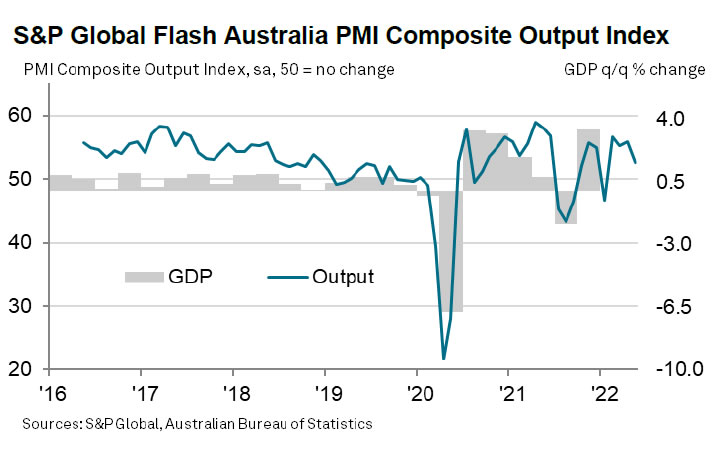
Australia PMI composite dropped to 52.5 in Apr, still a solid expansion
Australia PMI Manufacturing dropped from 58.8 to 55.3 in May. PMI Services dropped from 56.1 to 53.0. PMI Composite dropped from 55.9 to 52.5. All are 4-month lows.
Jingyi Pan, Economics Associate Director at S&P Global Market Intelligence said:
"The expansion of the Australian economy continued in May at a solid pace... Although manufacturing output was affected by issues of COVID-19 disruptions and poor weather conditions, manufacturing demand remained robust, which had been a reassuring sign.
"Persistent supply chain constraints continue to pose challenges for firms in the private sector, both in terms of input acquisition and price fluctuations. Anecdotal evidence also suggested that firms are concerned with the rising interest rate outlook and the effect on their businesses, all of which are worth monitoring moving ahead."
New Zealand retail sales dropped -0.5% qoq in Q1, ex-auto sales flat
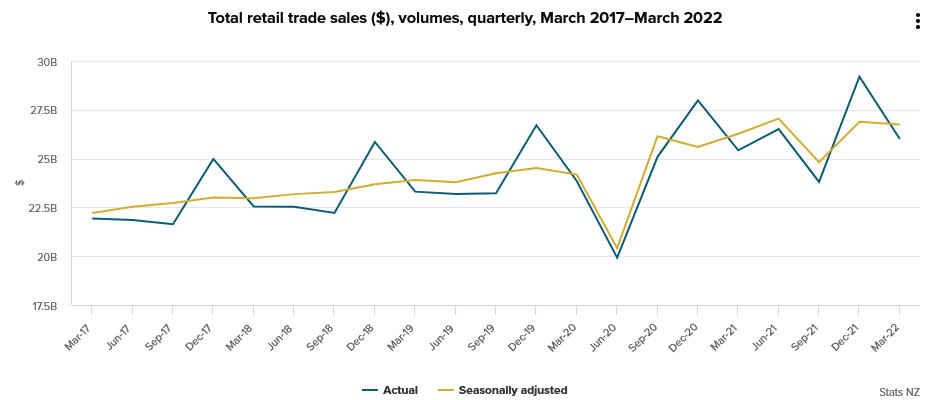
New Zealand retail sales volume (with price effects removed) dropped -0.5% qoq in Q1, much worse than expectation of 0.4% qoq. Ex-auto sales volume was flat, below expectation of 0.4% qoq. Total value of retail sales rose 0.5% qoq.
12 of the 16 regions showed higher sales values. By region, the largest changes in sales values were in: Auckland – up 3.6% (NZD 387m); Waikato – up 4.2% (NZD 109m); Canterbury – up 1.9% (NZD 70m); Wellington – up 2.3% (NZD 63m).
Technical Outlook and Review
DXY:
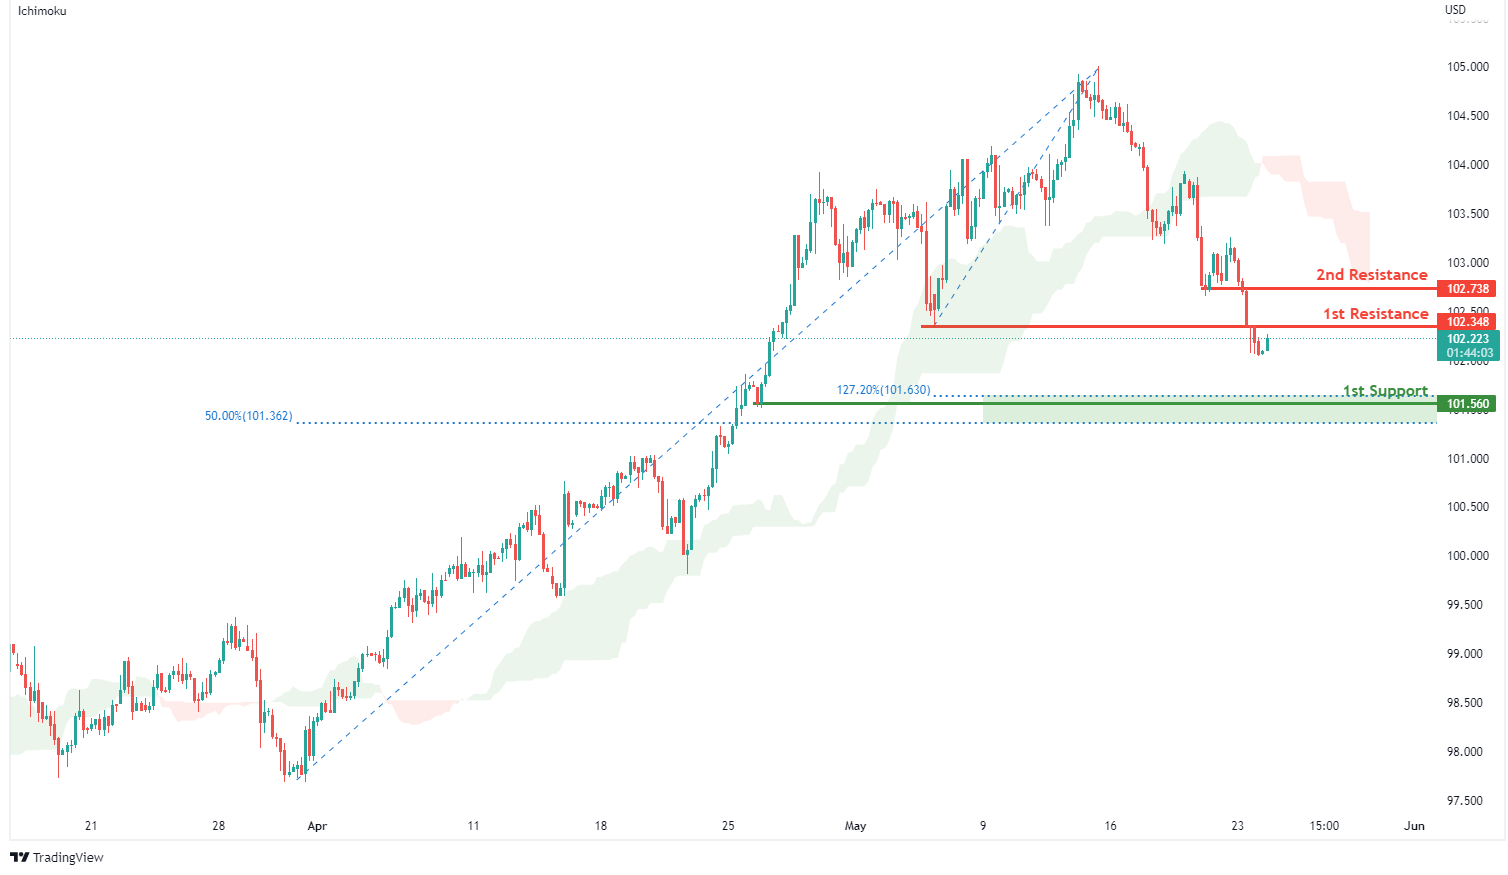
On the H4, with prices below the ichimoku indicator, we have a bearish bias that price will drop to our 1st support at 101.560 where the horizontal swing low support, 127.2% Fibonacci extension and 50% Fibonacci retracement are from our 1st resistance at 102.348 in line with the horizontal pullback resistance. Alternatively, price may break 1st resistance structure and head for 2nd resistance at 102.738 where the horizontal pullback resistance is.
Areas of consideration:
- H4 time frame, 1st resistance at 102.348
- H4 time frame, 1st support at 101.560
XAU/USD (GOLD):
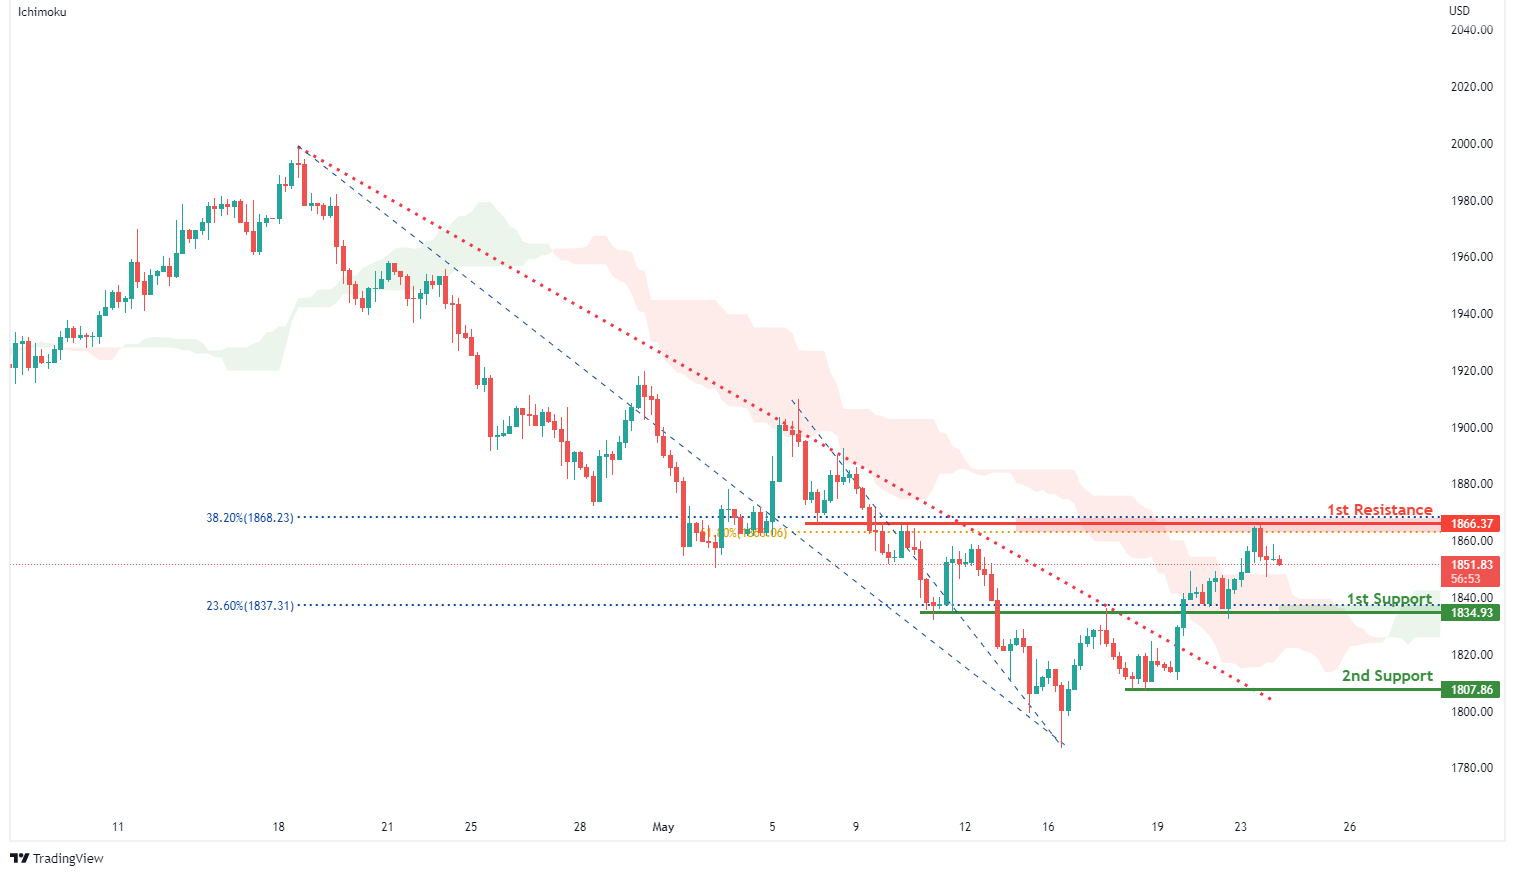
On the H4, with prices moving above the ichimoku cloud and prices breaking out of the descending trendline,we have a bullish bias that price will rise from our 1st support at 1834.93 where the horizontal overlap support and 23.6% fibonacci retracement is to our 1st resistance at 1866.37 in line with the horizontal overlap resistance, 38.2% Fibonacci retracement and 61.8% Fibonacci retracement. Alternatively, price may break 1st support structure and head for 2nd support at 1807.86 where the horizontal swing low support is.
Areas of consideration:
- H4 time frame, 1st Resistance at 1866.37
- H4 time frame, 1st Support at 1834.93
GBP/USD:
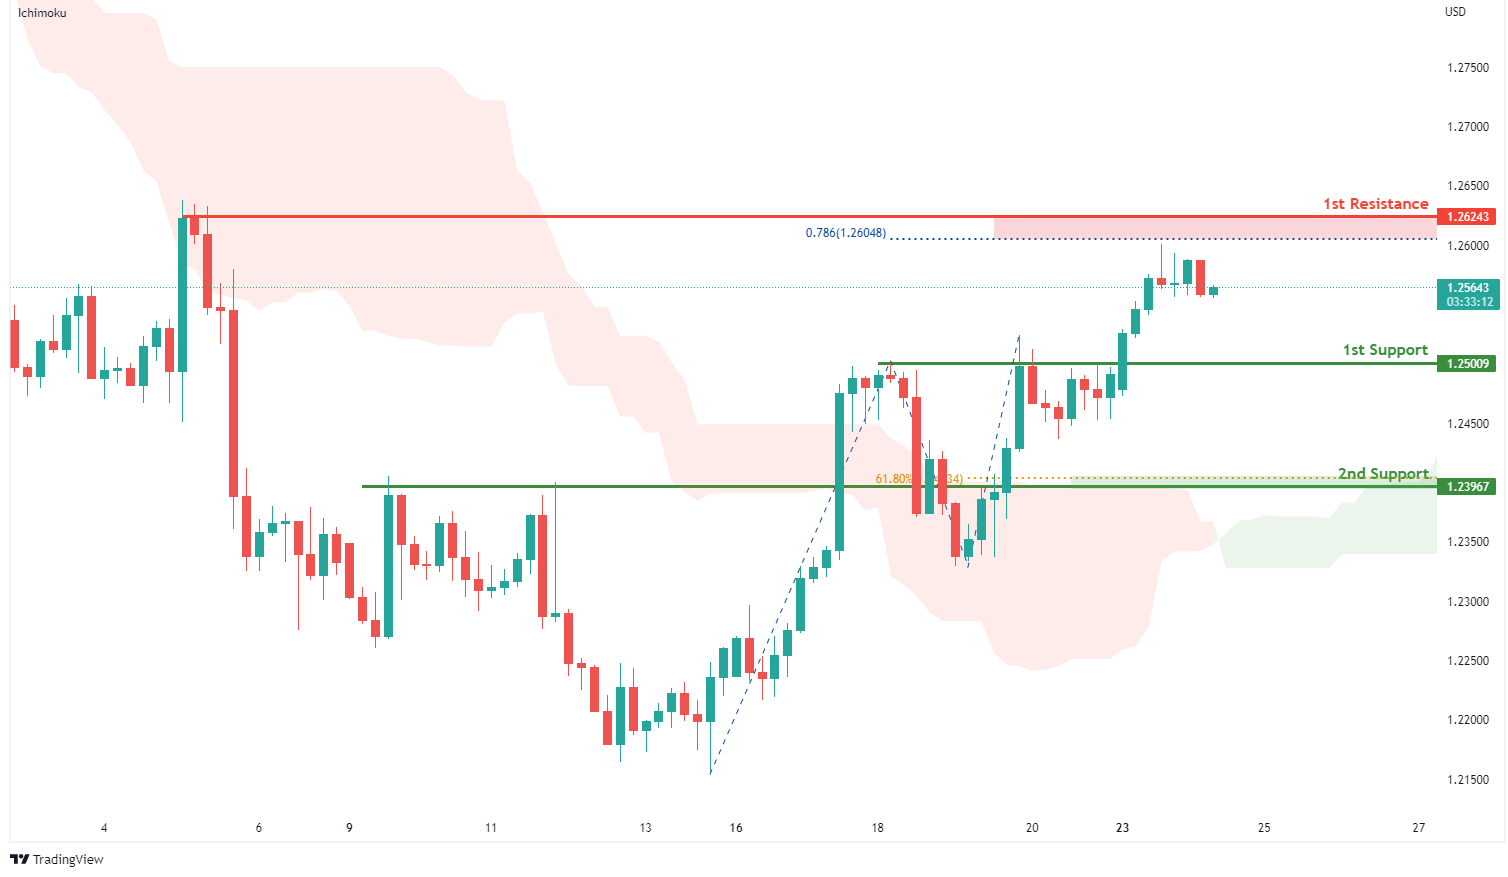
On the H4, with price moving above the ichimoku indicator, we have a bullish bias that price will rise from our 1st support at 1.25009 where the horizontal overlap support is to our 1st resistance at 1.26243 in line with the 78.6% Fibonacci projection. Alternatively, price may break 1st support structure and head for 2nd support at 1.23967 where the horizontal overlap support and 61.8% Fibonacci retracement are.
Areas of consideration:
- H4 1st resistance at 1.26243
- H4 1st support at 1.25009
USD/CHF:
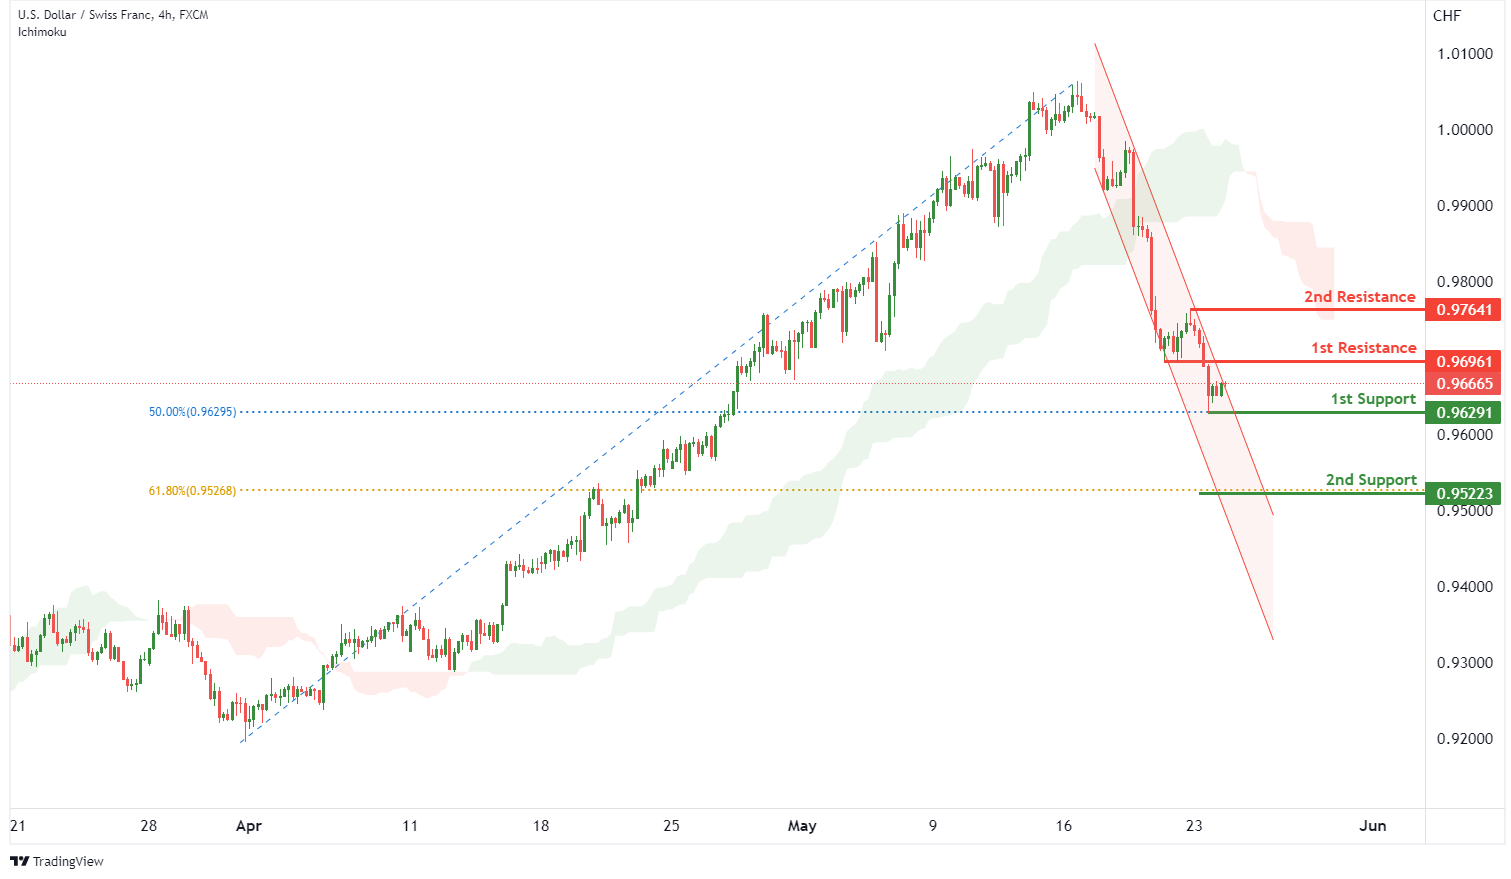
On the H4, with price moving below the ichimoku cloud, we have a bearish bias that price will drop to our 1st support at 0.96291 where the 50% Fibonacci retracement is from our 1st resistance at 0.96961 in line with the pullback resistance. If price breaks through 1st support, the 2nd support is at 0.95223 where the 61.8% fibonacci retracement is. Alternatively, price may break 1st resistance structure and head for 2nd resistance at 0.97641 where the swing high resistance is.
Areas of consideration
- 1st support level at 0.96291
- 1st resistance level at 0.96961
EUR/USD :
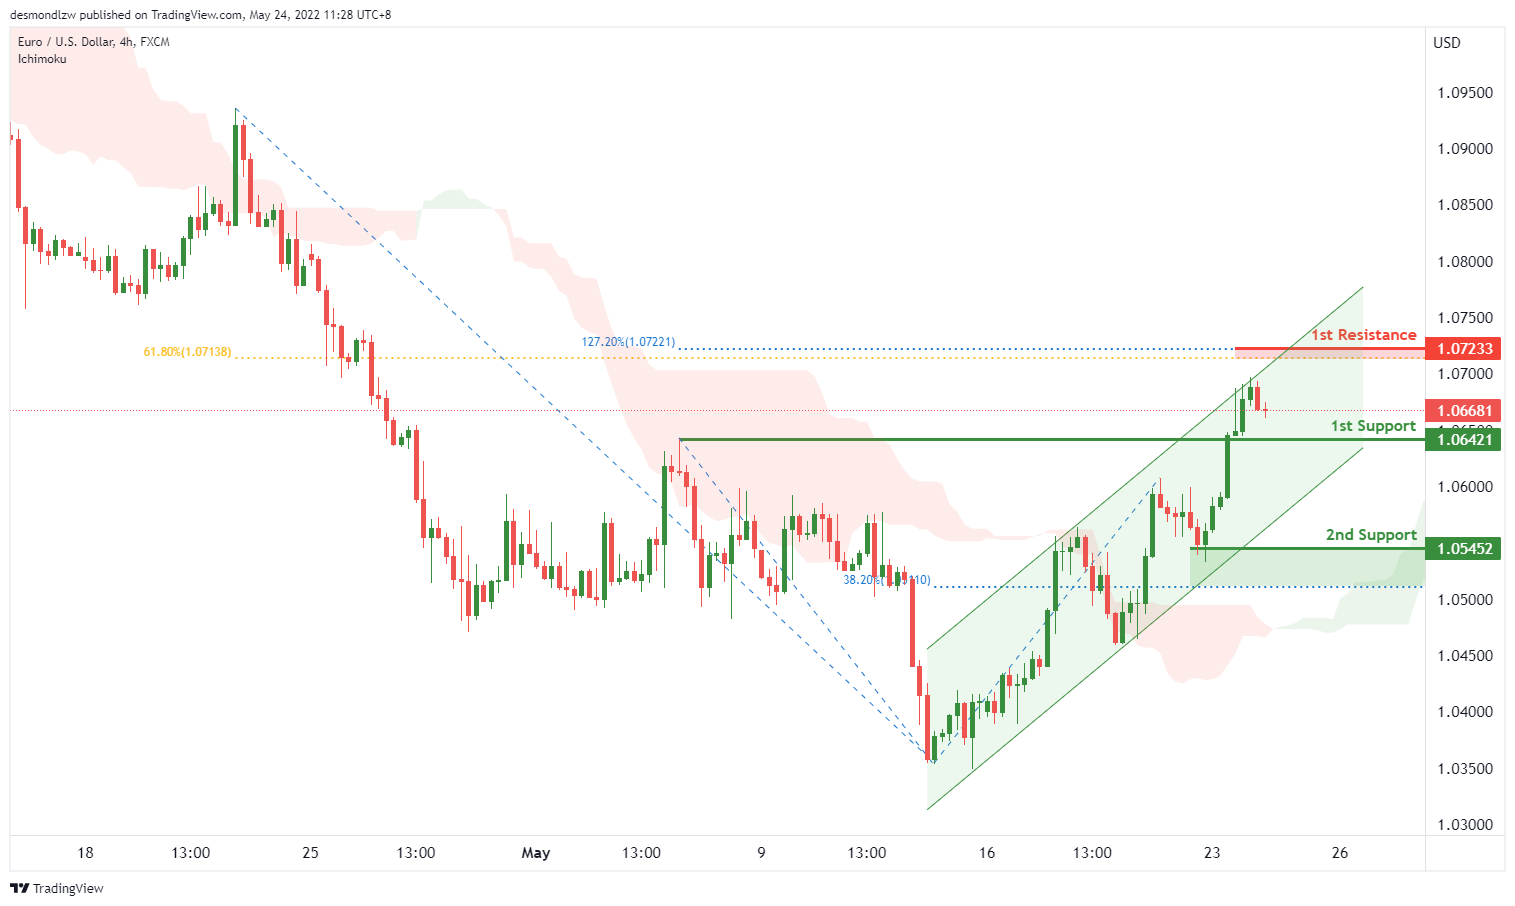
On the H4, with price moving above the ichimoku cloud, we have a bullish bias that price will rise to our 1st resistance at 1.07233 where the 127.2% Fibonacci extension and 61.8% Fibonacci retracement are from our 1st support at 1.06421 in line with the pullback support. Alternatively, price may break 1st support structure and head for 2nd support at 1.05452 where the 38.1% Fibonacci retracement and swing low support are.
Areas of consideration :
- H4 1st resistance at 1.07233
- H4 1st support at 1.06223
USD/JPY:
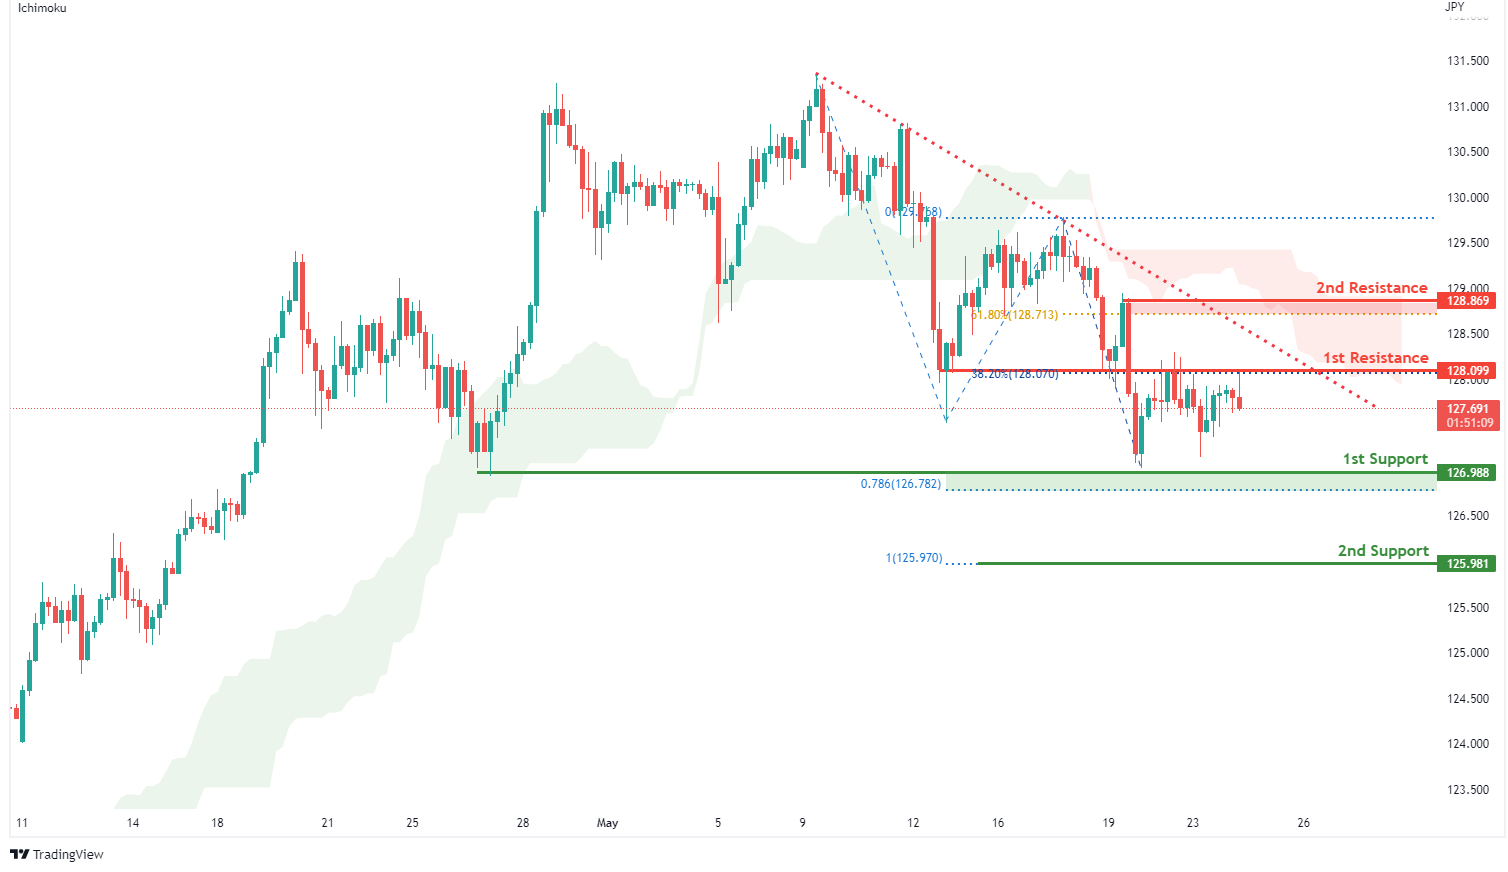
On the H4, with prices moving below the ichimoku indicator, we have a bearish bias that price will drop from our 1st resistance at 128.099 where the 38.2% Fibonacci retracement and horizontal overlap resistance is to our 1st support at 126.988 in line with the 78.6% Fibonacci projection. Price may break through the 1st support and head for the 2nd support at 125.981 where the 100% fibonacci projection is. Alternatively, price may break 1st resistance structure and head for 2nd resistance at 128.869 where the horizontal swing high resistance and 61.8% Fibonacci retracement are.
Areas of consideration:
- H4 time frame, 1st resistance at 128.085
- H4 time frame, 1st support at 127.156
AUD/USD:
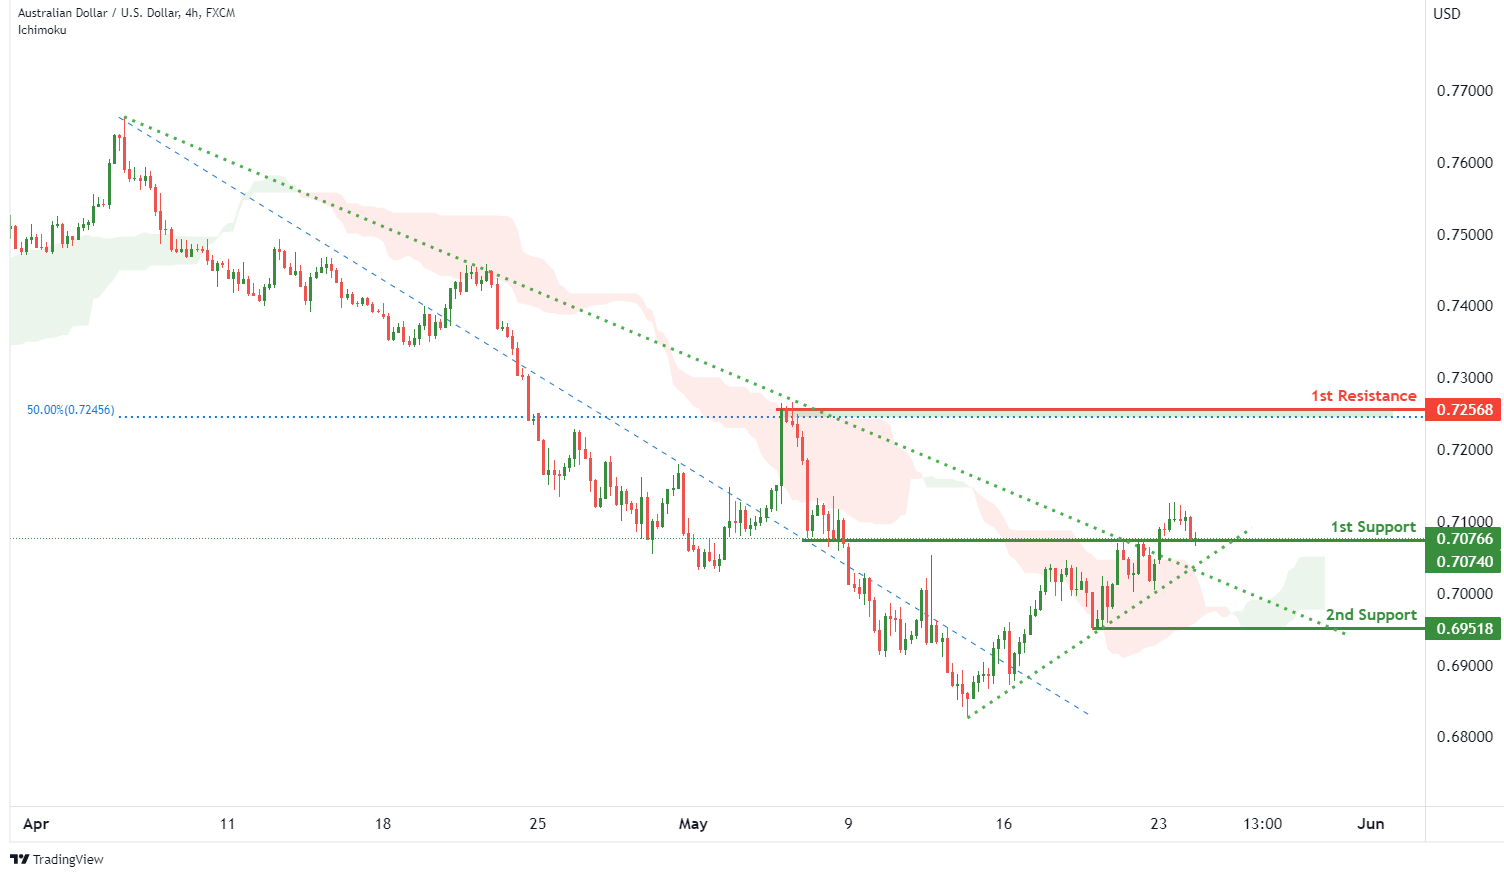
On the H4, with price moving above the ichimoku cloud and price breakout from the descending trendline, we have a bullish bias that price will rise to our 1st resistance at 0.72568 where the 50% Fibonacci retracement is from our 1st support at 0.70790 in line with the overlap support. Alternatively, price may break structure and head for 2nd support at 0.69518 where the swing low support is.
Areas of consideration
- H4 1st resistance at 0.72568
- H4 1st support at 0.70790
NZD/USD:
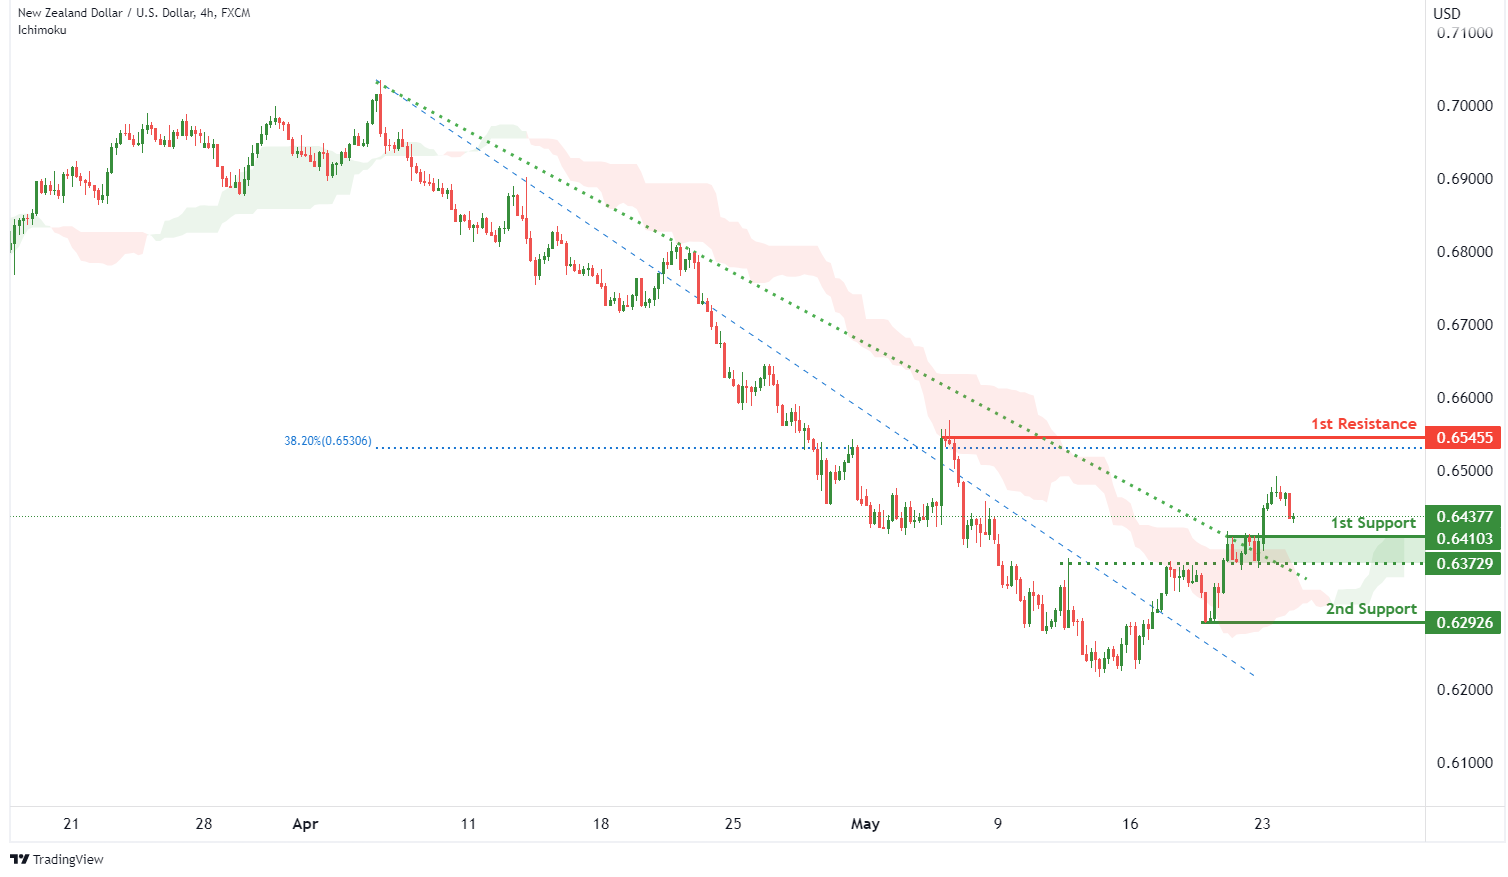
On the H4, with price moving above the ichimoku cloud, we have a bullish bias that price will rise to our 1st resistance at 0.65455 where the 38.2% Fibonacci retracement and swing high resistance are from our 1st support at 0.64103 in line with the pullback support. Take note of intermediary support at 0.63729 where the overlap support is. Alternatively, price may break structure and head for 2nd support at 0.62926 where the swing low support is.
Areas of consideration:
- H4 time frame, 1st support at 0.64103
- H4 time frame, 1st resistance at 0.65455
USD/CAD:
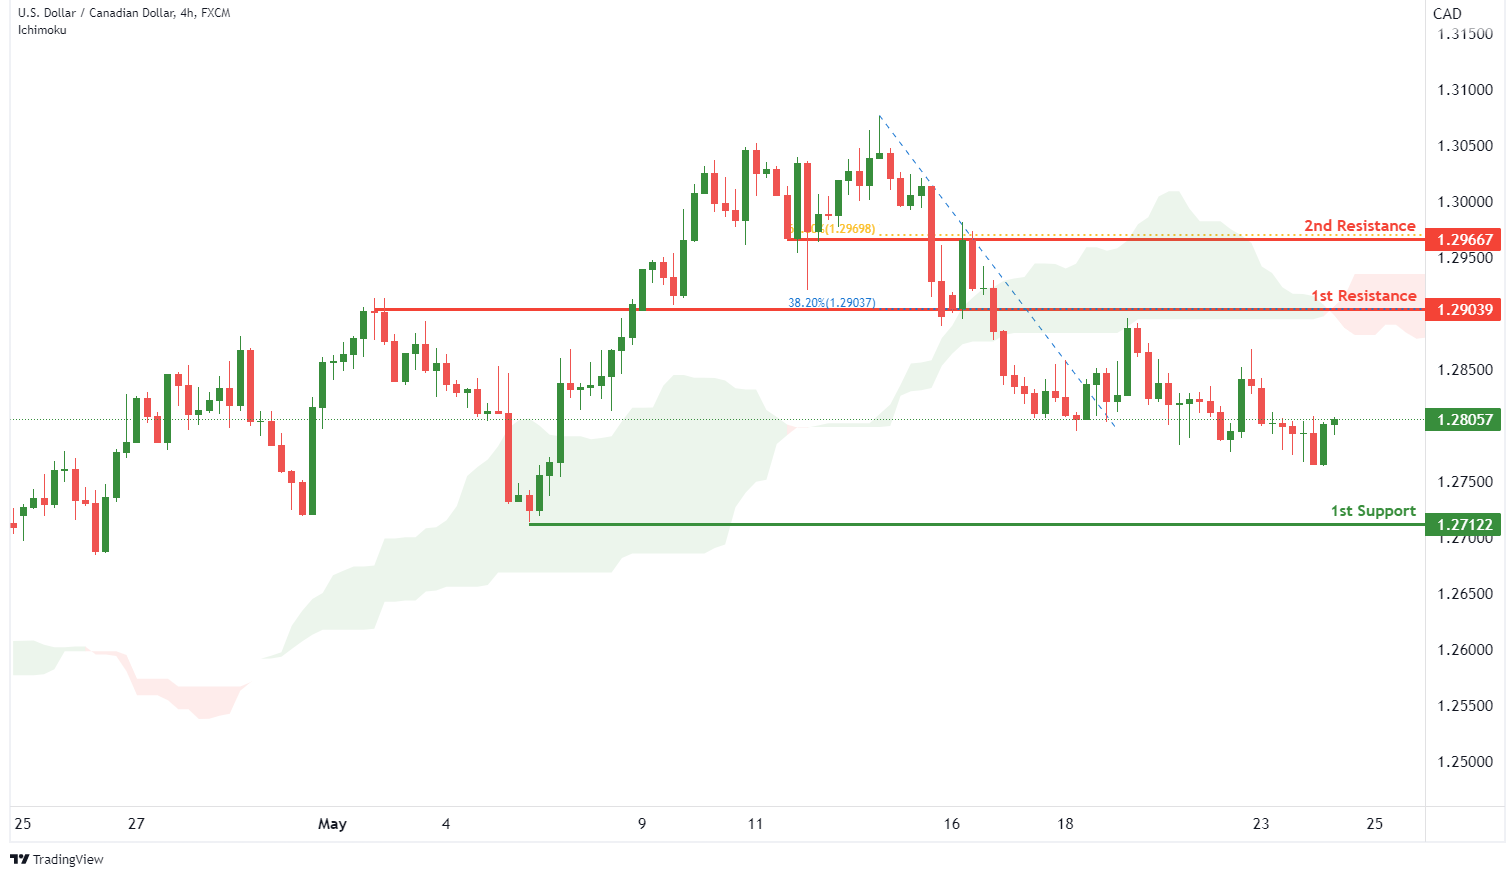
On the H4, with price moving below the ichimoku, we have a bearish bias that price will drop from our 1st resistance at 1.29039 where the horizontal overlap resistance and 38.2% Fibonacci retracement is to our 1st support at 1.27122 in line with the swing low support. Alternatively, price may break 1st resistance structure and head for 2nd resistance at 1.29667 where the horizontal overlap resistance and 61.8% Fibonacci retracement are.
Areas of consideration:
- H4 time frame, 1st resistance at 1.29039
- H4 time frame, 1st support at 1.27122
OIL:
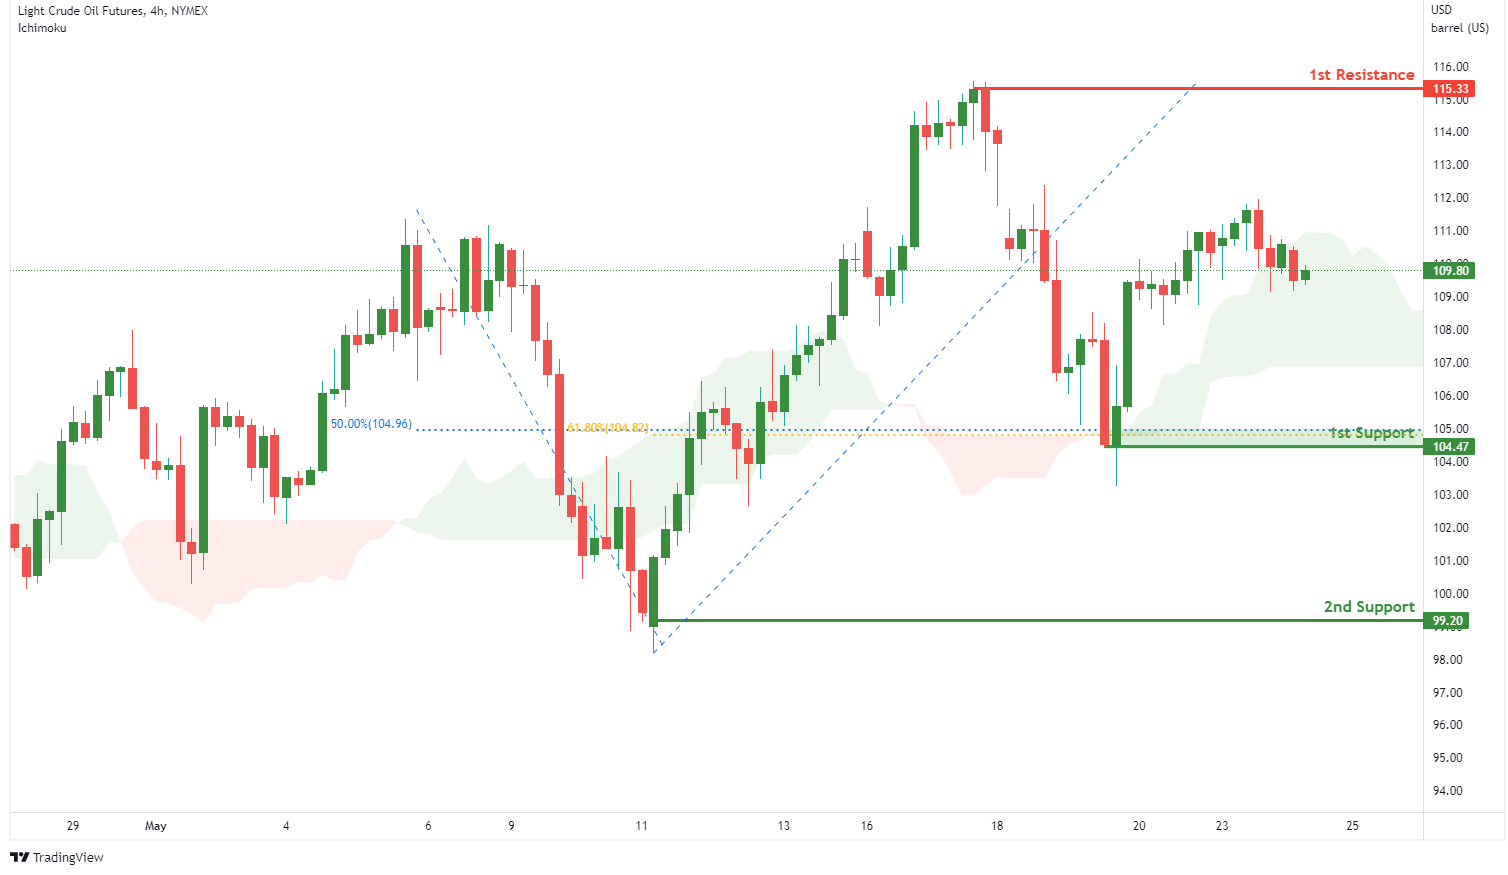
On the H4, with price expected to bounce off the ichimoku cloud, we have a bullish bias that price will rise to our 1st resistance at 115.33 where the swing high resistance is from our 1st support at 104.47 in line with the swing low support, 50% fibonacci retracement and 61.8%% fibonacci retracement. Alternatively, price may break 1st support structure and head for 2nd support at 99.20 where the horizontal swing low support is.
Areas of consideration:
- H4 time frame, 1st resistance of 115.33
- H4 time frame, 1st support of 104.47
Dow Jones Industrial Average:
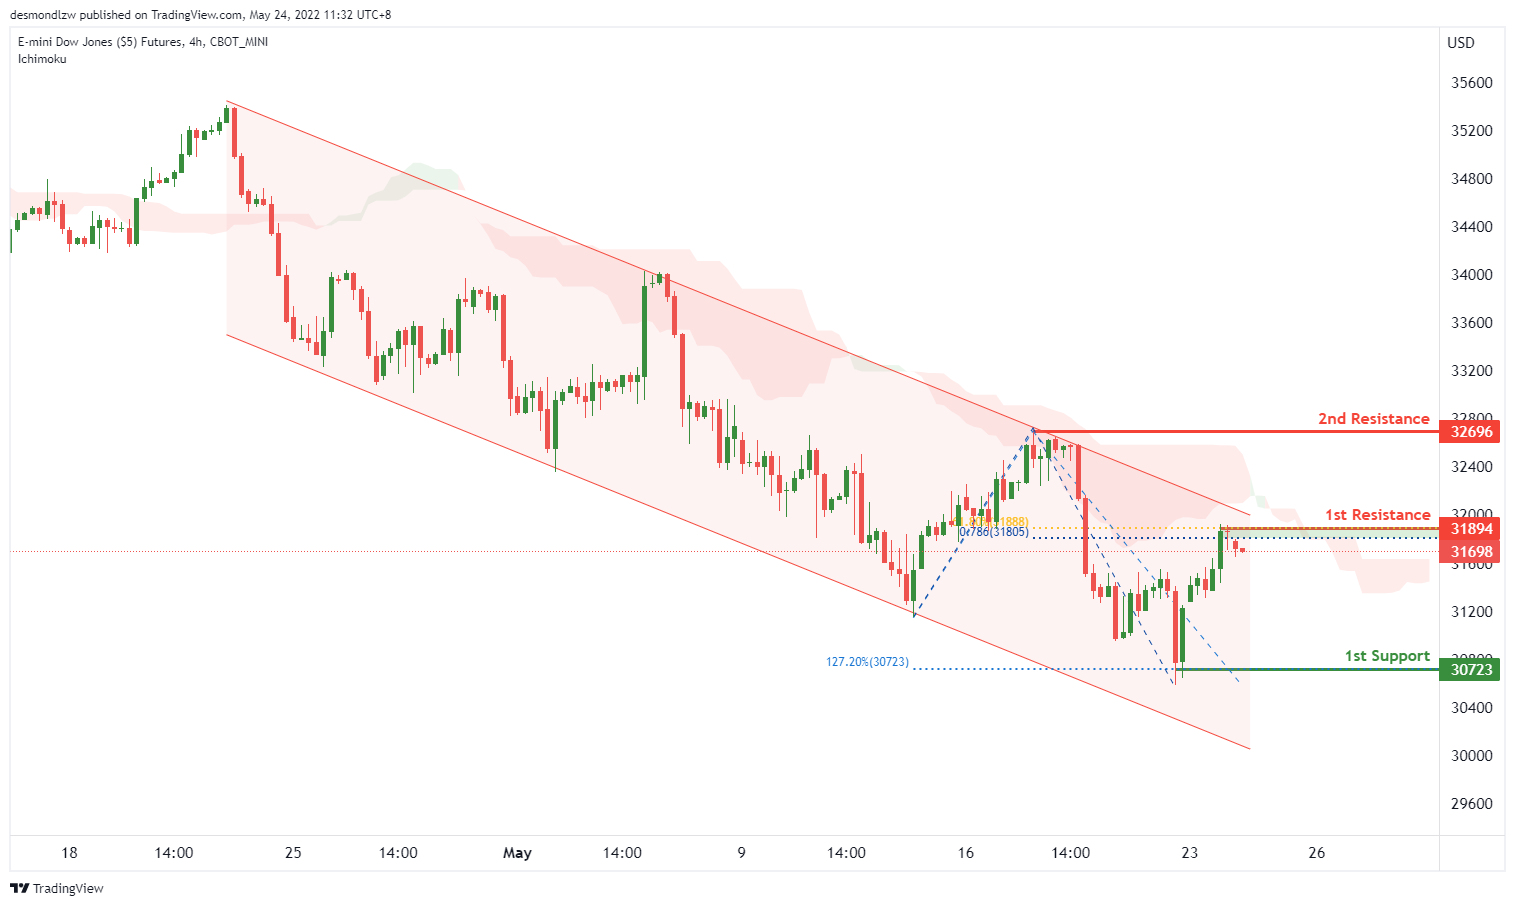
On the H4, with price moving below the ichimoku indicator, we have a bearish bias that price will drop to our 1st support at 30723 where the 127.2% Fibonacci extension and swing low support from our 1st resistance at 31894 in line with the horizontal swing high resistance 78.6% fibonacci projection and 61.8% fibonacci retracement. Alternatively, price may break 1st resistance structure and head for 2nd resistance at 32696 where the horizontal swing high resistance is.
Areas of consideration :
- H4 time frame, 1st resistance at 31894
- H4 time frame, 1st support at 30723
Fed George: Interest rate to be in neighborhood of 2% by Aug
Kansas City Fed President Esther George said, "I expect that further rate increases could put the federal funds rate in the neighborhood of 2% by August, a significant pace of change in policy settings". Then, "evidence that inflation is clearly decelerating will inform judgments about further tightening."
"The inflation we are now experiencing is obviously both too high and too broad to dismiss. The central bank's job is to prevent persistent imbalances from feeding into inflation and unmooring inflation expectations," she said. "By influencing interest rates, the Federal Reserve primarily affects the demand side of the imbalance. The evolution of its efforts alongside other factors will affect the course of monetary policy, requiring continuous and careful monitoring."
Fed Bostic: A pause in September might make sense
Atlanta Fed President Raphael Bostic said yesterday that he backed the plan of raising interest rate by 50bps in June and July. But a "pause" in September is also in his baseline view.
"I'm at 50 basis points as long as the economy proceeds as I think it's going to," Bostic said. "If inflation starts moving in a different direction than it is right now, I'd have to be open to us moving more aggressively. I do want to make it clear that nothing is off the table. As we go through the months, we will see how it plays out."
"I have got a baseline view where for me I think a pause in September might make sense," Bostic told reporters Monday following a speech to the Rotary Club of Atlanta. "After we get through the summer and we think about where we are in terms of policy, I think a lot of it will depend on the on-the-ground dynamics that we are starting to see. My motto is observe and adapt."
Elliott Wave View: Copper Looking to Turn Lower Soon
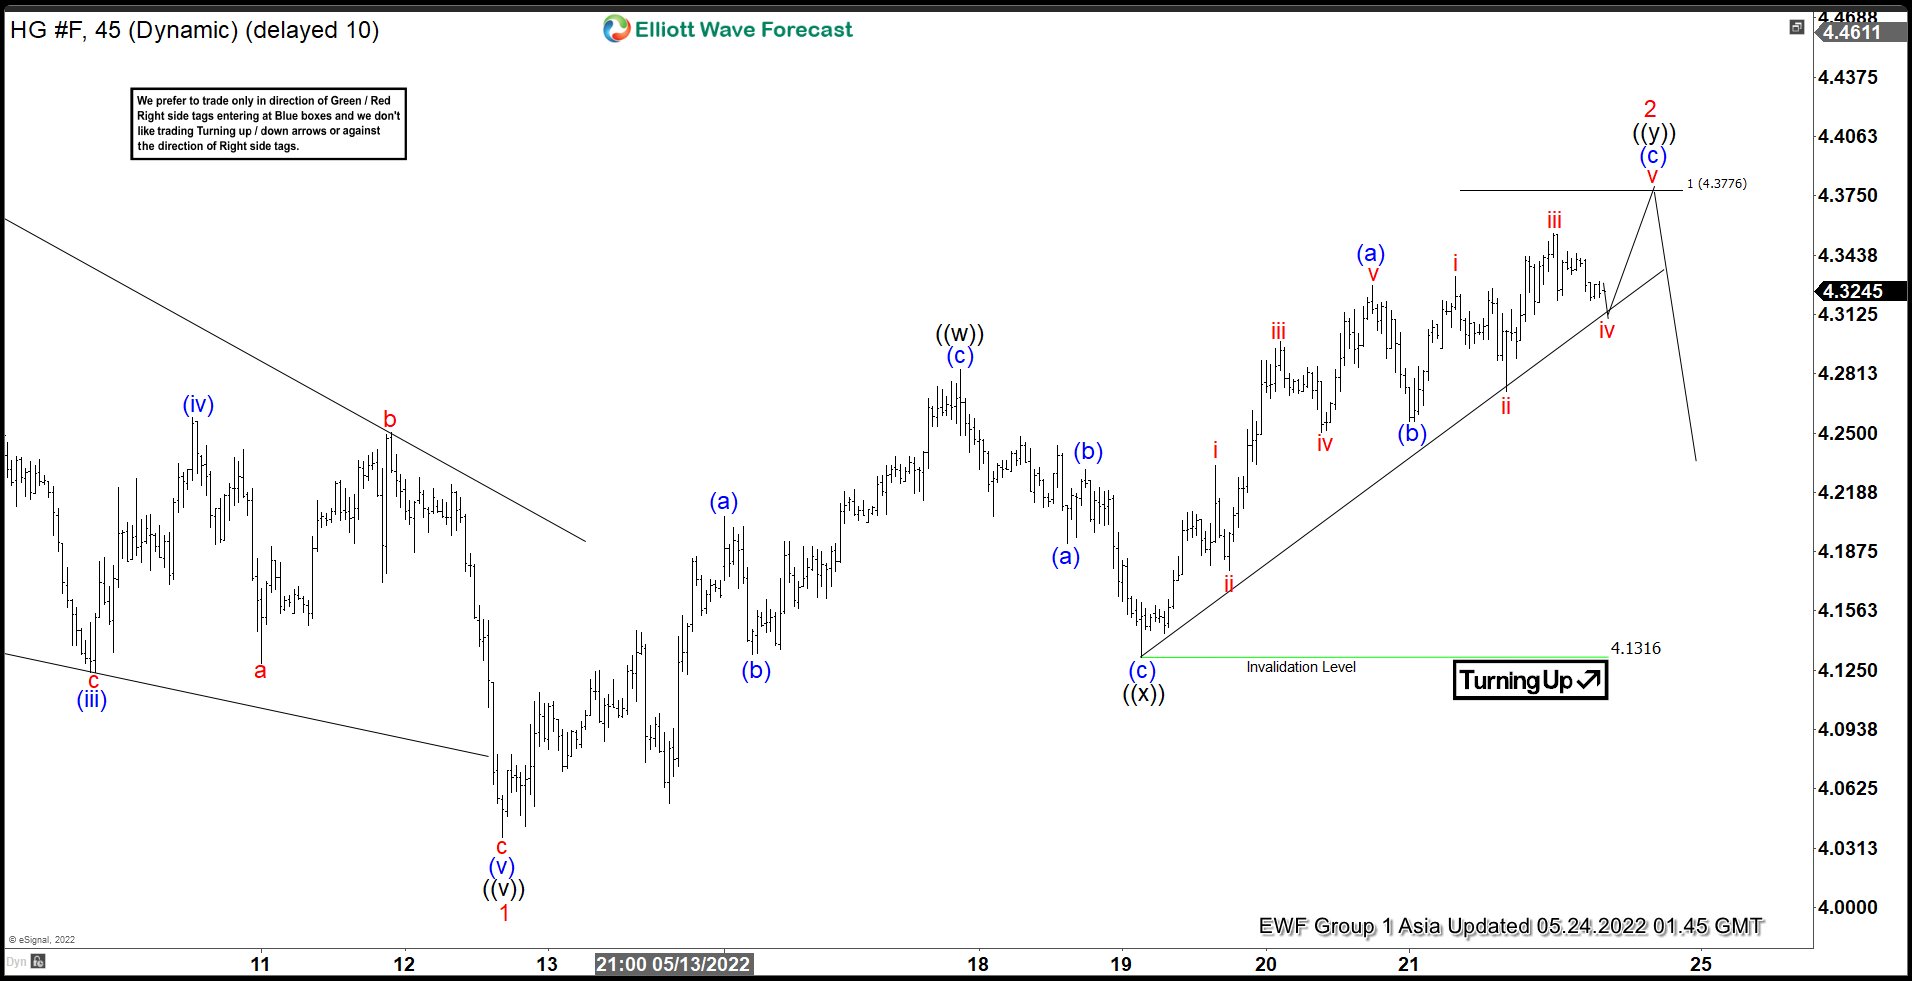
Short Term Elliott Wave View in Copper (HG #F) suggests cycle from 4/5/2022 high ended as a 5 waves impulse structure at 4.0372. This impulse wave lower ended wave 1 in red. Wave 2 corrective rally is now in progress as double three Elliott Wave Structure. Rally from wave 1 began the first leg of the double correction. Wave (a) ended at 4.2062 and a pullback in wave (b) ended at 4.1332. Copper then resumed higher in wave (c) and ended at 4.2833 as wave ((w)) in higher degree.
Down from wave ((w)) high on May 17, wave (a) ended at 4.1915 and bounce in wave (b) ended at 4.2309. Then the metal extends lower in wave (c) towards 4.1316 which completed the connector as wave ((x)). Rally from wave ((x)) is a zig zag correction to complete wave ((y)) and wave 2. Wave (a) of ((y)) formed an impulse and ended at 4.3274. Correction in wave (b) ended at 4.2556. Next push higher we are calling an ending diagonal as wave (c) to complete wave ((y)) and the whole structure as wave 2 correction. This last leg higher should complete at 100% – 161.8% Fibonacci extension at 4.3776 – 4.53 where Copper should turn lower again or at least see 3 waves pullback.
Copper (HG #F) 45 Minutes Elliott Wave Chart
NZDJPY Buying The Dip After Elliott Wave Zigzag Correction
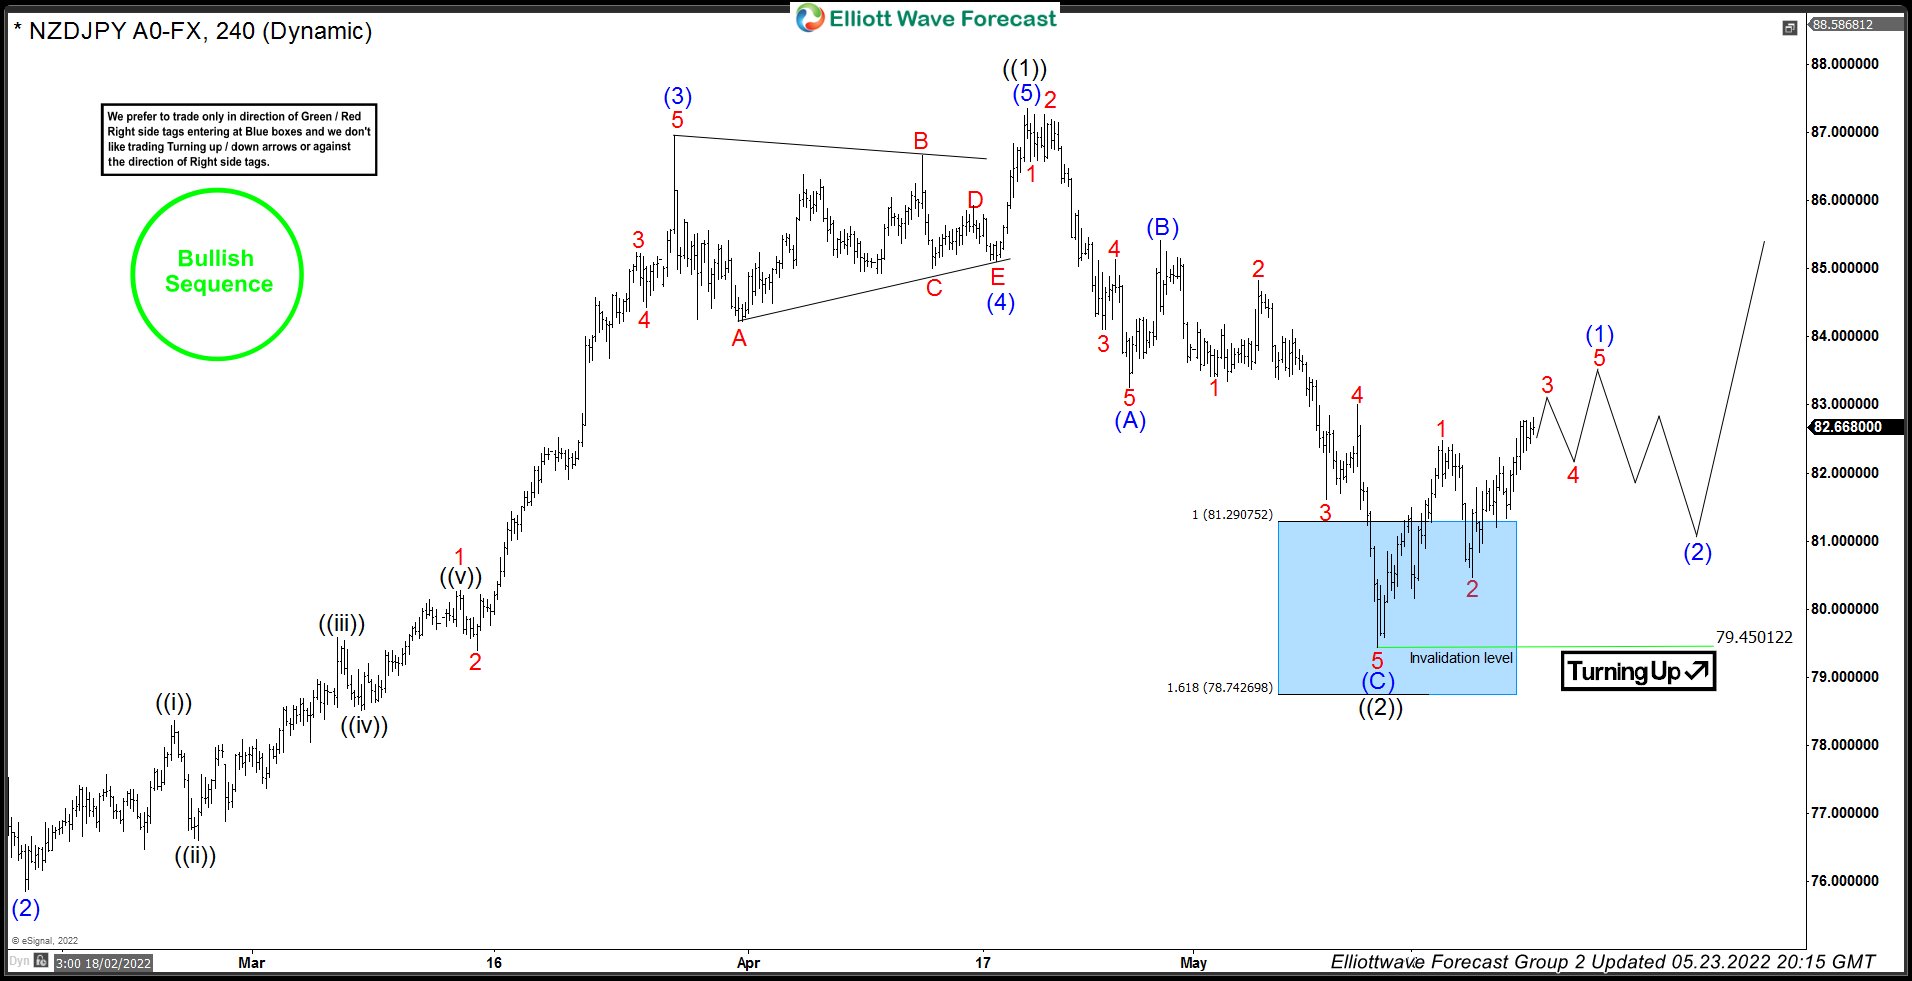
In this technical blog we’re going to take a quick look at the Elliott Wave charts of NZDJPY published in members area of the website. As our members knew, we’ve been favoring the long side in NZDJPY due to incomplete bullish sequences the pair is showing in the cycles from the March 2020 low against January 2022 low. NZDJPY cycle from January 2022 low ended at April 20, 2022 peak and it started pulling back. This pull back took the form of Elliott Wave Zig Zag pattern and members knew it was nothing more than another buying opportunity. In the remainder of the article, we are going to explain the Elliott Wave Pattern and talk about the blue box buying area.
Before we take a look at the real market example, let’s explain Elliott Wave Zigzag.
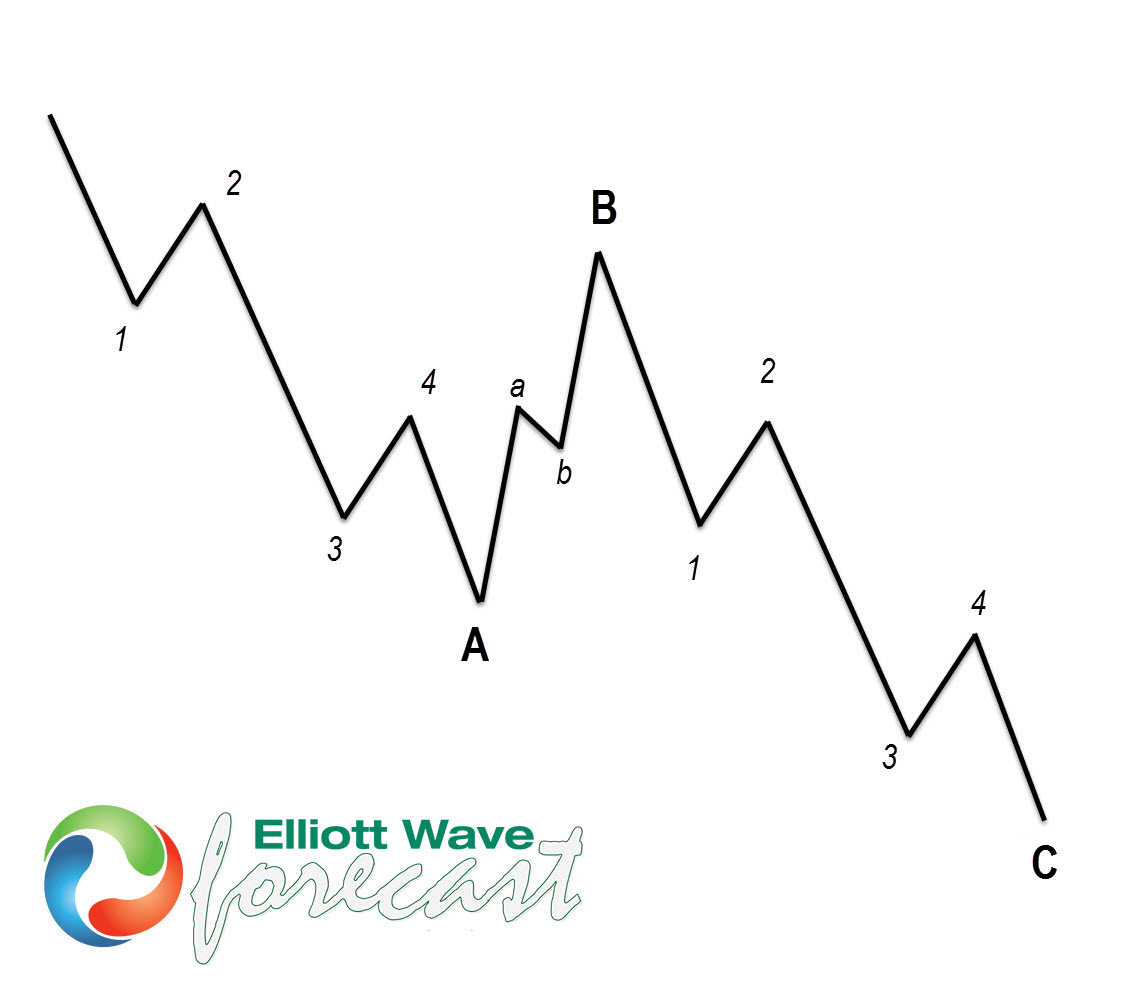
Elliott Wave Zigzag is the most popular corrective pattern in Elliott Wave theory . It’s made of 3 swings and is sub-divided as 5-3-5. Inner swings are labeled as A,B,C where A =5 waves, B=3 waves and C=5 waves. That means A and C can be either impulsive waves or diagonals. (Leading Diagonal in case of wave A or Ending in case of wave C) . Waves A and C must meet all conditions of being 5 wave structure, such as: having RSI divergence between wave subdivisions, ideal Fibonacci extensions and ideal retracements etc. Wave B could be a triangle, FLAT, Zigzag or a double three structure.
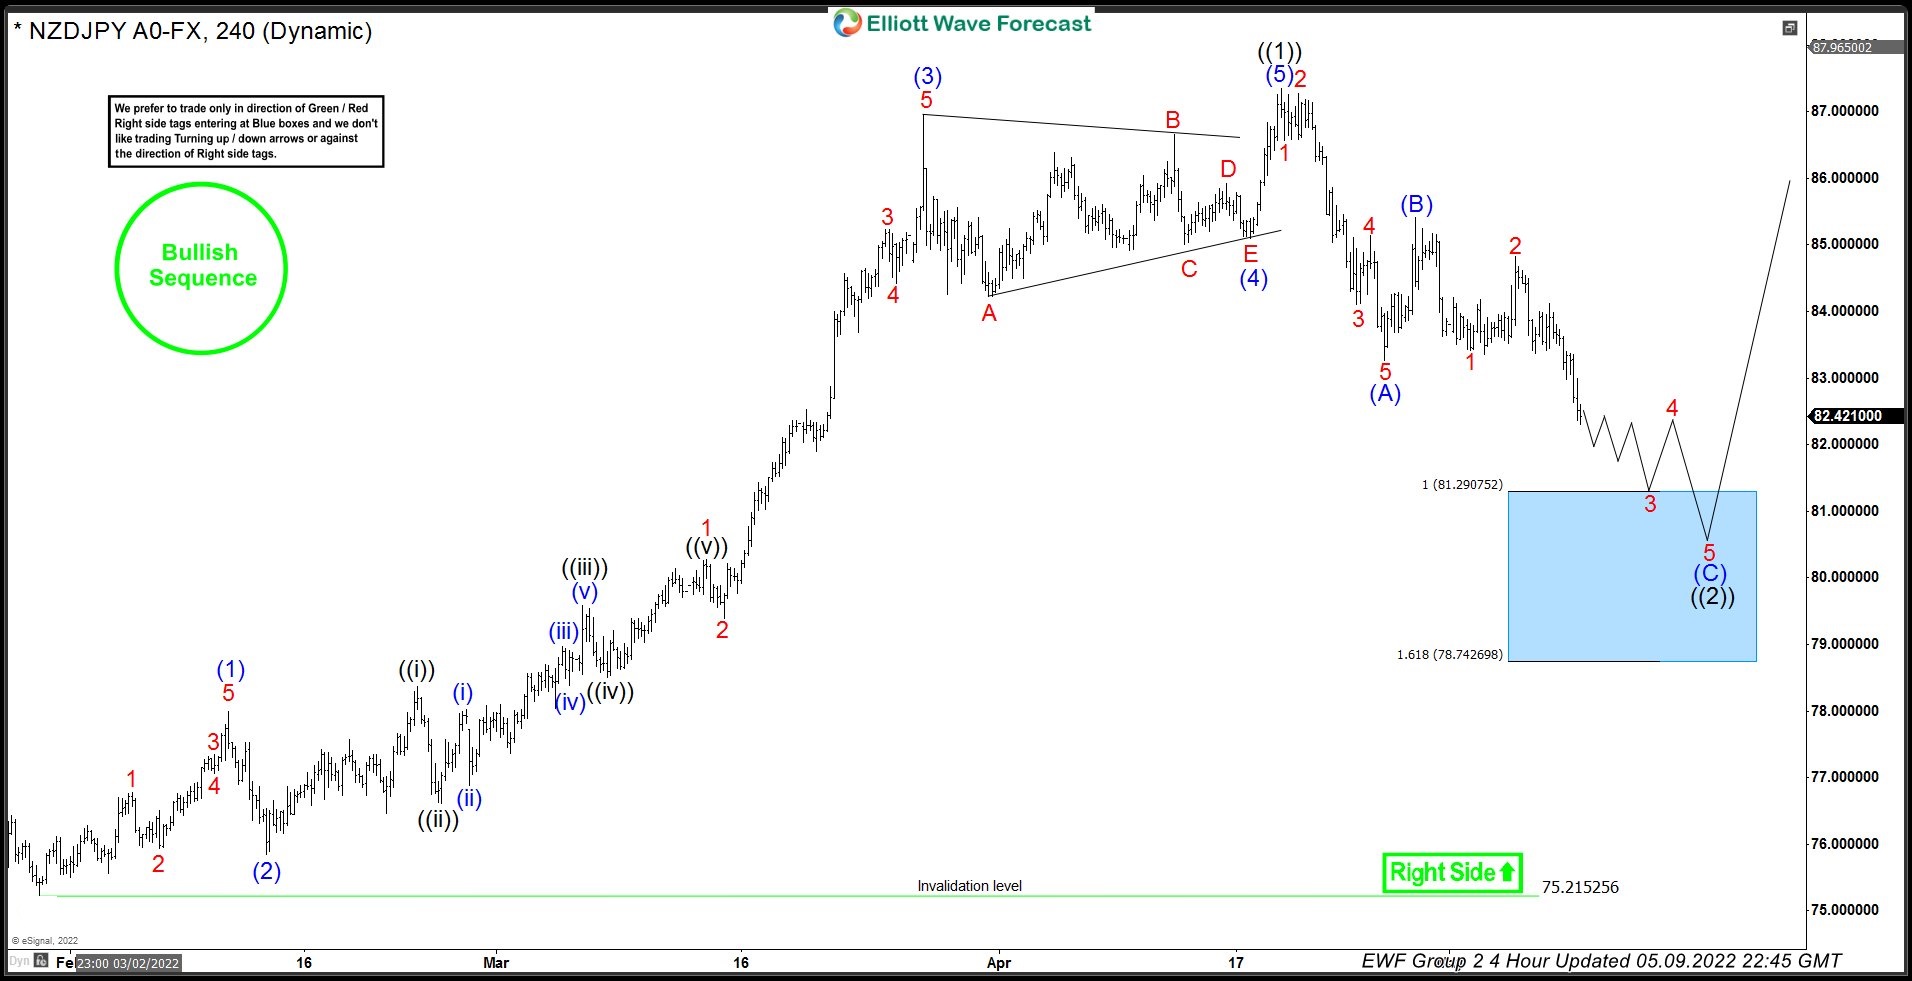
NZDJPY 9 May, 2022 4 Hour Elliott Wave Update
Current view suggests NZDJPY is doing black pull back against the 75.21 low. First leg from the peak was in 5 waves which has been labelled as wave (A). Bounce was corrective and completed as wave (B). We have already seen a new low below wave (A) which makes it an incomplete sequence against April 28, 2022 peak. Current view suggests (C) leg is in progress toward 81.29 – 78.74 area (highlighted with a blue box).
We don’t recommend selling the pair against the main bullish trend. Strategy is waiting for the price to reached marked blue box zone, before buying the pair again. As the main trend is bullish we expect buyers to appear at the blue box for 3 waves bounce at least. Once bounce reaches 50 Fibs against blue (B) high, we will make long position risk free by either moving stop loss to entry position or taking partial profits and putting stop on remaining position below the low within the blue box. Invalidation for the trade would be break of marked invalidation level at 78.74. As our members know, Blue Boxes are no enemy areas , giving us around 80% or a higher chance to get 3 waves bounce at least from the blue box.
NZDJPY 23 May, 2022 4 Hour Elliott Wave Update
Chart below shows NZDJPY made proposed leg down as we expected. The pair has found buyers at the Blue Box area and we are getting good reaction from there. Pull back completed at 79.45 low as a Zig Zag pattern. The rally from the blue box reached and exceeded 50 fibs against the (B) connector. Consequently, members who have taken the long trades at the blue box now enjoying profits in a risk free trades. Now we would need to see break of April 21st peak in order to confirm next leg up is in progress. Once the pair breaks April 20, 2022 high, the pair will become bullish again in near term and might offer some new buying opportunities in the short term dips against the 132.621 low. Until April 20, 2022 high doesn’t break, a double correction lower still can’t be ruled out in which case we would highlight the next blue box buying area for members.
Keep in mind that market is dynamic and presented view could have changed in the mean time. You can check most recent charts in the membership area of the site.
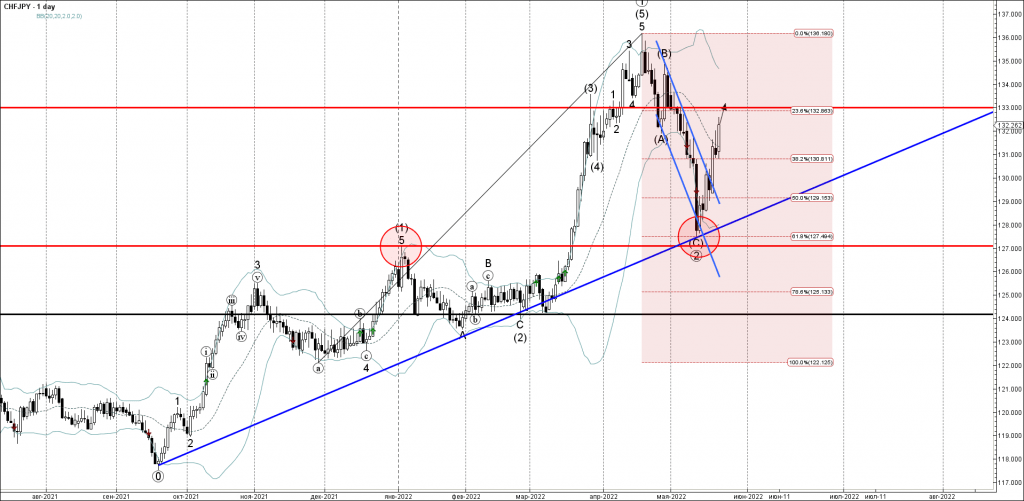
CHFJPY Wave Analysis
- CHFJPY broke daily up channel
- Likely to rise to resistance level 133.00
CHFJPY currency pair continues to rise after the pair broke through the resistance trendline of the daily up channel from the end of last month.
The breakout of this up channel accelerated the active impulse wave (1) which started earlier from the support zone lying between the key support level 127.00 (former multi-month high from January), the support trendline from September and the 61.8% Fibonacci retracement of the upward impulse from November.
Given the clear daily uptrend, CHFJPY currency pair can be expected to rise further toward the next resistance level 133.00.
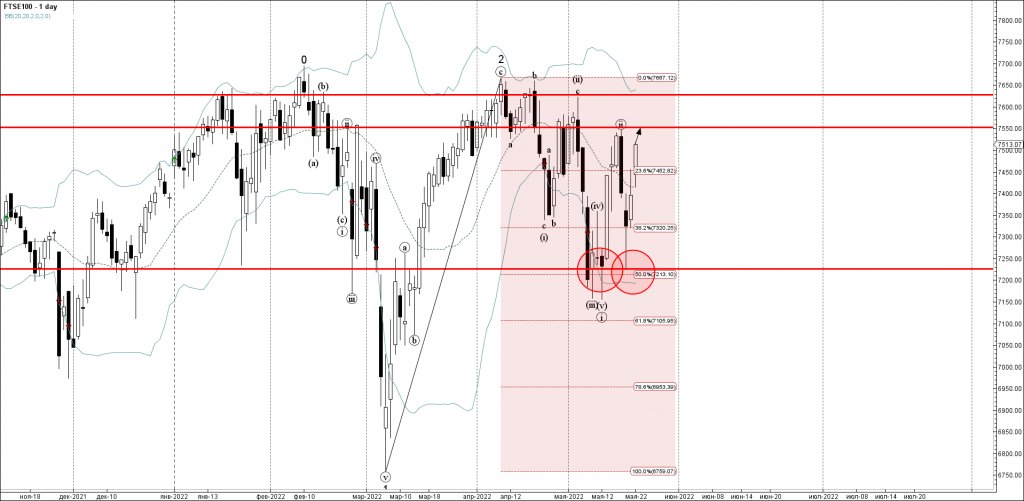
FTSE 100 Wave Analysis
- FTSE 100 reversed from support zone
- Likely to rise to resistance level 7550.00
FTSE 100 index recently reversed up from the support zone lying between the support level 7225.00, lower daily Bollinger Band and the 50% Fibonacci retracement of the upward correction 2 from March.
The upward reversal from this support zone stopped the previous downward impulse waves (iii) and 3.
FTSE 100 can be expected to rise further toward the next resistance level 7550.00 (top of the earlier minor correction (ii)).
Eco Data 5/24/22
[php_everywhere instance="1"]