

Sample Category Title
USD/JPY Approaches Key Support Ahead of US NFP
Key Highlights
- USD/JPY started a fresh decline from the 125.00 resistance zone.
- It traded below a major bullish trend line with support near 122.30 on the 4-hours chart.
- Crude oil price is struggling to gain pace above $108 and $110.
- The US nonfarm payrolls could increase 490K in March 2022, down from 678K.
USD/JPY Technical Analysis
The US Dollar started a fresh decline from the 125.09 high against the Japanese Yen. USD/JPY traded below the 123.50 support to enter a short-term bearish zone.
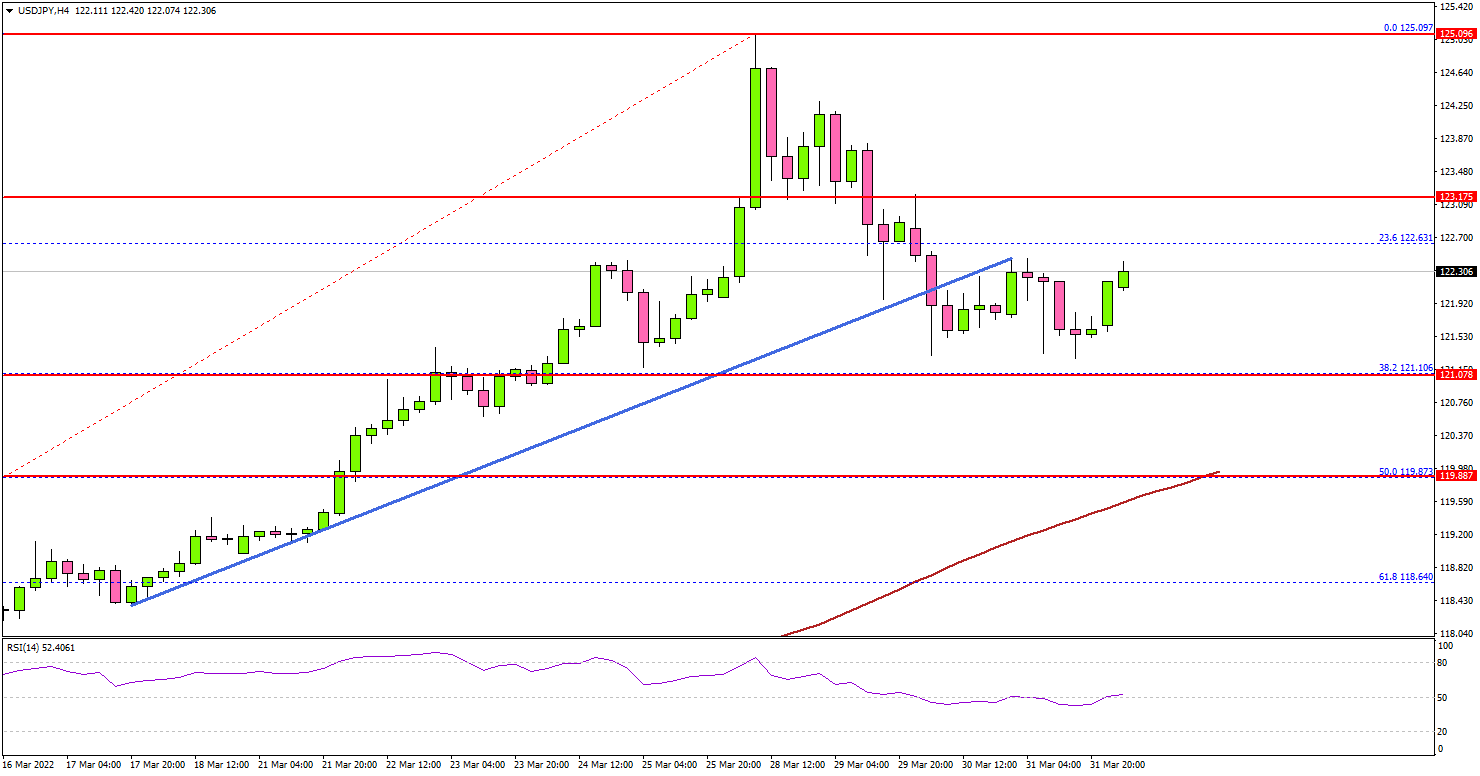
Looking at the 4-hours chart, the pair declined below the 1.2250 support zone. There was a move below the 23.6% Fib retracement level of the upward move from the 114.64 swing low to 125.09 high.
Besides, there was a break below a major bullish trend line with support near 122.30 on the same chart. However, the pair is still well above the 200 simple moving average (green, 4-hours) and the 100 simple moving average (red, 4-hours).
An initial support is near the 121.00 level. The main support is near the 120.00 level. It is near the 50% Fib retracement level of the upward move from the 114.64 swing low to 125.09 high.
A downside break below the 120.00 level might call for a sharp decline. The next major support sits near the 118.80 level, below which the pair could revisit 117.50.
On the upside, an immediate resistance is near the 122.20 level. The main resistance sits near the 122.60. A clear move above the 122.60 zone could set the pace for a move towards 123.50.
Looking at EUR/USD, the pair spiked above the 1.1120 resistance zone, but it struggled to clear the 1.1150 level. Besides, GBP/USD is still trading well below the 1.3200 resistance.
Economic Releases
- Germany’s Manufacturing PMI for March 2022 - Forecast 57.6, versus 57.6 previous.
- Euro Zone Manufacturing PMI March 2022 – Forecast 57.0, versus 57.0 previous.
- UK Manufacturing PMI for March 2022 – Forecast 55.5, versus 55.5 previous.
- US Manufacturing PMI for March 2022 – Forecast 58.5, versus 58.5 previous.
- US nonfarm payrolls for March 2022 – Forecast 490K, versus 678K previous.
- US Unemployment Rate for March 2022 - Forecast 3.7%, versus 3.8% previous.
Oil Report: Is this What Oil Traders Have Been Waiting For?
In the past days, WTI continued to trade lower basically reversing the ground it gained in the previous week. We are currently going through a very interesting time for the Oil market, with a number of fundamental and geopolitical subjects eyed and the price action creating opportunities for traders. In this report, we will provide a clear and direct overview of the main subjects moving Oil prices. Our closing will consist of WTI’s technical analysis in order to present a complete investigation.
Today, all eyes are on the OPEC and non-OPEC Meeting which is expected to stick to plans for a modest increase in oil output in May. The scenario of keeping the OPEC group’s production increase very mild is a continuation of the strategy it used through the pandemic to keep supply in check. OPEC+ has boosted output targets by 400,000 barrels per day (bpd) each month since August 2021 while from May 1, the monthly target increase will rise slightly to 432,000 bpd. At the same time, one of the major OPEC plus members, Vladimir Putin’s Russia is currently under fire with sanctions from many nations due to its ongoing war on Ukraine. Russia’s contribution to the Oil market has been significant and the latest sanctions seem to be making its Oil less attractive. This has led to a few Western Oil companies and oil tankers to suspend operations with Russian Oil producers. The consequences of these actions have resulted in a notable reduction in global Oil output. Lower output combined with the ongoing increase in Oil demand seems to be pushing fuel and good prices higher, sending inflation rates to record high levels. Thus, the pressure on the global market is intensified at the moment, with inflation data in the US, the Eurozone, the UK and Japan increasing substantially. Some of the largest economies are attempting to find a way around from this vicious circle created. Different media sources claim the United States could be soon announcing an immense release of up to 180 million barrels from its strategic petroleum reserve as a great effort to cool crude oil prices. Even though this move is very noteworthy, it may ease temporary pressures but not resolve the problem completely. In the meantime, the news may be forcing WTI prices lower.
On a different note, the Oil market data released in the past days from the United States, may have increased volatility for Oil prices. During the past Friday US active Oil rigs surged to 531, the highest since April 2020 according to the Baker Hughes. The surge in active Oil rigs tends to signal elevated demand for Oil. Moreover, in the past days the API and the EIA weekly data displayed drawdowns of -3M and -3.45M barrels accordingly. Drawdowns have traditionally sent Oil prices higher upon release, yet news of the US extracting barrels from its strategic petroleum reserve could be more important for the market currently.
In addition, another important factor for Oil traders to consider are the Chinese government’s strict coronavirus measures in the city of Shanghai. This province is China’s commercial capital and by some calculations the biggest city in the country thus lockdown measures can significantly reduce Oil demand. Overall, China remains the largest Oil consumer on a global scale and traders should keep an eye on headlines for further or relaxed measures, as they can move Oil prices.
Technical Analysis
WTI H4
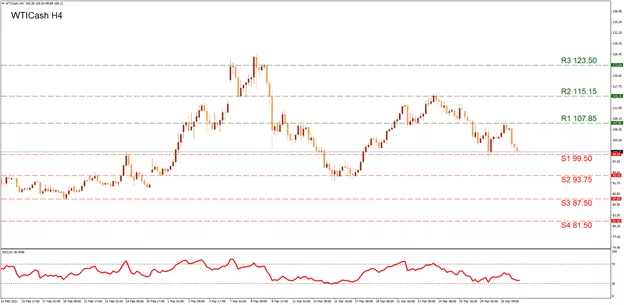
The most recent downward movement for WTI was formed since the 24th of March when the price action tested the currently noted (R2) 115.15 resistance. Yet with the selling in play the price action fell to test the (S1) 99.50 support and then proceeded to gain back some ground testing the (R1) 107.85 line. This may be evidence that the gray area between the (R2) 115.15 and the (S1) 99.50 on our chart, maybe crucial for understanding further price movement. In the scenario of an excessive bullish trend, we could see the (R3) 123.50 resistance, the multiyear high level becoming a target, once again. If the downward trend is extended in the following sessions and the price action falls below the (S1), we note the (S2) 93.75 which was tested on the 16th of March, as the most possible support. The next support level stands at the (S3) 87.50 which was used previously in February. In the scenario of a strong selling interest, we also note the (S4) 81.50 support level. The RSI indicator below our chart, is running across the 35-level providing evidence of the recent selling possibly stabilizing.
Elliott Wave View: Oil Looking for Further Pullback
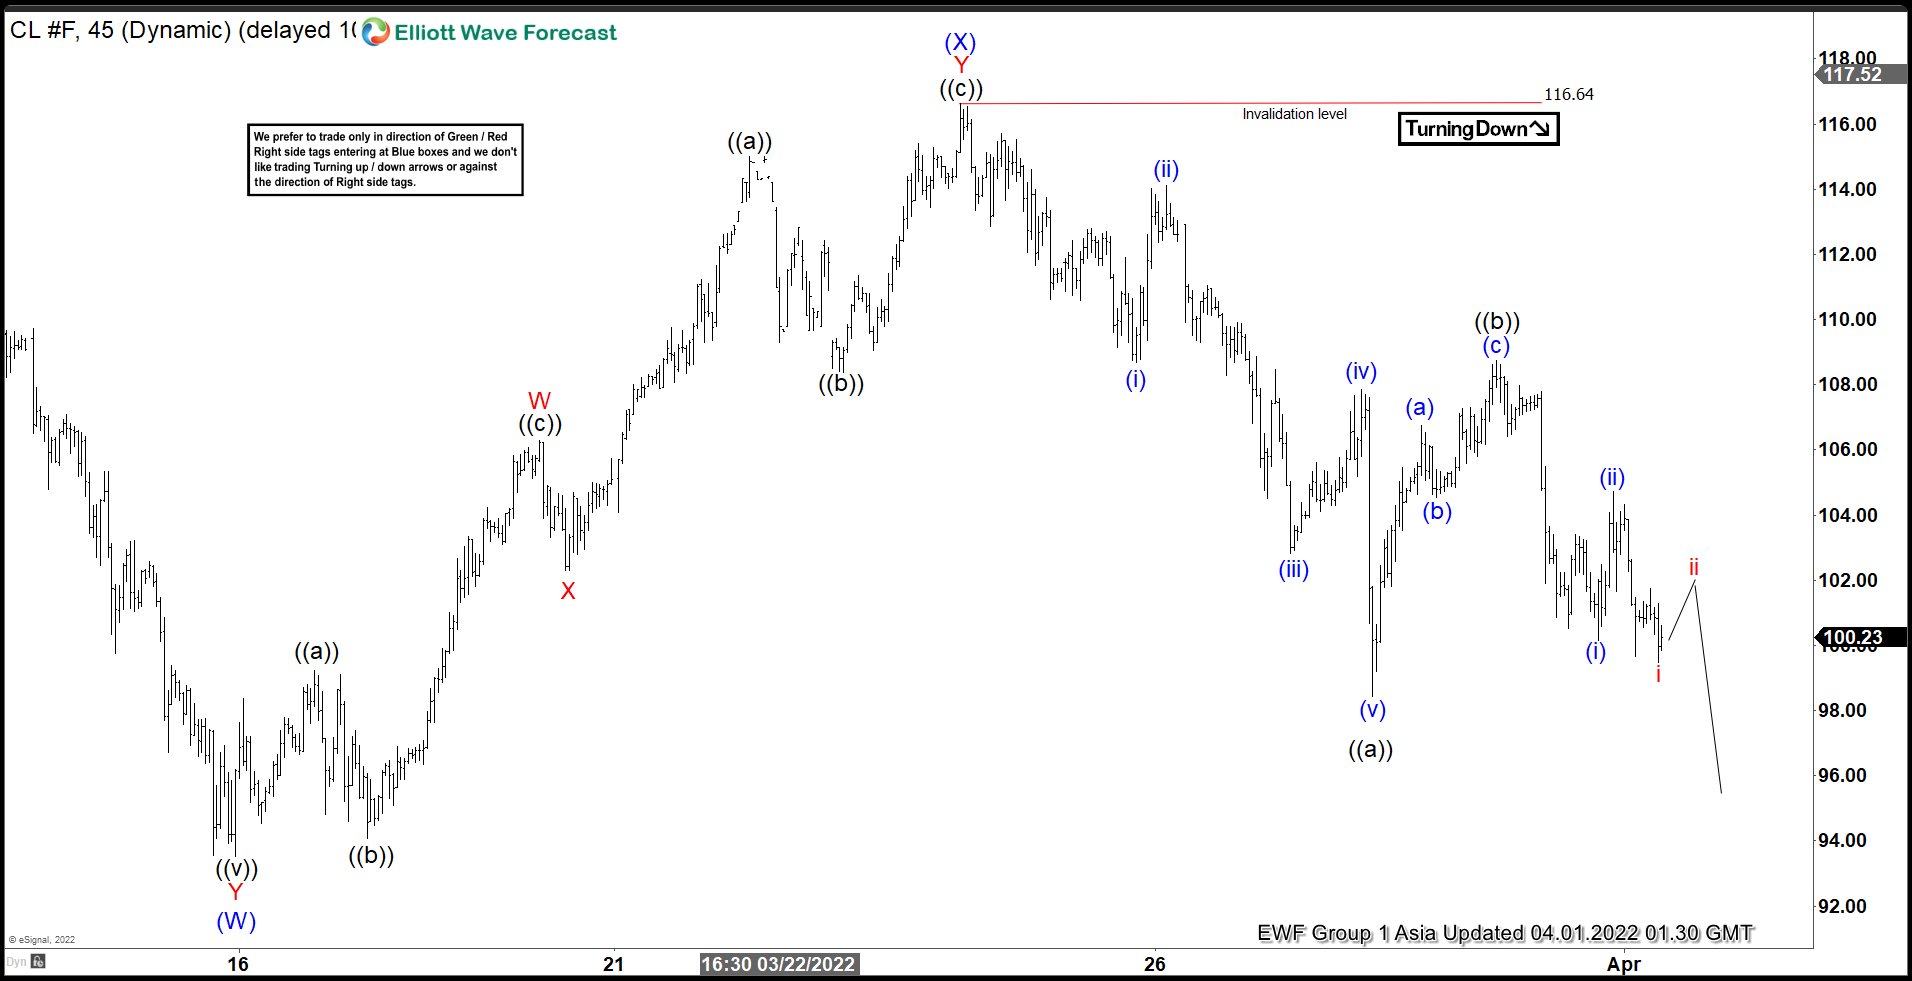
Short Term outlook in Oil suggests the decline from March 7, 2022 is unfolding as a double three Elliott Wave structure. Down from March 7 peak, wave (W) ended at 93.53 and rally in wave (X) ended at 116.64. Internal subdivision of wave (X) unfolded as a double three. Wave W ended at 106.28 and dips in wave X ended at 102.30. The commodity then resumes higher in wave Y towards 116.64 which completed wave (X). It has since turned lower in wave (Y) although a break below wave (W) at 93.53 is required to validate the view.
Down from wave (X), wave (i) ended at 108.68 and rally in wave (ii) ended at 114.12. Oil then resumes lower in wave (iii) towards 102.83, rally in wave (iv) ended at 107.84, and final leg lower wave (v) ended at 98.44 which completed wave ((a)). Correction in wave ((b)) is proposed complete at 108.75 with internal subdivision as a zigzag structure. Up from wave ((a)), wave (a) ended at 106.74, wave (b) ended at 104.55, and wave (c) ended at 108.75. Near term, while below 108.75, and more importantly below 116.64, expect further downside in Oil.
Oil 45 Minutes Elliott Wave Chart
Eco Data 4/1/22
[php_everywhere instance="1"]
Silver Wave Analysis
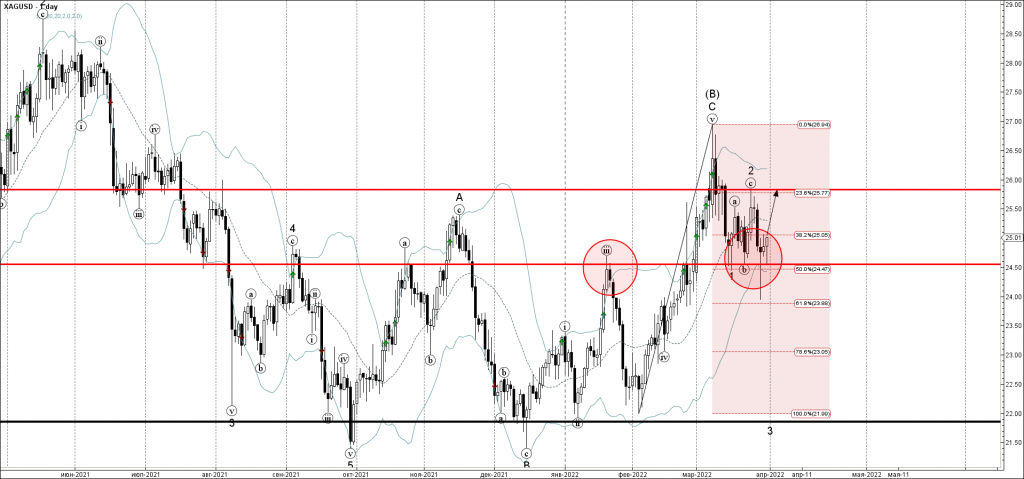
- Silver reversed from support level 24.50
- Likely to rise to resistance level 25.85
Silver recently reversed up with the daily Hammer from the strong support level 24.50 (the previous monthly high from January).
The support area near the support level 24.50 was strengthened by the lower daily Bollinger Band and the 50% Fibonacci retracement of the upward impulse from February.
Given the growing safe-haven demand – Silver can be expected to rise further toward the next resistance level 25.85 (top of the previous correction 2).
EURGBP Wave Analysis
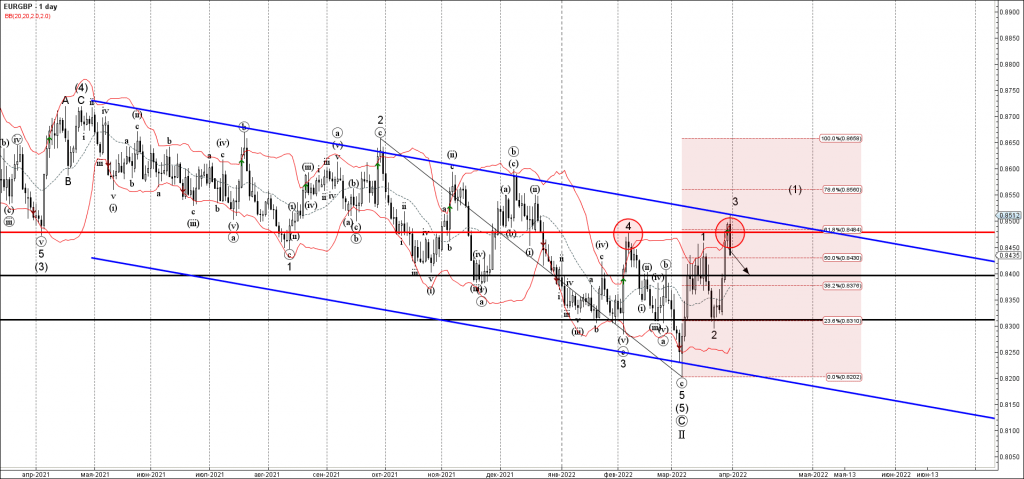
- EURGBP reversed from resistance level 0.8480
- Likely to fall to support level 0.8400
EURGBP currency pair recently reversed down sharply from the strong resistance level 0.8480 (the previous monthly high from February).
The resistance area near the resistance level 0.8480 was strengthened by the upper daily Bollinger Band, the daily down channel from May, and by the 61.8% Fibonacci correction of the downward impulse from September.
Given the strongly bearish euro sentiment – EURGBP can be expected to fall further toward the next support level 0.8400.
EURUSD Wave Analysis
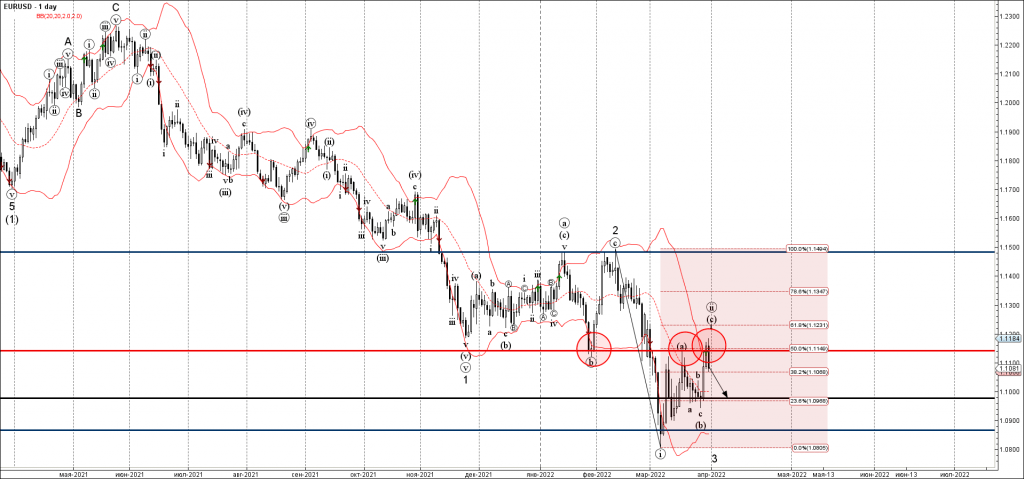
- EURUSD reversed from resistance level 1.1140
- Likely to fall to support level 1.1000
EURUSD currency pair recently reversed down sharply from the key resistance level 1.1140 (former strong support from January).
The resistance area near the resistance level 1.1140 was strengthened by the upper daily Bollinger Band and by the 50% Fibonacci correction of the downward impulse from February.
Given the clear downtrend – EURUSD can be expected to fall further toward the next support level 1.1000 (which stopped the previous waves a and (b)).
Healthy Jobs and Income US Data Helps USD, But Not S&P500
American households increased spending by 0.2% in February, compared with a 0.5% rise in income. But this data only looks optimistic at first glance. Americans saved 6.3% of disposable income compared to 6.1% in January. In other words, we are seeing a stabilisation at levels that last occurred 12 years ago.
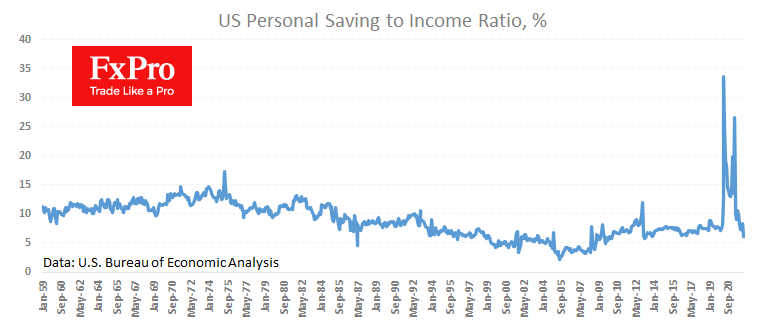
The decline in the propensity to save can easily be explained by higher inflation, just like in the first decade of the 21st century. While people largely ignore inflation of 2%, a 7% price increase burns up the value of money stored under the mattress rather quickly.
Inflation is also a significant incentive to return to the labour market searching for work. An indirect confirmation of this is the weekly jobless claims data. Initial claims rose from 188K the week before to 202K. But the number of continued claims has dipped to 1.307M, last seen at the end of 1969.
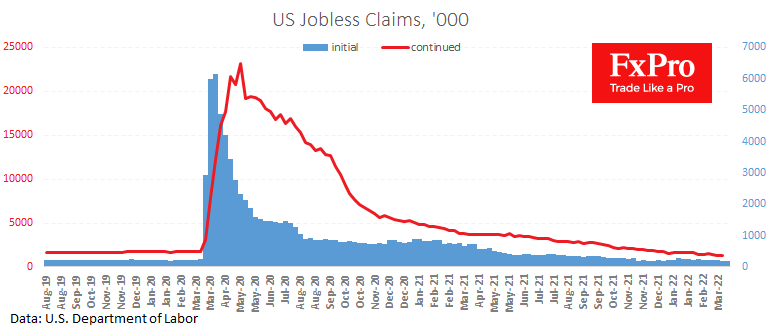
The published data is good for the Dollar as it sets the stage for a more aggressive policy tightening from the Fed. But the statistics are neutral for the stock market, where participants take the strong labour market as carte blanche for the FOMC to put more pressure on the policy tightening pedal.
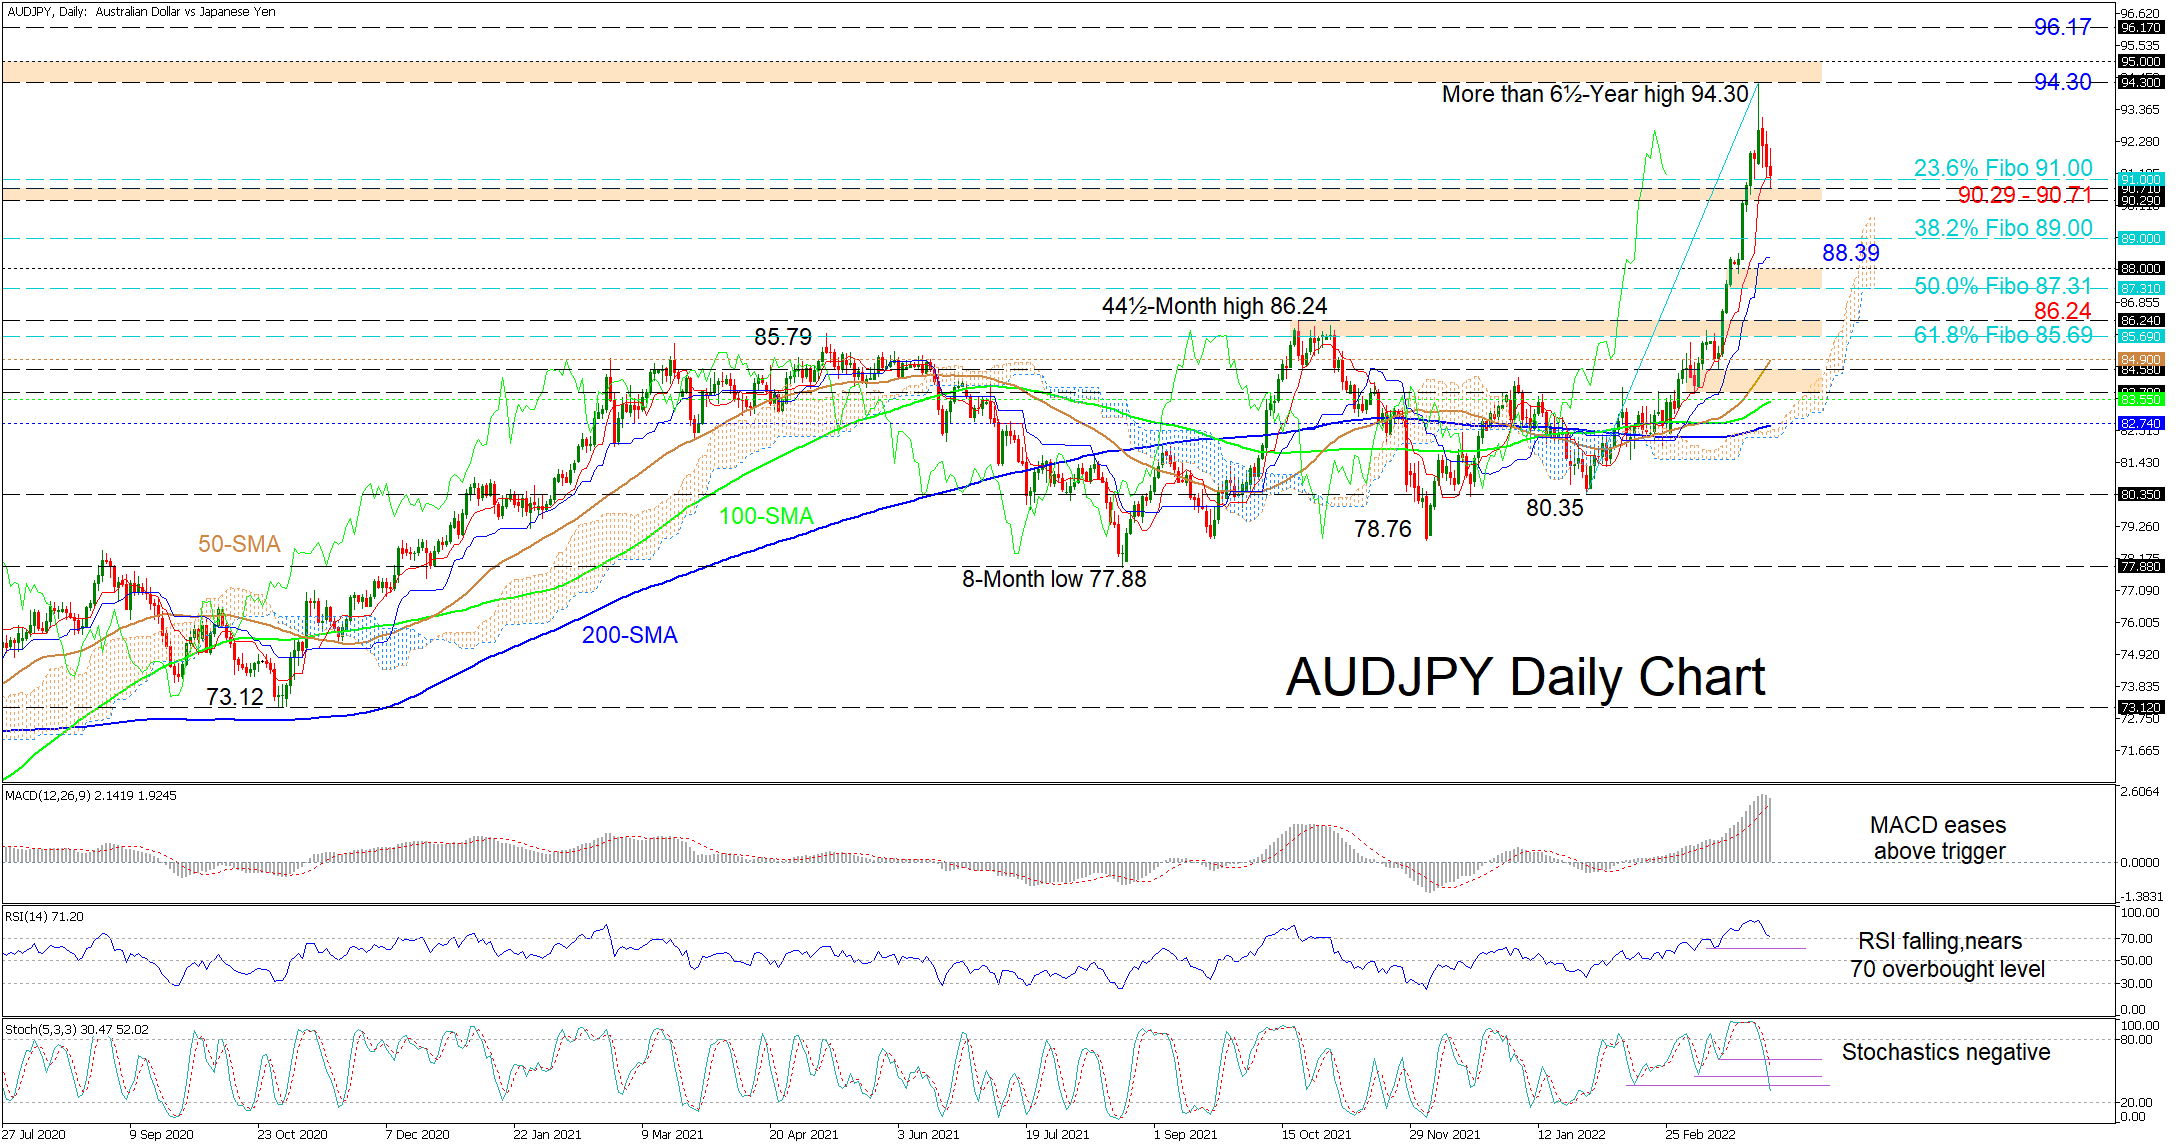
AUDJPY Retreats from 6½-Year High; Upside Risks Linger
AUDJPY’s latest pullback from the fresh multi-year peak is resting on the red Tenkan-sen line around the 91.00 price level, which is the 23.6% Fibonacci retracement of the up leg from 80.35 until the more than 6½-year high of 94.30. The positive incline in the slopes of the simple moving averages (SMAs) have yet to signal any serious damage to the bullish bearing in the pair.
Currently, the Ichimoku lines indicate a decrease in the potency of positive forces, while the short-term oscillators confirm that recent negative momentum continues to strengthen. The MACD is very far in the positive region but is rolling over towards its red trigger line, while the diving RSI is confronting the 70 overbought level. Furthermore, the negatively charged stochastic oscillator is promoting a more profound retracement in the pair.
Presently the 23.6% Fibo at 91.00 along with the 90.29-90.71 support band are denying negative moves from gaining pace. However, if the latter, which is formed by the December 2015 and September 2017 rally peaks, fails to mute negative pressures, the price may then aim for the 38.2% Fibo at 89.00. If sellers remain in the driver’s seat, the blue Kijun-sen line at 88.39 could come under attack prior to the bears testing the support zone between the 88.00 handle and the 50.0% Fibo of 87.31. Surrendering extra ground, the pair may then seek out the support border existing between the 86.24 inside swing high and the 61.8% Fibo of 85.69.
If buyers create positive traction from the 90.29-90.71 support and the 23.6% Fibo’s vicinity, the bulls may try to revisit the more than 6½-year high of 94.30, which is the lower boundary of a resistance zone extending higher until the 95.00 handle. Should buyers overcome this obstacle that stretches back to June 2015, they may then target the 96.17 high.
Summarizing, AUDJPY is sustaining a bullish tone above the 90.29-90.71 support and the 23.6% Fibo of 91.00. A significant drop in the price below the October 2021 high of 86.24 may spark concerns about growing negative pressures.
Sunset Market Commentary
Markets
ECB chief economist Lane spent most of today’s speech in Paris reminiscing on the ECB’s “successful” monetary policy response to the pandemic. He took the opportunity as net asset purchases under the Pandemic Emergency Purchase Programme officially end after today. The ECB will have bought over €1.7tn out of its €1.85tn PEPP-portfolio. This compares with around €3.2tn cumulative asset purchases under the APP-umbrella, accumulated since the end of 2014. Turning to recent developments, Lane points out that current high inflation rates reflect to a large extent a very substantial surge in energy prices and global bottlenecks for manufactured goods. Both factors, conditional on the appropriate conduct of monetary policy, should not be a source of persistent inflation. “Transitory” echoed throughout his speech. The chief economist thinks it is plausible that medium-term inflation will not revert to the pre-pandemic below-target equilibrium but rather may stabilise around the ECB’s 2% target. The ECB will nevertheless closely monitor them and make sure that high spot inflation rates won’t become entrenched in higher inflation expectations. It’s part of his two-sided guidance going forward. On the one hand, the ECB should ensure that policy settings are adjusted if de-anchored inflation expectations, an intensification in catch-up wage dynamics or a persistent deterioration in supply capacity threaten to keep inflation above target. On the other side, they should also be fully prepared to appropriately revise monetary policy settings if the energy price shock and the Russia-Ukraine war were to result in a significant deterioration in macroeconomic prospects and thereby weaken the inflation outlook. Lane, like ECB president Lagarde yesterday, attached more attention to the downside growth risks stemming from the war compared to the tone of the March 10 policy meeting.
Lane’s speech wasn’t directly responsible for today’s market moves, but added to the mood. Core bonds recovered from the fierce sell-off recently. Bunds (-5.9 bps) outperformed US Treasuries (-1.6 bps). The move started from the European bell in a reaction function which we’ve already seen on Tuesday: significantly lower oil prices dampen inflation expectations and thus the need for central banks to act even more aggressively than already priced. Today’s drop in crude prices came in response to rumours that the US will release around 1/3rd of its Strategic Petroleum Reserves in coming months. Stocks and EUR/USD (loss of interest rate support) drifted south in a move which slightly accelerated ahead of the US opening bell after Russian President Putin warned to halt gas contracts if payers don’t pay rubles. Main European indices lose up to 0.5%. EUR/USD drifted back below the 1.11 big figure. EUR/CZK fluctuates around 24.40 after the CNB raised its policy rate by 50 bps, to 5% in a 5-2 vote. Significant inflationary risks remain around the forecast with a need to keep policy tighter for a longer time.
News Headlines
According to the UK Nationwide Building Society, annual housing growth in the UK in march increased from 12.6% Y/Y to 14.3%. This marks the fastest annual pace since 2004. Prices increased 1.1% M/M. The latter was the eight consecutive monthly increase (on a seasonally adjusted basis). The report concludes that the average price of a property reached a record level of £265 312. According to Nationwide’s Chief Economist ‘the continued buoyancy of housing demand may in part be explained by strong labour market conditions. The significant savings accrued during lockdowns is also likely to have helped prospective homebuyers raise a deposit’. The society estimates that households accrued the equivalent of around £6500 deposits above the pre-pandemic trend since early 2020. In the coming quarters, NBS expects the housing market to slow down.
The Norges Bank announced that it will buy the countervalue of NOK 2bn/day in FX on behalf of the government in April. The Norwegian government receives revenues in NOK and FX from petroleum activities. Some revenues are used to finance the government deficit. The remainder is saved in FX in the Government Pension Fund Global. The amount of FX the NB announced today was bigger than expected. The NOK weakened from EUR/NOK 9.56 to 9.70.