Sample Category Title
USD/JPY Daily Outlook
Daily Pivots: (S1) 121.03; (P) 122.12; (R1) 122.92; More...
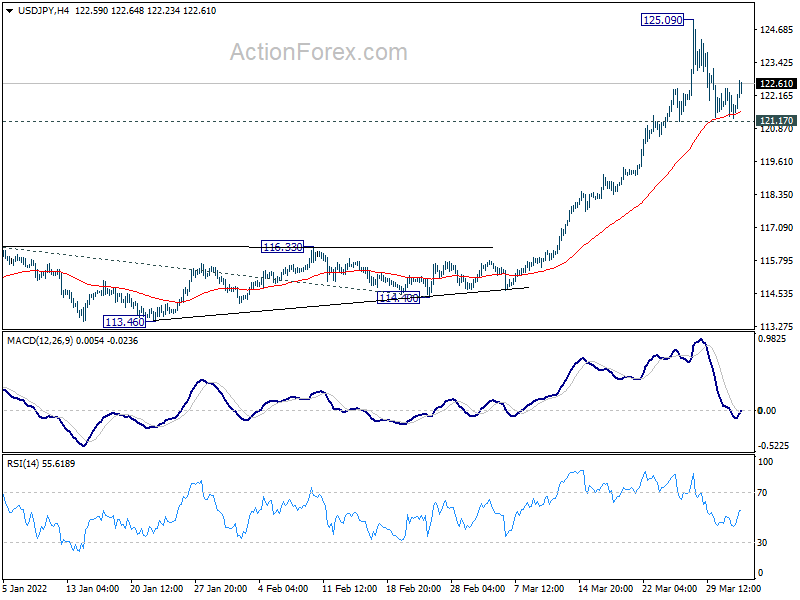
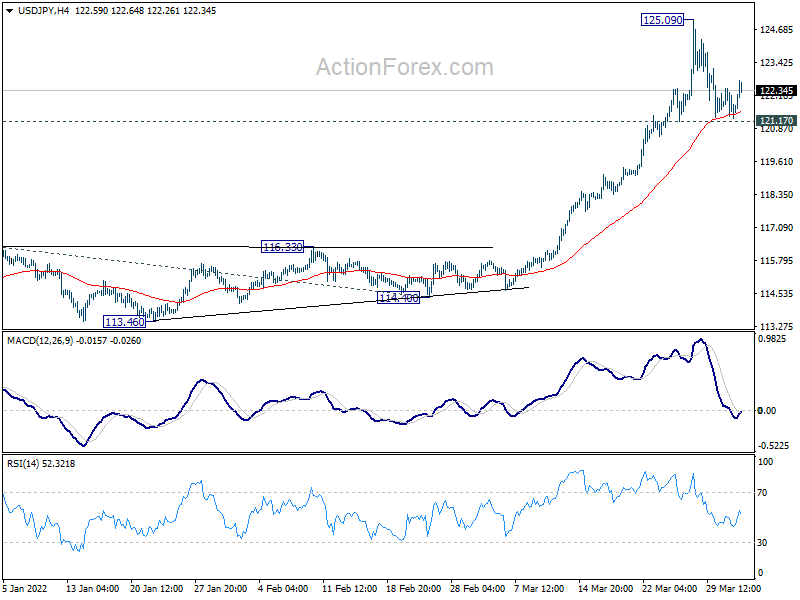
Intraday bias in USD/JPY remains neutral at this point. Further rally is still in favor with 121.17 minor support intact. On the upside, above 125.09 will target 161.8% projection of 109.11 to 116.34 from 114.40 at 126.09, which is close to 125.85 long term resistance. However, break of 121.17 will indicate short term topping, and bring deeper pull back.
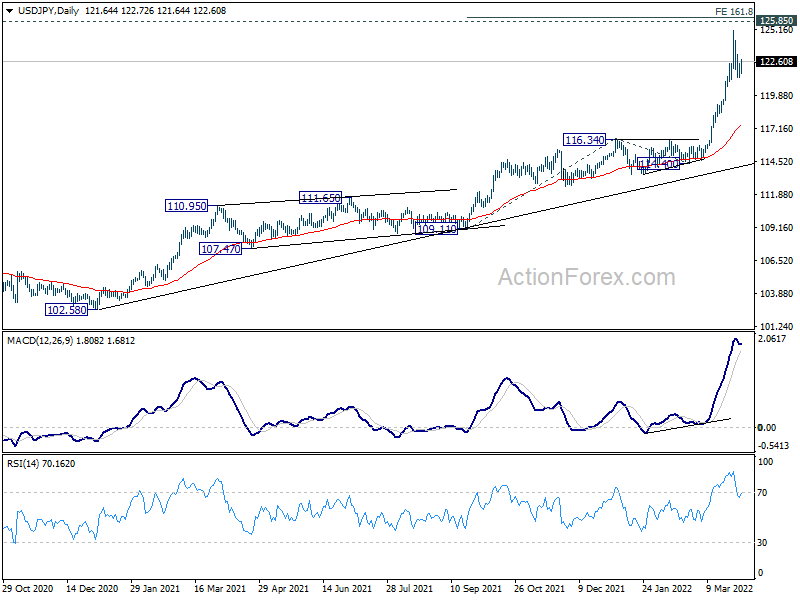
In the bigger picture, up trend from 98.97 (2016 low) in in progress for retesting 125.85 (2015 high). Sustained break there will confirm long term up trend resumption. Next target will be 61.8% projection of 75.56 (2011 low) to 125.85 (2015 high) from 98.97 at 130.04. This will now remain the favored case as long as 116.34 resistance turned support holds.
USD/CHF Daily Outlook
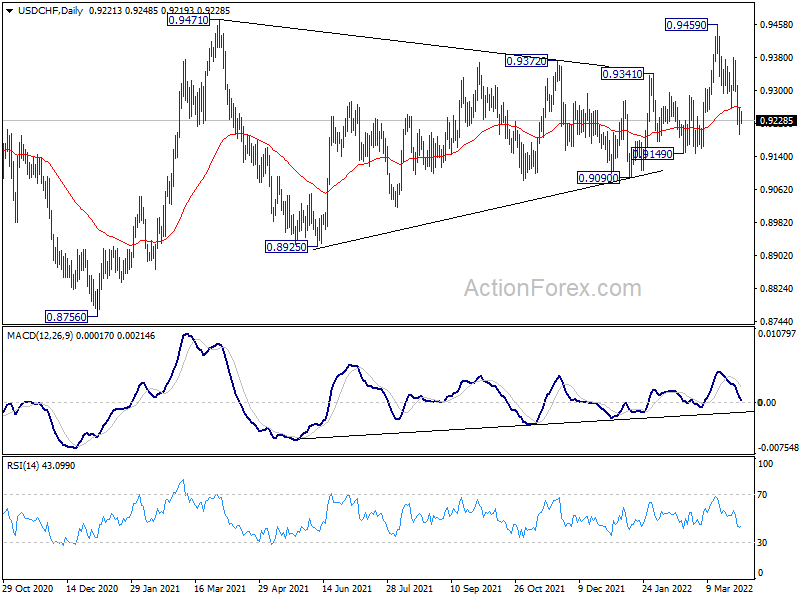
Daily Pivots: (S1) 0.9194; (P) 0.9226; (R1) 0.9258; More....
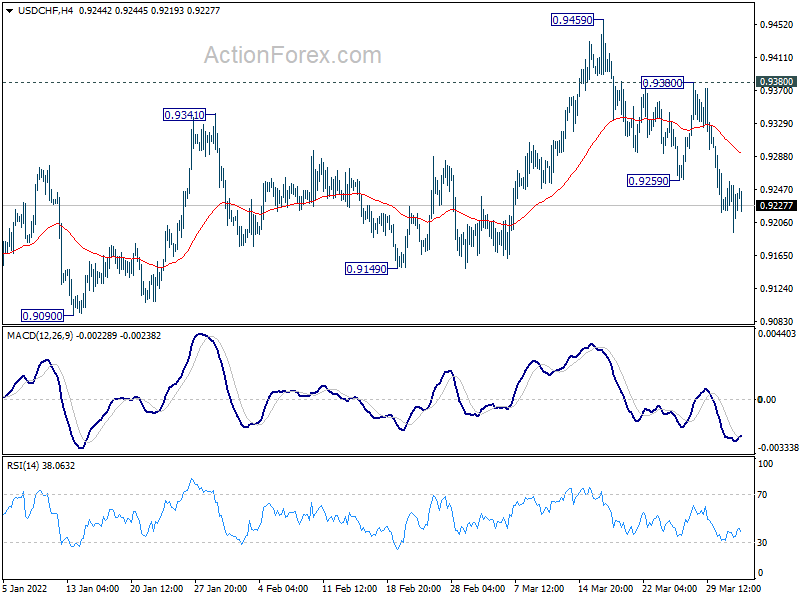
Intraday bias in USD/CHF remains on the downside at this point. Fall from 0.9459 is in progress for 0.9149 support. Firm break there will turn near term outlook bearish for 0.9090 support and below. On the upside, above 0.9380 resistance will flip bias back to the upside for 0.9459 resistance instead.
In the bigger picture, medium term outlook will be neutral at best as long as 0.9471 resistance holds. Larger down trend could still extend through 0.8756 (2021 low). However, firm break of 0.9471 will argue that whole down trend form 1.0342 (2016 high), has completed with waves down to 0.8756. A medium term up trend should be set up to target 1.0237/0342 resistance zone.
GBP/USD Daily Outlook
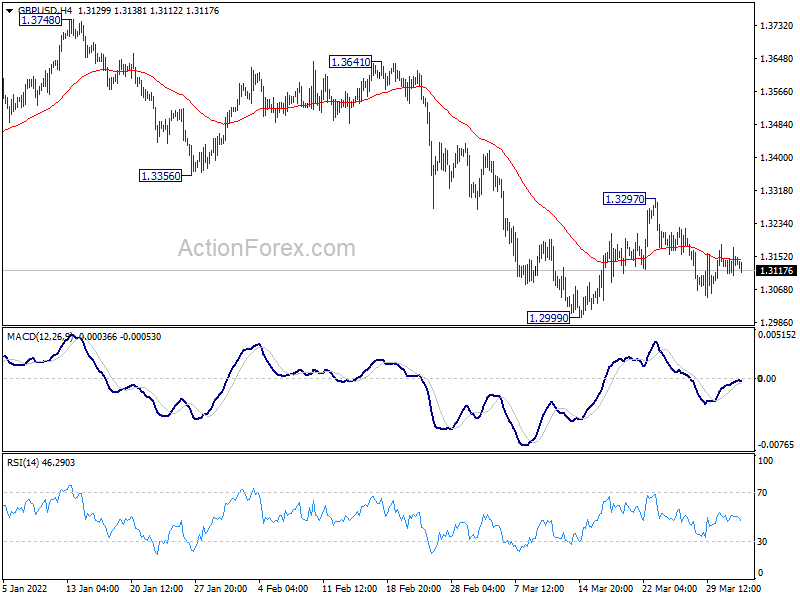
Daily Pivots: (S1) 1.3085; (P) 1.3134; (R1) 1.3185; More...
Intraday bias in GBP/USD remains neutral for the moment. Outlook remains bearish with 1.3297 resistance intact, and further decline is expected. On the downside, break of 1.2999 low will resume larger down trend from 1.4248. However, firm break of 1.3297 will turn bias back to the upside for stronger rebound.
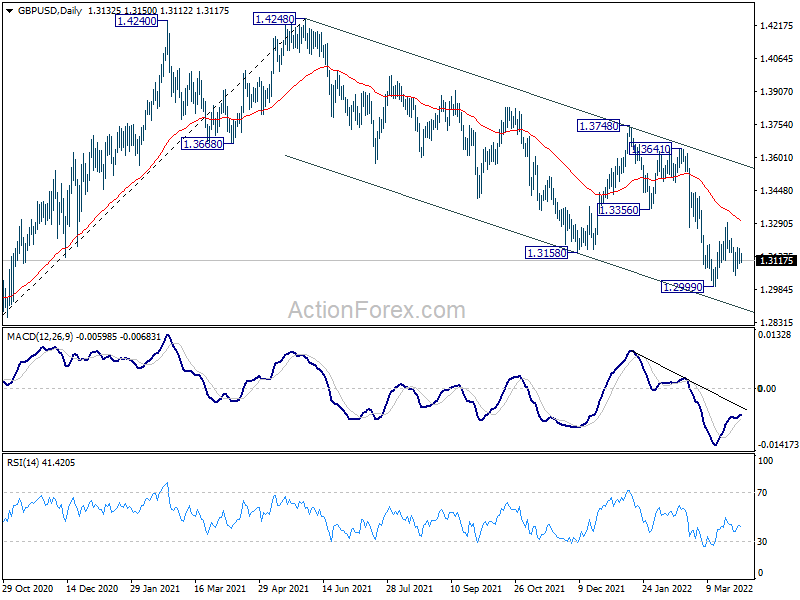
In the bigger picture, current development suggests that the up trend from 1.1409 (2020 low) has completed at 1.4248. Decline from 1.4248 could still be a corrective move, or it could be the start of a long term down trend. In either case, deeper decline would be seen back to 61.8% retracement of 2.1161 to 1.1409 at 1.2493. In any case, break of 1.3748 resistance is needed to indicate medium term bottoming, or outlook will stay bearish.
EUR/USD Daily Outlook
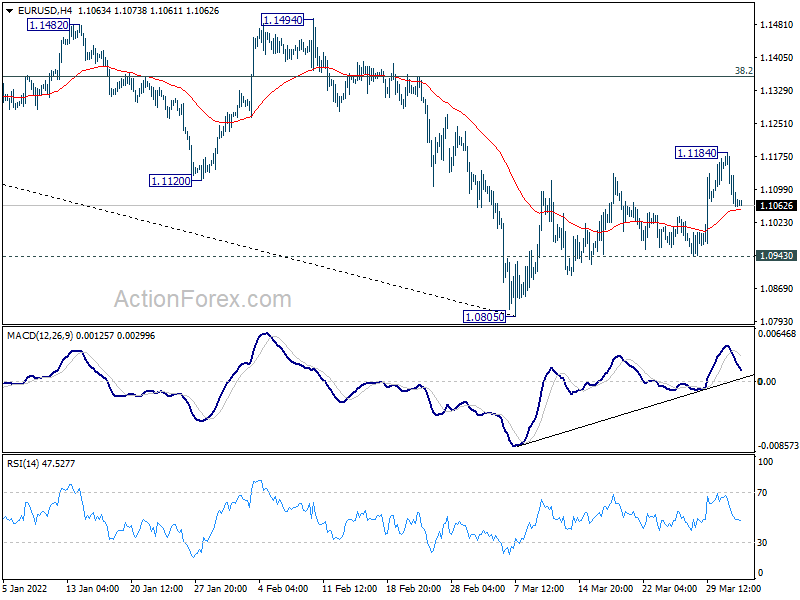
Daily Pivots: (S1) 1.1024; (P) 1.1104 (R1) 1.1148; More...
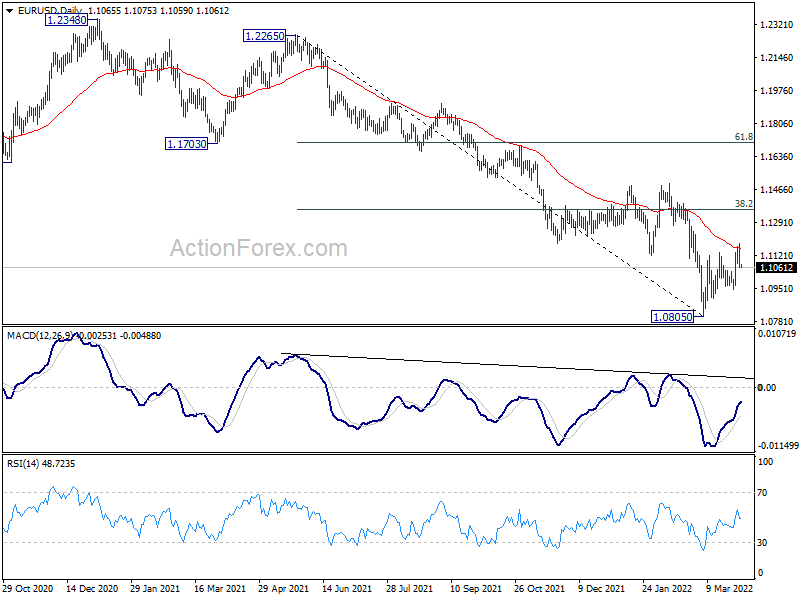
Intraday bias in EUR/USD remains neutral at this point, but further rally is mildly in favor as long as 1.0943 support holds. Break of 1.1184 will resume the rebound from 1.0805 to 38.2% retracement of 1.2265 to 1.0805 at 1.1363. However, break of 1.0943 will revive near term bearishness and bring retest of 1.0805 low first.
In the bigger picture, the decline from 1.2348 (2021 high) is expected to continue as long as 1.1494 resistance holds. Firm break of 1.0635 (2020 low) will raise the chance of long term down trend resumption and target a retest on 1.0339 (2017 low) next. Nevertheless, break of 1.1494 will maintain medium term neutral outlook, and extending term range trading first.
Focus Turns to Eurozone CPI and US Non-Farm Payrolls
The forex markets are rather steady in Asian session today. Focuses will turn to Eurozone CPI flash and US non-farm payrolls employment. Euro is so far still the strongest one for the week, but it will need some inspiration from inflation data to give it another lift. Dollar will particularly look into wage growth data to solidify Fed hike expectations. But the net movement will eventually depend on the overall risk sentiment.
Technically, USD/JPY recovers just ahead of 121.17 minor support, after drawing support from 4 hour 55 EMA too. The development is keeping corrective pattern from 125.09 brief. That is, another rise through 125.09 should come sooner rather than later. However, firm break of 121.17 will indicate that it's already in a deeper near term correction. Reactions to NFP report today would reveal which case it is.
In Asia, Nikkei closed down -0.49%. Hong Kong HSI is down -0.92%. China Shanghai SSE is up 0.78%. Singapore Strait Times is up 0.31%. Japan 10-year JGB yield is up 0.0020 at 0.218. Overnight, DOW dropped -1.56%. S&P 500 dropped -1.57%. NASDAQ dropped -1.54%. 10-year yield dropped -0.031 to 2.327.
China Caixin PMI manufacturing dropped to 48.1, fastest contraction in two years
China Caixin PMI Manufacturing dropped from 50.4 to 48.1 in March, below expectation of 49.7. The pace of contraction was quickest since February 2020. Caixin said production fell at quickest rate for just over two years amid tighter pandemic restrictions. Total new work and foreign demand had steep declines. Suppliers' delivery times worsened while cost pressures intensified.
Wang Zhe, Senior Economist at Caixin Insight Group said: "Overall, impacted by factors including the Covid-19 outbreaks in multiple parts of China, manufacturing activity largely weakened in March. Supply contracted. Demand was also under pressure, and external demand worsened. The job market was more or less stable. Inflationary pressure continued to rise. And market optimism weakened."
Japan PMI manufacturing finalized at 54.1, improvement in operation but subdued international markets
Japan PMI Manufacturing was finalized at 54.1 in March, up from February's 52.7. Markit said there was renewed rise in output and stronger new order growth. But export orders had sharpest fall for 20 months. Stocks of raw materials had record rise amid higher prices and delays.
Usamah Bhatti, Economist at S&P Global, said:
"The Japanese manufacturing sector saw an improvement in operating conditions at the end of the first quarter of 2022... new order inflows saw a quickening in growth... international markets were subdued, following the reintroduction of strict restrictions across parts of China and the outbreak of war between Russia and Ukraine. As a result, new export orders fell at the sharpest rate since July 2020....
"Beyond the immediate future, firms remained confident about the year-ahead outlook for output, though the downside risks led to the softest degree of optimism for seven months. This is in line with current estimates for industrial production to rise 3.7% in 2022, meaning that output lost to the pandemic is unlikely to be recovered until 2023."
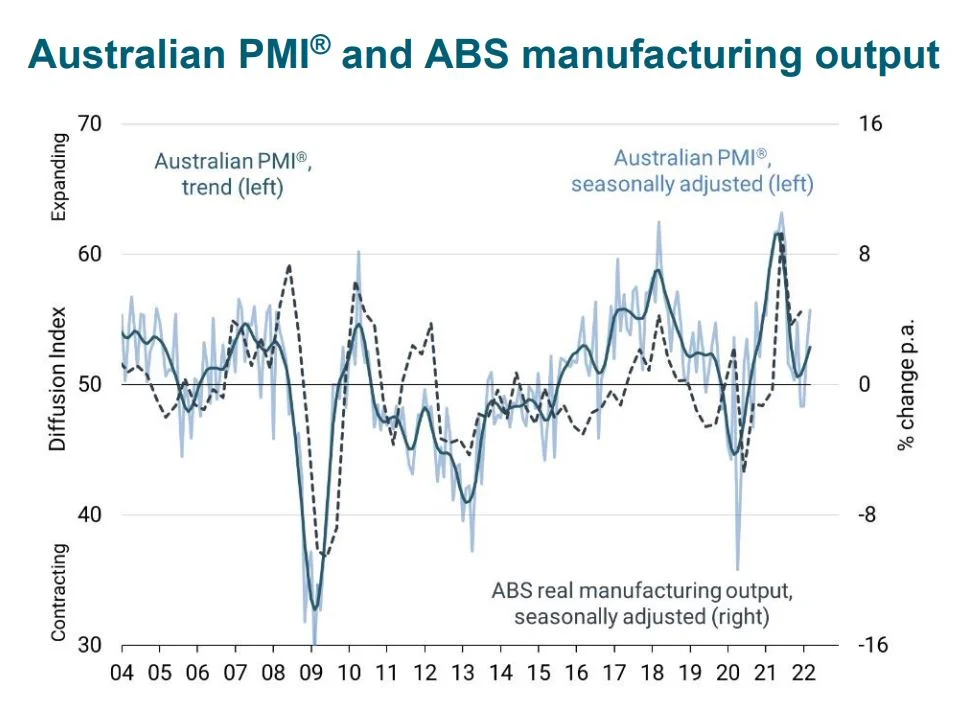
Australia AiG manufacturing rose to 55.7, price pressures stepped up
Australia AiG Performance of Manufacturing Index rose from 53.2 to 55.7 in March. Looking at some details, production dropped -1.2 to 53.4. Employment rose 9l9 to 53.4. New orders rose 5.2 to 65.0. Input prices rose 6.8 to 82.4. Selling prices rose 0.4 to 72.0. Average wages rose 1.7 to 66.6.
Innes Willox, Chief Executive of Ai Group said: "The Australian manufacturing sector grew faster in March as manufacturers added new staff, lifted sales and continued to expand production (although at a slower pace than in February)... Across manufacturing pressures from wages and input prices stepped up while selling prices growth saw manufacturers recover some cost increases in the market. There was an encouraging rise in new orders in March although with labour and input supply constraints growing, manufacturers will be stretched to fill orders in a timely way."
US NFP unlikely to alter Fed hike
US non-farm payrolls report is expected to show 488k job growth in March. Unemployment rate is expected to tick down further from 3.8% to 3.7%. Average hourly earnings are expected to return to growth at 0.4% mom.
Looking at related data, ADP report showed 455k private job growth in the same month, which was strong. Four-week moving average of initial jobless claims dropped notably from 208.5k to 230.5k. The employment data from ISM indexes are not available yet.
Markets are pricing in more than 70% chance of a 50bps rate hike by Fed in May. Even a moderate miss in the headline NFP number is not going to alter such expectations much. On the other hand, solid wages growth would leave less room for the Fed doves to argue for a small hike.
Some previews on NFP:
- US Non-Farm Payrolls Preview – Another Huge Month of Job Gains Expected
- NFP Preview: Will Jobs Report Tip the Scales on Fed's Decision Next Month?
- NFP and PCE Inflation to Support Hawkish Fed Bets as Dollar Stands Tall
Elsewhere
Swiss CPI and PMI manufacturing, Eurozone PMI manufacturing final and CPI flash, UK PMI manufacturing final will be featured in European session. Later in the day, US will release non-farm payrolls, ISM manufacturing and construction spending.
EUR/USD Daily Outlook
Daily Pivots: (S1) 1.1024; (P) 1.1104 (R1) 1.1148; More...
Intraday bias in EUR/USD remains neutral at this point, but further rally is mildly in favor as long as 1.0943 support holds. Break of 1.1184 will resume the rebound from 1.0805 to 38.2% retracement of 1.2265 to 1.0805 at 1.1363. However, break of 1.0943 will revive near term bearishness and bring retest of 1.0805 low first.
In the bigger picture, the decline from 1.2348 (2021 high) is expected to continue as long as 1.1494 resistance holds. Firm break of 1.0635 (2020 low) will raise the chance of long term down trend resumption and target a retest on 1.0339 (2017 low) next. Nevertheless, break of 1.1494 will maintain medium term neutral outlook, and extending term range trading first.
Economic Indicators Update
| GMT | Ccy | Events | Actual | Forecast | Previous | Revised |
|---|---|---|---|---|---|---|
| 21:30 | AUD | AiG Performance of Mfg Index Mar | 55.7 | 53.2 | ||
| 23:50 | JPY | Tankan Large Manufacturing Index Q1 | 14 | 12 | 18 | |
| 23:50 | JPY | Tankan Large Manufacturing Outlook Q1 | 9 | 10 | 13 | |
| 23:50 | JPY | Tankan Non - Manufacturing Index Q1 | 9 | 5 | 9 | |
| 23:50 | JPY | Tankan Non - Manufacturing Outlook Q1 | -10 | 8 | 8 | |
| 23:50 | JPY | Tankan Large All Industry Capex Q1 | 2.20% | 4.40% | 9.30% | |
| 00:30 | JPY | Manufacturing PMI Mar F | 54.1 | 53.2 | 53.2 | |
| 01:45 | CNY | Caixin Manufacturing PMI Mar | 48.1 | 49.7 | 50.4 | |
| 06:30 | CHF | CPI M/M Mar | 0.50% | 0.70% | ||
| 06:30 | CHF | CPI Y/Y Mar | 2.40% | 2.20% | ||
| 07:30 | CHF | SVME PMI Mar | 61 | 62.6 | ||
| 07:45 | EUR | Italy Manufacturing PMI Mar | 57 | 58.3 | ||
| 07:50 | EUR | France Manufacturing PMI Mar F | 54.8 | 54.8 | ||
| 07:55 | EUR | Germany Manufacturing PMI Mar F | 57.6 | 57.6 | ||
| 08:00 | EUR | Eurozone Manufacturing PMI Mar F | 57 | 57 | ||
| 08:30 | GBP | Manufacturing PMI Mar F | 55.5 | 55.5 | ||
| 09:00 | EUR | Eurozone CPI Y/Y Mar P | 6.50% | 5.90% | ||
| 09:00 | EUR | Eurozone CPI Core Y/Y Mar P | 3.10% | 2.70% | ||
| 12:30 | USD | Nonfarm Payrolls Mar | 488K | 678K | ||
| 12:30 | USD | Unemployment Rate Mar | 3.70% | 3.80% | ||
| 12:30 | USD | Average Hourly Earnings M/M Mar | 0.40% | 0.00% | ||
| 13:30 | CAD | Manufacturing PMI Mar | 56.5 | 56.6 | ||
| 13:45 | USD | Manufacturing PMI Mar F | 58.5 | |||
| 14:00 | USD | ISM Manufacturing PMI Mar | 58.4 | 58.6 | ||
| 14:00 | USD | ISM Manufacturing Prices Paid Mar | 76 | 75.6 | ||
| 14:00 | USD | ISM Manufacturing Employment Index Mar | 53.7 | 52.9 | ||
| 14:00 | USD | ISM Manufacturing New Orders Index Mar | 59.8 | 61.7 | ||
| 14:00 | USD | Construction Spending M/M Feb | 0.90% | 1.30% |
Technical Outlook and Review
DXY:
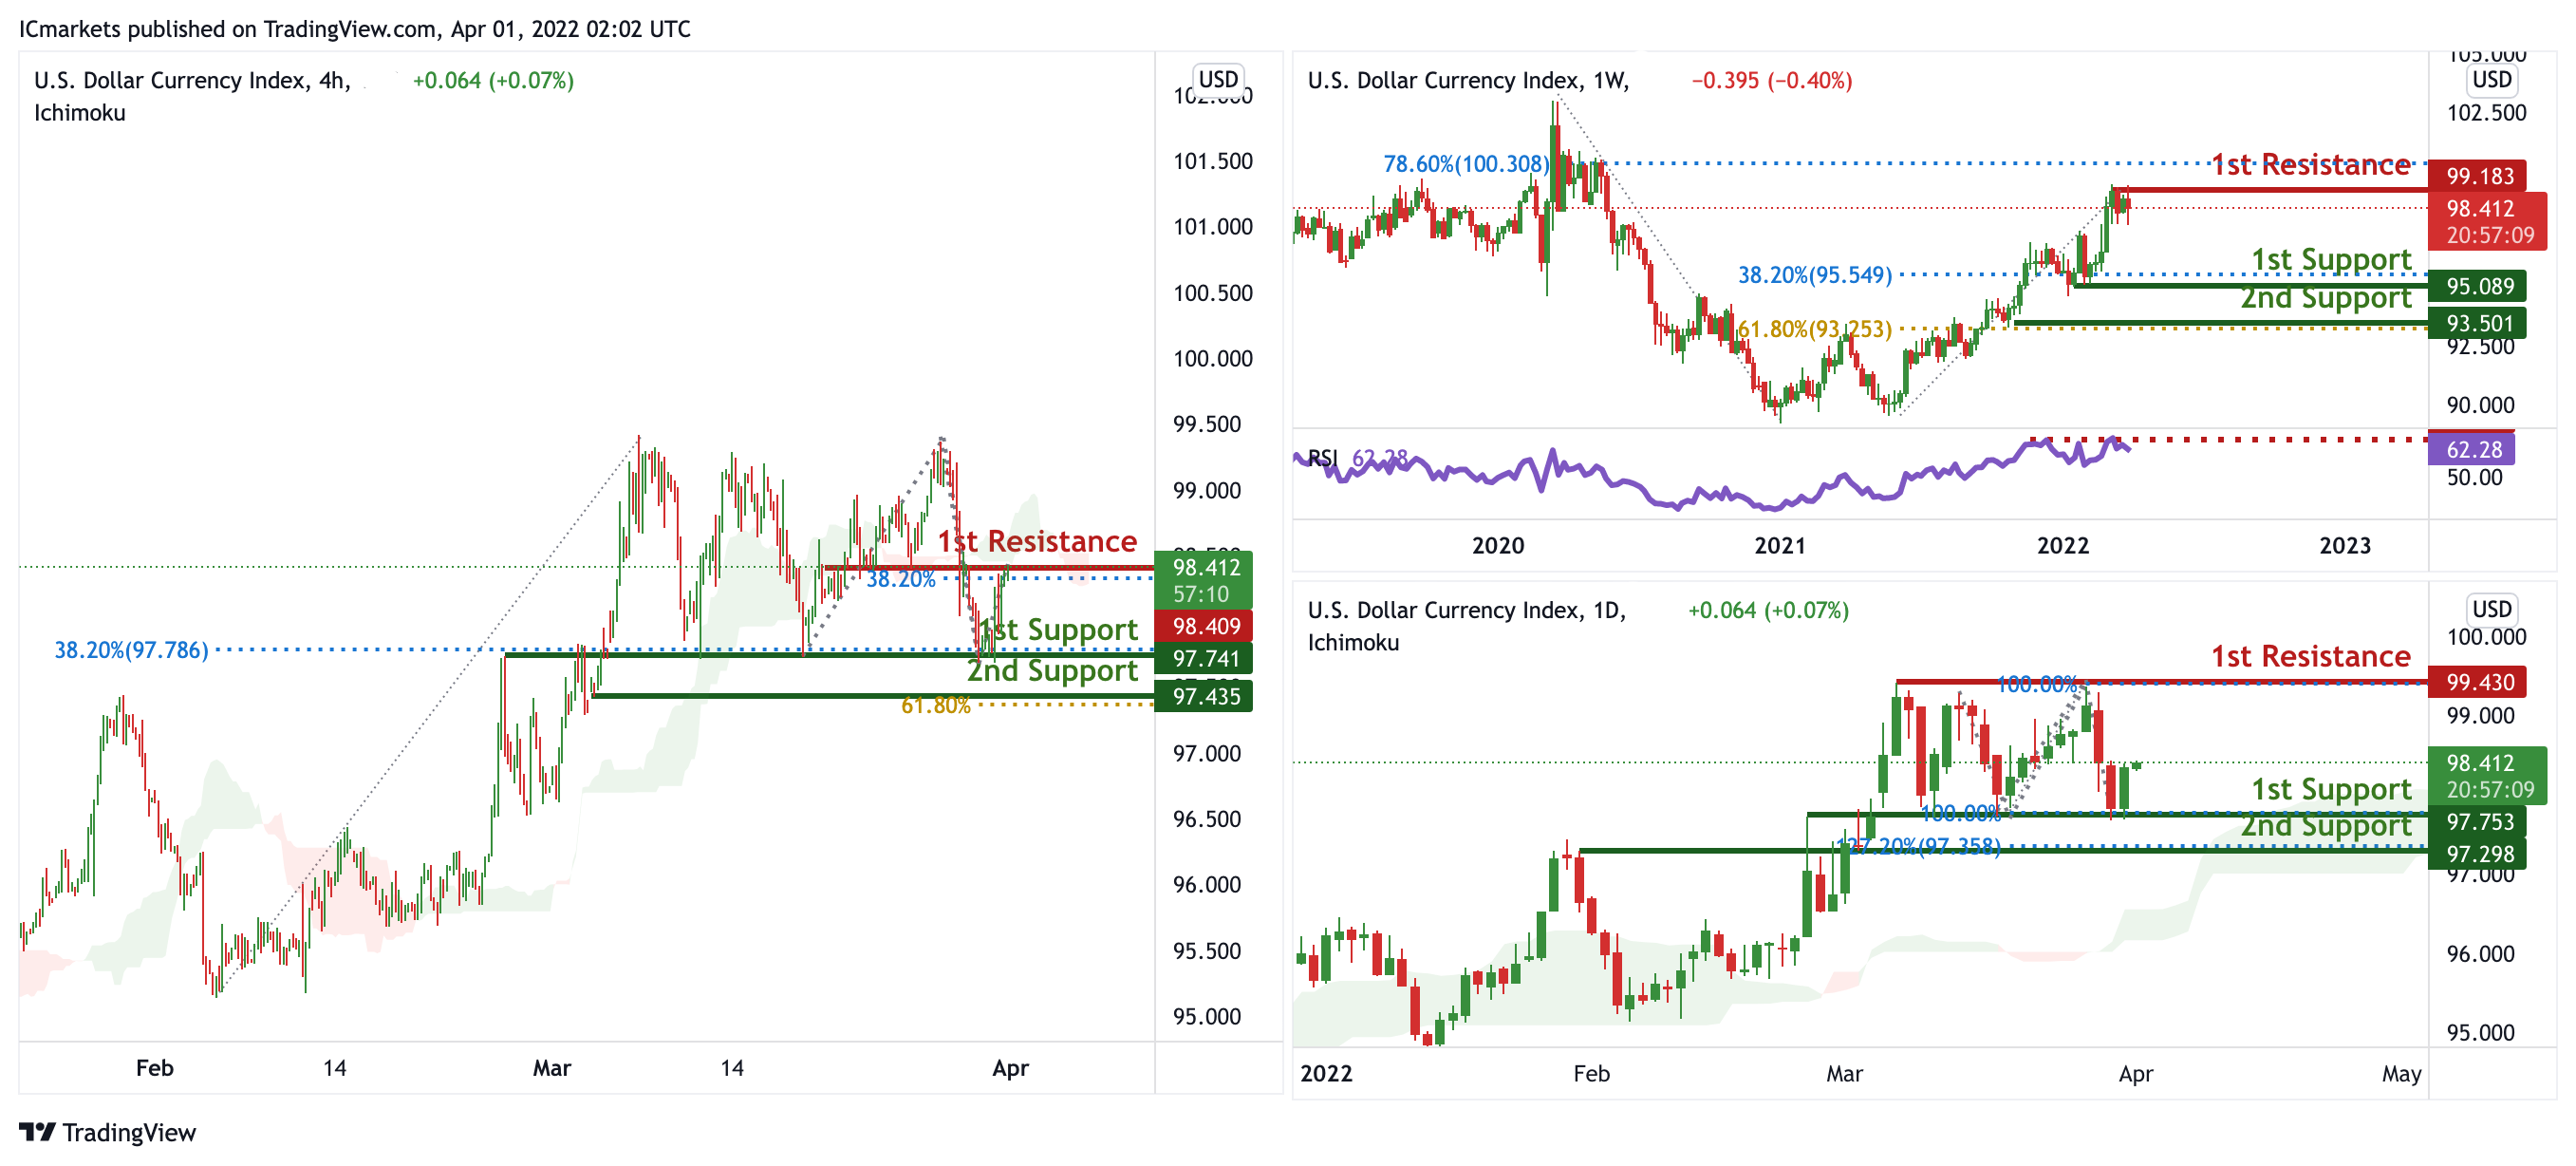
On the weekly, prices have approached a pivot. With RSI at all time high and divergence spotted, we see the potential for a dip from our 1st resistance at 99.183 in line with 78.6% Fibonacci Retracement towards our 1st support at 95.089 in line with 50% Fibonacci retracement. RSI is at levels where dips previously occurred.
On the daily, prices have consolidated in a triple top pattern. We see the potential for a bounce from our 1st support at 97.753 in line with 100% Fibonacci Projection towards our 1st resistance at 99.430 in line with 100% Fibonacci Projection. Prices are trading above our ichimoku cloud support, further supporting our bullish bias. On the H4 timeframe, prices are approaching a pivot. We see the potential for a dip from our 1st resistance at 98.409 in line with 38.2% Fibonacci Retracement towards our 1st support at 97.741 in line with 38.2% Fibonacci retracement. Prices are trading below our ichimoku clouds, further supporting our bearish bias.
Areas of consideration:
- H4 time frame, 1st resistance at 98.409
- H4 time frame, 1st support at 97.741
XAU/USD (GOLD):
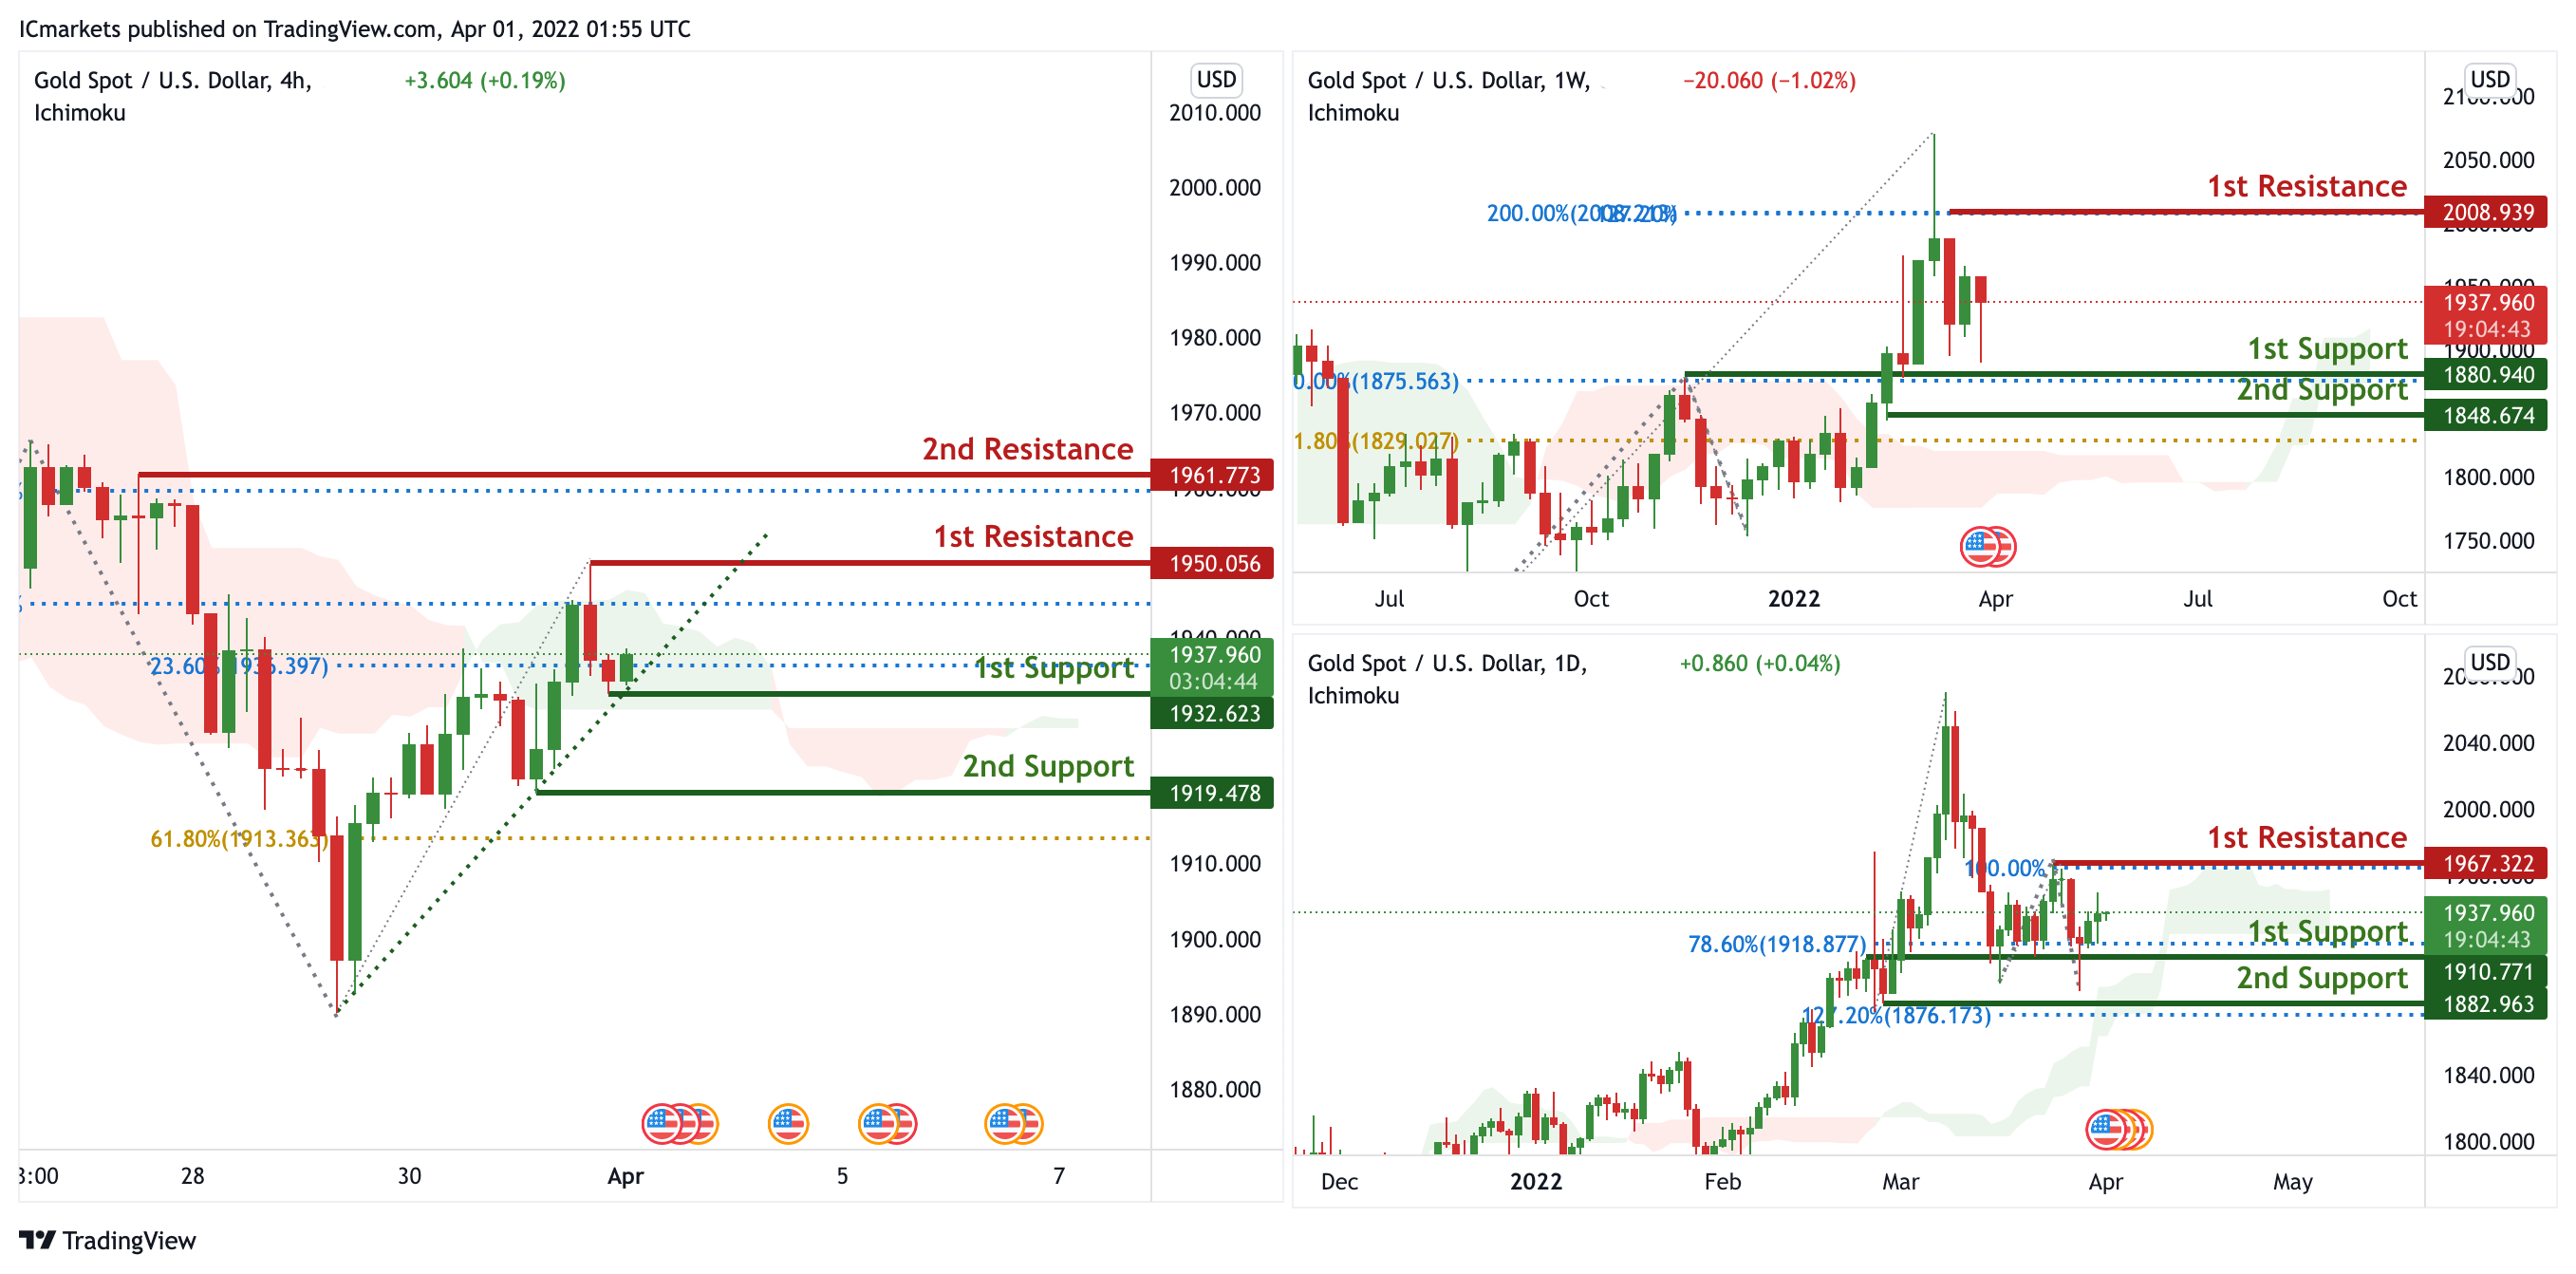
On the weekly, prices are on bullish momentum. We see the potential for a bounce from our 1st support at 1880.940 in line with 50% Fibonacci retracement towards our 1st resistance at 2008.939 which is an area of Fibonacci confluences.
On the daily, prices are on bullish momentum. We see the potential for further bullish continuation from our 1st support at 1910.771 in line with 78.6% Fibonacci retracement towards our 1st resistance at 1967.332 in line with 100% Fibonacci projection. Prices are trading above our ichimoku clouds, further supporting our bullish bias.
On the H4, prices are on bullish momentum and abiding by our ascending trendline support. We see the potential for further bullish continuation from our 1st support at 1932.623 which is in line with 23.6% Fibonacci retracement towards our 1st resistance at 1950.056 in line which is a graphical swing high. Ichimoku is supporting our bullish bias.
Areas of consideration:
- 4h 1st support at 1932.623
- 4h 1st resistance at 1950.056
GBP/USD:
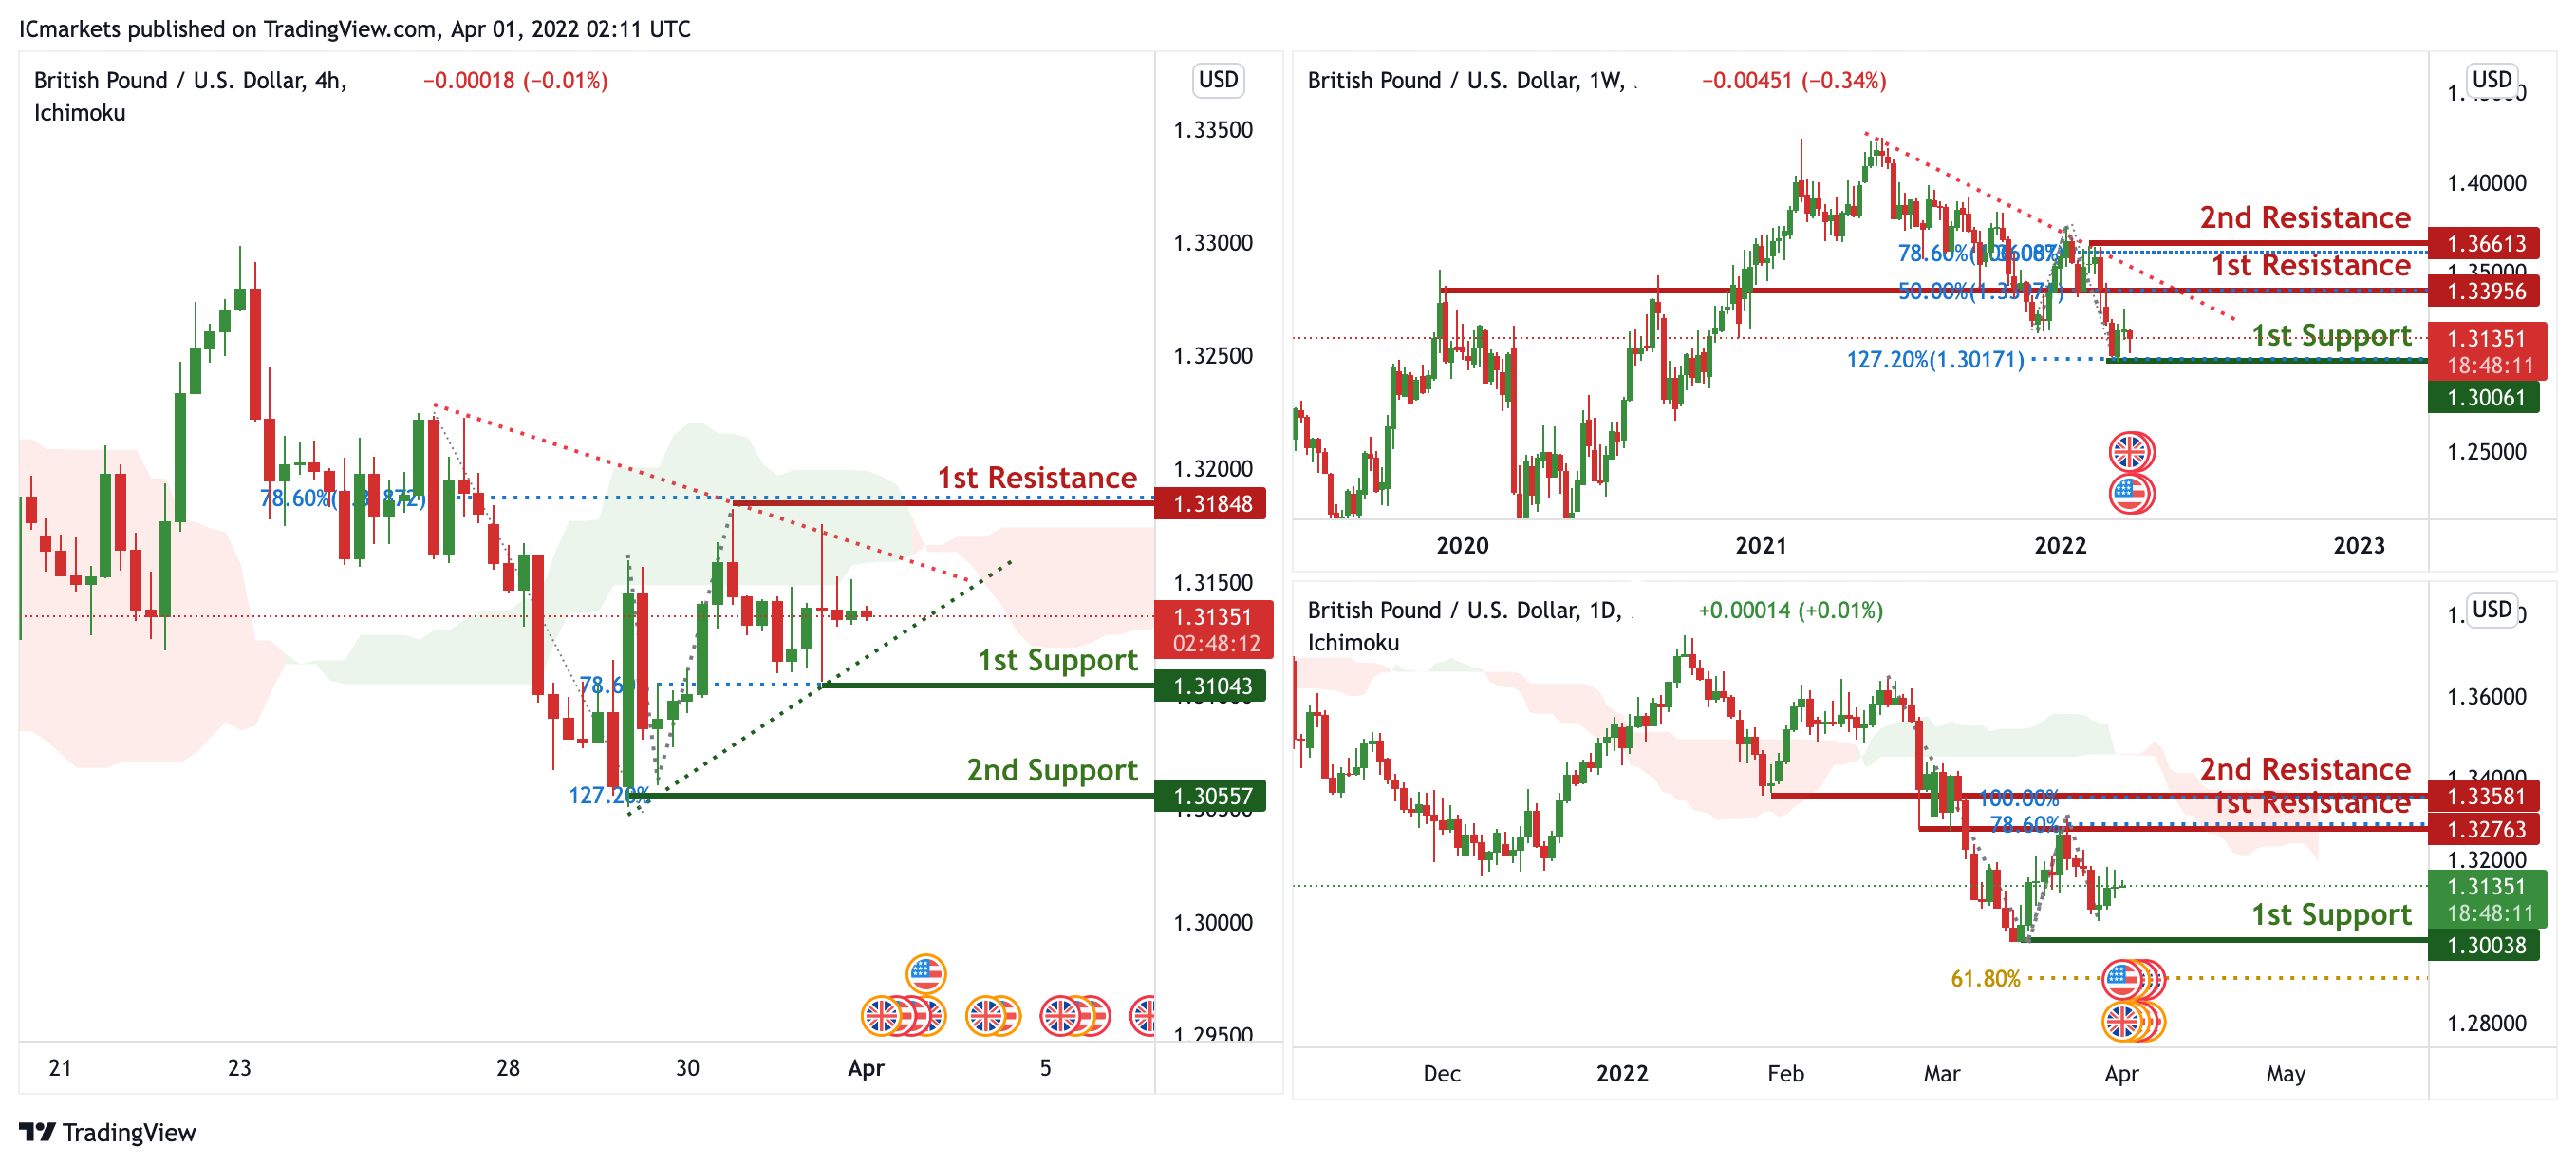
On the weekly, prices are on bearish trendline and abiding by our descending trendline resistance. We see the potential for a dip from our 1st resistance in line with 50% Fibonacci retracement towards our 1st support at 1.30061 which is a graphical swing low and also in line with 127.2% Fibonacci extension. On the daily, prices are on bearish momentum. We see the potential for further bearish continuation from our 1st resistance at 1.32763 in line with 78.6% Fibonacci projection towards our 1st support at 1.30038 in line with 61.8% Fibonacci Projection. Prices are trading below our ichimoku cloud resistance, further supporting our bearish bias. On the H4, prices are consolidating in a triangular pattern. As prices are consolidating in the middle, we would watch for a break from the triangle. Breaking upwards will find prices going to our 1st resistance at 1.31848 in line with 78.6% Fibonacci Retracement. Alternatively, prices may dip towards our 1st support at 1.31043 in line with 78.6% Fibonacci Projection. Technical indicators are showing conflicting views.
Areas of consideration:
- H4 1st resistance at 1.31848
- H4 1st support at 1.31043
USD/CHF:
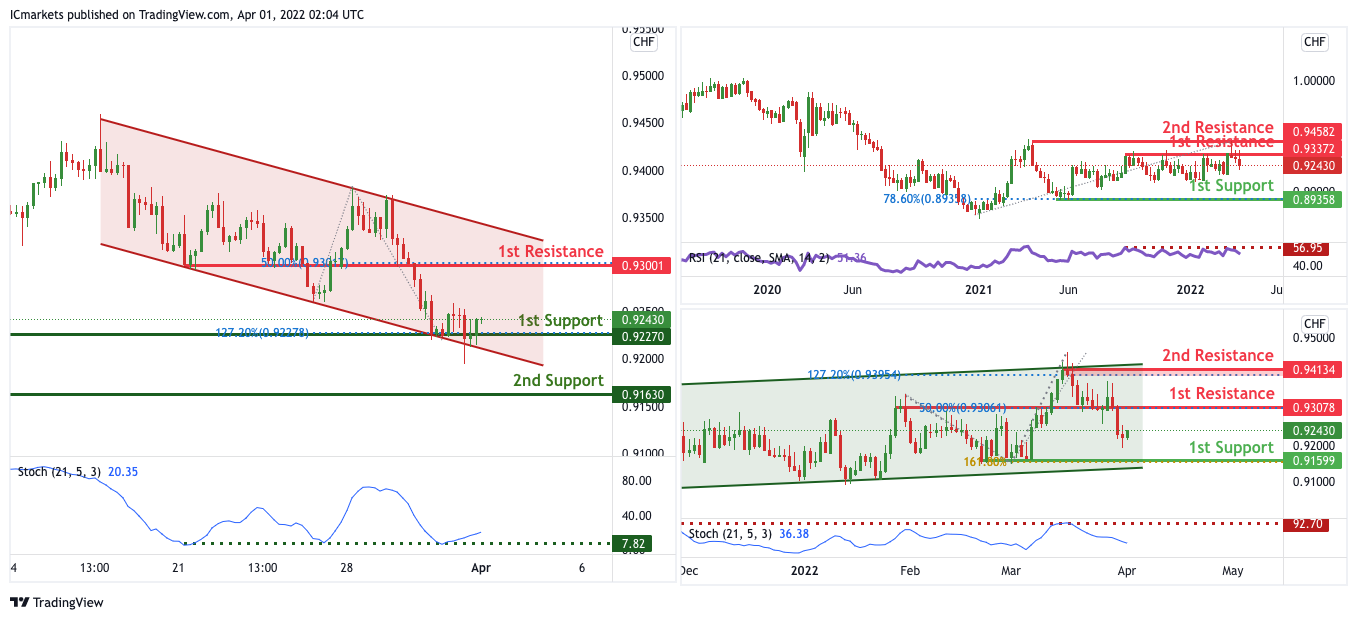
On the weekly, with price expected to reverse off the stochastics resistance, we expect to see a potential for bearish drop from our 1st resistance of 0.93372 in line with the swing high resistance towards our 1st support level at 0.89358 in line with the horizontal swing low support. Alternative scenario: If price breaks out, it can potentially move towards our 2nd resistance level at 0.94582 which is in line with the swing high resistance.
On the daily, price is expected to reverse off the stochastics resistance, we expect to see a potential for bearish drop from our 1st resistance of 0.93078 in line with the 50% Fibonacci retracement towards our 1st support level at 0.89358 in line with the horizontal swing low support. Alternative scenario: If price breaks out, it can potentially move towards our 2nd resistance level at 0.94134 which is in line with the swing high resistance.
On the H4, with price expected to bounce off the support of the stochastics indicator, we have a bias that price will rise to our 1st resistance at 0.93001 in line with the 50% Fibonacci retracement from our 1st support at 0.92302 in line with the horizontal overlap support and 127.2% Fibonacci extension. Alternatively, price may break 1st support structure and head for 2nd support at 0.91630 in line with the swing low support.
Areas of consideration
- 1st support level at 0.92302
- 1st resistance level at 0.93001
EUR/USD :
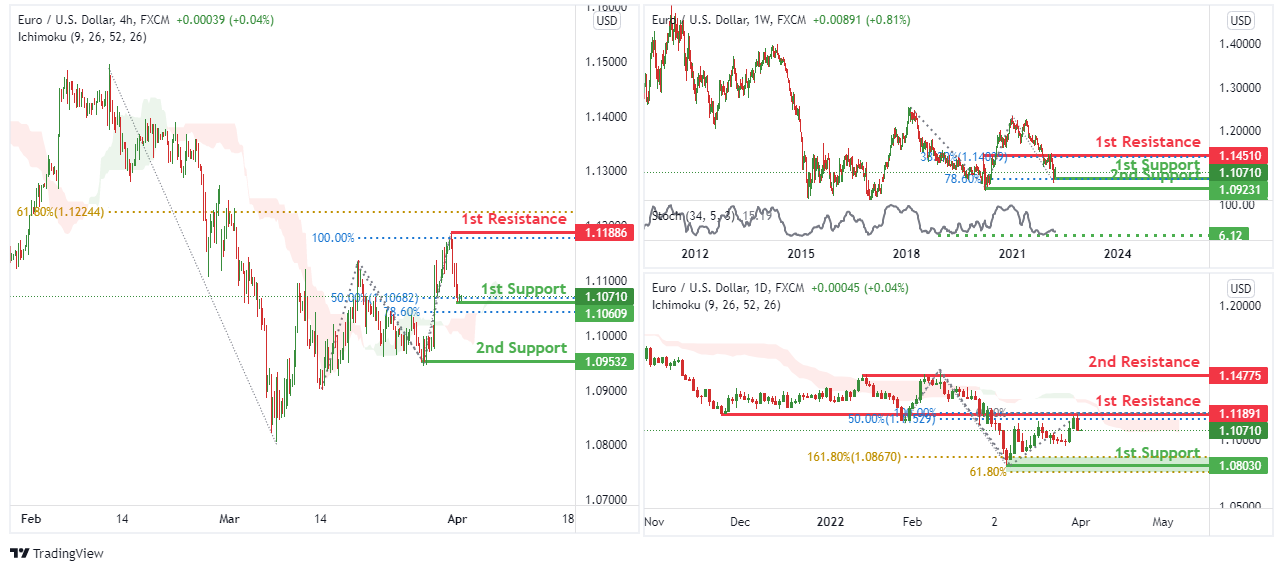
On the weekly, we see the potential for a bullish bounce from our 1st support at 1.10710 in line with 78.6% Fibonacci projection towards our 1st resistance at 1.14510 in line with 38.2% Fibonacci retracement. Our bullish bias is supported by the stochastic indicator where it is at support level.
On the daily, we see the potential for a bearish dip from our 1st resistance at 1.11891 in line with 100% Fibonacci projection and 50% Fibonacci retracement towards our 1st support at 1.08030 in line with 61.8% Fibonacci projection and 131.8% Fibonacci extension. Our bearish bias is supported by price trading below the ichimoku cloud indicator.
On the H4 timeframe, we see the potential for a bullish bounce from our 1st support at 1.10609 in line with 78.6% Fibonacci projection and 50% Fibonacci retracement towards our 1st resistance at 1.11886 in line with 100% Fibonacci projection and 61.8% Fibonacci retracement. Our bearish bias is supported by price trading below the ichimoku cloud indicator.
Areas of consideration :
- H4 1st resistance at 1.11886
- H4 1st support at 1.10609
USD/JPY:
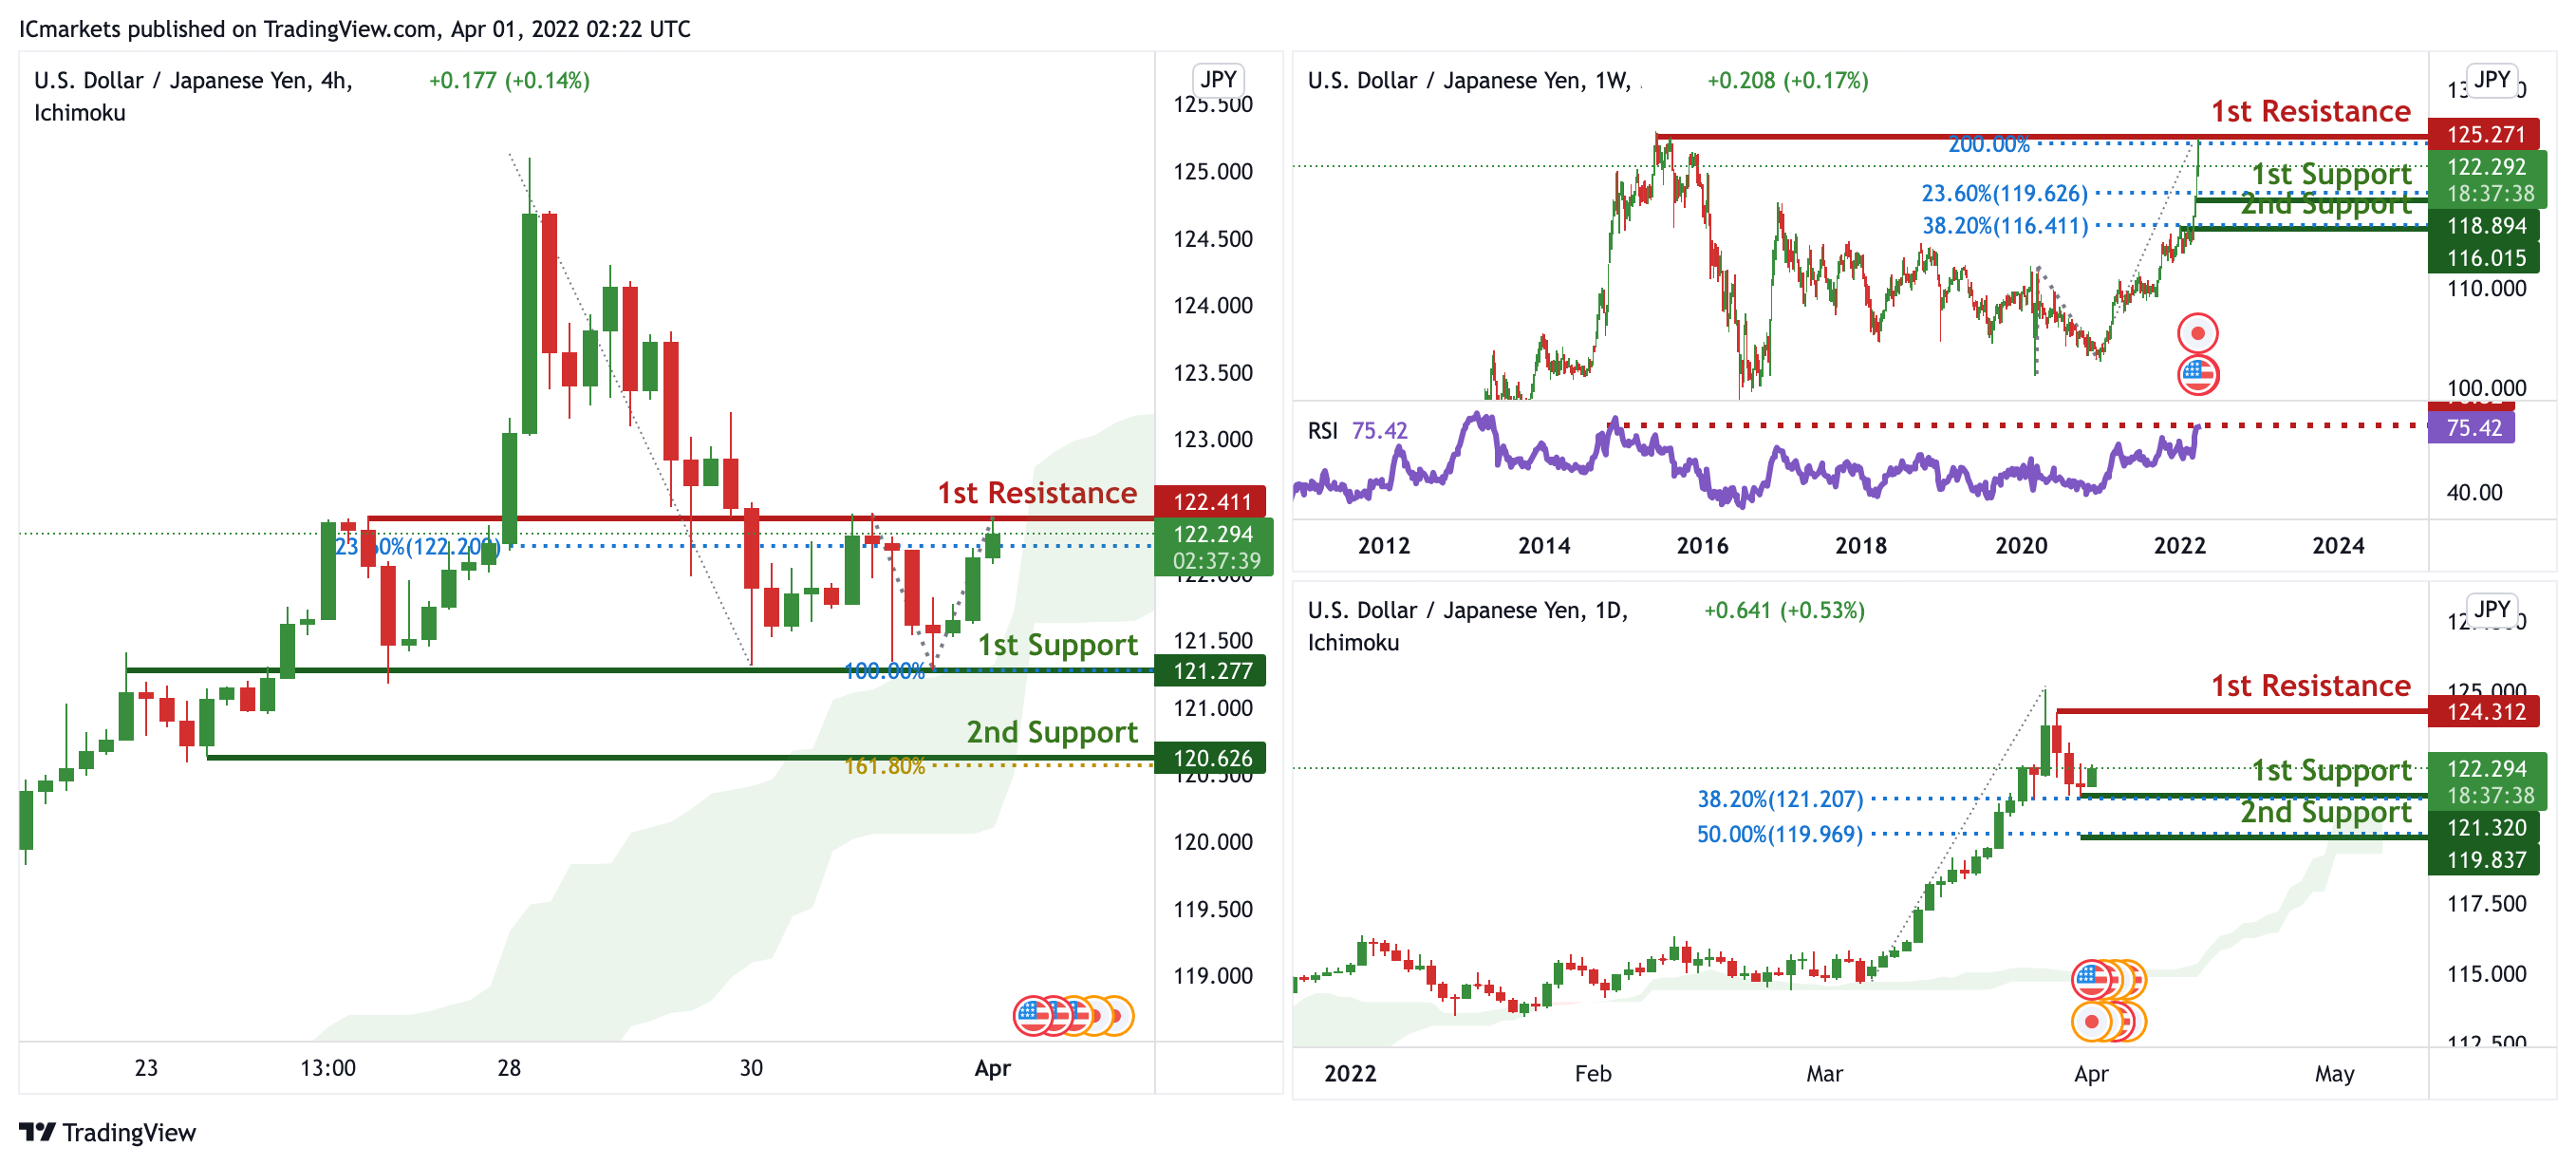
On the weekly, prices have approached an all time high. We see the potential for a dip from our 1st resistance at 125.271 in line with 200% Fibonacci Projection towards our 1st support at 118.894 in line with 23.6% Fibonacci retracement. RSI is at levels where dips previously occurred. On the daily, prices are on strong bullish momentum. We see the potential for a bounce from our 1st support at 121.320 in line with 38.2% Fibonacci retracement towards our 1st resistance at 124.312 which is a swing high. On the H4 timeframe, prices have approached a strong resistance. We see the potential for a dip from our 1st resistance at 122.411 in line with 23.6% Fibonacci retracement towards our 1st support at 121.277 in line with 100% Fibonacci Projection. Prices are testing the ichimoku clouds, supporting our bearish bias.
Areas of consideration:
- H4 time frame, 1st resistance at 122.411
- H4 time frame, 1st support at 121.277
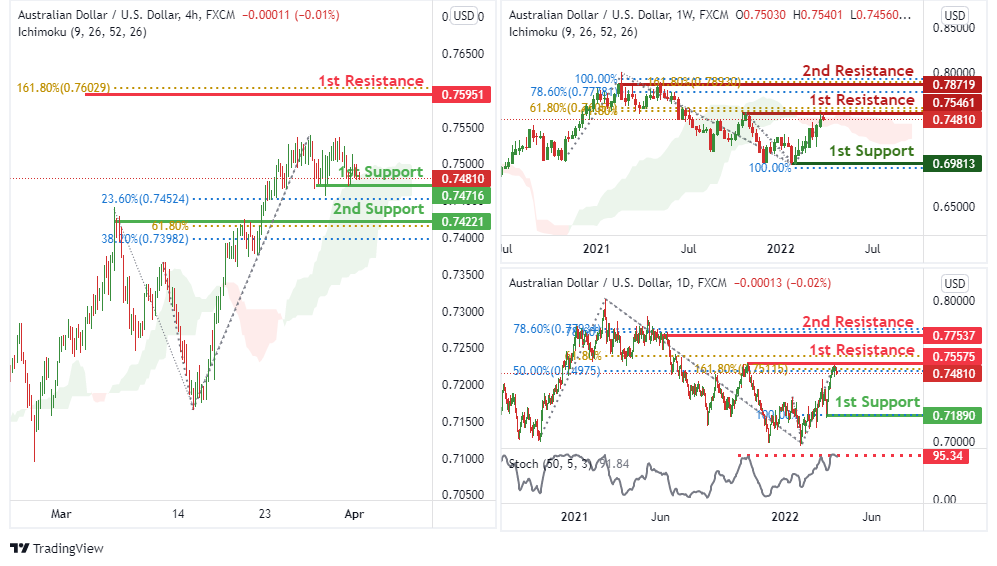
AUD/USD:
On the weekly, we see the potential for a bearish reversal from our 1st resistance at 0.75461 in line with 61.8% Fibonacci retracement and 61.8% Fibonacci projection towards our 1st support at 0.69813 in line with 100% Fibonacci projection. Price is trading below the ichimoku cloud indicator, further supporting our bearish bias.
On the daily, we see the potential for a bearish reversal from our 1st resistance at 0.75575 in line with 61.8% Fibonacci projection, 161.8% Fibonacci extension and 50% Fibonacci retracement towards our 1st support at 0.71890 in line with 100% Fibonacci projection. Our bearish bias is supported by the stochastic indicator where it is at resistance level.
On the H4 timeframe, we see the potential for a bullish bounce from our 1st support at 0.74716 in line with 23.6% Fibonacci retracement towards our 1st resistance at 0.75951 in line with 161.8% Fibonacci extension. Our bullish bias is supported by price trading above the Ichimoku cloud indicator.
Areas of consideration
- H4 1st resistance at 0.75951
- H4 1st support at 0.74716
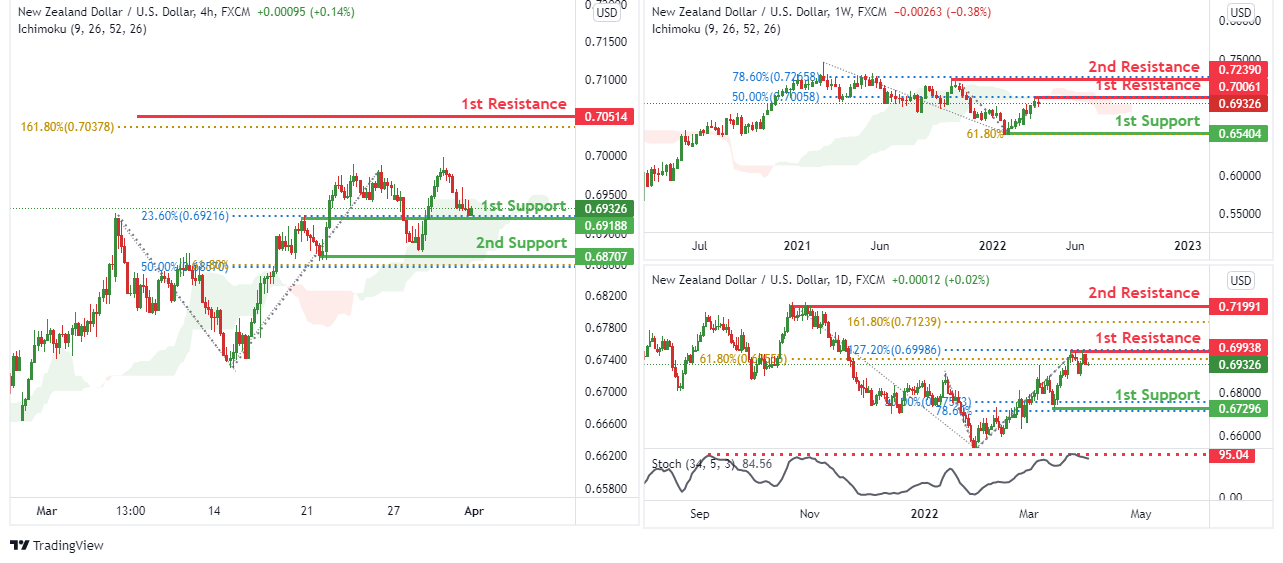
NZD/USD:
On the weekly, we see the potential for a bearish reversal from our 1st resistance at 0.70061 in line with 50% Fibonacci retracement towards our 1st support at 0.65404 in line with 61.8% Fibonacci projection. Price is trading below the ichimoku cloud indicator, further supporting our bearish bias.
On the daily, we see the potential for a bearish reversal from our 1st resistance at 0.69938 in line with 61.8% Fibonacci retracement and 127.2% Fibonacci extension towards our 1st support at 0.67296 in line with 78.6% Fibonacci projection and 50% Fibonacci retracement. Our bearish bias is supported by the stochastic indicator where it is at resistance level.
On the H4 timeframe, we see the potential for a bullish bounce from our 1st support at 0.69188 in line with 23.6% Fibonacci retracement towards our 1st resistance at 070514 in line with 161.8% Fibonacci extension. Our bearish bias is supported by price trading above the ichimoku cloud indicator.
Areas of consideration :
- H4 1st resistance at 0.70514
- H4 1st support at 0.69188
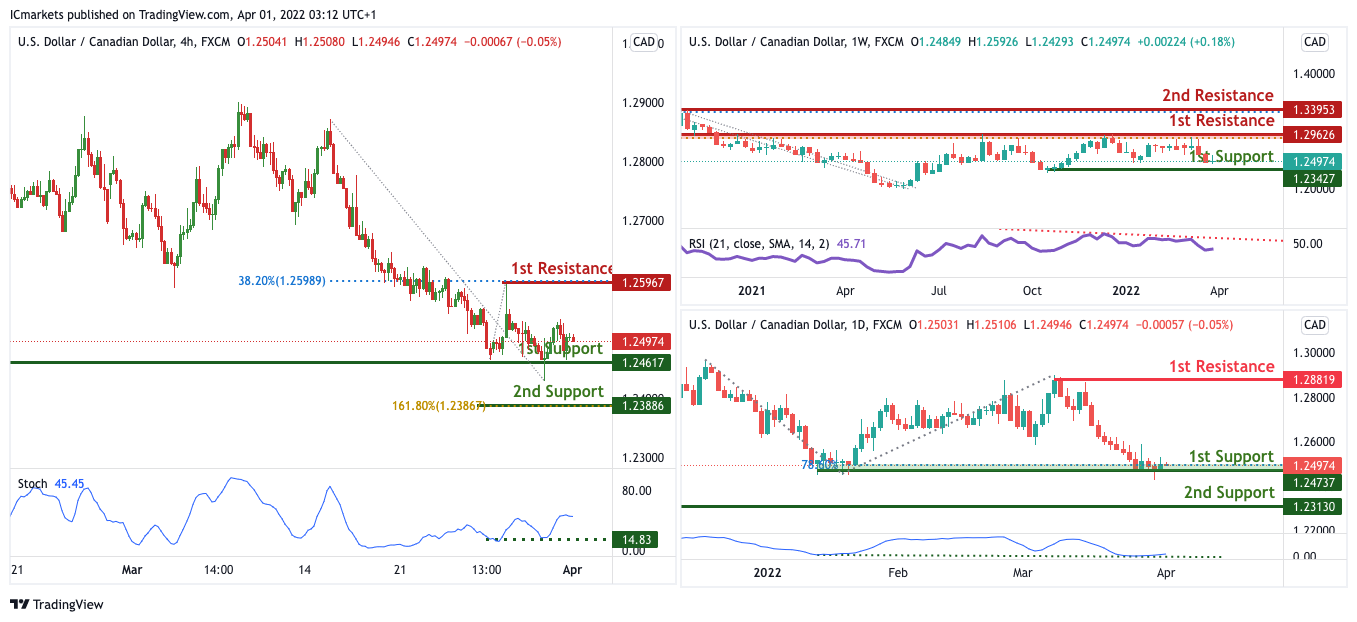
USD/CAD:
On the weekly, with price expected to reverse off the stochastics resistance, we expect to see a potential for bearish drop from our 1st resistance of 1.29626 in line with the swing high resistance towards our 1st support level at 1.23427 in line with the horizontal swing low support. Alternative scenario: If price breaks out, it can potentially move towards our 2nd resistance level at 1.33953.
On the Daily, with price expected to bounce off the support of the stochastics indicator, we have a bias that price will rise to our 1st resistance at 1.28819 in line with the swing high resistance from our 1st support at 1.24737 in line with the horizontal swing low support. Alternatively, price may break 1st support structure and head for 2nd support at 1.23130.
On the H4, with price expected to bounce off the support of the stochastics indicator, we have a bias that price will rise to our 1st resistance at 1.25967 in line with the 38.2% Fibonacci retracement from our 1st support at 1.24617 in line with the horizontal swing low support. Alternatively, price may break 1st support structure and head for 2nd support at 1.23886 in line with the 161.8% Fibonacci extension.
Areas of consideration:
- H4 time frame, 1st support at 1.24617
- H4 time frame, 1st resistance at 1.25967
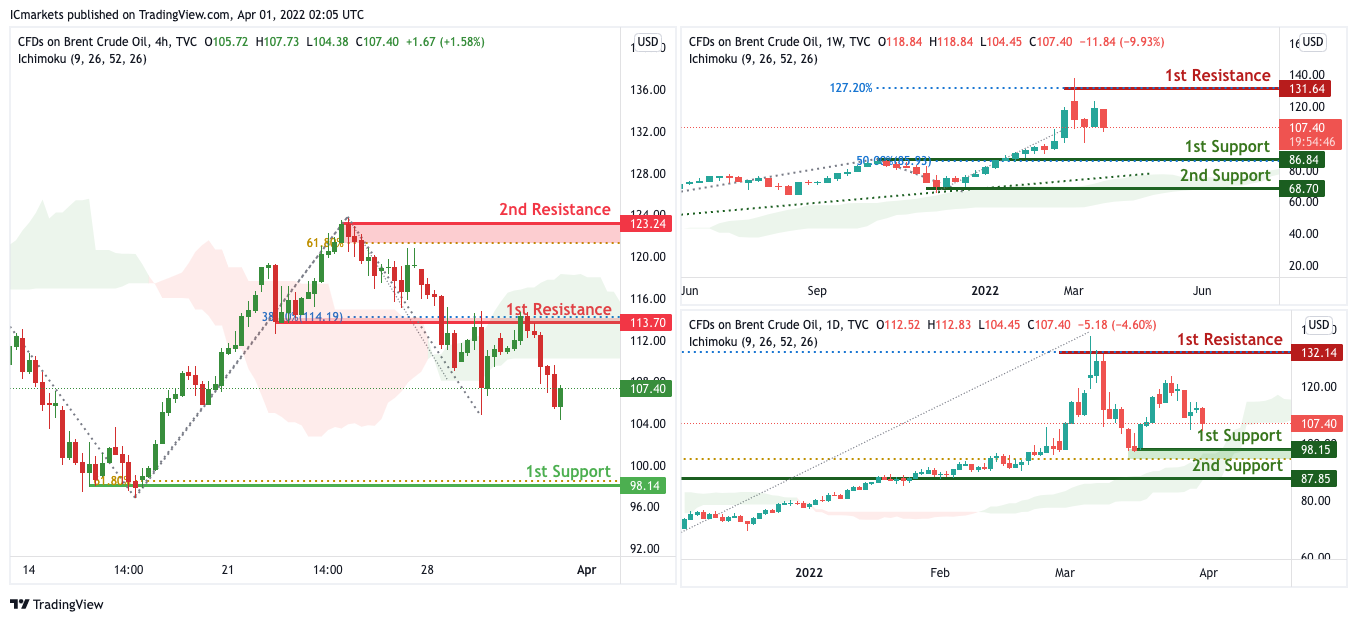
OIL:
On the Weekly, with price expected to bounce off the support of the ichimoku cloud, we have a bias that price will rise to our 1st resistance at 131.64 in line with the 127.2% Fibonacci extension from our 1st support at 86.84 in line with the 50% Fibonacci retracement. Alternatively, price may break 1st support structure and head for 2nd support at 68.70.
On the Daily, with price expected to bounce off the support of the ichimoku cloud, we have a bias that price will rise to our 1st resistance at 132.14 in line with the swing high resistance from our 1st support at 98.15 in line with the horizontal swing low support and 61.8% Fibonacci retracement.
On the H4, with price moving below the ichimoku cloud, we expect to see a potential for bearish drop from our 1st resistance of 113.70 in line with the pullback resistance towards our 1st support level at 98.14 in line with the 61.8% Fibonacci projection. Alternatively, If price breaks out, it can potentially move towards our 2nd resistance level at 123.24 which is in line with the swing high resistance.
Areas of consideration:
- H4 time frame, 1st resistance of 113.70
- H4 time frame, 1st support of 98.14
Dow Jones Industrial Average:
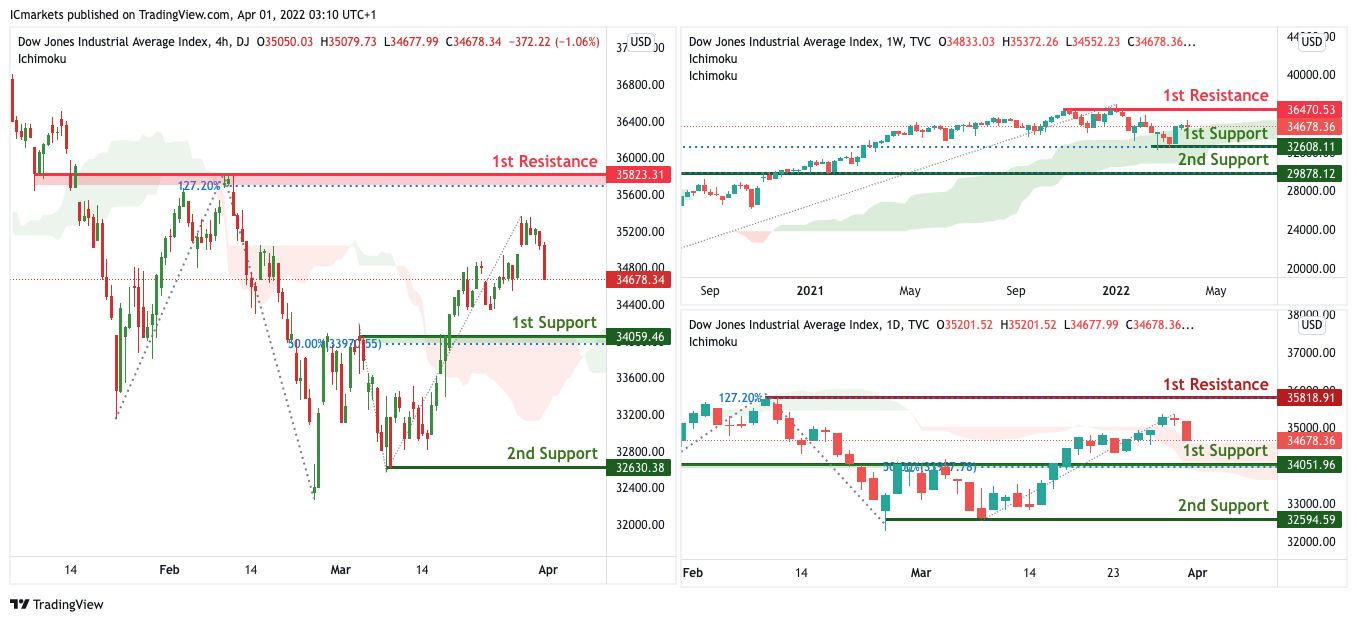
On the weekly, with price moving above the ichimoku cloud, we have a bias that price will rise to our 1st resistance at 36470 from our 1st support at 32608. Alternatively, price may break 1st support structure and head for 2nd support at 29878 in line with the horizontal overlap support.
On the daily, with price moving above the ichimoku cloud, we have a bias that price will rise to our 1st resistance at 35818 in line with the 127.2% Fibonacci extension from our 1st support at 34051 in line with the horizontal pullback support. Alternatively, price may break 1st support structure and head for 2nd support at 32594 in line with the horizontal swing low support.
On the H4, with price moving above the ichimoku cloud, we have a bias that price will rise to our 1st resistance at 34673 in line with the 127.2% Fibonacci extension from our 1st support at 34059 in line with the horizontal pullback support. Alternatively, price may break 1st support structure and head for 2nd support at 35623 in line with the horizontal swing low support.
Areas of consideration :
- H4 1st support at 34059
- H4 1st resistance at 34673
US NFP unlikely to alter Fed hike
US non-farm payrolls report is expected to show 488k job growth in March. Unemployment rate is expected to tick down further from 3.8% to 3.7%. Average hourly earnings are expected to return to growth at 0.4% mom.
Looking at related data, ADP report showed 455k private job growth in the same month, which was strong. Four-week moving average of initial jobless claims dropped notably from 208.5k to 230.5k. The employment data from ISM indexes are not available yet.
Markets are pricing in more than 70% chance of a 50bps rate hike by Fed in May. Even a moderate miss in the headline NFP number is not going to alter such expectations much. On the other hand, solid wages growth would leave less room for the Fed doves to argue for a small hike.
Some previews on NFP:
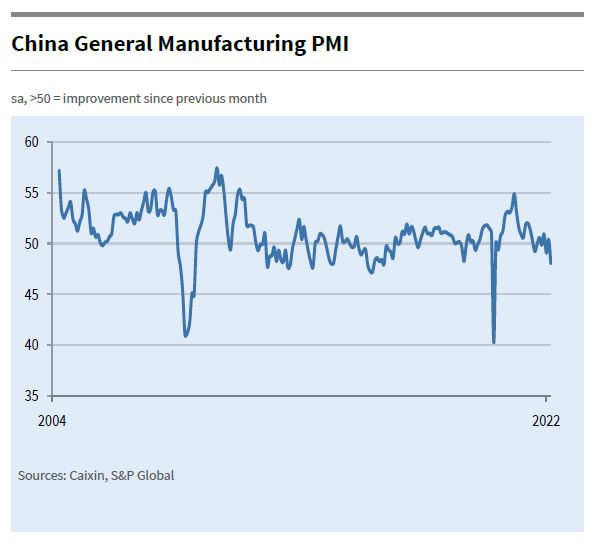
China Caixin PMI manufacturing dropped to 48.1, fastest contraction in two years
China Caixin PMI Manufacturing dropped from 50.4 to 48.1 in March, below expectation of 49.7. The pace of contraction was quickest since February 2020. Caixin said production fell at quickest rate for just over two years amid tighter pandemic restrictions. Total new work and foreign demand had steep declines. Suppliers' delivery times worsened while cost pressures intensified.
Wang Zhe, Senior Economist at Caixin Insight Group said: "Overall, impacted by factors including the Covid-19 outbreaks in multiple parts of China, manufacturing activity largely weakened in March. Supply contracted. Demand was also under pressure, and external demand worsened. The job market was more or less stable. Inflationary pressure continued to rise. And market optimism weakened."
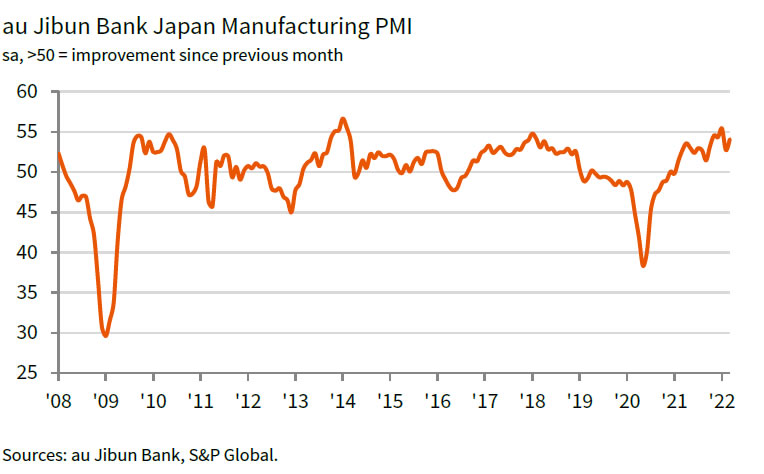
Japan PMI manufacturing finalized at 54.1, improvement in operation but subdued international markets
Japan PMI Manufacturing was finalized at 54.1 in March, up from February's 52.7. Markit said there was renewed rise in output and stronger new order growth. But export orders had sharpest fall for 20 months. Stocks of raw materials had record rise amid higher prices and delays.
Usamah Bhatti, Economist at S&P Global, said:
"The Japanese manufacturing sector saw an improvement in operating conditions at the end of the first quarter of 2022... new order inflows saw a quickening in growth... international markets were subdued, following the reintroduction of strict restrictions across parts of China and the outbreak of war between Russia and Ukraine. As a result, new export orders fell at the sharpest rate since July 2020....
"Beyond the immediate future, firms remained confident about the year-ahead outlook for output, though the downside risks led to the softest degree of optimism for seven months. This is in line with current estimates for industrial production to rise 3.7% in 2022, meaning that output lost to the pandemic is unlikely to be recovered until 2023."
Australia AiG manufacturing rose to 55.7, price pressures stepped up
Australia AiG Performance of Manufacturing Index rose from 53.2 to 55.7 in March. Looking at some details, production dropped -1.2 to 53.4. Employment rose 9l9 to 53.4. New orders rose 5.2 to 65.0. Input prices rose 6.8 to 82.4. Selling prices rose 0.4 to 72.0. Average wages rose 1.7 to 66.6.
Innes Willox, Chief Executive of Ai Group said: "The Australian manufacturing sector grew faster in March as manufacturers added new staff, lifted sales and continued to expand production (although at a slower pace than in February)... Across manufacturing pressures from wages and input prices stepped up while selling prices growth saw manufacturers recover some cost increases in the market. There was an encouraging rise in new orders in March although with labour and input supply constraints growing, manufacturers will be stretched to fill orders in a timely way."