Sample Category Title
US: Spending and Income are Up but Inflation Continues to Bite
Personal income was up 0.5% month-on-month (m/m) in February, on par with consensus expectation. January growth was revised up to +0.4% m/m from a flat reading. Compensation of employees (+0.6% m/m) remains the driving force of higher income, with both private and government sector wages rising.
Removing the effect of price changes and taxes, real personal disposable income declined for the third month in a row, down by 0.2% m/m in February, while January's decline was revised down to up to -0.2% m/m (from -0.3% reported earlier).
Nominal personal spending rose by 0.2% m/m in February, below the consensus estimate (0.5% m/m). January growth of 2.1% m/m reported in the preliminary estimate was revised up to 2.7% m/m.
- Goods spending fell 1.0% m/m from upwardly revised growth of 6.5% in January (originally +5.2%). Both durables (-2.5%m/m) and nondurables (-0.1% m/m) spending were down, with the major drag coming from lower spending on motor vehicles and parts.
- Services spending rose by 0.9% m/m, while the January reading was adjusted up to 0.7% m/m (originally +0.5%). The gain was largely attributed to spending food services and accommodation.
In real terms, spending was down 0.4%, slightly weaker than expected by the market (-0.2% m/m). Real goods spending was behind the drag with a decline of 2.1%. Real services spending was up 0.6%.
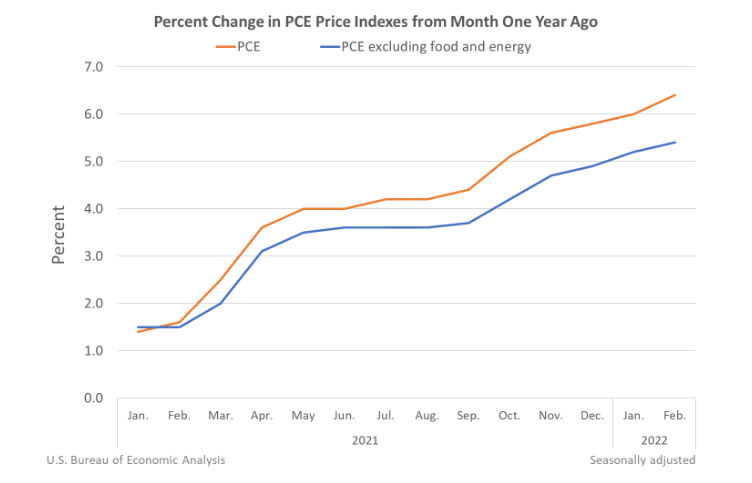
The PCE price deflator rose by 0.6% m/m in February (as expected), which translated into 6.4% in year-over-year (y/y) terms (as expected). Excluding food and energy, core PCE inflation was up 0.4% m/m (as expected) and 5.4% y/y (vs. 5.5% expected).
The personal saving rate was up to 6.3% from 6.1% in January.
Key Implications
February of exactly two years ago marks the "pre-pandemic" benchmark against which economists have been measuring the COVID-induced economic shock and recovery. Relative to it, real consumption is now 4.6% higher, with goods spending 15.6% higher and services spending, which are still suffering from the effects of restrictions, 0.3% lower.
In an ideal world, consumers will shift spending back to services, contributing to lower goods price pressure while keeping the economy going. Today's release shows some evidence of this reversion, which should build momentum in the coming months. Accounting for upward revisions, we expect real spending growth to be stronger than the 2.4% penciled into our forecast.
Higher prices continue to erode consumer purchasing power, with real disposable income growth declining for the seventh month in a row. Consumers have been able to buy more than they earn with substantial excess saving, which we currently estimate at $2.5 trillion. (down from a peak of almost $2.7 trillion in September 2021). With the current reading of the Fed's preferred measure of inflation (the core PCE price deflator) well above target, the risk higher inflation becoming entrenched is becoming more real (see Dollars & Sense).
Canada’s Economy Continues to Bounce Back
The Canadian economy expanded by 0.2% month/month (m/m) in January, matching Statistics Canada's flash estimate. The flash estimate for February showed an even stronger gain of 0.8% m/m.
January's increase in activity was mixed, with output expanding in 9 of the 20 industries. The goods-producing sector rose 0.8%, while the service-producing sector was flat at 0%.
Construction saw a noticeable jump (2.8%) this month, with residential building construction rising 4.3%. The report noted that "home alterations and improvements along with apartment-type construction (led) the way."
Wholesale trade was also up on the month, as deliveries of machinery and equipment that feed the construction and commodity industries grew 5.5%.
The accommodation and food services sector was negatively impacted due to Omicron, resulting in a 11.5% drop on the month. Food services and drinking places and accommodation services were down 10.2% and 14.7%, respectively.
Key Implications
And another one! The hits just keep coming, with positive data serially exceeding expectations. Not only did Canada continue to grow through the January Omicron wave and associated lockdowns, but the flash estimate of 0.8% for February shows that the recovery from it is in full swing.
Combining this report with the February employment report further cements our view that the Bank of Canada is right to accelerate its hiking cycle and we look for a 50 basis point hike on April 13th.
Financial markets continue to look favourably on Canada, with Canadian yields above their U.S. counterparts, the TSX outperforming, and the loonie holding on to recent gains. Let the good times roll.
GBPCAD Still Bearish Despite Uptick Off 2½-Year Low
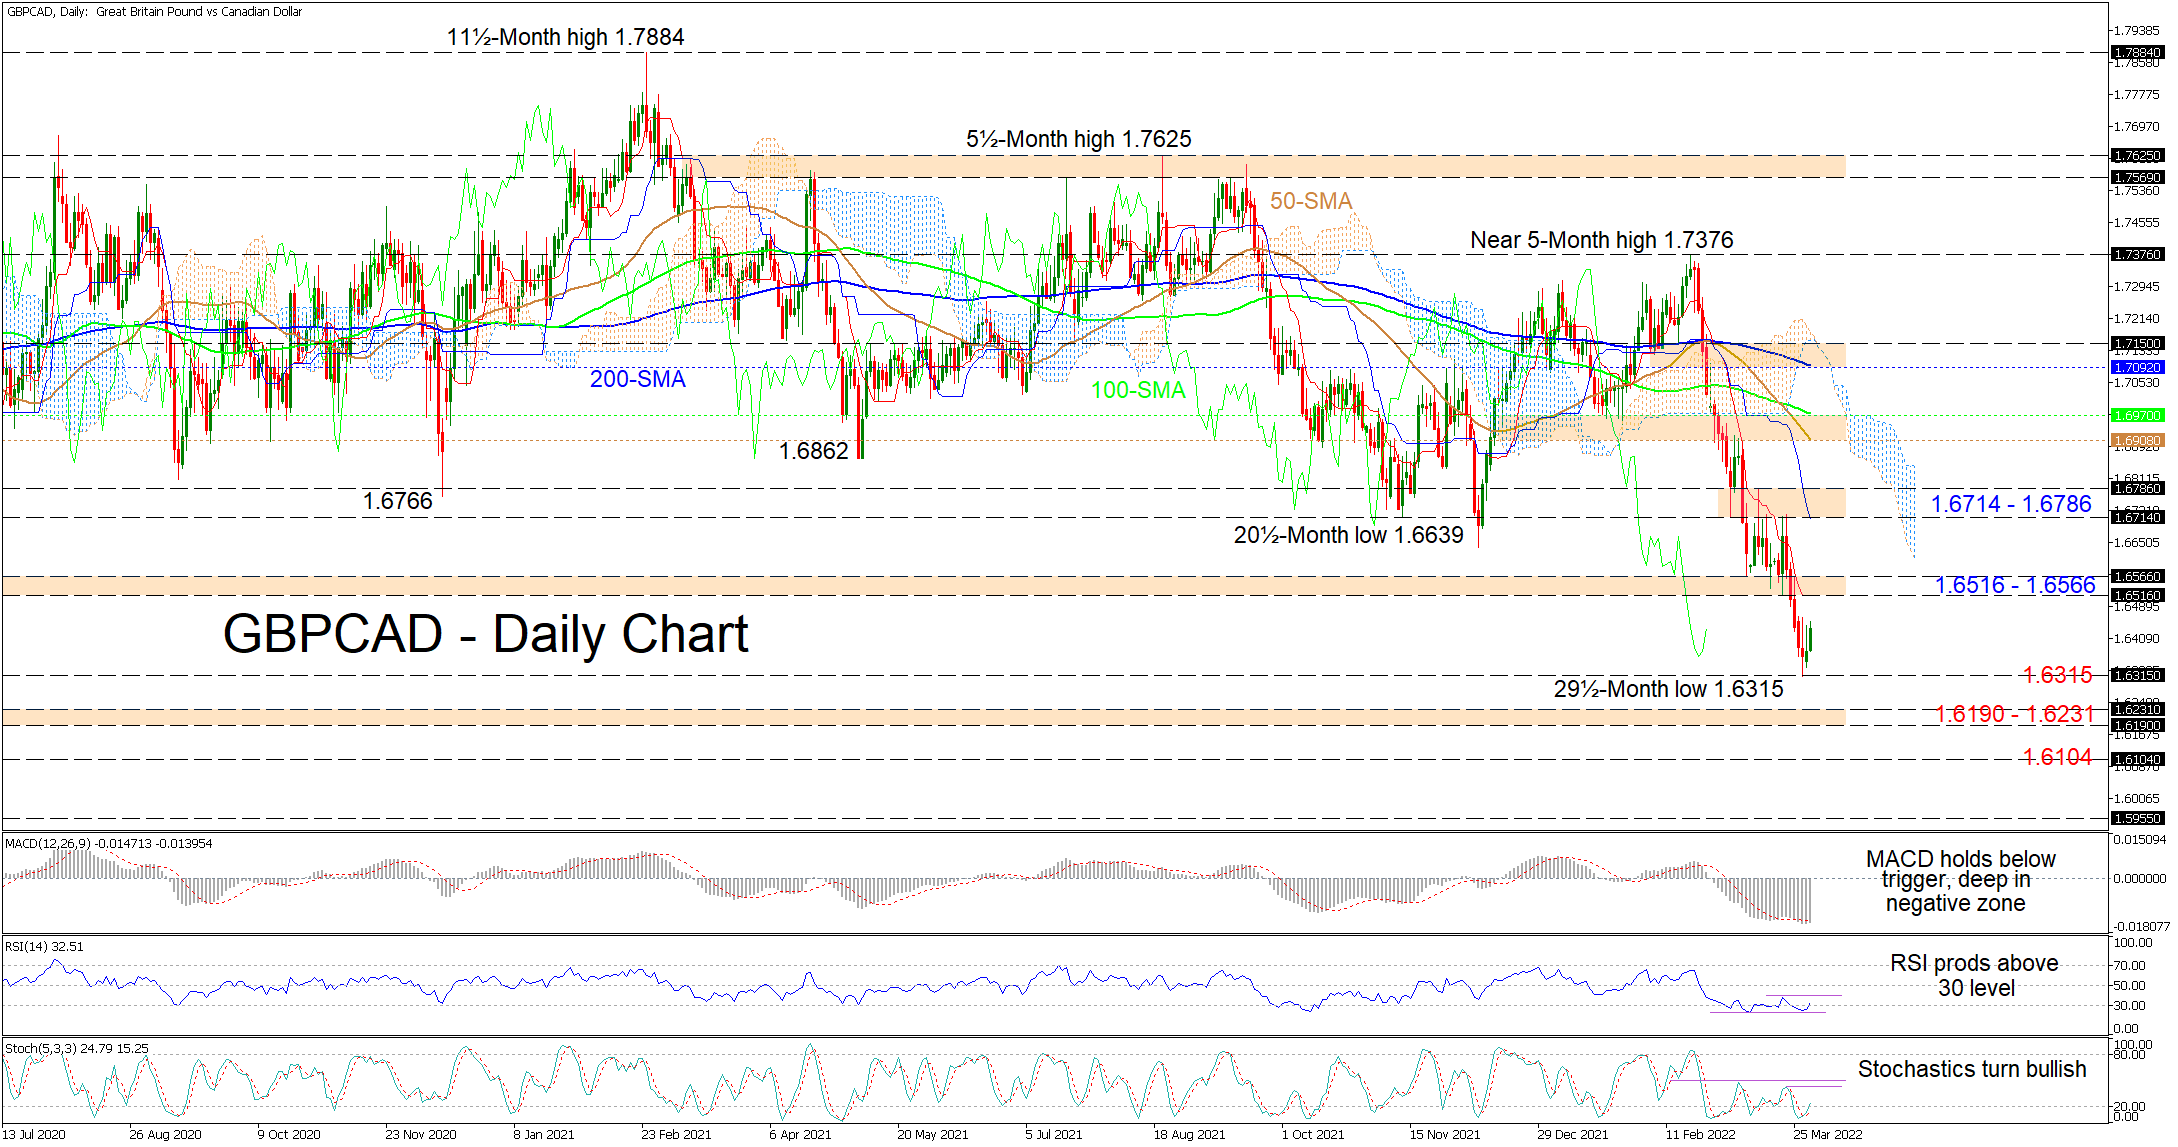
GBPCAD is improving from the 29½-month low of 1.6315 but the near six-week decline from 1.7376 high remains intact below the 1.6714-1.6786 resistance boundary. The falling simple moving averages (SMAs) continue to endorse a deteriorating outlook in the pair.
Moreover, the diving Ichimoku lines indicate that prevailing bearish forces are present, while the short-term oscillators are reflecting the renewed pickup in positive momentum. The MACD, far below the zero threshold, is just beneath its flattened red trigger line, while the RSI has nudged back above the 20 level. Furthermore, the stochastic %K line has pushed north of the 20 oversold level, promoting additional bullish price action in the pair.
In the positive scenario, upside constraints could commence from the 1.6516-1.6566 resistance band that extends back to March 2020. If bullish forces intensify, the pair may then jump to tackle the 1.6714-1.6786 resistance barrier where the blue Kijun-sen line also resides. In the event buyer’s positive traction endures for longer, they could then challenge the section of resistance between the 50-day SMA at 1.6908 and the 100-day SMA at 1.6970.
Alternatively, if negative pressures start to overwhelm again, initial support could arise from the two-and-a-half-year trough of 1.6315. However, should the descent resume, the 1.6190-1.6231 support border shaped by the lows in the first part of October 2019 may contest sellers’ efforts to fortify the bearish trajectory. If the 1.6190-1.6231 critical defence fails to dismiss the decline, the spotlight could then turn to the 1.6104 trough identified in September 2019.
Summarizing, GBPCAD continues to exhibit a bearish bias below the 1.6714-1.6786 boundary despite its recent improvements. A break below the 1.6190-1.6231 support could ramp up negative pressures, while a climb in the price beyond the 1.6714-1.6786 barrier may dampen the negative outlook to a degree.
EUR/GBP Mid-Day Outlook
Daily Pivots: (S1) 0.8465; (P) 0.8482; (R1) 0.8512; More...
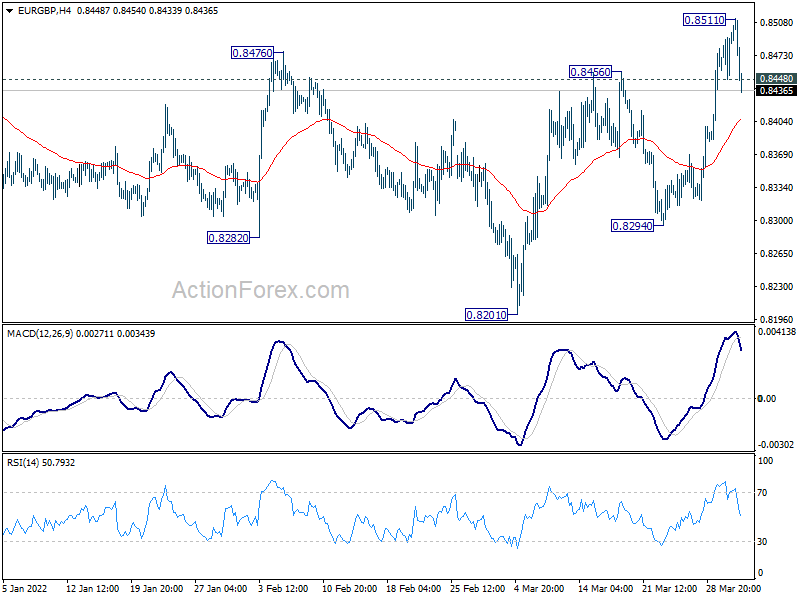
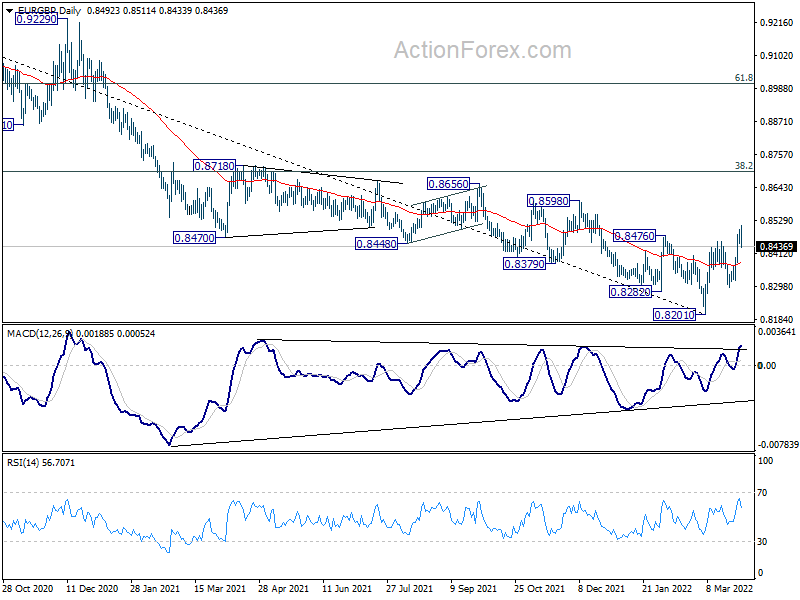
EUR/GBP retreats sharply after hitting 0.8551 and intraday bias is turned neutral first. At this point, further rise is still in favor as long as 0.8294 support holds. 0.8201 is seen as a medium term bottom. Above 0.8511 will target 0.8697 medium term fibonacci level next. However, break of 0.8294 will dampen this bullish view and bring retest of 0.8201 low.
In the bigger picture, a medium term bottom should be in place at 0.8201, on bullish convergence condition in daily and weekly MACD. Rise from there could either be a correction to the down trend from 0.9499 (2020 high), or a medium term up trend itself. In either case, further rise should be seen to 38.2% retracement of 0.9499 to 0.8201 at 0.8697. Sustained break there will target 61.8% retracement at 0.9003. This will remain the favored case as long as 0.8294 support holds.
USD/JPY Mid-Day Outlook
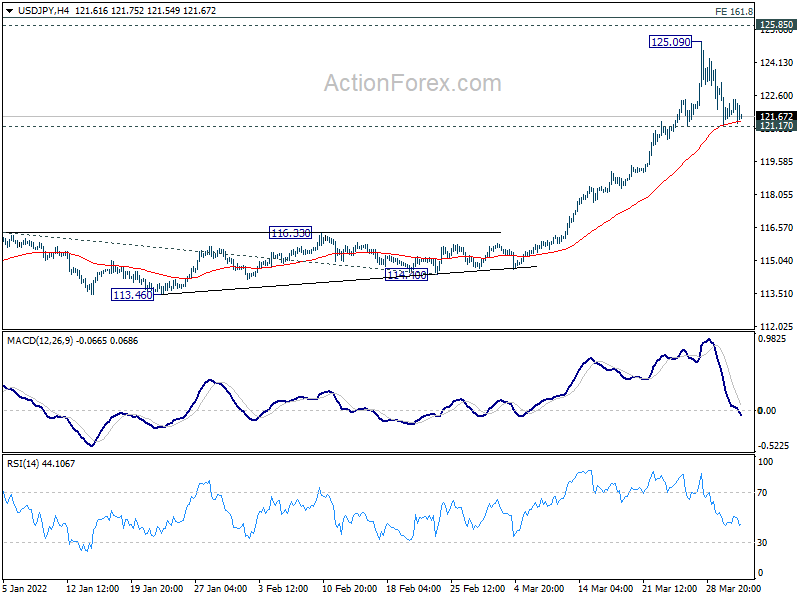
Daily Pivots: (S1) 121.03; (P) 122.12; (R1) 122.92; More...
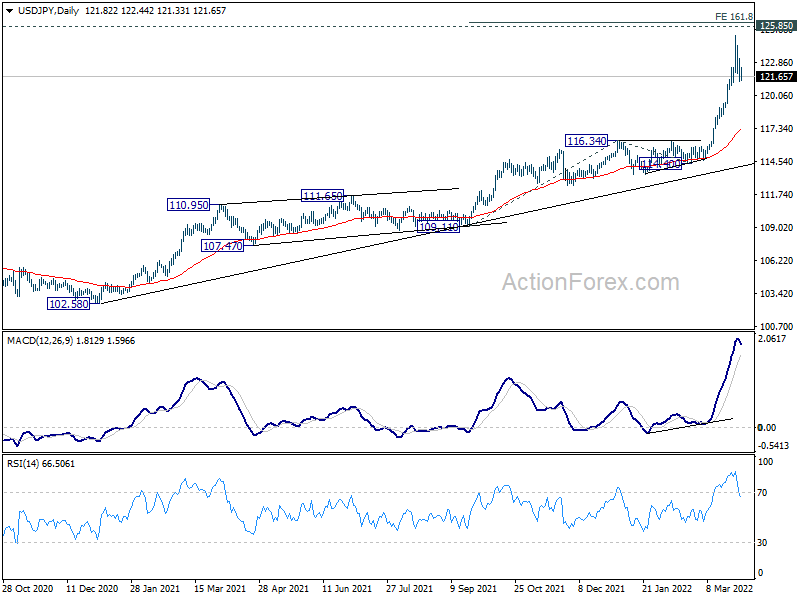
USD/JPY is holding on to 121.17 support and intraday bias remains neutral. Further rally is still mildly in favor. On the upside, above 125.09 will target 161.8% projection of 109.11 to 116.34 from 114.40 at 126.09, which is close to 125.85 long term resistance. However, break of 121.17 will indicate short term topping, and bring deeper pull back.
In the bigger picture, up trend from 98.97 (2016 low) in in progress for retesting 125.85 (2015 high). Sustained break there will confirm long term up trend resumption. Next target will be 61.8% projection of 75.56 (2011 low) to 125.85 (2015 high) from 98.97 at 130.04. This will now remain the favored case as long as 116.34 resistance turned support holds.
USD/CHF Mid-Day Outlook
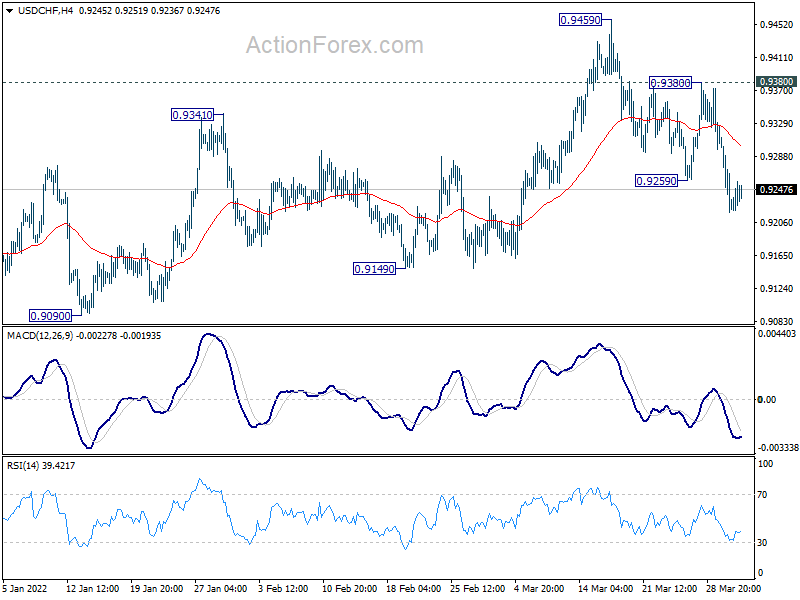
Daily Pivots: (S1) 0.9195; (P) 0.9258; (R1) 0.9295; More....
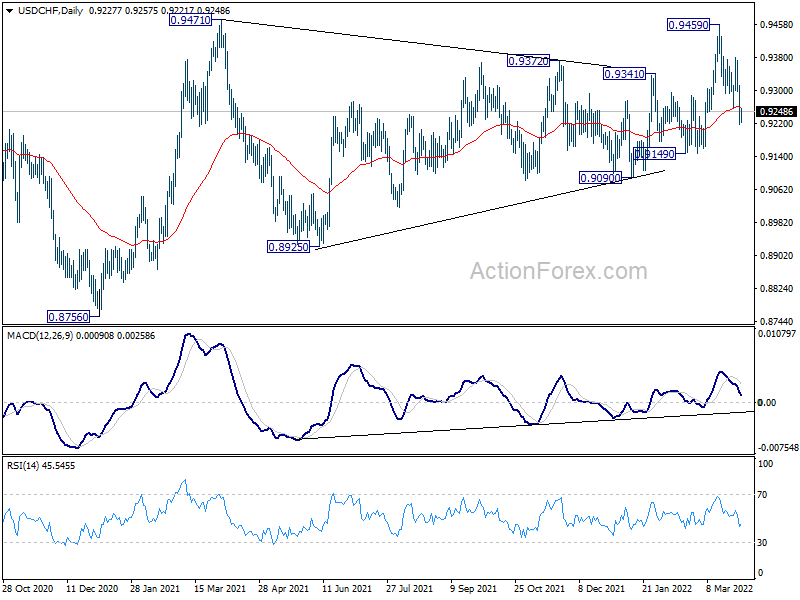
Intraday bias in USD/CHF stays on the downside, as fall from 0.9459 is in progress for 0.9149 support. Firm break there will turn near term outlook bearish for 0.9090 support and below. On the upside, above 0.9380 resistance will flip bias back to the upside for 0.9459 resistance instead.
In the bigger picture, medium term outlook will be neutral at best as long as 0.9471 resistance holds. Larger down trend could still extend through 0.8756 (2021 low). However, firm break of 0.9471 will argue that whole down trend form 1.0342 (2016 high), has completed with waves down to 0.8756. A medium term up trend should be set up to target 1.0237/0342 resistance zone.
GBP/USD Mid-Day Outlook
Daily Pivots: (S1) 1.3085; (P) 1.3134; (R1) 1.3185; More...
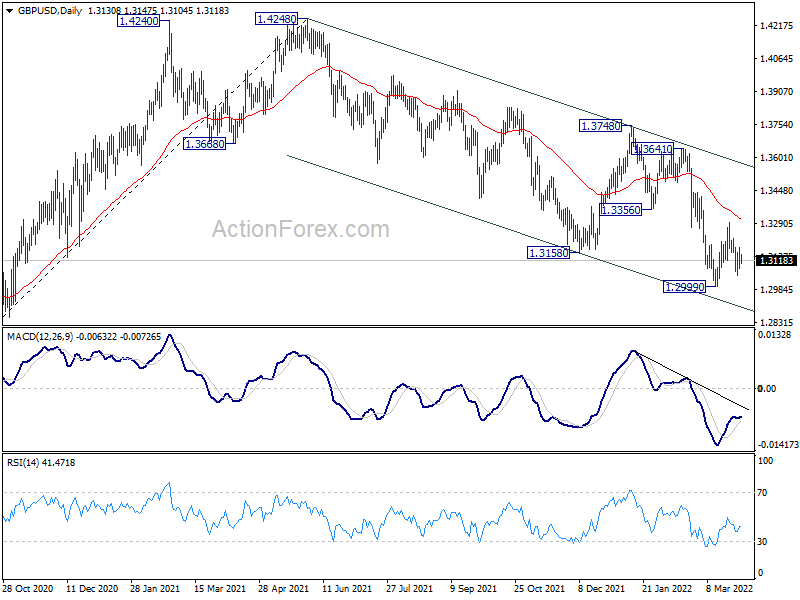
Sideway consolidation continues in GBP/USD and intraday bias remains neutral. Outlook remains bearish with 1.3297 resistance intact, and further decline is expected. On the downside, break of 1.2999 low will resume larger down trend from 1.4248. However, firm break of 1.3297 will turn bias back to the upside for stronger rebound.

In the bigger picture, current development suggests that the up trend from 1.1409 (2020 low) has completed at 1.4248. Decline from 1.4248 could still be a corrective move, or it could be the start of a long term down trend. In either case, deeper decline would be seen back to 61.8% retracement of 2.1161 to 1.1409 at 1.2493. In any case, break of 1.3748 resistance is needed to indicate medium term bottoming, or outlook will stay bearish.
EUR/USD Mid-Day Outlook
Daily Pivots: (S1) 1.1104; (P) 1.1137 (R1) 1.1192; More...
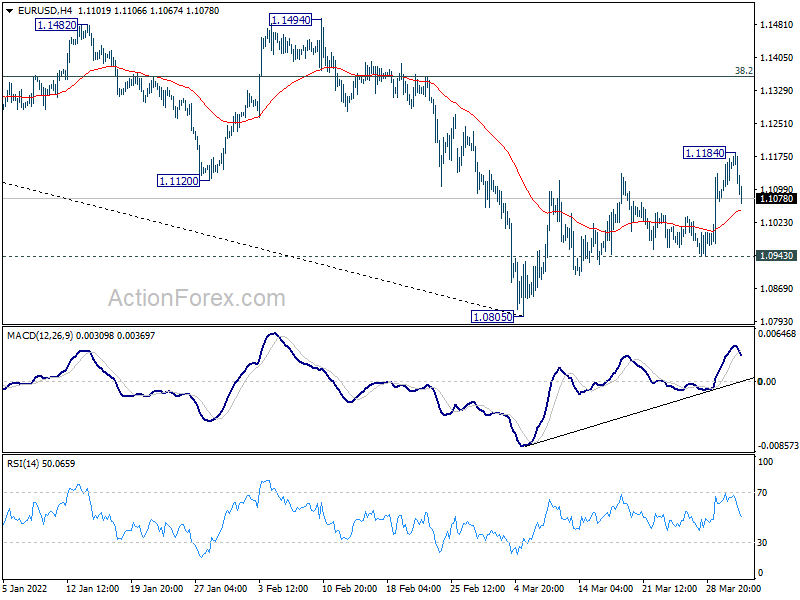
EUR/USD retreats notably after hitting 1.1184 today. Intraday bias is turned neutral first. For now, further rise is mildly in favor as long as 1.0943 support holds. Break of 1.1184 will resume the rebound from 1.0805 to 38.2% retracement of 1.2265 to 1.0805 at 1.1363. However, break of 1.0943 will revive near term bearishness and bring retest of 1.0805 low first.
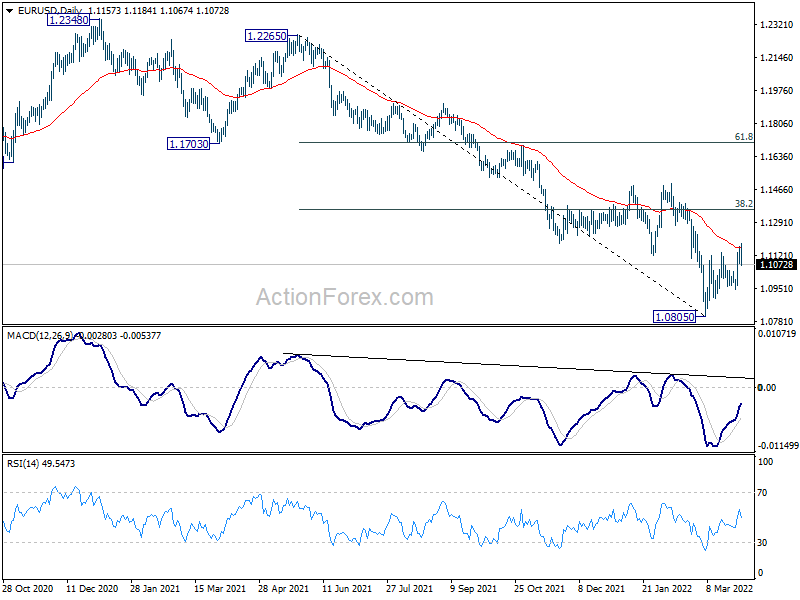
In the bigger picture, the decline from 1.2348 (2021 high) is expected to continue as long as 1.1494 resistance holds. Firm break of 1.0635 (2020 low) will raise the chance of long term down trend resumption and target a retest on 1.0339 (2017 low) next. Nevertheless, break of 1.1494 will maintain medium term neutral outlook, and extending term range trading first.
Dollar Rises after Job and Inflation Data, Euro Rally Falters
Dollar rises in early US session with help from solid job and strong inflation data. But Yen is even stronger as it continues to pare back recent steep losses. On the other hand, Euro turned weaker again as the rally attempt faltered. Underlying momentum in the common currency is very disappointing, mainly because the uncertainty over Ukraine remains uncleared. Commodity currencies also turned weaker on mild risk averse sentiments.
Technically, near term outlook in Euro pairs will be reassessed with today's retreats. For now, further rise will be in favor as long as 1.0943 support in EUR/USD, and 0.8924 support in EUR/GBP hold. However, break of 1.0184 support in EUR/CHF will revive near term bearishness for retesting 0.9977 low. Such development, if happens, could drag down EUR/USD and EUR/GBP too.
In Europe, at the time of writing, FTSE is down -0.25%. DAX is down -0.30%. CAC is down -0.44%. Germany 10-year yield is down -0.052 at 0.594. Earlier in Asia, Nikkei dropped -0.73%. Hong Kong HSI dropped -1.06%. China Shanghai SSE dropped -0.44%. Singapore Strait Times dropped -0.99%. Japan 10-year JGB yield dropped -0.0040 to 0.216.
US PCE inflation rose to 6.4% yoy, core PCE rose to 5.4% yoy
US personal income rose 0.5% mom or USD 101.5B in February, matched expectations. Spending rose 0.2% or USD 34.9B, below expectation of 0.6% mom.
The PCE price index for February increased 6.4% yoy, up from January's 6.0% yoy, but missed expectation of 6.7% yoy. The increase reflected rise in both goods and services. Excluding food and energy, core PCE price index was at 5.4% yoy, up from January's 5.2% yoy, slightly below expectation of 5.5% yoy. Energy prices rose 25.7% yoy while food prices rose 8.0% yoy.
US initial jobless claims rose to 202k, continuing claims dropped to 1.307m
US initial jobless claims rose 14k to 202k in the week ending March 26, slightly above expectation of 200k. Four-week moving average of initial claims dropped -3.6k to 208.5k.
Continuing claims dropped -35k to 1307k in the week ending March 19. That's the lowest level since December 27, 1969, when it was 1304k. Four-week moving average of continuing claims dropped -41k to 1389k, lowest since February 7, 1970.
Canada GDP grew 0.2% mom in Jan, to rise further 0.8% in Feb
Canada GDP grew 0.2% mom in January, a below expectation of 0.4% mom. But that's still the eight month of increase in a row. Goods-producing industries grew 0.8% mom. Services-producing industries rose 0.0% mom. Overall, 9 of 20 industrial sectors increased in January.
Statistics Canada said advance information indicates an approximate 0.8% expansion in real GDP in February. Notable increases were observed in the manufacturing sector as well as in mining, quarrying, and oil and gas extraction, accommodation and food services, and construction.
ECB Lane: Important for optionality to be two-sided
ECB Chief Economist Philip Lane said in a speech, "the Governing Council sees it as increasingly likely that inflation will stabilise at our two per cent target over the medium term". Under this pathway, 'the degree of monetary policy stimulus put in place to address the pre-pandemic challenge of persistent below-target inflation can be normalised in a gradual fashion towards a more neutral setting."
"In current conditions, it is especially important to remain data-dependent and for optionality to be two-sided," he said. "On the one side, we should ensure that our policy settings are adjusted if de-anchored inflation expectations, an intensification in catch-up wage dynamics or a persistent deterioration in supply capacity threaten to keep inflation above target in the medium term."
"On the other side, we should also be fully prepared to appropriately revise our monetary policy settings if the energy price shock and the Russia-Ukraine war were to result in a significant deterioration in macroeconomic prospects and thereby weaken the medium-term inflation outlook."
Eurozone unemployment rate dropped to 6.8% in Feb, EU dropped to 6.2%
Eurozone unemployment rate dropped from 6.9% to 6.8% in February, above expectation of 6.7%. EU unemployment rate also dropped from 6.3% to 6.2%. Eurostat estimates that 13.267 million men and women in the EU, of whom 11.155 million in the euro area, were unemployed in February 2022. Compared with January 2022, the number of persons unemployed decreased by 221 000 in the EU and by 181 000 in the euro area.
Also released from Europe, Germany retail sales rose 0.3% mom in February, versus expectation of 0.8% mom. Germany unemployment rate was unchanged at 5.0% in March. Italy unemployment rate dropped from 8.8% to 8.5% in February. France consumer spending rose 0.8% mom in February, versus expectation of 0.9% mom. Swiss retail sales rose 12.8% yoy in February, versus expectation of 5.3% yoy. UK Q4 GDP growth was finalized at 1.3% qoq.
Japan industrial production rose 0.1% mom in Feb, to expand further in Mar
Japan industrial production rose 0.1% mom in February, below expectation of 0.5% mom. That's nonetheless the first rise in three months. index of production stood at 95.8, against the 2015 base of 100.
Auto production rose 10.9% mom, after plunging -17.3% mom in January. Output of transport equipment rose 7.9% mom. Chemical products dropped -9.6%.
Looking ahead, the Ministry of Economy, Trade and Industry expects output to keep expanding, up 3.6 percent in March and 9.6 percent in April, respectively, based on a poll of manufacturers.
China PMI manufacturing dropped to 49.5 in Mar, services dropped to 48.4
China official PMI manufacturing dropped from 50.2 to 49.5 in March, below expectation of 50.0. PMI non-manufacturing dropped from 51.6 to 48.4, below expectation of 50.7. Both indexes were below 50 level together for the first time since the start of the pandemic in February 2020.
"Recently, clusters of epidemic outbreaks have occurred in many places in China, and coupled with a significant increase in global geopolitical instability, production and operation of Chinese enterprises have been affected," said Zhao Qinghe, senior NBS statistician.
EUR/USD Mid-Day Outlook
Daily Pivots: (S1) 1.1104; (P) 1.1137 (R1) 1.1192; More...
EUR/USD retreats notably after hitting 1.1184 today. Intraday bias is turned neutral first. For now, further rise is mildly in favor as long as 1.0943 support holds. Break of 1.1184 will resume the rebound from 1.0805 to 38.2% retracement of 1.2265 to 1.0805 at 1.1363. However, break of 1.0943 will revive near term bearishness and bring retest of 1.0805 low first.
In the bigger picture, the decline from 1.2348 (2021 high) is expected to continue as long as 1.1494 resistance holds. Firm break of 1.0635 (2020 low) will raise the chance of long term down trend resumption and target a retest on 1.0339 (2017 low) next. Nevertheless, break of 1.1494 will maintain medium term neutral outlook, and extending term range trading first.
Economic Indicators Update
| GMT | Ccy | Events | Actual | Forecast | Previous | Revised |
|---|---|---|---|---|---|---|
| 23:50 | JPY | Industrial Production M/M Feb P | 0.10% | 0.50% | -0.80% | |
| 00:30 | AUD | Building Permits M/M Feb | 43.50% | 9.00% | -27.90% | -27.10% |
| 00:30 | AUD | Private Sector Credit M/M Feb | 0.60% | 0.70% | 0.60% | |
| 01:00 | CNY | NBS Manufacturing PMI Mar | 49.5 | 50 | 50.2 | |
| 01:00 | CNY | Non-Manufacturing PMI Mar | 48.4 | 50.7 | 51.6 | |
| 05:00 | JPY | Housing Starts Y/Y Feb | 6.30% | 1.10% | 2.10% | |
| 06:00 | EUR | Germany Retail Sales M/M Feb | 0.30% | 0.80% | 2.00% | 1.40% |
| 06:00 | GBP | GDP Q/Q Q4 F | 1.30% | 1.00% | 1.00% | |
| 06:00 | GBP | Current Account (GBP) Q4 F | -7.3B | -19.0B | -24.4B | |
| 06:30 | CHF | Real Retail Sales Y/Y Feb | 12.80% | 5.30% | 5.10% | 5.70% |
| 06:45 | EUR | France Consumer Spending M/M Feb | 0.80% | 0.90% | -1.50% | -2.00% |
| 07:55 | EUR | Germany Unemployment Change Mar | -18K | -20K | -33K | |
| 07:55 | EUR | Germany Unemployment Rate Mar | 5.00% | 5.00% | 5.00% | |
| 08:00 | EUR | Italy Unemployment Rate Feb | 8.50% | 8.70% | 8.80% | |
| 09:00 | EUR | Eurozone Unemployment Rate Feb | 6.80% | 6.70% | 6.80% | 6.90% |
| 12:30 | CAD | GDP M/M Jan | 0.20% | 0.40% | 0.00% | 0.10% |
| 12:30 | USD | Initial Jobless Claims (Mar 25) | 202K | 200K | 187K | 188K |
| 12:30 | USD | Personal Income M/M Feb | 0.50% | 0.50% | 0.00% | 0.10% |
| 12:30 | USD | Personal Spending M/M Feb | 0.20% | 0.60% | 2.10% | 2.70% |
| 12:30 | USD | PCE Price Index M/M Feb | 0.60% | 0.60% | ||
| 12:30 | USD | PCE Price Index Y/Y Feb | 6.40% | 6.70% | 6.10% | 6.00% |
| 12:30 | USD | Core PCE Price Index M/M Feb | 0.40% | 0.40% | 0.50% | |
| 12:30 | USD | Core PCE Price Index Y/Y Feb | 5.40% | 5.50% | 5.20% | |
| 13:45 | USD | Chicago PMI Mar | 56.4 | 56.3 | ||
| 14:30 | USD | Natural Gas Storage | 23B | -51B |
US PCE inflation rose to 6.4% yoy, core PCE rose to 5.4% yoy
US personal income rose 0.5% mom or USD 101.5B in February, matched expectations. Spending rose 0.2% or USD 34.9B, below expectation of 0.6% mom.
The PCE price index for February increased 6.4% yoy, up from January's 6.0% yoy, but missed expectation of 6.7% yoy. The increase reflected rise in both goods and services. Excluding food and energy, core PCE price index was at 5.4% yoy, up from January's 5.2% yoy, slightly below expectation of 5.5% yoy. Energy prices rose 25.7% yoy while food prices rose 8.0% yoy.