Sample Category Title
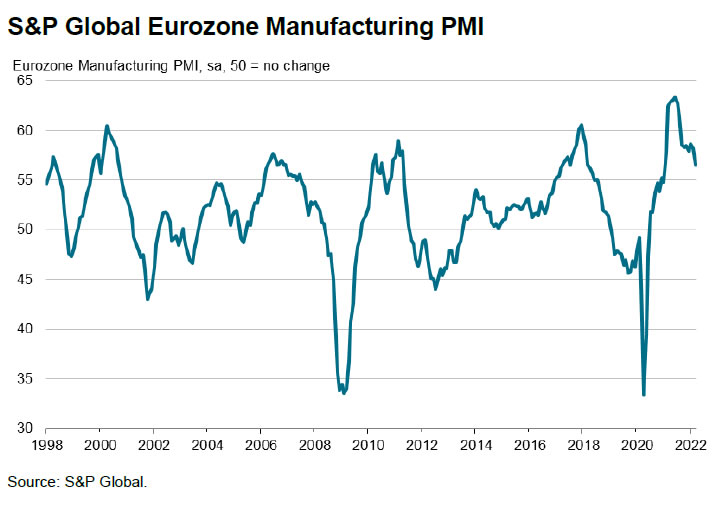
Eurozone CPI rose to 7.5% yoy, core CPI up to 3.1% yoy
Eurozone CPI accelerated sharply from 5.9% yoy to record high at 7.5% yoy in March, above expectation of 6.5% yoy. Core CPI also rose from 2.7% yoy to 3.0% yoy, but missed expectation of 3.1% yoy.
Looking at the main components of Eurozone inflation, energy is expected to have the highest annual rate (44.7%, compared with 32.0% in February), followed by food, alcohol & tobacco (5.0%, compared with 4.2% in February), non-energy industrial goods (3.4%, compared with 3.1% in February) and services (2.7%, compared with 2.5% in February).
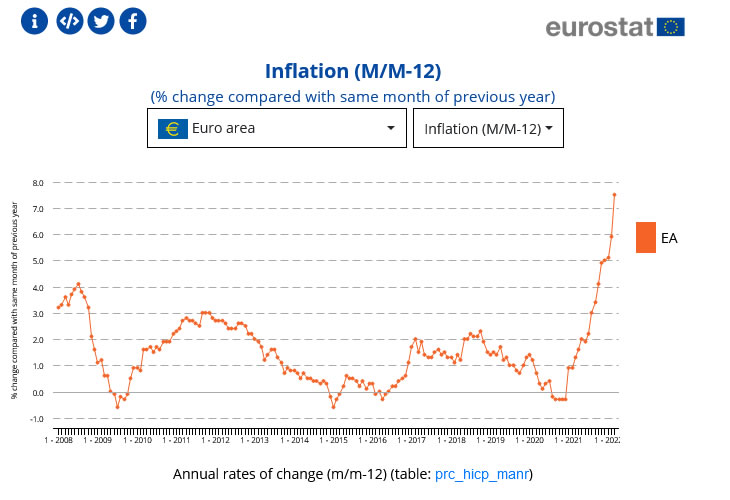
UK PMI manufacturing finalized at 55.2, hit by several headwinds simultaneously
UK PMI manufacturing was finalized at 13-month low of 55.2, down from February's 58.0. S&P Global said new export orders contracted for the second month running. Inflationary pressures strengthened.
Rob Dobson, Director at S&P Global, said: "Manufacturers are being hit by several headwinds simultaneously, as supply shortages, greater caution among clients, escalating inflationary pressures, ongoing Brexit factors and rising geopolitical tensions all hamper the upturn. It is therefore little surprise that business optimism has slumped to a 14-month low."
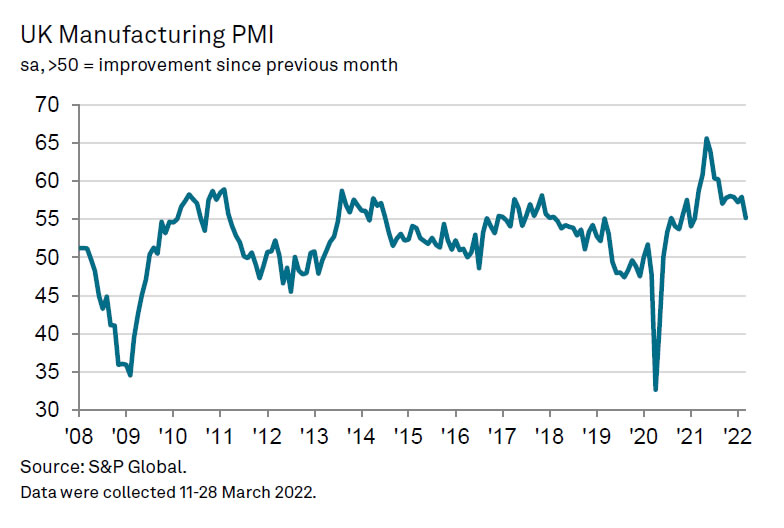
Eurozone PMI manufacturing finalized at 56.5, Ukraine war an ominous new headwind
Eurozone PMI Manufacturing was finalized at 56.5 in March, down from February's 58.2, hitting a 14-month low. Looking at some member states, Germany PMI manufacturing dropped to 18-month low at 56.9. Italy dropped to 14-month low at 55.8. France dropped to 5-month low at 54.7.
Chris Williamson, Chief Business Economist at S&P Global said: "Just as the fading of the latest pandemic wave was creating a tailwind for the eurozone manufacturing recovery, with economies re-opening and supply chain bottlenecks easing, the war In Ukraine has created an ominous new headwind."
Japanese Yen Slips, NFP Next
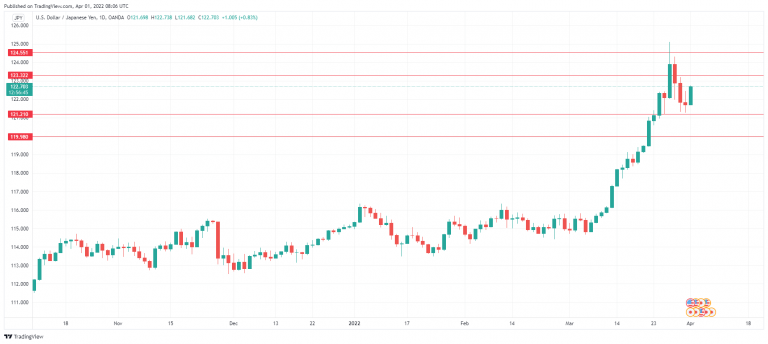
The Japanese yen has reversed directions and is down sharply on Friday. In the European session, USD/JPY is trading at 122.68, up 0.81% on the day.
All eyes are on US nonfarm payrolls, with an estimate of 490 thousand jobs. The reading could have a significant impact on the size of upcoming rate hikes – a print of 600K or higher will bolster the arguments for a series of 50-base point hikes.
Yen volatility continues
It has been a busy week for the yen, and there hasn’t been any letup today. USD/JPY jumped as high as 100 points today, as the dollar has recovered yesterday’s losses. This reversal in direction can be attributed in part to financial year-end repatriation flows. This led to the yen rising earlier in the week, but a reversal in the flows today has sent the yen lower.
The yen went on a roller-coaster ride this week, climbing as much as 300 points on Monday and hitting its lowest level in almost six years, as USD/JPY punched past the 125 line. The yen has since recovered, as the BoJ stepped in and defended the yield curve. The Bank can give itself a pat on the back and declare ‘Mission Accomplished’, as the 10-year JGB has dropped to 0.20%, below the BoJ’s red line of 0.25%. Still, I wouldn’t be surprised if the yen’s downswing resumes. The Japanese economy is not in good shape, and BoJ Governor Kuroda said this week that he is in favor of a low yen.
The thinking behind Kuroda’s stance is that a lower yen makes Japanese exports more competitive. That’s true, but the other side of the coin is that a weak yen has pushed up import costs and contributed to higher inflation. Although inflationary pressures pale in comparison to the US or the UK, household incomes are feeling the pinch of higher inflation and this has hurt consumer spending and confidence.
USD/JPY Technical
- With USD/JPY rising sharply, 121.21 has some breathing room in support. 119.98 is the next support line.
- There is resistance at 123.32 and 124.55
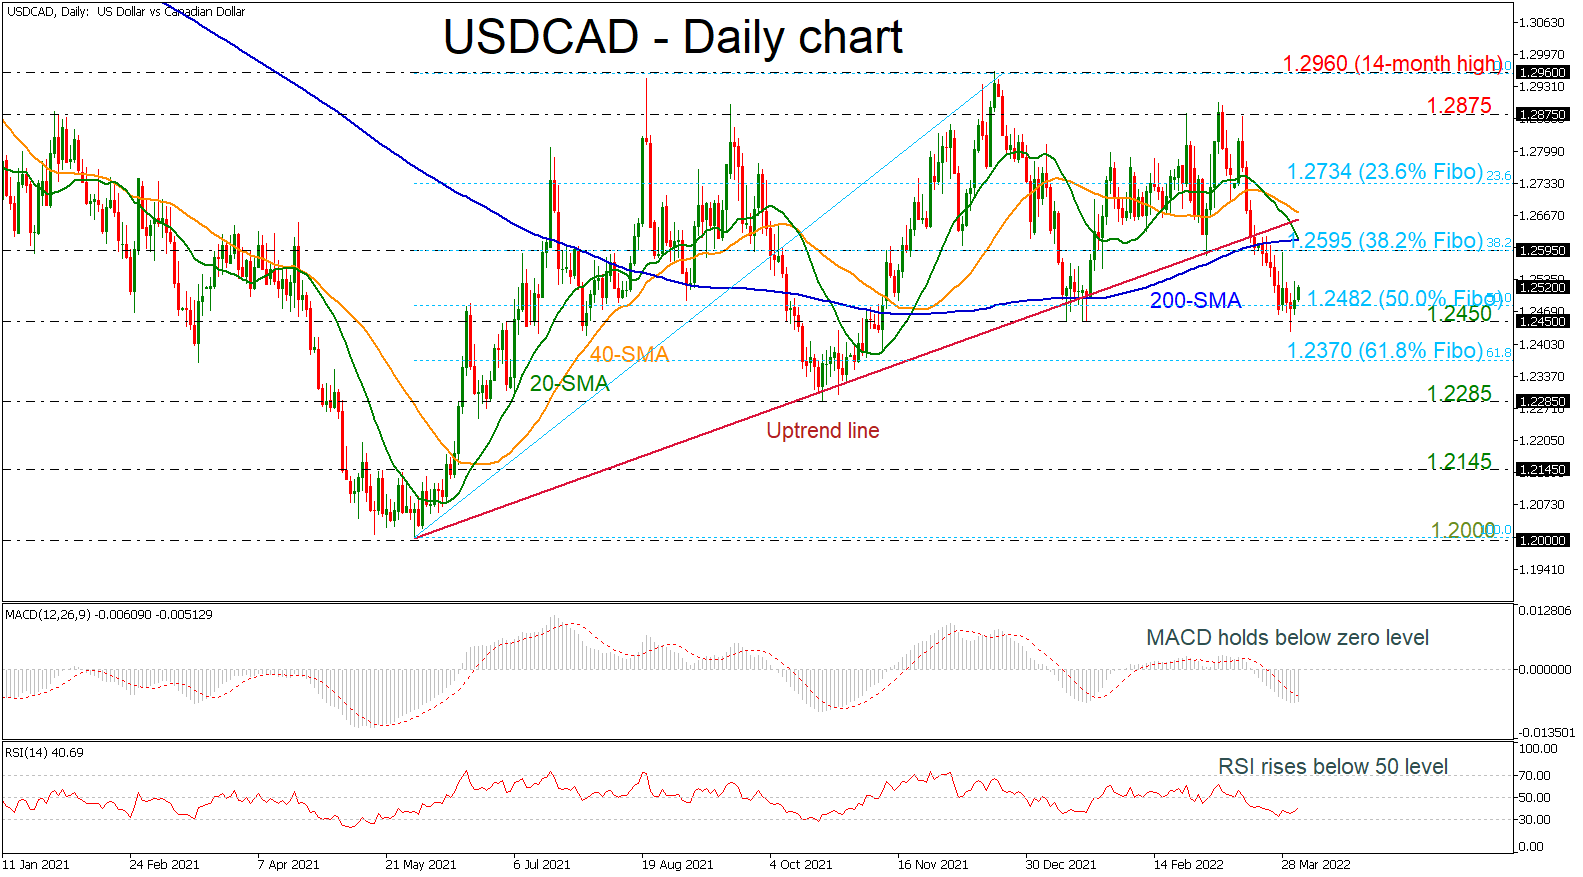
USDCAD Rebounds Off 1.2450 But Remains Below Uptrend Line
USDCAD has been heading south over the last two weeks, reaching the 50.0% Fibonacci retracement level of the up leg from 1.2000 to 1.2960 at 1.2482. The price also declined beneath the long-term uptrend line and the 200-day simple moving average (SMA) but has found support at the 1.2450 barrier over the last couple of days.
In trend indicators, the 20- and 40-day SMAs completed a bearish crossover, confirming the bearish view in the near term. The MACD oscillator is trying to overcome its trigger line, remaining below the zero line. The RSI is holding in the negative territory but is showing some optimism for a positive move.
A move to the upside could see immediate resistance at the 38.2% Fibonacci of 1.2595 and the 200-day SMA at 1.2614 but should the market increase positive momentum above this area, the 40-day SMA at 1.2678 could be the next level in focus. A stronger barrier, though, could be found at the 23.6% Fibonacci of 1.2734 since any strong violation of this point could increase chances for further gains, probably towards the previous peak of 1.2875.
In case of more negative pressures, the market could meet support at the 1.2450 barrier before it moves lower to the 61.8% Fibonacci of 1.2370. A successful close below this level could see a retest of the previous low of 1.2285, while in case of steeper declines, the pair could breach this trough, diving to the 1.2145 level.
Turning to the short-term picture, the market seems to be in a bearish mode given that the price is trading below the 200-day SMA. Any advances back above the downtrend line, there is hope that the market could return to the bullish phase.
Daily Technical Analysis
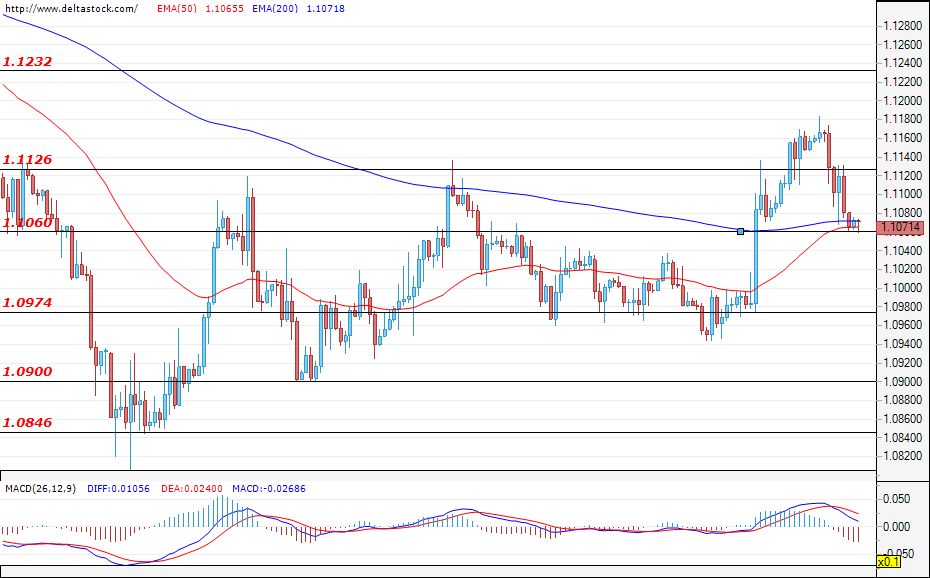
EUR/USD
In the early hours of the European session, the single European currency continued its corrective move, which began at the end of the day on Monday this week, and reached the support of 1.1060. For the time being, the bears have the higher ground as the expectations for today’s labour force data (12:30 GMT) are in favour of the dollar. If we see this level holding its ground, then the rally might continue towards the levels at around 1.1180 and 1.1230, but if the pressure continues, then we can see the formation of a bottom below the previous price of 1.0974.
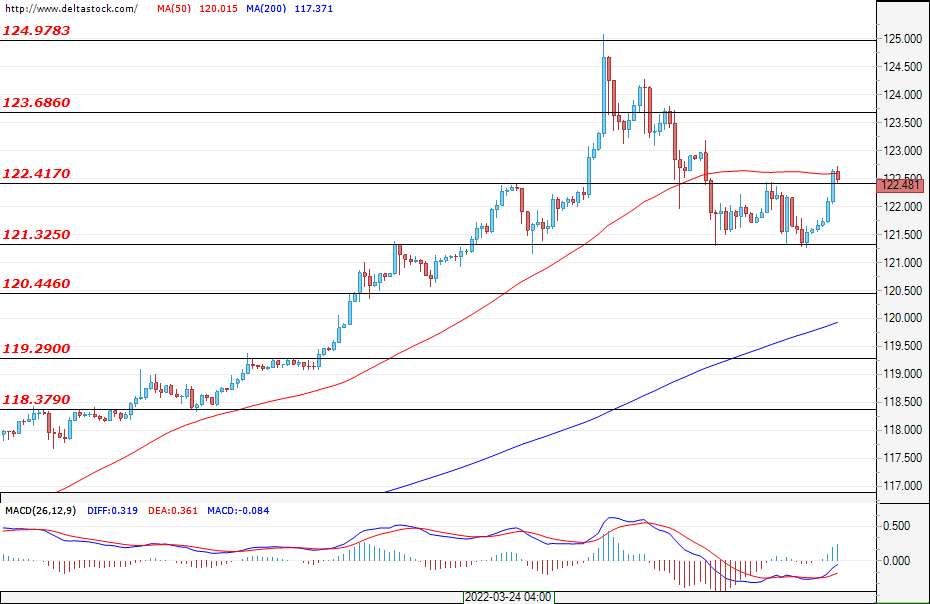
USD/JPY
The swing zone at 122.41 gave traders a brief pause, but it was breached earlier this week and the price rose towards the swing peaks, returning to the 2015 levels at around 125.10. In today's session, however, the bears were fully in control of the Ninja and the pair continued its decline, reaching a bottom of 121.32. In the coming days, if the 121.10 level withstands the pressure, then the resumption of the upward movement is highly probable and the previous prices could be easily surpassed. If the support does not last, however, then the correction will likely deepen towards the levels at around 120.44 or even at 119.29, depending on its longevity.
GBP/USD
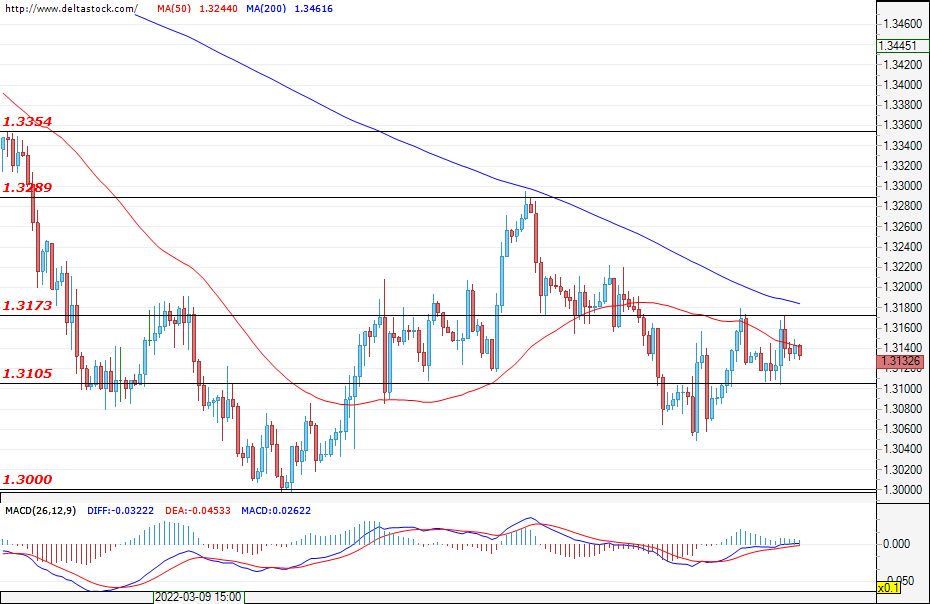
The second attempt of the sterling to continue its growth in the European session was compromised by traders willing to sell at levels at around 1.3175. This pushed the currency in the next few hours towards the support at around 1.3105, where the pound stabilised and bounced back up nearly 70 pips. If the support remains unbreached, then we can see growth spring back up towards 1.3290 and 1.3354 in an extension. However, if the downward trend continues and the pair goes below the levels of 1.3105, then the decline may continue beyond the bottom reached on March 30th and could even sink further than that towards the support of 1.3000.
EUGERMANY40
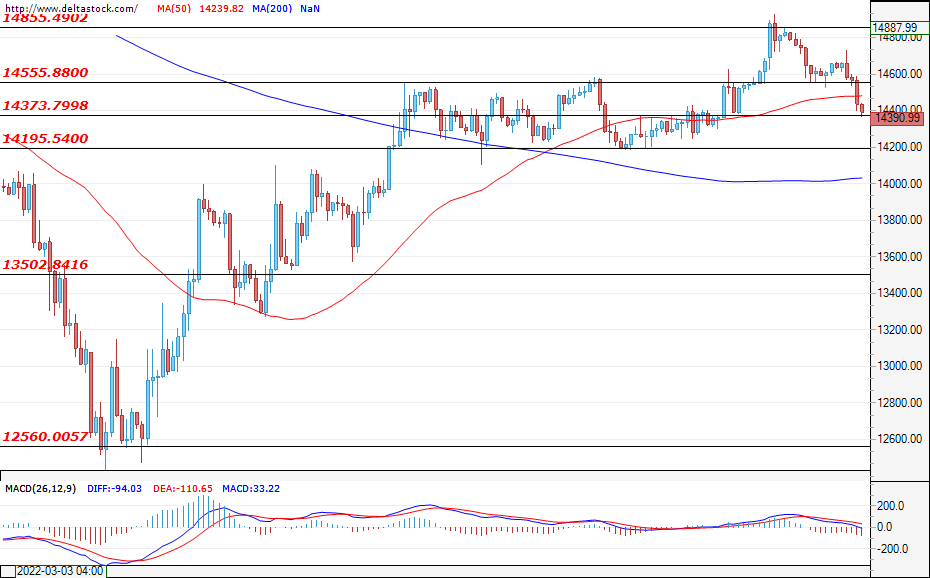
The German index continued its decline as soon as the European session began. The bears were in control all day long, breaching the support at 14555 and forcing the index to close at 14373. If the downward trend continues in the first session of April as well and the support of 14200 does not last, then we may soon see prices sink towards the level of about 13500. However, if the news of the ongoing conflict in Ukraine is positive, then the index may find just enough strength to rise towards price levels at around 14855.
US30
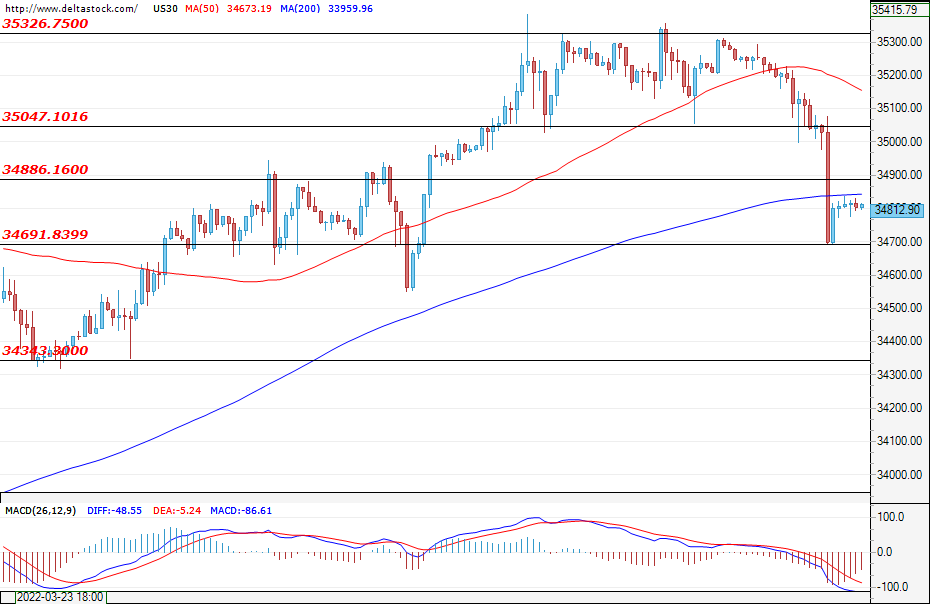
The clear lack of signals indicating the de-escalation of tensions between Russia and Ukraine still worries investors and the whole session was seized by the bears. They subsequently breached the support at 34886 and reached the bottom at 34670, where the index’s decline has been limited for now. If the bottom level holds off the attack, then we could see a return towards the levels of 35050 and 35326 in an extension, but if the downward trend continues in the first week of April, then we can expect the index to reach 34343 again.
US Dollar Index Tilts Higher ahead of Non-Farm Payrolls Data
The US dollar held steady in the overnight session after President Putin signed a decree demanding that unfriendly countries pay for its oil in rubles. The decision puts most of its buyers, especially the European Union at risk considering that its leaders have opposed the plan. In a statement, the International Monetary Fund (IMF) also warned that the sanctions implemented on Russia could erode the currency’s dominance in commerce. Indeed, in the past few years, many central banks have increased their holdings of gold in a bid to diversify from the dollar.
The US dollar and US stocks will react to the latest non-farm payrolls numbers that will come out on Friday. Economists expect these numbers to reveal that the country’s economy continued to add thousands of jobs in March. According to Reuters, the average estimate is that the economy added over 500k jobs while the unemployment rate declined to 3.7%. Wages are also expected to have increased by over 5.5%. On Thursday, numbers by the Bureau of Labor Statistics revealed that the country’s initial jobless claims rose by 202k in the previous week.
The economic calendar will have several important numbers today. Markit will publish the final reading of its March PMI data. Based on the preliminary numbers that came out last week, analysts expect that the manufacturing PMI held steady even as manufacturers warned about inflation and the rising cost of doing business. Other important data to watch will be the flash EU inflation data for March. Analysts believe that the CPI rose from 5.9% to 6.6%. Other data to watch will be last week’s oil rig count by Baker Hughes.
EURUSD
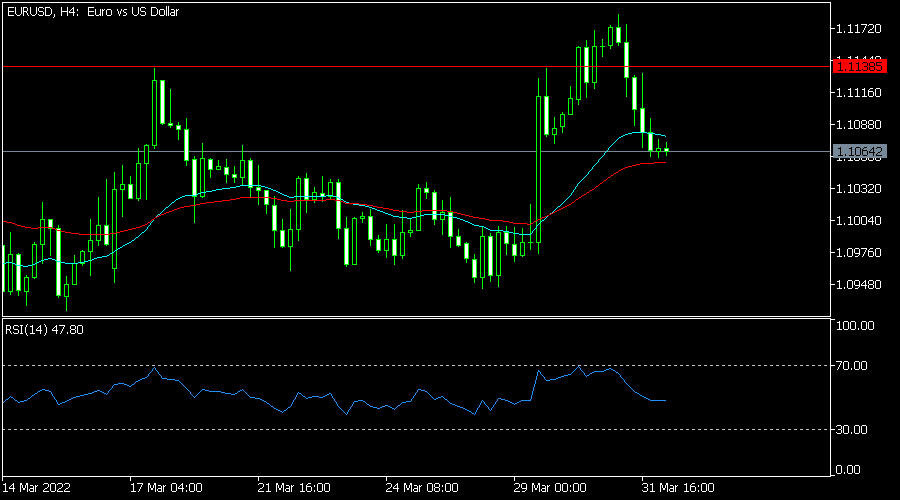
The EURUSD pair declined as investors waited for the upcoming US non-farm payroll data. It is trading at 1.1063, which is slightly below its highest point this week. It also declined below the important resistance point at 1.1138. The pair is between the 50% and 38.2% Fibonacci retracement level while the Relative Strength Index (RSI) has declined slightly. Therefore, the pair will likely continue falling ahead of the NFP data.
USDCHF
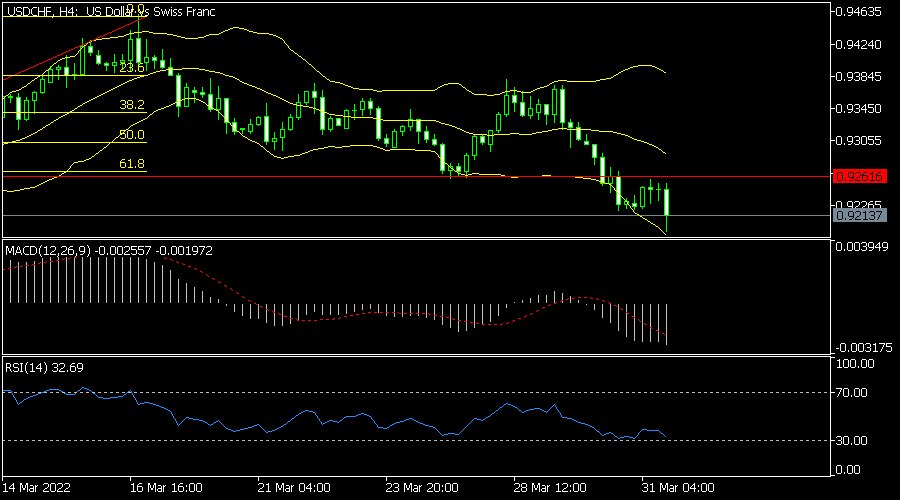
The USDCHF pair tumbled to the lowest point at 0.9195, which was the lowest level since March 8. The pair is along the lower line of the Bollinger Bands and the 61.8% Fibonacci retracement level. It also moved slightly below the 25-day and 50-day moving averages. Oscillators moved to the oversold level. Therefore, the pair will likely keep falling ahead of the NFP and Swiss PMI data.
XNGUSD
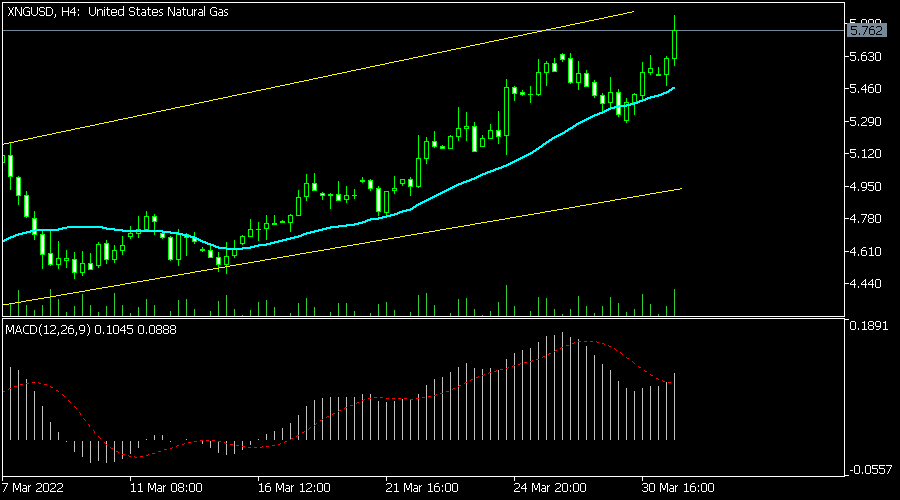
The XNGUSD pair rose sharply as investors priced in more gas shortages in the near term. The pair rose to a high of 5.78, which was sharply higher above its lowest level this year. It also rose above the short and longer-term moving averages and the upper side of the ascending channel that is shown in yellow. Its MACD also moved above the neutral level. Therefore, the pair will likely keep rising in the near term.
US 30 Keeps High Ground
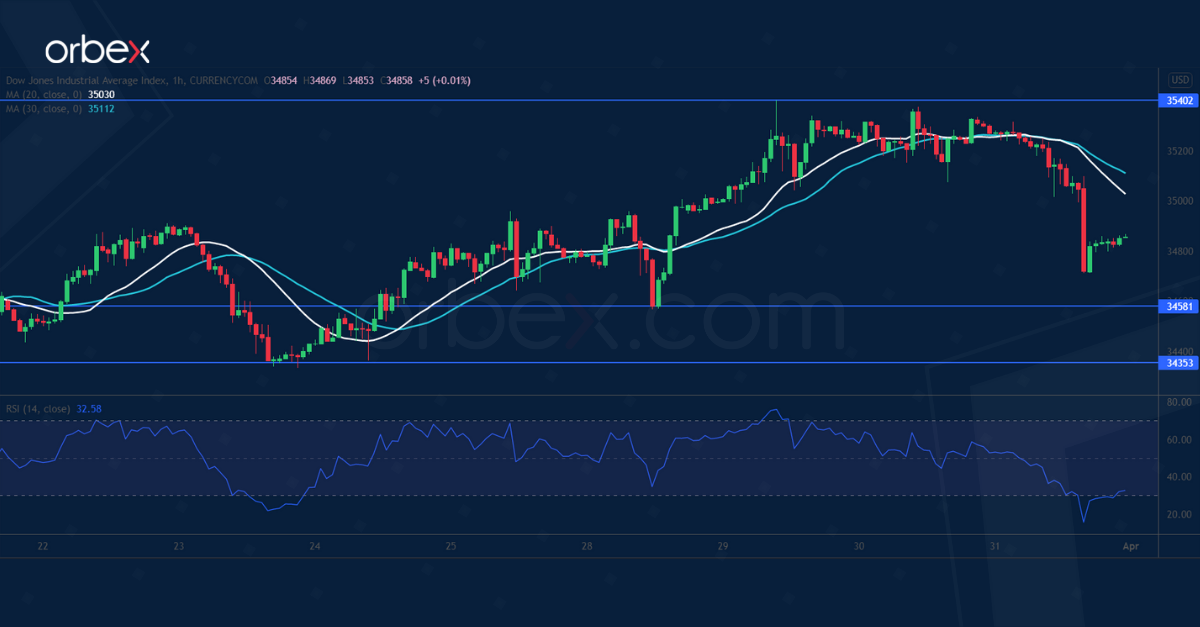
The Dow Jones 30 retreats on profit-taking as the first quarter draws to an end. A bullish MA cross on the daily chart suggests that the rebound is picking up steam.
The index hit resistance around 35400 and went horizontal, allowing the bulls to take a breather. Buyers may find relief as the RSI tanks into the oversold area.
A rebound would propel the Dow to February’s high at 35870, where a bullish breakout could resume the uptrend in the medium term. The demand area between 34350 and 34580 is an important level.
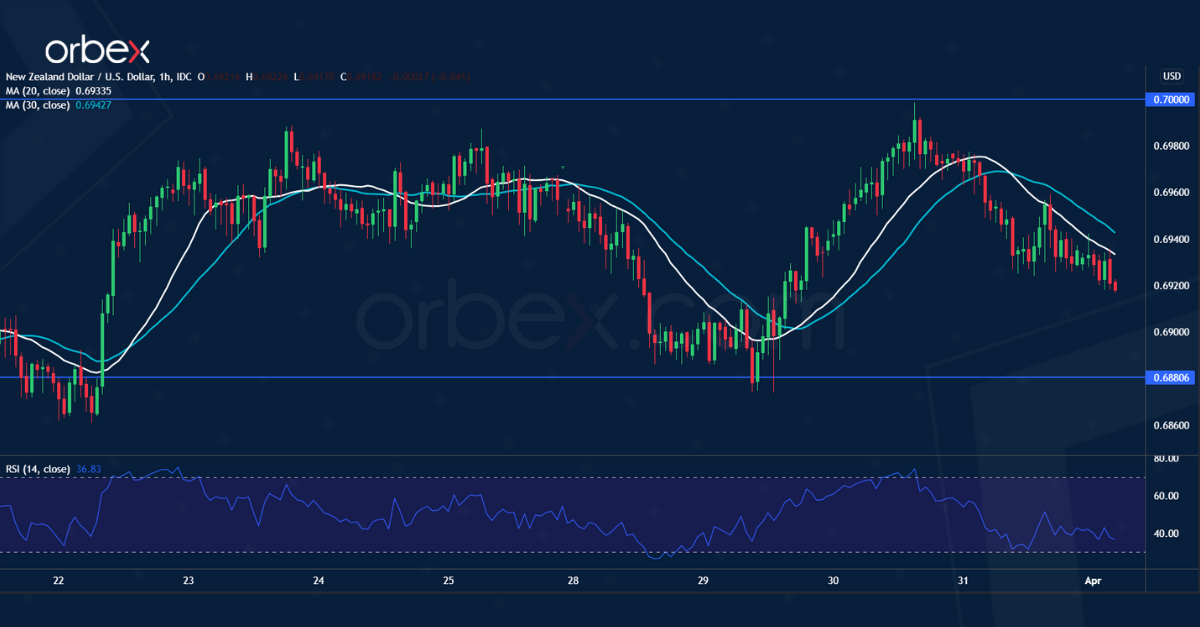
NZD/USD Sees a Limited Pullback
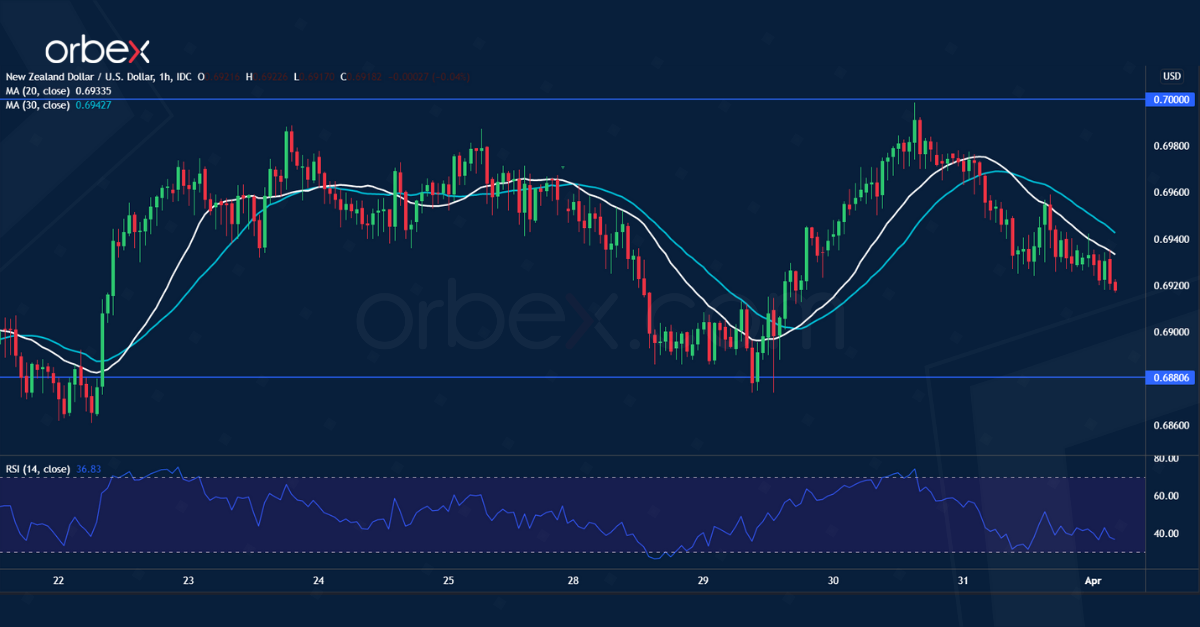
The New Zealand dollar falls back as risk appetite subdues. The pair hit resistance under the psychological level of 0.7000 after it broke to a new high.
The RSI’s overbought condition in this supply zone led buyers to take profit, driving the kiwi lower momentarily. Trend followers may see the retracement as a buying opportunity.
Sentiment would stay bullish as long as the pair is above the previous low at 0.6880. A bearish breakout may dent short-term optimism and send the kiwi to 0.6790.
GBP/USD Attempts to Rebound
The US dollar went sideways as February’s PCE fell short of expectations. The pair met stiff selling pressure around 1.3300, a supply zone next to the 30-day moving average.
A break below 1.3120 may have cast doubt on the viability of the previous rebound after short-term buyers rushed to the exit. 1.3220 is now a fresh resistance and buyers’ failure to lift these offers could send the pound into a deeper correction.
Price action may revisit the psychological level of 1.3000 if it drops below 1.3070.