Sample Category Title
Eco Data 3/31/22
[php_everywhere instance="1"]
Could Flash Eurozone CPI Inflation Amplify Euro’s Rebound?
Flash CPI inflation data for March will feature the Eurozone’s economic calendar on Friday at 10:00 GMT. The already boiling inflation is expected to heat up to a new record high, but the news may not shock investors as they are already expecting a second round of price increases in the face of the Ukrainian geopolitical crisis. Besides, with futures markets pricing a hawkish ECB at the end of the year, even as the growth outlook remains fragile, the euro could get little support from the data.
Eurozone CPI inflation to hit fresh record high
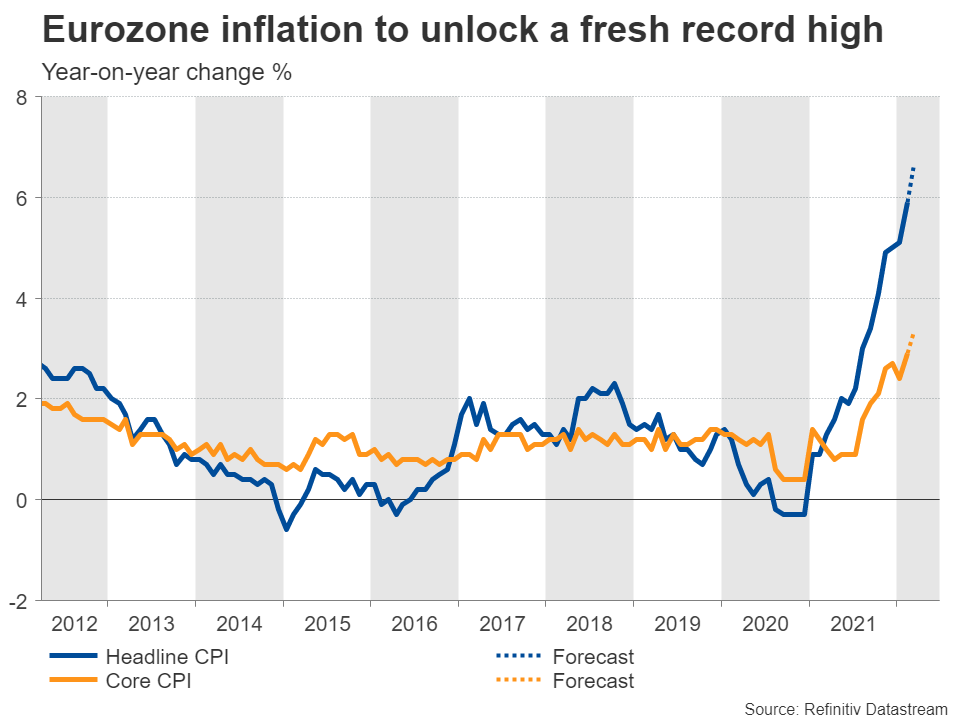
In February, the headline consumer price index rose faster than expected in the Eurozone at a record annual rate of 5.9%, mainly on the back of higher gas and electricity prices. The next CPI release for March may not be better as analysts estimate inflation to surge to a new all-time-high of 6.6% y/y, further deviating from the central bank’s average 2.0% target. The core measure, which excludes volatile food and energy prices, is expected to distance above that threshold as well, advancing from 2.9% to 3.3% y/y. Meanwhile, Spain and Germany have already reported much stronger-than-expected CPI data on Wednesday, therefore an upside surprise on Friday would not be very surprising.
ECB may not get surprised; growth outlook uncertain
Nevertheless, the European Central Bank (ECB) has already admitted that inflation will remain elevated at high rates over the course of the year. Perhaps, fading base effects may imply some declines in the second half of the year, though in the meantime, further increases cannot be ruled out either as the sanctions war against Russia and military conflicts in Ukraine keep feeding the advance in wholesale gas futures. Hence, businesses could gradually pass the extra production cost to consumers.
The question that arises at this point is how the central bank will handle the inflation situation if price growth holds stubbornly well above its target. Some policymakers have recently attempted to raise the stakes for a rate hike in the second half of the year, while futures markets are optimistic that the ECB will deliver around 65 bps of monetary tightening by the end of the year. That implies six 10bps rate hikes from June to December, which could drive the benchmark rate up to 0.1%.
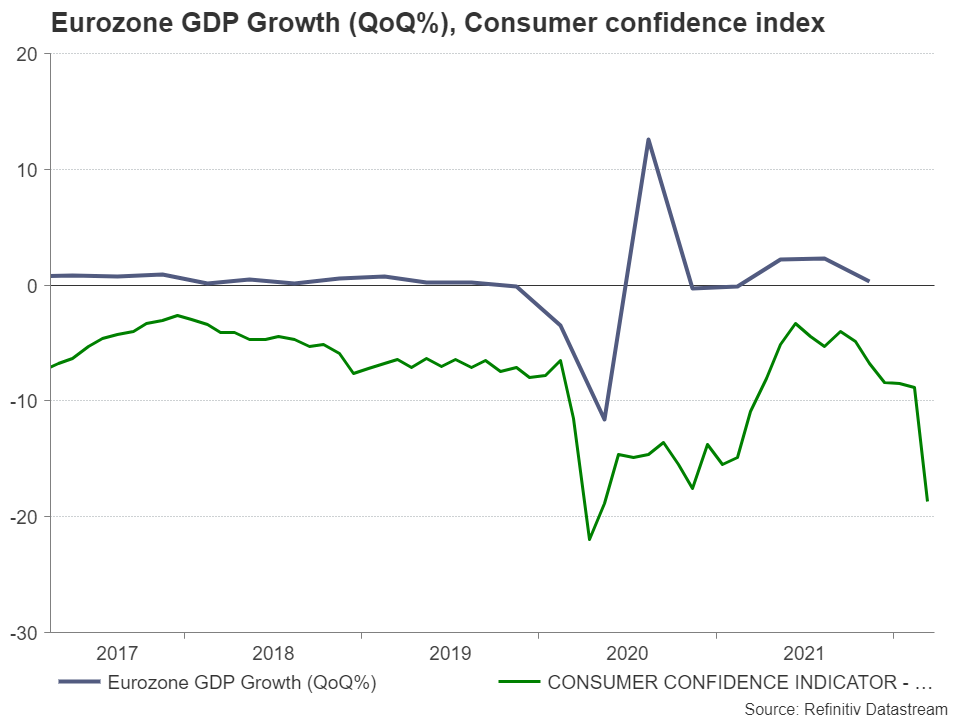
On the other hand, given the fragile and crucially Ukraine-dependent economic outlook in the region, the above rate hike scenario looks too aggressive, and the central bank can only act on the basis of incoming data. Household consumption could become more cautious in the face of higher commodity and electricity prices, which account for 90% of the processed food industry. Following a dip at the end of 2021, monthly retail sales did not grow as fast as analysts expected in January, mirroring careful spending tendencies. More recently, preliminary consumer confidence data out of the Eurozone slumped to the lowest since June 2020 in March, reflecting persisting caution among consumers.
Of note, as in the case of the US, the spread of the 10- and 2-year government bond yields has inverted but is still comfortably above the 2008 and 2020 lows. Therefore, in technical terms, a recession does not seem to be around the corner yet.
EUR/USD
Turning to FX markets, on Tuesday the euro cheered on news that Russia may reduce military activity near Kyiv and on hopes that ongoing peace talks may finally prepare the ground for a meeting between Putin and Zelensky. The Spanish and German CPI figures provided only a short-lived boost to the common currency despite flying well above forecasts. Hence, the bloc’s March inflation report is partially unencrypted, and Friday’s results may add nothing new to investors’ knowledge. Instead, the Ukrainian story could be a bigger challenge for the bloc’s outlook as ECB governing council member Gabriel Makhlouf said on Wednesday, and therefore a bigger market mover for the euro.
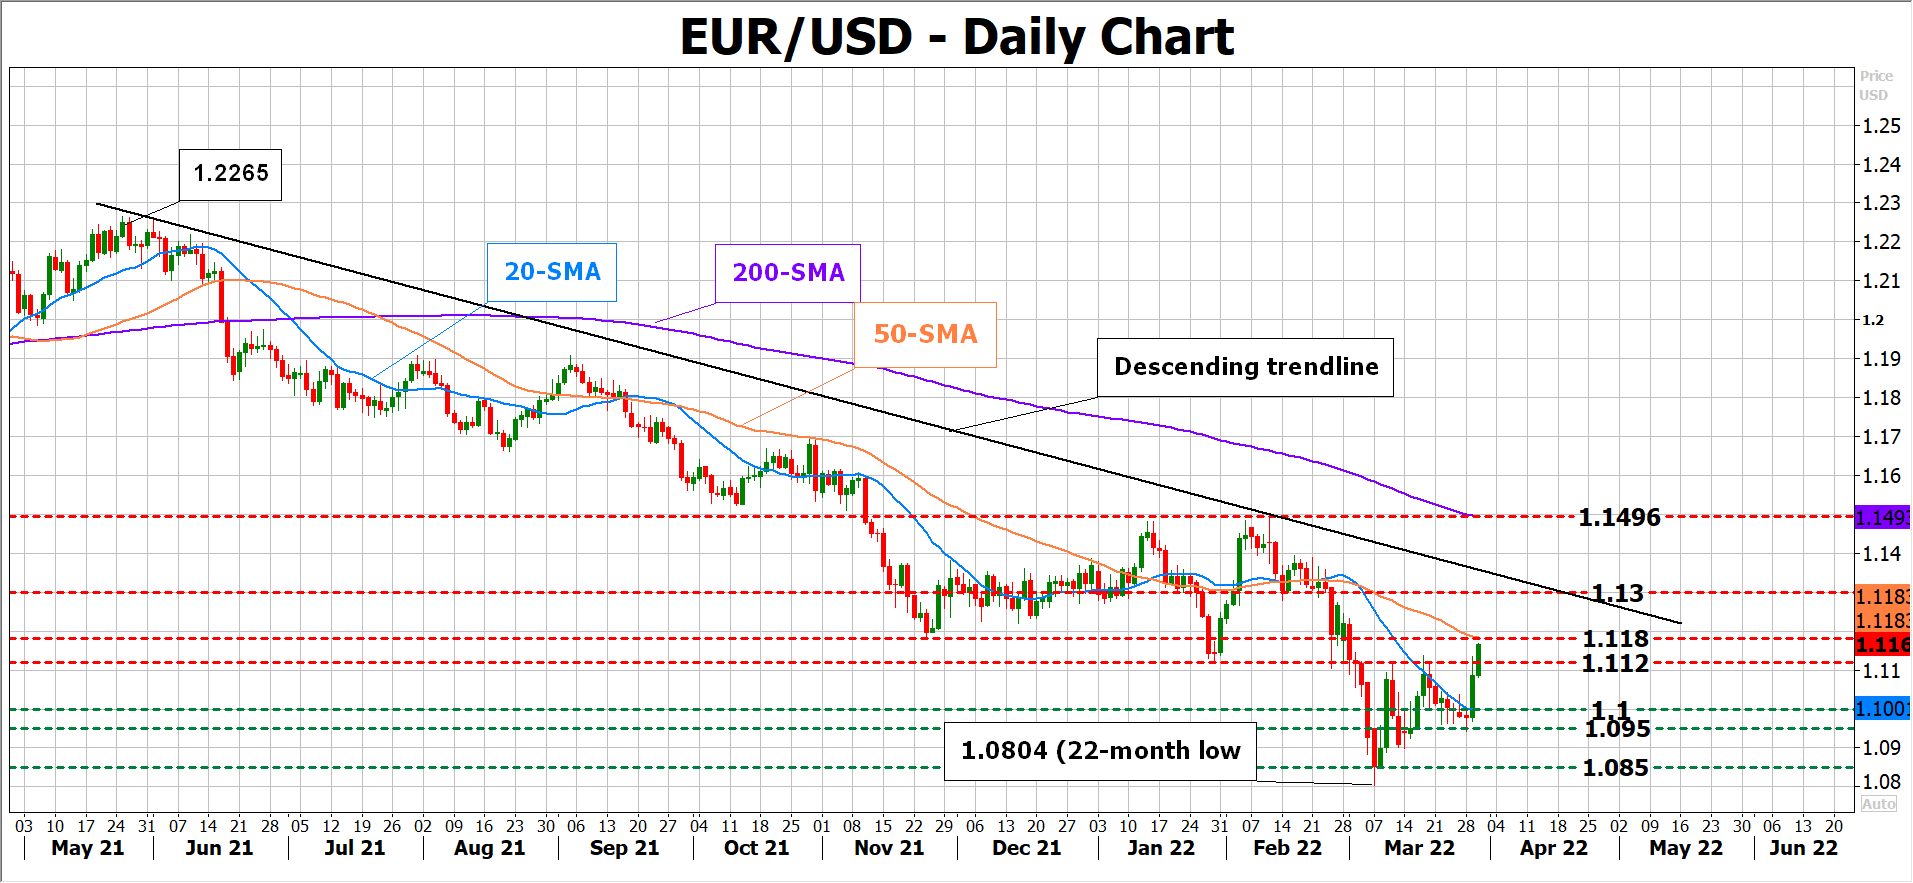
From a technical perspective, a close above the 1.1120 – 1.1180 resistance region could push for a trendline breakout above 1.1310. Alternatively, sellers may regain power if the price stays below the 50-day simple moving average (SMA) and particularly returns below 1.1120. In this case the 1.1000 – 1.0955 zone may come first into view, while lower the focus will turn to the 1.0850 number.
Note that US nonfarm payrolls are also on the agenda this Friday. Therefore, the next round of volatility could occur at the end of the week.
NZ Business Confidence Soft, But NZ Dollar Rises
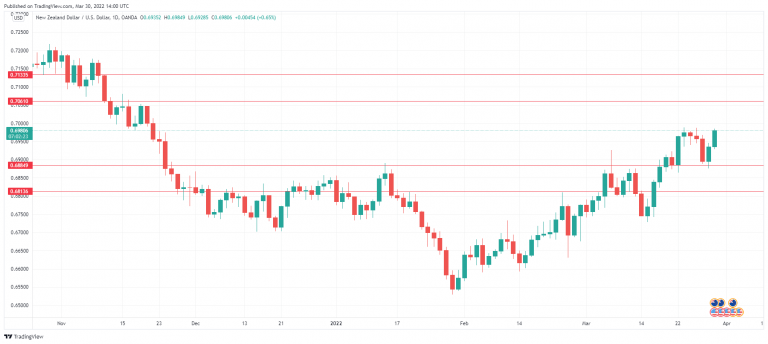
The New Zealand dollar has extended its rally as it closes in on the symbolic 70 level. In the European session, NZD/USD is trading at 0.6975, up 0.59% on the day.
NZ business confidence remains ice cold
Business confidence for March posted a reading deep in negative territory. The ANZ Business Confidence survey came in at -41.9, which was actually an improvement from the February reading of -51.8 points. Still, the survey has recorded only one gain in the past 12 releases, which points to ongoing pessimism about the economic outlook.
The reading comes on the heels of the Westpac Consumer Sentiment release for Q1, which fell from 99.1 to 92.1, its lowest level since 2008. Consumers reported being most concerned about soaring inflation and the surge in Omicron cases in New Zealand.
The ANZ survey found that inflationary pressures are accelerating throughout the economy, and inflation expectations were also on the rise. Businesses anticipated inflation of 5.51%, a new record high, compared to the February reading of 5.29%. These numbers are much higher than the RBNZ’s target band of 1%-3%. According to the ANZ, inflation pressures are “simply off the charts”, with the surge in commodities due to the Ukraine war driving up inflation.
In the US, the Federal Reserve has finally embarked on its rate-tightening cycle, with a 1/4 point rise earlier this month. Inflation hit a staggering 7.9% in February, which has prompted more speculation that the Fed might resort to salvos of 1/2 point cuts in order to bring inflation back down. The Fed has traditionally hiked or trimmed rates in 0.25% increments, but with the Fed playing catchup with inflation, it may have to resort to larger hikes to put a dent in rising prices. Fed Chair Powell signalled to the markets last week that the Fed would do whatever was needed to wrestle down inflation, including implementing 0.50% hikes.
NZD/USD Technical
- NZD/USD continues to break above resistance lines. There is resistance at 0.7061 and 0.7133
- There is support at 0.6885 and 0.6813
Sunset Market Commentary
Markets
Two main stories were running the show on markets today. Both of them supported the ongoing core bond sell-off which recently concentrated on European markets. Germany initiated the first phase of a three-staged emergency plan to secure natural gas supplies (see below). Spooked markets send Dutch gas prices about 10% higher while Brent oil adds 3.4% in a spill-over move. Both boost inflation expectations for a tenth day (!) straight to a new 14-year high (2.84%). Today’s national inflation readings (March) are testament to how such soaring commodity prices actually affect realized price trends. Belgian CPI in March accelerated from 8.04% to 8.31% y/y (see below for details). Spanish HICP soared to a whopping, off the charts 9.8%. In Germany, prices rose 7.6% measured via the European approach, up from 5.5% and crushing the 6.8% estimate. Individual state readings reveal energy, transportation and housing costs (which include utility bills) as some of the biggest contributors. All this points to big upward risks to the EMU release due on Friday and, more than anything else, means the ECB cannot delay the long-overdue policy normalization any longer. ECB’s Kazimir (“wish that we exit the territory of negative rates within a year at the latest), Muller (“it’s right to ask whether such low interest rates are still appropriate) and Makhlouf (“we are concerned at the impact of inflation”) agree. President Lagarde stuck to the “optionality, gradualism, flexibility” mantra but we know she knows better. Money markets bring forward rate hike bets (> three 25 bps increases this year) as well as increase the expected peak policy rate (near 1.5% end next year) today. It brings about another European yield curve bear flattening. Changes in Germany range from +6 bps (30y) to 11 bps (2y). Swap yields add 6-7 bps at the front end and 5 bps in long tenors. The US curve steepens marginally with moves from flat to +3.5 bps, unbothered by a spot-on yet strong ADP job report (455k vs 450k consensus). These more limited moves hide an intraday recovery of 6-7 bps though.
Markets have long frontloaded Fed tightening. This favoured the dollar over many of its peers. We are now witnessing the same with respect to the ECB and the euro. EUR/USD (1.1139) extends yesterday’s gains. It escapes from a bullish ascending triangle via the 1.1121 resistance (January interim low) level. Granted, dollar weakness is at play too. EUR/GBP is going for a second test of the 0.847 resistance. A break higher would hurl the pair back in the sideways trading range that long dominated in 2021. The Japanese yen is holding up pretty well despite rising core bond yields and commodity prices. The only in theory supporting factor is the fragile equity environment (stocks down 1% in Europe). USD/JPY inches below 122.
News Headlines
German economy minister Habeck this morning initiated the first (“early warning”) of three phases of an emergency plan in case of a Russian gas cut-off. Current gas stocks cover approximately 20 days of forward consumption. Habeck called on firms and individuals to try and reduce energy consumption as much as possible. His office will also create a crisis team to deal with the stability of future gas supply. In the third and final phase, the state will intervene and regulate the gas flow. The warning comes because of the stand-off on Russia’s demand for “hostile states” to pay EUR and USD-denominated gas contracts in rubles. Gas prices rise by another 5%-10% today. The main European benchmark (TTF nat gas future) trades again at €120/megawatt-hour from an €110 opening.
Belgian inflation rises from 8.04% Y/Y in February to 8.31% Y/Y in March, its highest level since March 1983. Inflation based on the national health index goes from 7.56% Y/Y to 7.68% Y/Y. The high inflation remains largely due to energy prices which have an annual inflation rate of 57.22% and contribute 4.82 percentage points. Core inflation rose from 3.28% Y/Y to 3.75% Y/Y. Inflation for food products (including alcoholic beverages) stands at 4.63% this month, compared to 3.84% last month. Inflation for services has risen to 3.78% from 3.20%. Inflation for rents has increased from 2.49% to 2.64%.
NZDCAD Wave Analysis
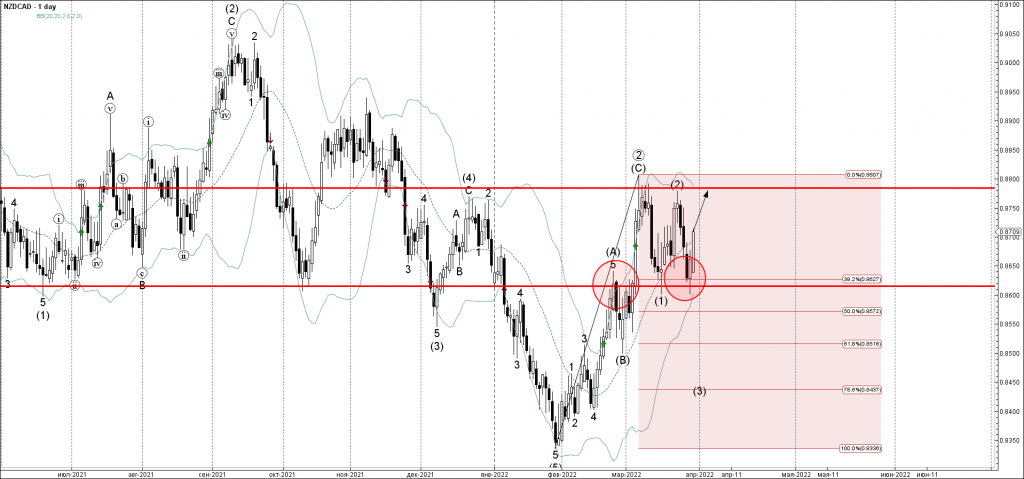
- NZDCAD reversed from support level 0.8615
- Likely to rise to resistance level 0.8775
NZDCAD recently reversed up with the daily Piercing Line from the key support level 0.8615 (which has been reversing the price from the start of March).
The support zone near the support level 0.8615 was strengthened by the lower daily Bollinger Band and by the 38.2% Fibonacci correction of the upward ABC correction from January.
NZDCAD can be expected to rise further toward the next resistance level 0.8775 (which stopped the previous waves (C) and (2)).
Gold Wave Analysis
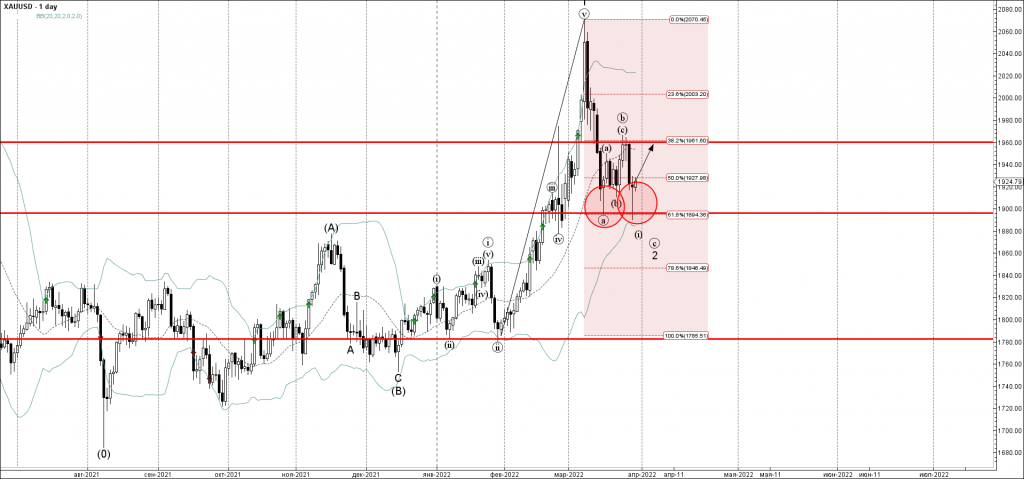
- Gold reversed from the key support level 1900.00
- Likely to rise to resistance level 1960.00
Gold recently reversed up with the daily Hammer from the key support level 1900.00 (which has been repeatedly reversing the price from the middle of February).
The support zone near the support level 1900.00 was strengthened by the lower daily Bollinger Band and by the 61.8% Fibonacci correction of the previous upward impulse from January.
Gold can be expected to rise further toward the next resistance level 1960.00 (top of the earlier correction (b)).
Gold Price Hits Russian Ceiling Yesterday
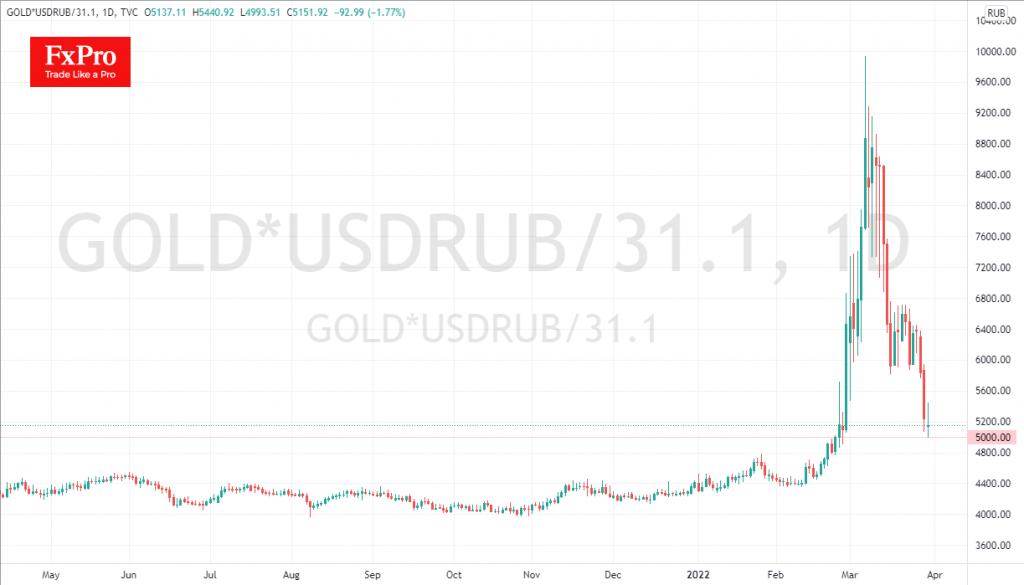
The Bank of Russia last week fixed the purchase price of Gold from banks at 5,000 roubles per gram. At the time of the announcement, on the 25th of March, the Dollar was hovering around 100 roubles, and the price of an ounce (31.1 grams) on the international market was around $1950. Where did that price of 5000 come from? It is a rounding of the ‘global’ gold price at the close of the 23rd of February, converted into roubles.
At that time, the Central Bank offered a 25% discount on the market estimate (6270 RUB). However, this discount has all but disappeared due to the recent rouble appreciation and Gold’s retreat from peaks. At the closing levels of the day, the central bank price was only a 3.3% discount to the global price, and intraday, it fell to 4965 RUB, where we saw a surge of buying due to arbitrage.
Next, we should be prepared for the strengthening rouble to provide indirect support for Gold. For example, at USDRUB at 80, the bid price of a Gold ounce will be $1943. Thus, this level will become strong support. Bank of Russia says it fixed its price until the 30th of June, so until then, there will be a flexible (in USD terms) ceiling for the Gold price.
ECB Makhlouf: Ukraine war likely to have material impact on economic activity and inflation
ECB Governing Council member Gabriel Makhlouf said today, "as for the economic consequences of the war in Ukraine, it is too early to give a definitive view. It clearly represents a significant challenge to the outlook for inflation and growth and adds new uncertainty to what had started to become a less uncertain picture."
"The war is likely to have a material impact on economic activity and inflation in the euro area. But in some countries, including Ireland, the effects will be more indirect than for others although that does not mean they will be insignificant," he added.
USD/CAD Mid-Day Outlook
Daily Pivots: (S1) 1.2471; (P) 1.2501; (R1) 1.2531; More...
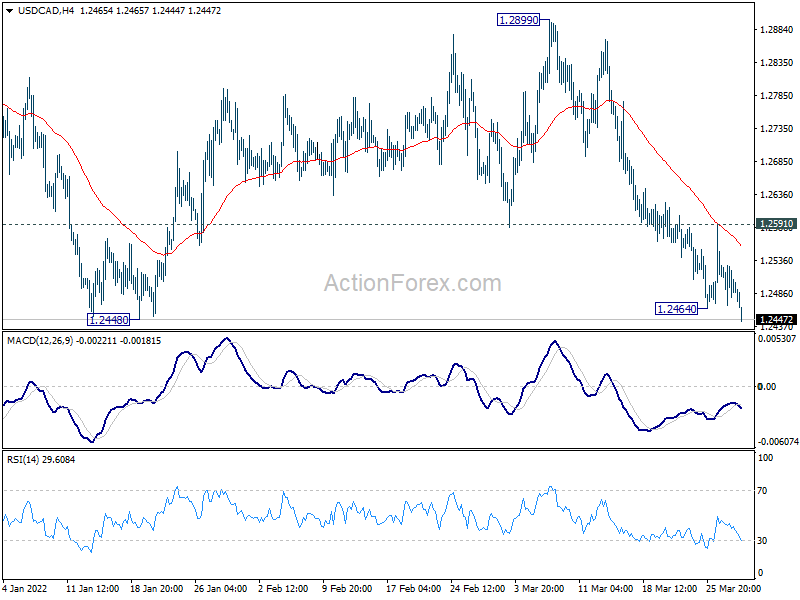
USD/CAD's fall from 1.2899 resumes by breaking through 1.2464 temporary low. Intraday bias is back on the downside. Corrective pattern from 1.2005 could have completed already. Firm break of 1.2448 support should confirm this bearish case and bring retest of 1.2005. On the upside, nevertheless, break of 1.2591 resistance will turn bias back to the upside for 1.2899 resistance instead.
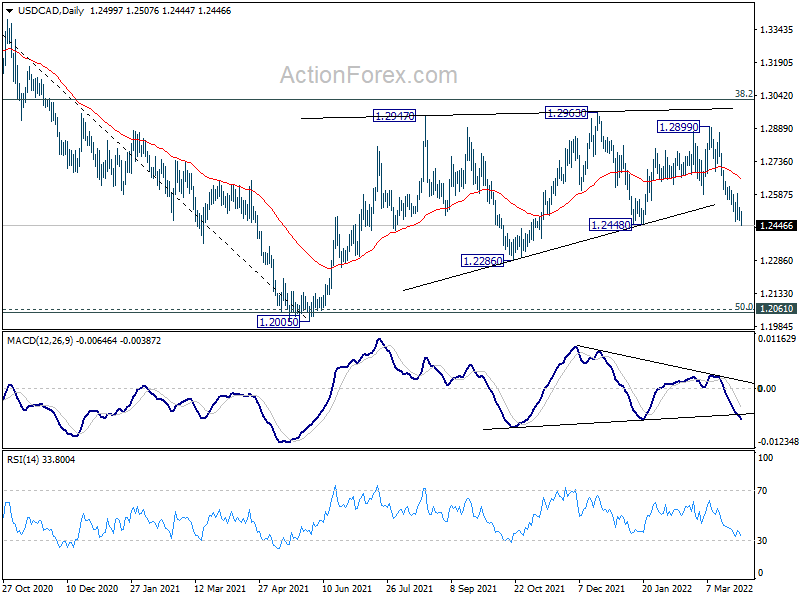
In the bigger picture, focus stays on 38.2% retracement of 1.4667 (2020 high) to 1.2005 (2021 low) at 1.3022. Sustained break there should confirm that the down trend from 1.4667 has completed after defending 1.2061 long term cluster support. Further rise would then be seen towards 61.8% retracement at 1.3650. However, rejection by 1.3022 will maintain medium term bearishness. Break of 1.2005 will resume the down trend from 1.4667 and that carries larger bearish implications too.
USD/JPY Mid-Day Outlook
Daily Pivots: (S1) 121.82; (P) 123.078; (R1) 124.14; More...
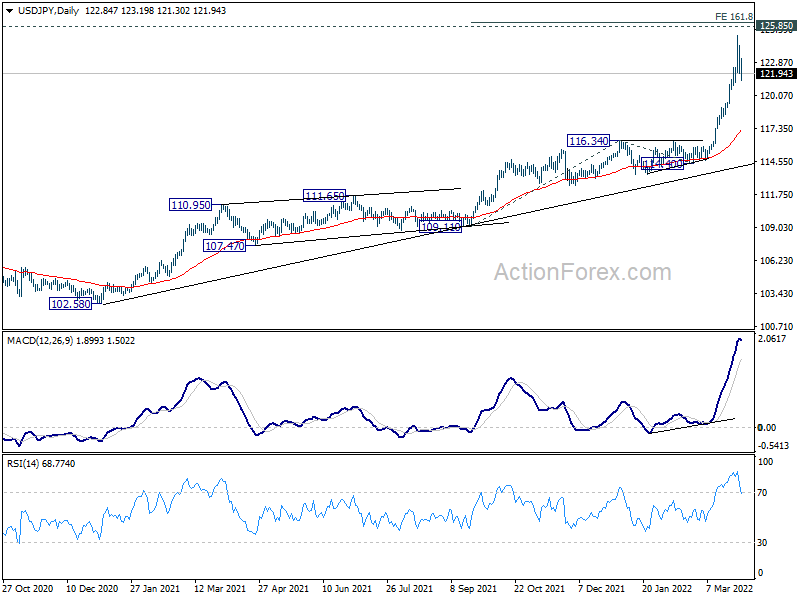
Intraday bias in USD/JPY remains neutral and further rise is still in favor with 121.17 minor support intact. On the upside, above 125.09 will target 161.8% projection of 109.11 to 116.34 from 114.40 at 126.09, which is close to 125.85 long term resistance. However, break of 121.17 will indicate short term topping, and bring deeper pull back.
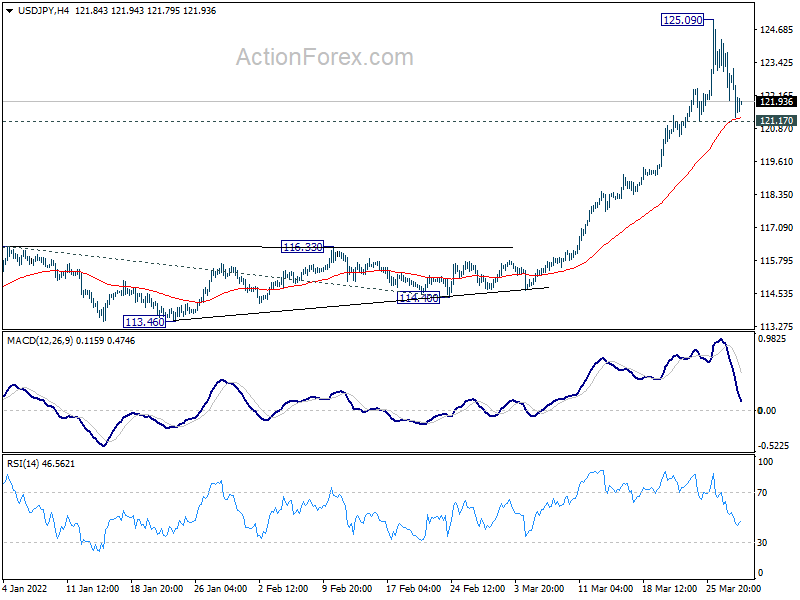
In the bigger picture, up trend from 98.97 (2016 low) in in progress for retesting 125.85 (2015 high). Sustained break there will confirm long term up trend resumption. Next target will be 61.8% projection of 75.56 (2011 low) to 125.85 (2015 high) from 98.97 at 130.04. This will now remain the favored case as long as 116.34 resistance turned support holds.