Sample Category Title
EUR/AUD Daily Outlook
Daily Pivots: (S1) 1.4774; (P) 1.4827; (R1) 1.4911; More...
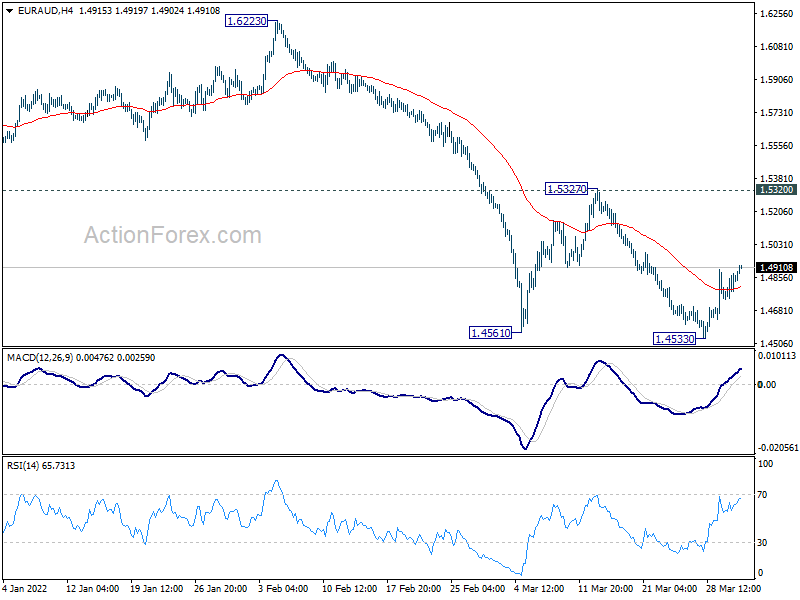
EUR/AUD's recovery from 1.4533 is still in progress and intraday bias stays mildly on the upside. But still, it's seen as in the third leg of the corrective pattern from 1.4561. As long as 1.5327 resistance holds, larger down trend is still expected to continue. Break of 1.4533 will confirm down trend resumption for 1.3624 long term support.
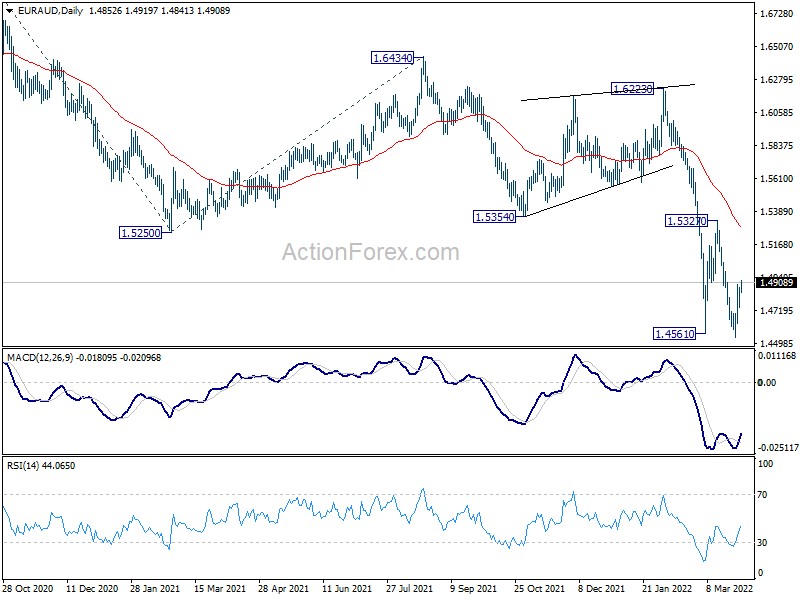
In the bigger picture, fall from 1.9799 is seen as a long term impulsive move. Next target is 61.8% projection of 1.9799 to 1.5250 from 1.6434 at 1.3623, which is close to 1.3624 long term support (2017 low). Some support could be seen there to bring interim rebound. But overall, break of 1.5354 support turned resistance is needed to be the first sign of medium term bottoming. Otherwise, outlook will stay bearish in case of recovery.
EUR/GBP Daily Outlook
Daily Pivots: (S1) 0.8465; (P) 0.8482; (R1) 0.8512; More...
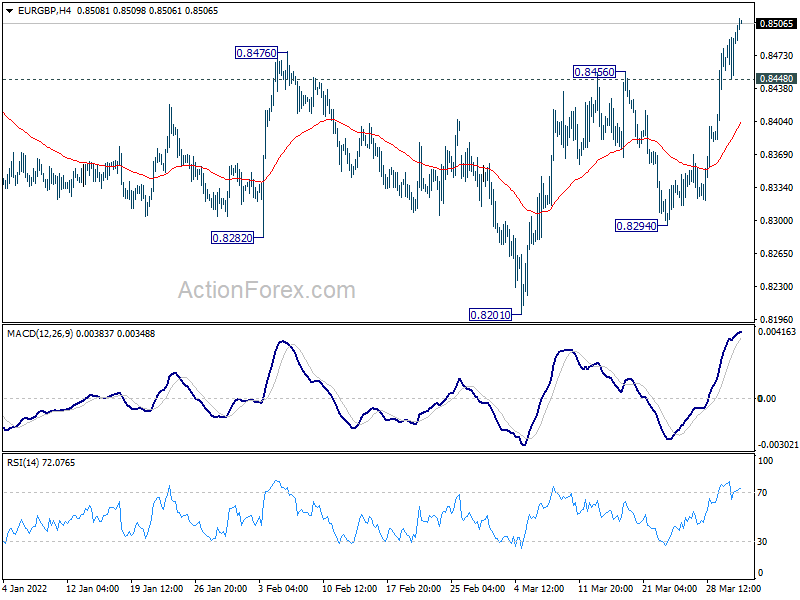
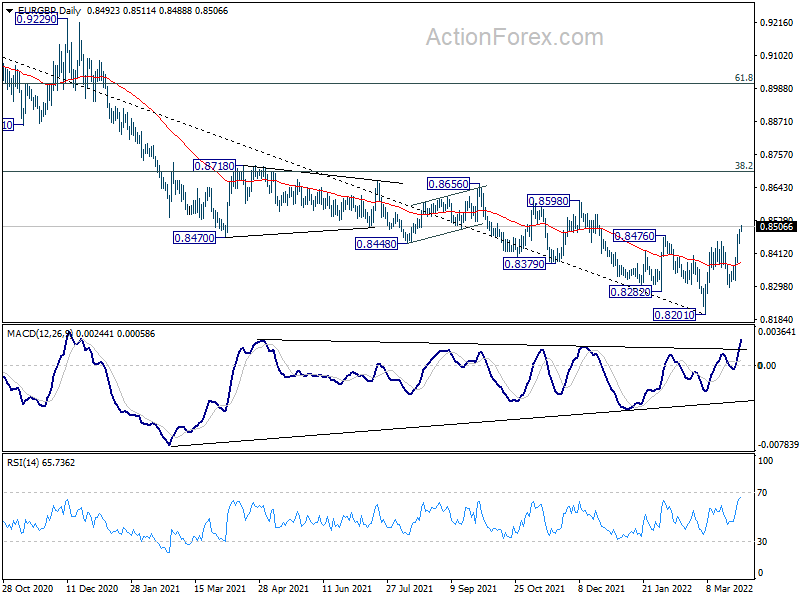
EUR/GBP's rise from 0.8201 extends higher today. The break of 0.8476 structural resistance should confirm medium term bottoming at 0.8201, with a head and shoulder bottom pattern too (ls: 0.8282, h: 0.8201, rs: 0.8294). Intraday bias stays on the upside for 0.8697 medium term fibonacci level next. On the downside, break of 0.8448 minor support will mix up the outlook and turn intraday bias neutral first.
In the bigger picture, a medium term bottom should be in place at 0.8201, on bullish convergence condition in daily and weekly MACD. Rise from there could either be a correction to the down trend from 0.9499 (2020 high), or a medium term up trend itself. In either case, further rise should be seen to 38.2% retracement of 0.9499 to 0.8201 at 0.8697. Sustained break there will target 61.8% retracement at 0.9003. This will remain the favored case as long as 0.8294 support holds.
Euro Rebound Making Progress, Yen Recovery Lost Momentum
Euro's rebound made some progress overnight even though momentum was still weak. The common is nevertheless firm in Asian session. Dollar is also strengthening up slightly, together with Sterling and Swiss Franc. Yen is consolidating in tight range as earlier recovery is losing some momentum. Commodity currencies are mixed for now.
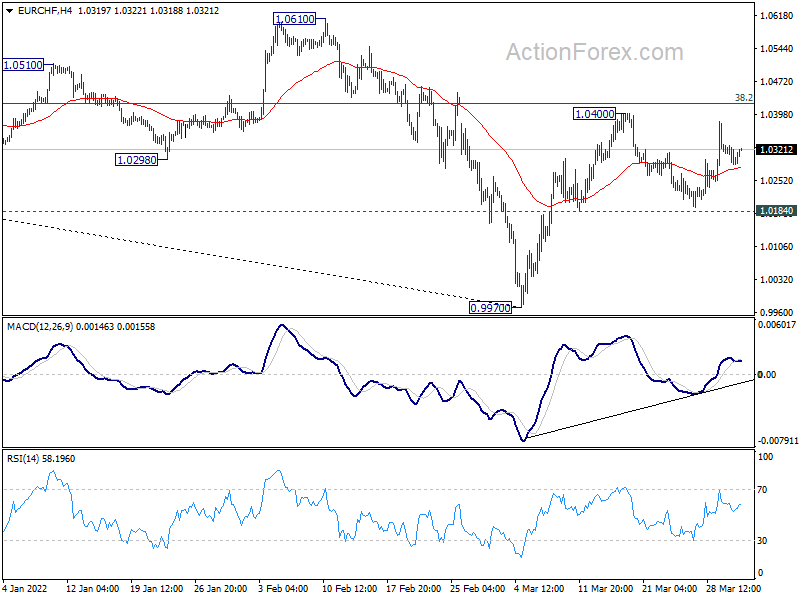
Technically, EUR/USD's break of 1.1120 support turned resistance and EUR/GBP's break of 0.8476 structural resistance are both bullish signal for the Euro. Attention is now on EUR/CHF. Firm break of 1.0400 resistance will resume the rebound from 0.9970. That, if happens, should solidify Euro's broad based come back.
In Asia, at the time of writing, Nikkei is down -0.24%. Hong Kong HSI is down -0.81%. China Shanghai SSE is down -0.10%. Singapore Strait Times is down -0.23%. Japan 10-year JGB yield is up 0.0032 at 0.223. Overnight, DOW dropped -0.19%. S&P 500 dropped -0.63%. NASDAQ dropped -1.21%. 10-year yield dropped -0.042 to 2.358.
Fed George: Moving expeditiously to a neutral stance of policy is appropriate
Kansas City Fed President Esther George said yesterday, "it is clear that removing accommodation is required. How much and how aggressively accommodation should be removed is far more uncertain."
"Given the state of the economy, with inflation at a 40-year high and the unemployment rate near record lows, moving expeditiously to a neutral stance of policy is appropriate," she added.
"At the same time, the factors I noted earlier, including monitoring risks, the responsiveness of activity to interest rate changes, and yield curve developments will be important guides to that pace in my view."
On the topic of yield curve inversion, George said, "An inverted curve has implications for financial stability with incentives for reach-for-yield behavior. An inverted yield curve also pressures traditional bank lending models that rely on net interest margins, or the spread between borrowing short and lending long. Community banks in particular rely on net interest margins to maintain their profitability."
Fed Barkin will make the call on 25bps or 50bps hike in May
Richmond Fed President Thomas Barkin told Bloomberg TV yesterday he's looking at both a 25bps and a 50bps rate hike at the May FOMC meeting. "I think the question -- and we will make this decision when we get to the meeting in May -- is how strong does the economy still look in terms of its ability to take rate increases and how high is inflation persisting. I'm looking at both of those and we'll make our call in May," he said.
Barkin also said it might take interest rates above neural to bring down inflation. "I think there is a real chance that is true," he said. "As we get closer to neutral we can make that call."
Japan industrial production rose 0.1% mom in Feb, to expand further in Mar
Japan industrial production rose 0.1% mom in February, below expectation of 0.5% mom. That's nonetheless the first rise in three months. index of production stood at 95.8, against the 2015 base of 100.
Auto production rose 10.9% mom, after plunging -17.3% mom in January. Output of transport equipment rose 7.9% mom. Chemical products dropped -9.6%.
Looking ahead, the Ministry of Economy, Trade and Industry expects output to keep expanding, up 3.6 percent in March and 9.6 percent in April, respectively, based on a poll of manufacturers.
China PMI manufacturing dropped to 49.5 in Mar, services dropped to 48.4
China official PMI manufacturing dropped from 50.2 to 49.5 in March, below expectation of 50.0. PMI non-manufacturing dropped from 51.6 to 48.4, below expectation of 50.7. Both indexes were below 50 level together for the first time since the start of the pandemic in February 2020.
"Recently, clusters of epidemic outbreaks have occurred in many places in China, and coupled with a significant increase in global geopolitical instability, production and operation of Chinese enterprises have been affected," said Zhao Qinghe, senior NBS statistician.
Looking ahead
Germany retail sales and unemployment, UK GDP and current account, Swiss retail sales, France consumer spending, and Eurozone unemployment rate will be released in European session.
Later in the day, US will release jobless claims, personal spending and income with PCE inflation, Chicago PMI. Canada will release GDP.
EUR/GBP Daily Outlook
Daily Pivots: (S1) 0.8465; (P) 0.8482; (R1) 0.8512; More...
EUR/GBP's rise from 0.8201 extends higher today. The break of 0.8476 structural resistance should confirm medium term bottoming at 0.8201, with a head and shoulder bottom pattern too (ls: 0.8282, h: 0.8201, rs: 0.8294). Intraday bias stays on the upside for 0.8697 medium term fibonacci level next. On the downside, break of 0.8448 minor support will mix up the outlook and turn intraday bias neutral first.
In the bigger picture, a medium term bottom should be in place at 0.8201, on bullish convergence condition in daily and weekly MACD. Rise from there could either be a correction to the down trend from 0.9499 (2020 high), or a medium term up trend itself. In either case, further rise should be seen to 38.2% retracement of 0.9499 to 0.8201 at 0.8697. Sustained break there will target 61.8% retracement at 0.9003. This will remain the favored case as long as 0.8294 support holds.
Economic Indicators Update
| GMT | Ccy | Events | Actual | Forecast | Previous | Revised |
|---|---|---|---|---|---|---|
| 23:50 | JPY | Industrial Production M/M Feb P | 0.10% | 0.50% | -0.80% | |
| 00:30 | AUD | Building Permits M/M Feb | 43.50% | 9.00% | -27.90% | -27.10% |
| 00:30 | AUD | Private Sector Credit M/M Feb | 0.60% | 0.70% | 0.60% | |
| 01:00 | CNY | NBS Manufacturing PMI Mar | 49.5 | 50 | 50.2 | |
| 01:00 | CNY | Non-Manufacturing PMI Mar | 48.4 | 50.7 | 51.6 | |
| 05:00 | JPY | Housing Starts Y/Y Feb | 6.30% | 1.10% | 2.10% | |
| 06:00 | EUR | Germany Retail Sales M/M Feb | 0.80% | 2.00% | ||
| 06:00 | GBP | GDP Q/Q Q4 F | 1.00% | 1.00% | ||
| 06:00 | GBP | Current Account (GBP) Q4 F | -19.0B | -24.4B | ||
| 06:30 | CHF | Real Retail Sales Y/Y Feb | 5.30% | 5.10% | ||
| 06:45 | EUR | France Consumer Spending M/M Feb | 0.90% | -1.50% | ||
| 07:55 | EUR | Germany Unemployment Change Mar | -20K | -33K | ||
| 07:55 | EUR | Germany Unemployment Rate Mar | 5.00% | 5.00% | ||
| 08:00 | EUR | Italy Unemployment Rate Feb | 8.70% | 8.80% | ||
| 09:00 | EUR | Eurozone Unemployment Rate Feb | 6.70% | 6.80% | ||
| 12:30 | CAD | GDP M/M Jan | 0.40% | 0.00% | ||
| 12:30 | USD | Initial Jobless Claims (Mar 25) | 200K | 187K | ||
| 12:30 | USD | Personal Income M/M Feb | 0.50% | 0.00% | ||
| 12:30 | USD | Personal Spending M/M Feb | 0.60% | 2.10% | ||
| 12:30 | USD | PCE Price Index M/M Feb | 0.60% | |||
| 12:30 | USD | PCE Price Index Y/Y Feb | 6.70% | 6.10% | ||
| 12:30 | USD | Core PCE Price Index M/M Feb | 0.40% | 0.50% | ||
| 12:30 | USD | Core PCE Price Index Y/Y Feb | 5.50% | 5.20% | ||
| 13:45 | USD | Chicago PMI Mar | 56.4 | 56.3 | ||
| 14:30 | USD | Natural Gas Storage | 23B | -51B |
China PMI manufacturing dropped to 49.5 in Mar, services dropped to 48.4
China official PMI manufacturing dropped from 50.2 to 49.5 in March, below expectation of 50.0. PMI non-manufacturing dropped from 51.6 to 48.4, below expectation of 50.7. Both indexes were below 50 level together for the first time since the start of the pandemic in February 2020.
"Recently, clusters of epidemic outbreaks have occurred in many places in China, and coupled with a significant increase in global geopolitical instability, production and operation of Chinese enterprises have been affected," said Zhao Qinghe, senior NBS statistician.
Japan industrial production rose 0.1% mom in Feb, to expand further in Mar
Japan industrial production rose 0.1% mom in February, below expectation of 0.5% mom. That's nonetheless the first rise in three months. index of production stood at 95.8, against the 2015 base of 100.
Auto production rose 10.9% mom, after plunging -17.3% mom in January. Output of transport equipment rose 7.9% mom. Chemical products dropped -9.6%.
Looking ahead, the Ministry of Economy, Trade and Industry expects output to keep expanding, up 3.6 percent in March and 9.6 percent in April, respectively, based on a poll of manufacturers.
Fed George: Moving expeditiously to a neutral stance of policy is appropriate
Kansas City Fed President Esther George said yesterday, "it is clear that removing accommodation is required. How much and how aggressively accommodation should be removed is far more uncertain."
"Given the state of the economy, with inflation at a 40-year high and the unemployment rate near record lows, moving expeditiously to a neutral stance of policy is appropriate," she added.
"At the same time, the factors I noted earlier, including monitoring risks, the responsiveness of activity to interest rate changes, and yield curve developments will be important guides to that pace in my view."
On the topic of yield curve inversion, George said, "An inverted curve has implications for financial stability with incentives for reach-for-yield behavior. An inverted yield curve also pressures traditional bank lending models that rely on net interest margins, or the spread between borrowing short and lending long. Community banks in particular rely on net interest margins to maintain their profitability."
Fed Barkin will make the call on 25bps or 50bps hike in May
Richmond Fed President Thomas Barkin told Bloomberg TV yesterday he's looking at both a 25bps and a 50bps rate hike at the May FOMC meeting.
"I think the question -- and we will make this decision when we get to the meeting in May -- is how strong does the economy still look in terms of its ability to take rate increases and how high is inflation persisting. I'm looking at both of those and we'll make our call in May," he said.
Barkin also said it might take interest rates above neural to bring down inflation. "I think there is a real chance that is true," he said. "As we get closer to neutral we can make that call."
Technical Outlook and Review
DXY:
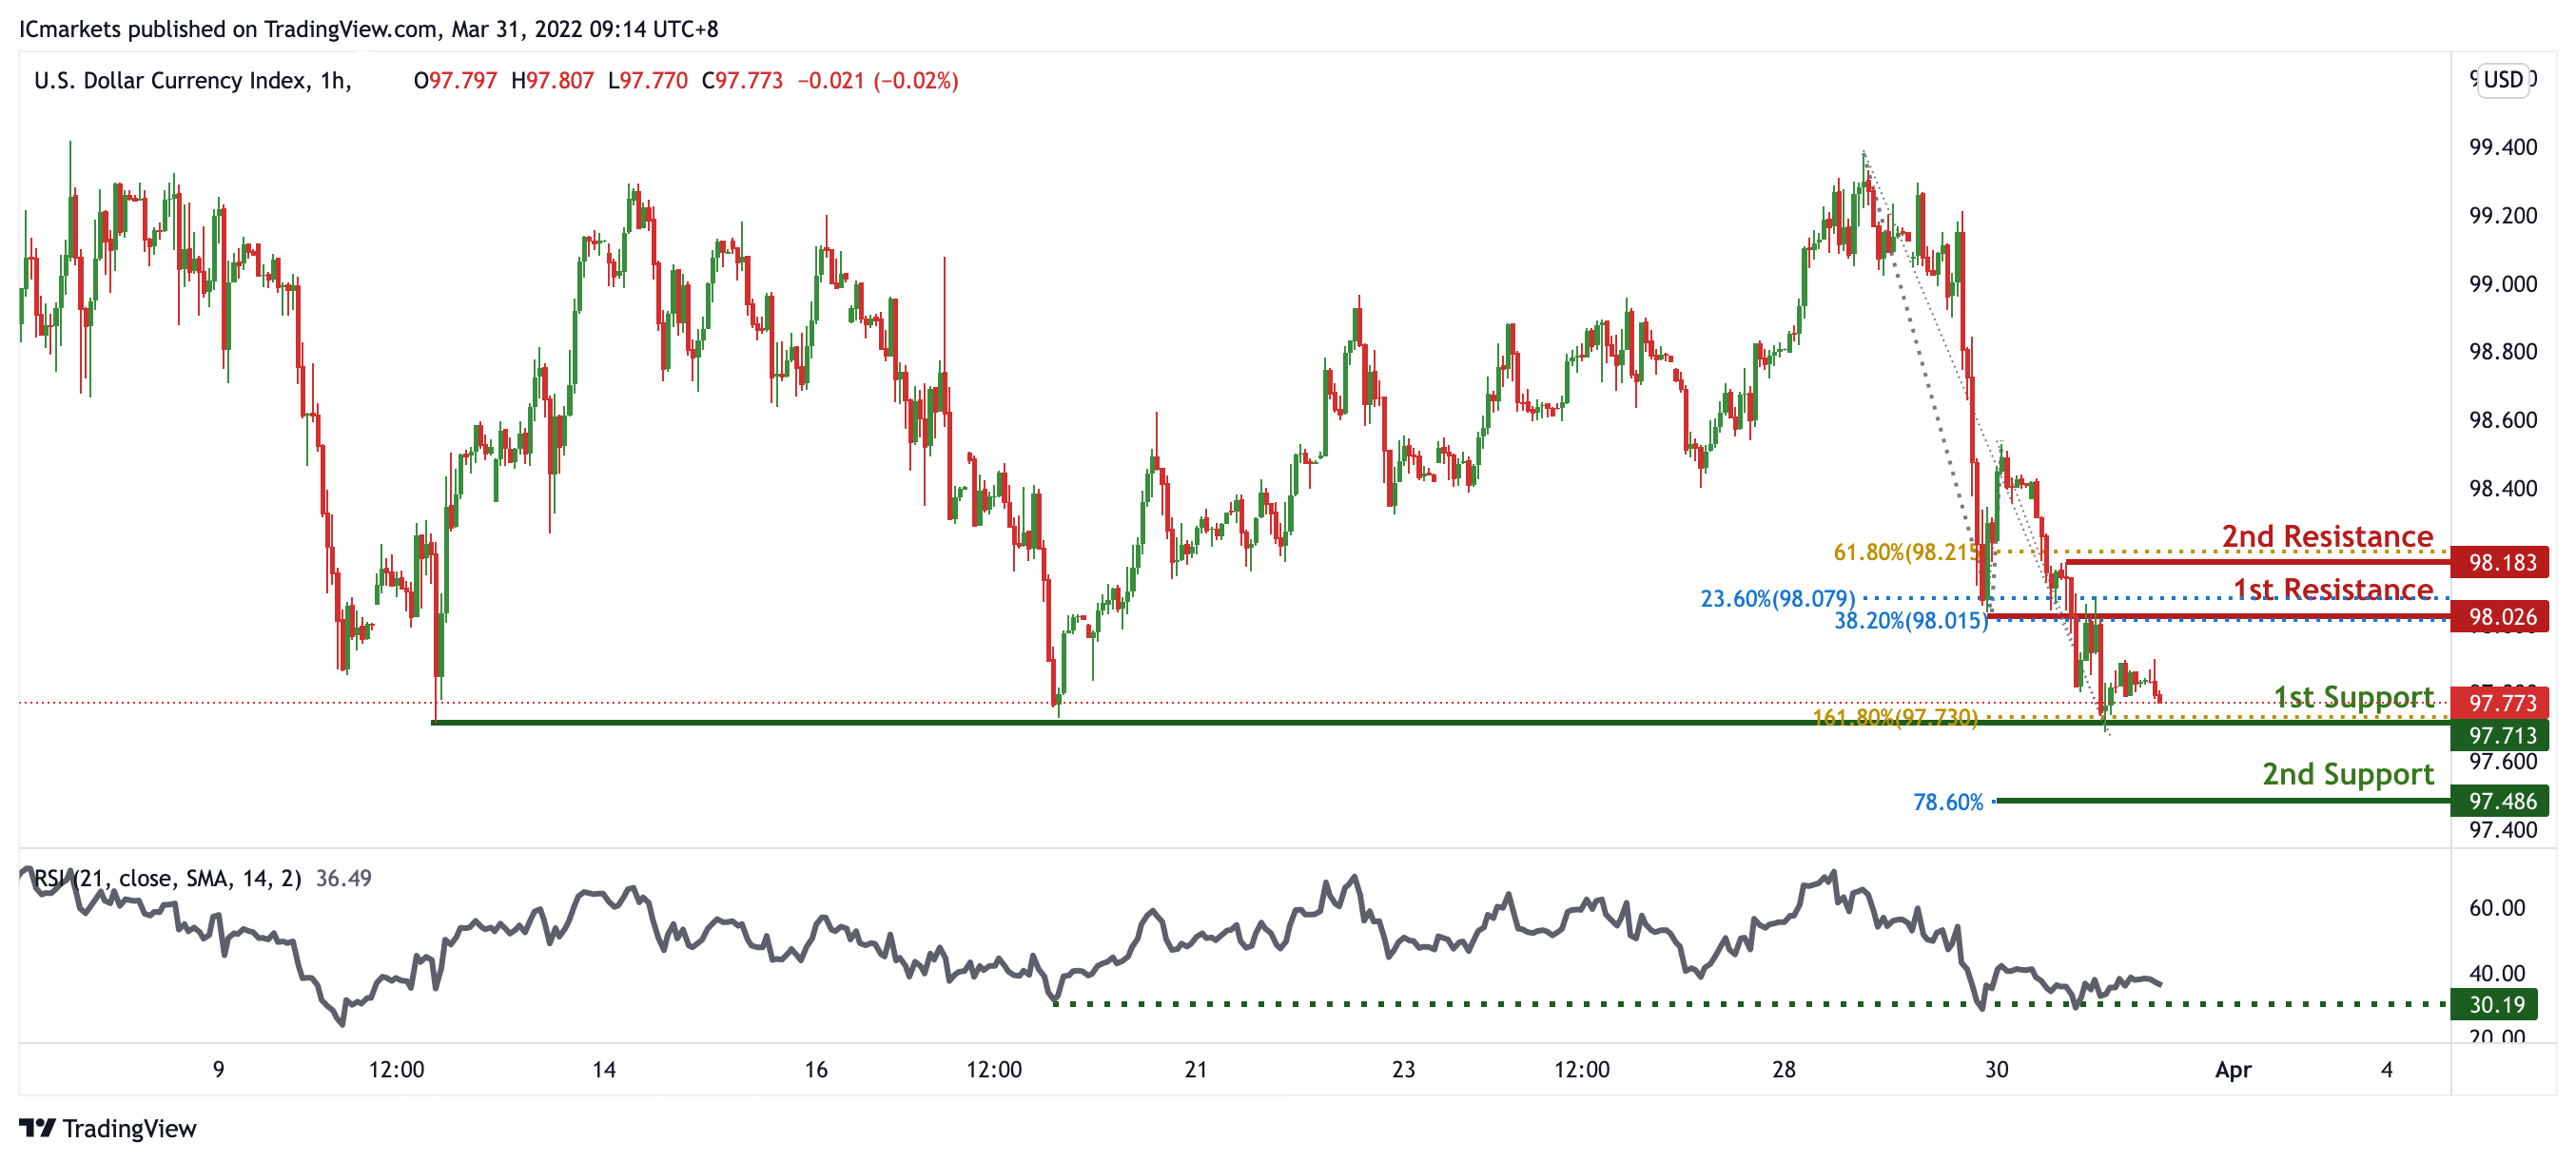
On the H1 timeframe, prices are approaching a pivot. We see the potential for a bounce from our 1st support at 97.713 in line with 161.8% Fibonacci Projection% towards our 1st resistance at 98.026 which is an area of Fibonacci confluences. RSI are at levels where bounces previously occurred, further supporting our bullish bias.
Areas of consideration:
- H4 time frame, 1st resistance at 98.026
- H4 time frame, 1st support at 97.713
XAU/USD (GOLD):
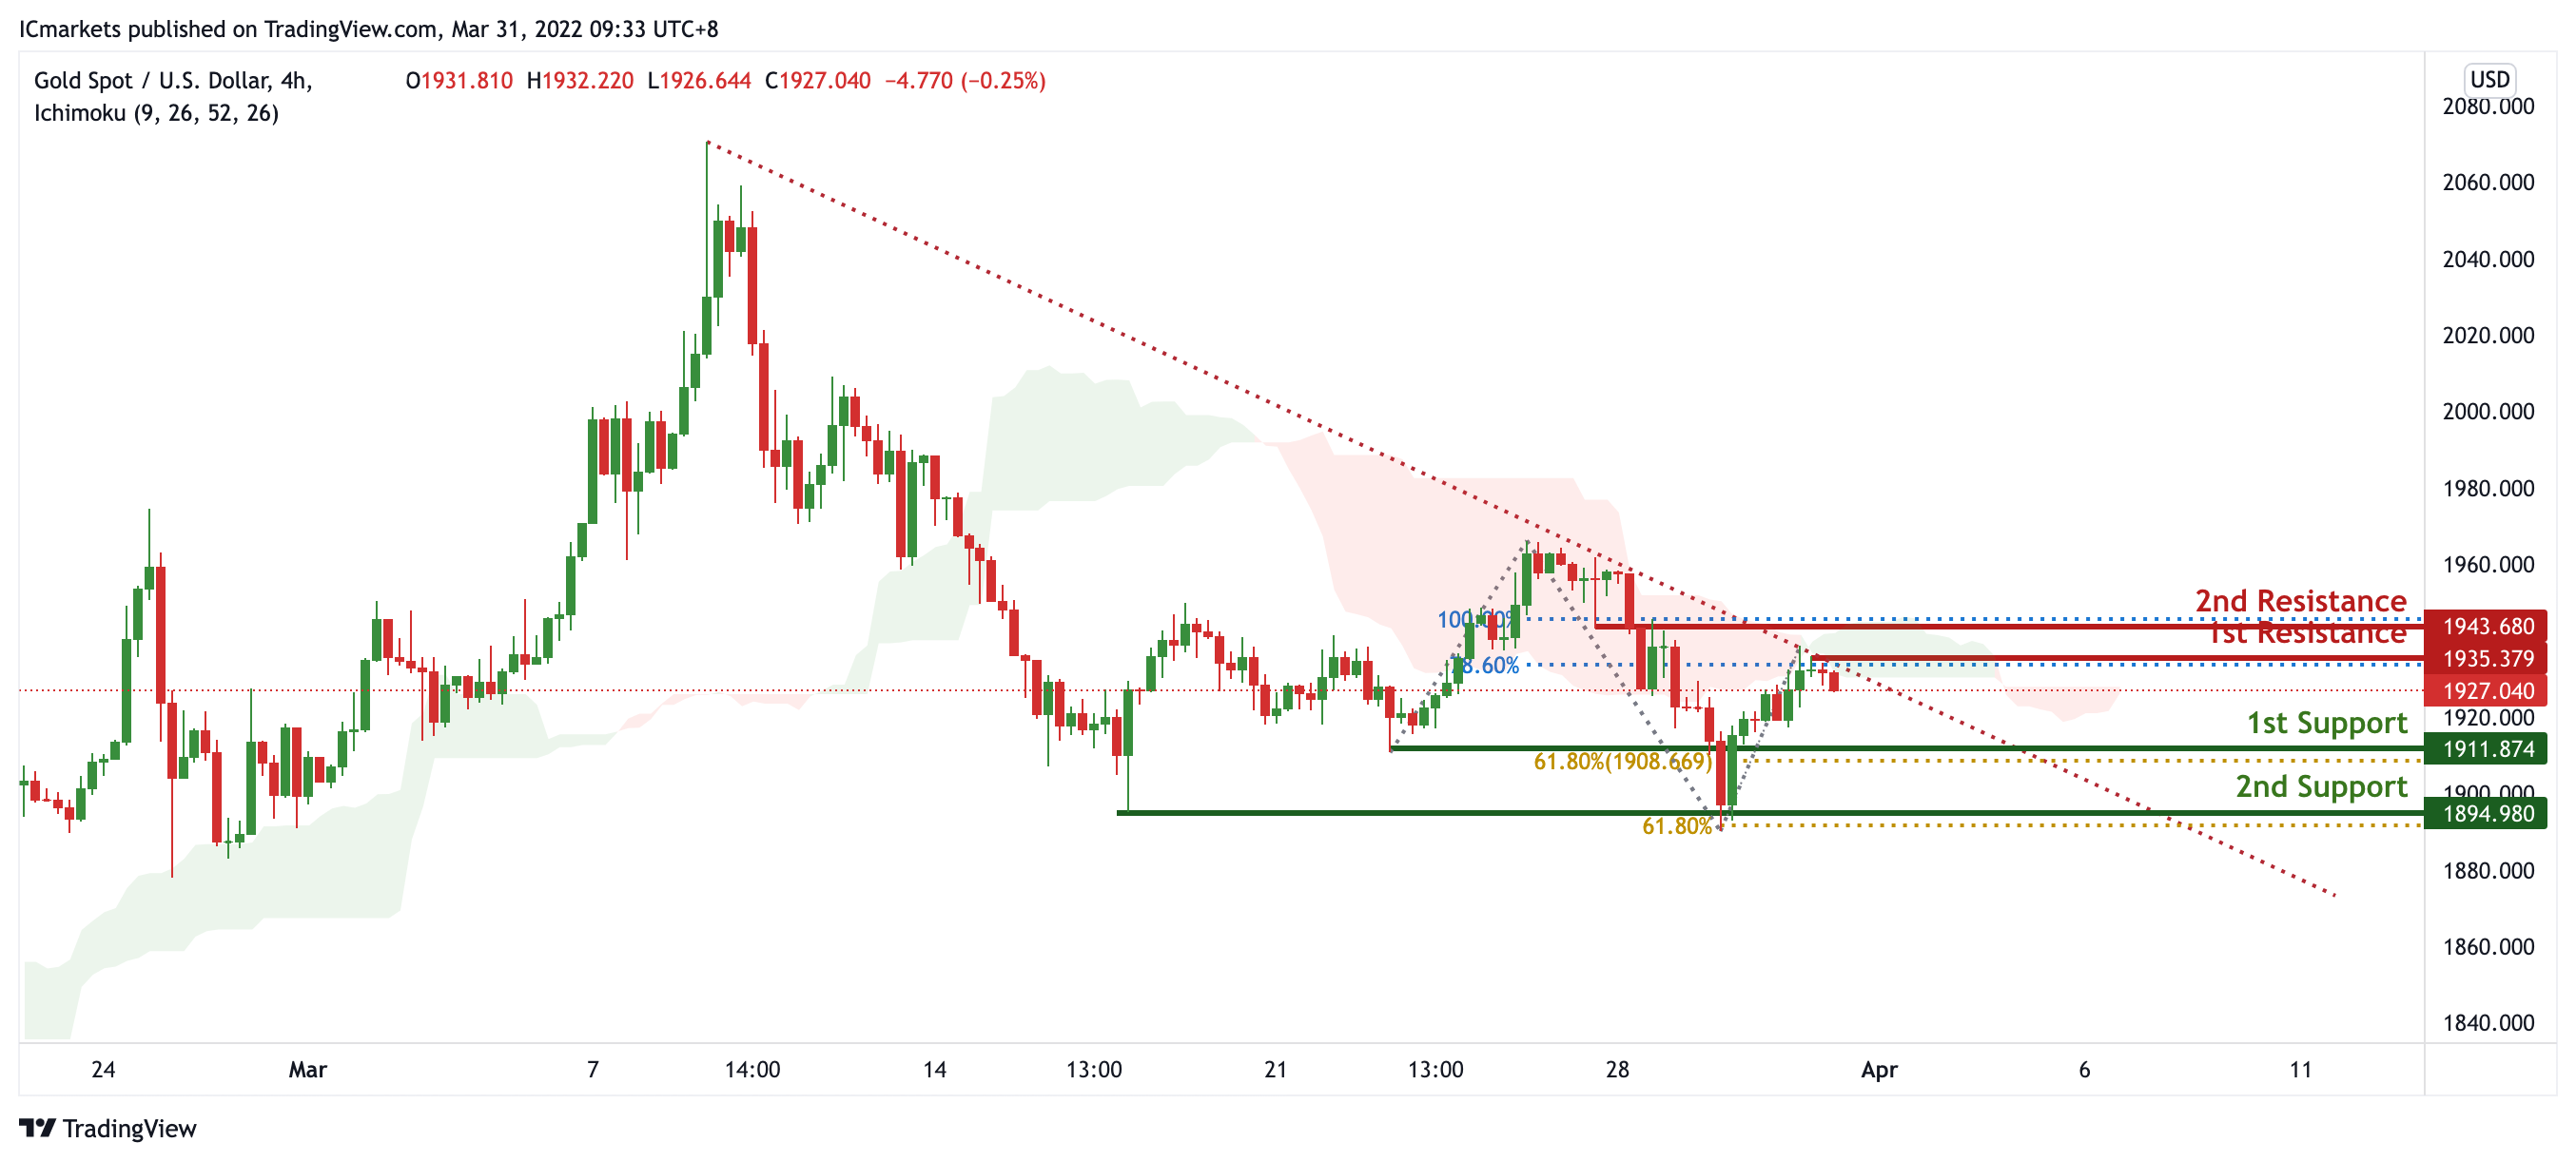
On the H4, prices are on bearish momentum and abiding by our descending trendline resistance. We see the potential for further bearish continuation from our 1st resistance at 1941.226 which is in line with 78.6% Fibonacci projection towards our 1st support at 1915.715 in line with 23.6% Fibonacci retracement and also graphical swing low. Prices are trading below our ichimoku clouds, further supporting our bearish bias.
Areas of consideration:
- 4h 1st support at 1915.715
- 4h 1st resistance at 1941.226
GBP/USD:
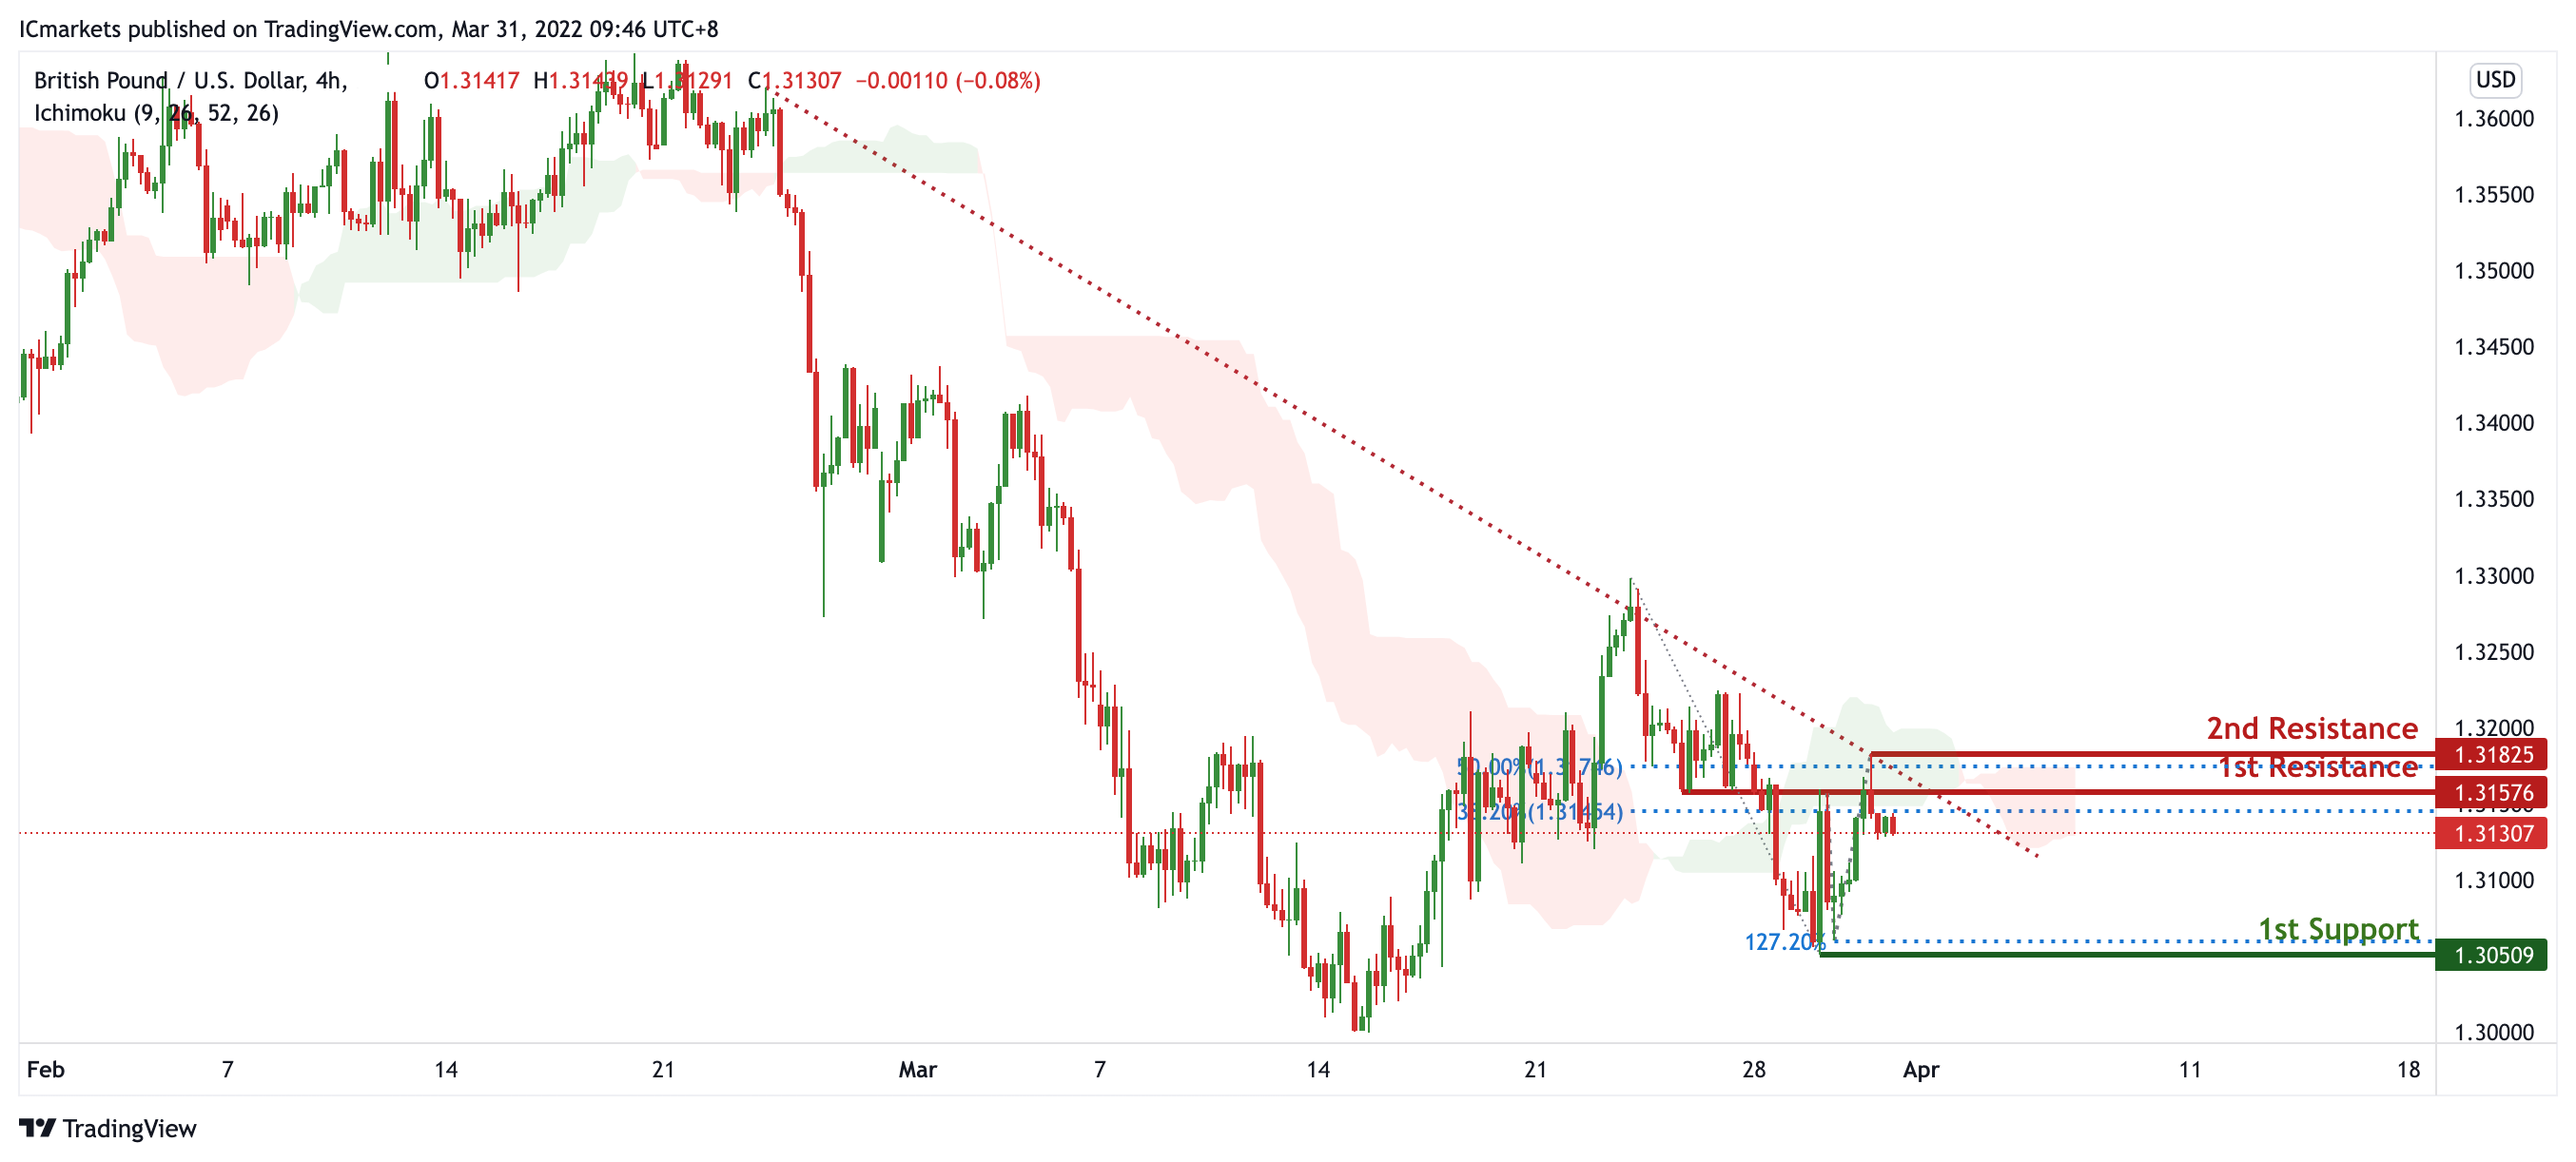
On the H4, prices are on bearish momentum and abiding by a descending trendline. We see the potential for a dip from our 1st resistance at 1.31576 which is a graphical overlap and in line with 38.2% Fibonacci retracement towards our 1st support at 1.30509 in line with 127.2% Fibonacci Projection. Prices are trading below our ichimoku clouds, further supporting our bearish bias. Alternatively, breaking the 1st resistance at 1.31576 in line with 38.2% Fibonacci retracement will call for further bullish continuation towards our 2nd resistance at 1.31825 in line with 50% Fibonacci retracement.
Areas of consideration:
- H4 1st resistance at 1.31825
- H4 1st support at 1.31576
USD/CHF:
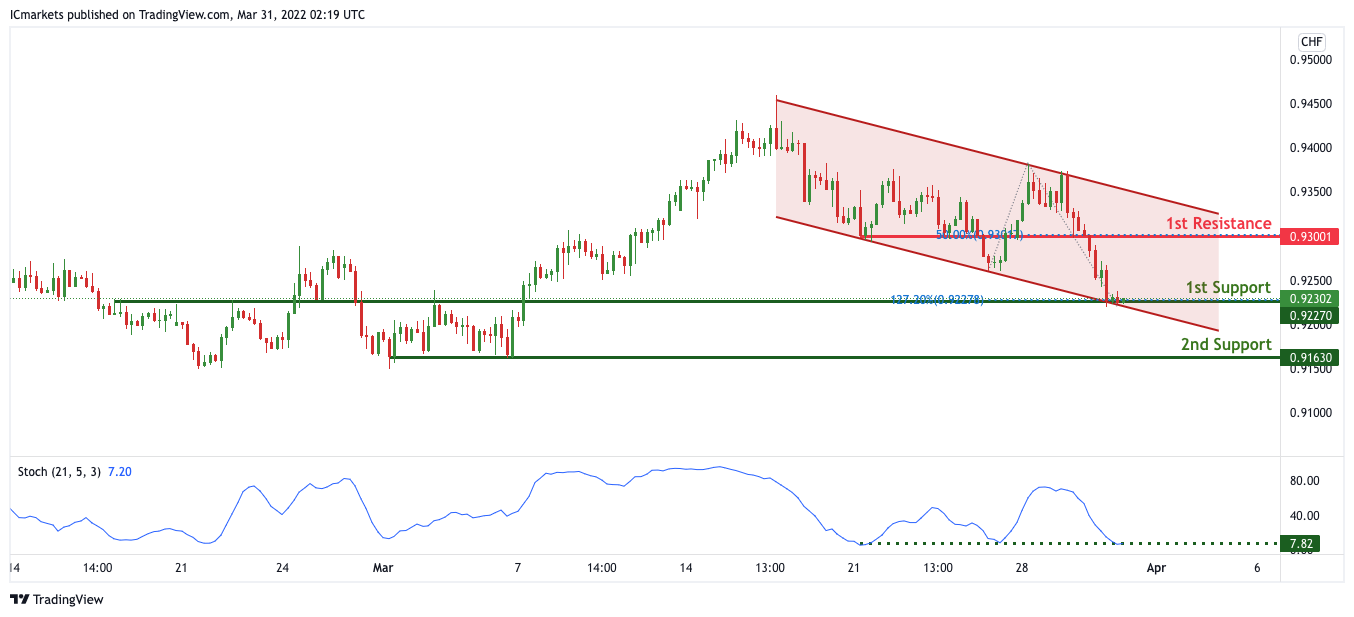
On the H4, with price expected to bounce off the support of the stochastics indicator, we have a bias that price will rise to our 1st resistance at 0.93001 in line with the 50% Fibonacci retracement from our 1st support at 0.92302 in line with the horizontal overlap support and 127.2% Fibonacci extension. Alternatively, price may break 1st support structure and head for 2nd support at 0.91630 in line with the swing low support.
Areas of consideration
- 1st support level at 0.92302
- 1st resistance level at 0.93001
EUR/USD :
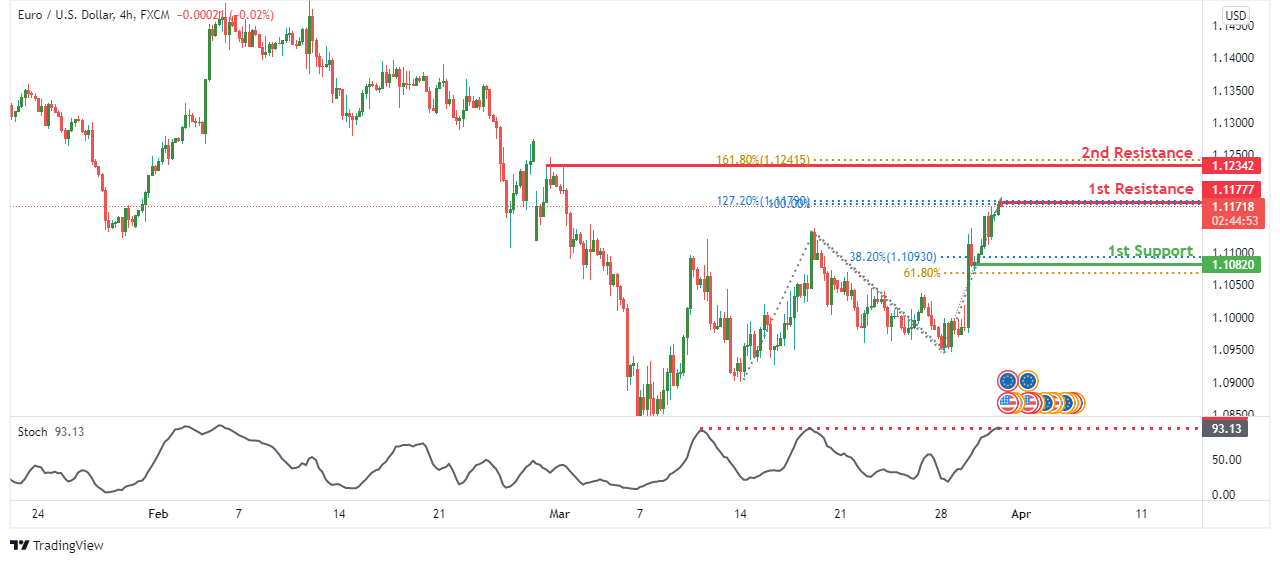
On the H4 timeframe, we see the potential for a bearish reversal from our 1st resistance at 1.11777 in line with 100% Fibonacci projection and 127.2% Fibonacci extension towards our 1st support at 1.10820 in line with 38.2% Fibonacci retracement and 61.8% Fibonacci projection. Our bearish bias is supported by the stochastic indicator where price is at resistance level.
Areas of consideration :
- H4 1st resistance at 1.11777
- H4 1st support at 1.10820
USD/JPY:
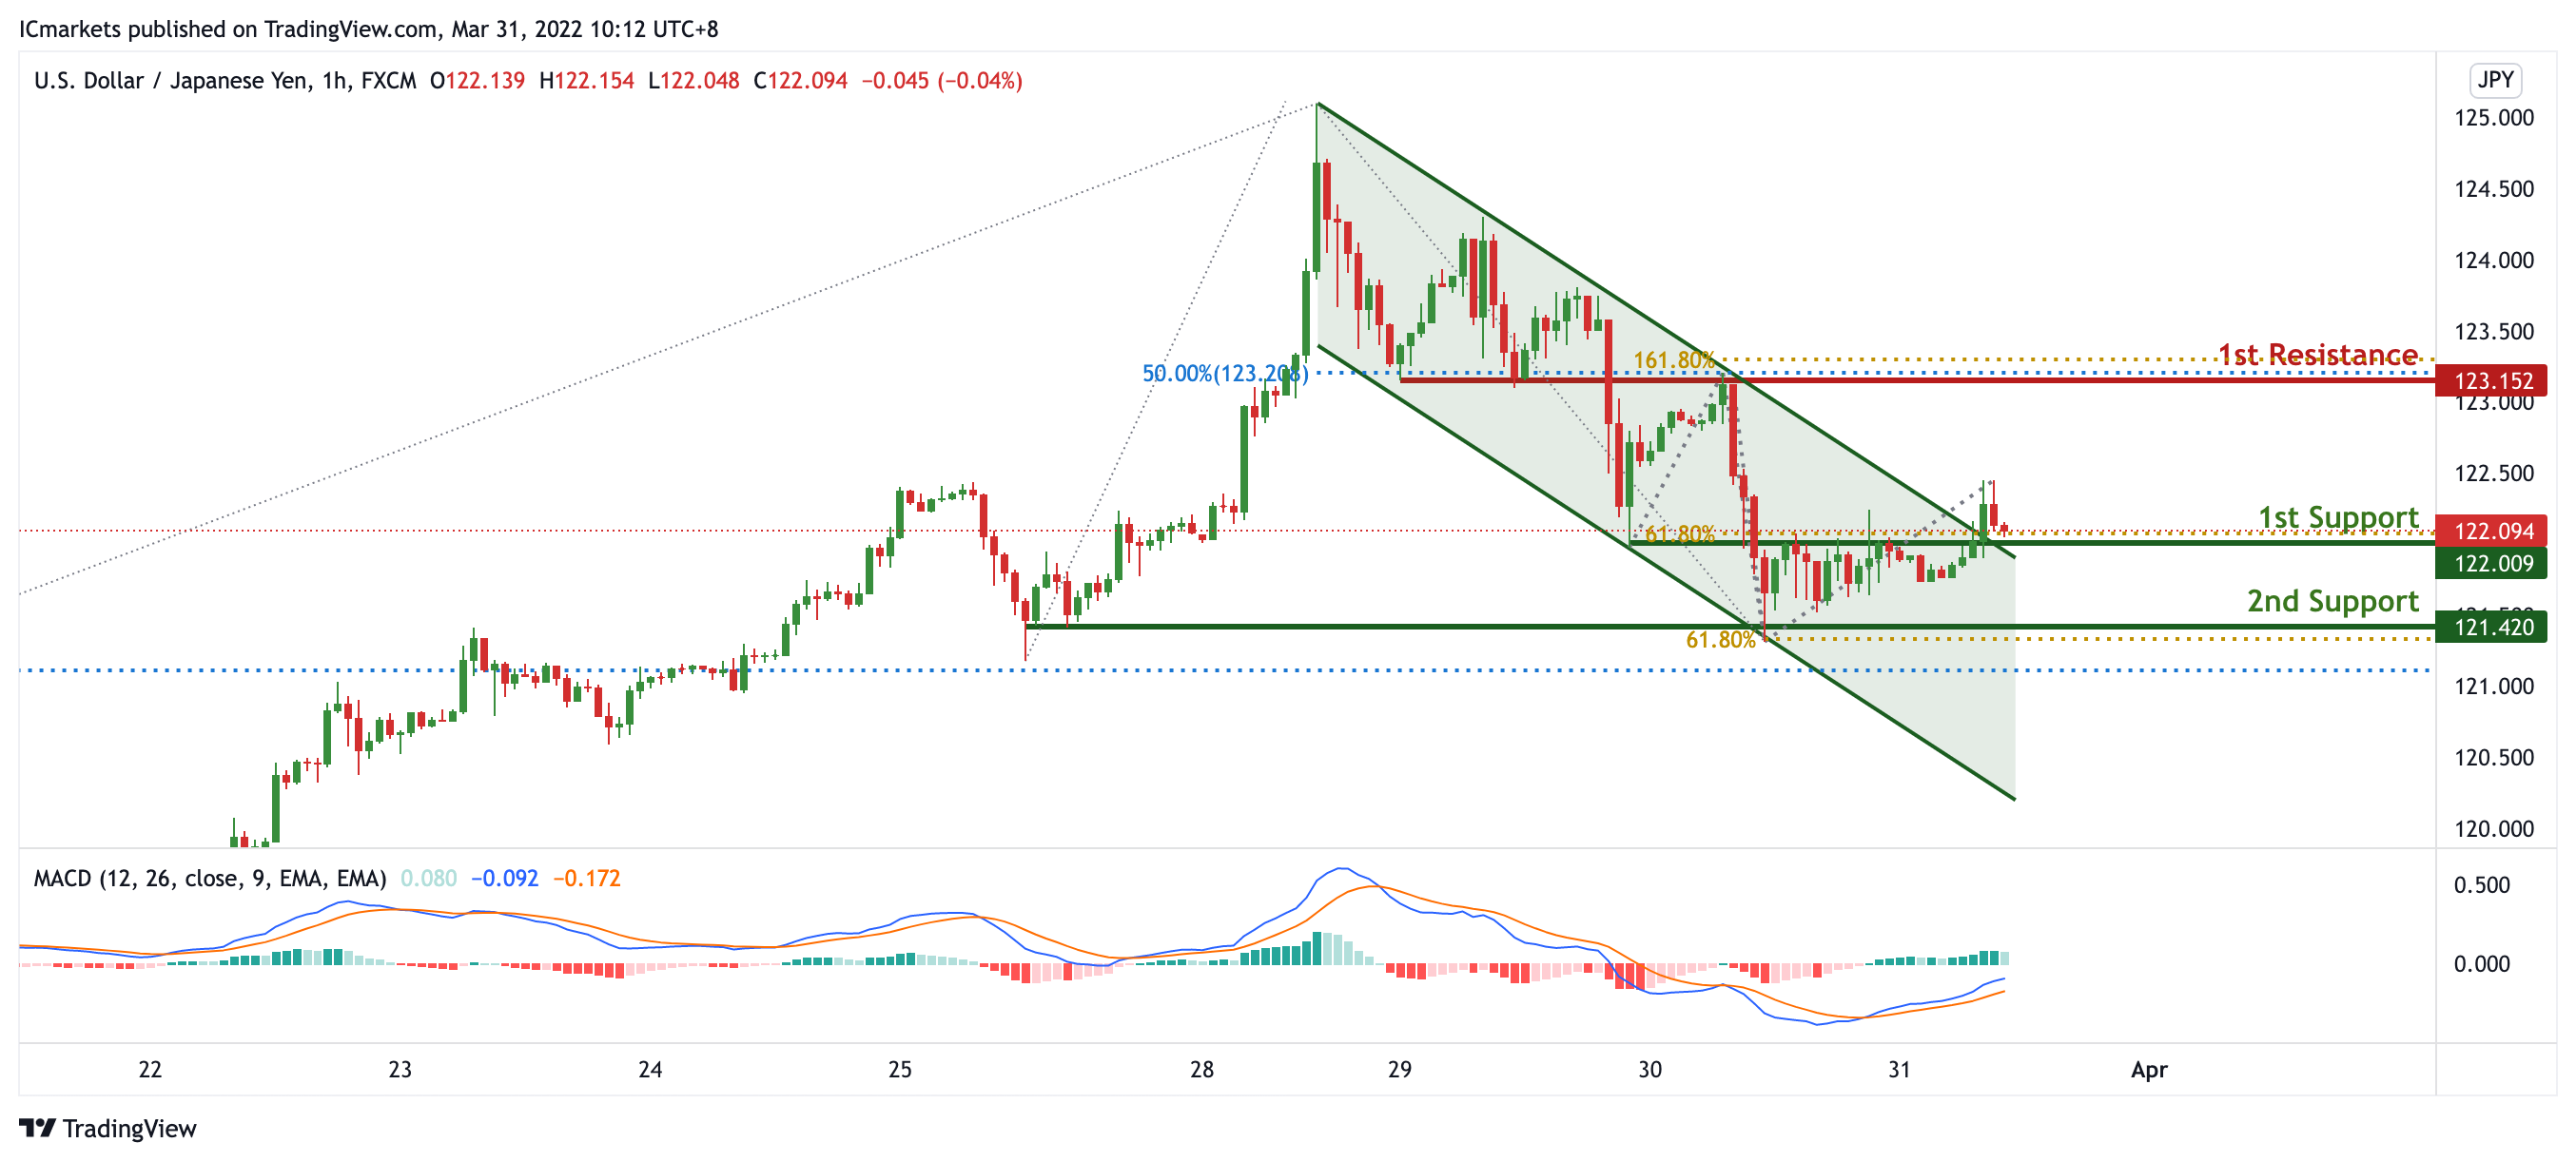
On the H1 timeframe, prices have broken out of our bearish channel. We see the potential for a bounce from our 1st support at 122.009 in line with 61.8% Fibonacci retracement towards our 1st resistance at 123.152 which is an area of Fibonacci confluences. MacD is supporting our bullish bias.
Areas of consideration:
- H4 time frame, 1st resistance at 123.152
- H4 time frame, 1st support at 122.009
AUD/USD:
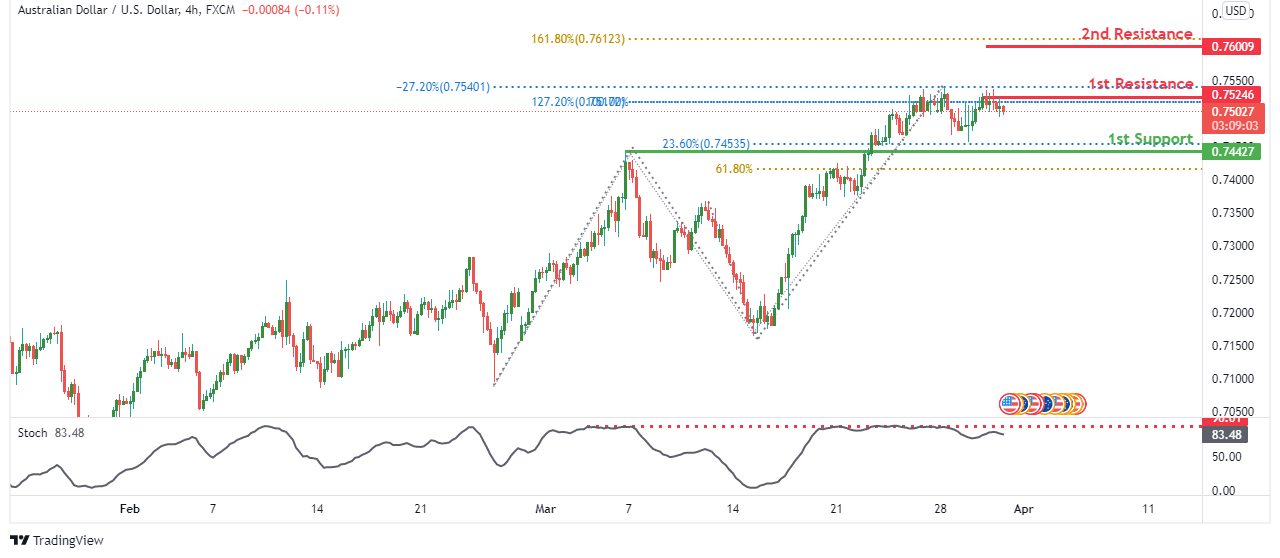
On the H4 timeframe, we see the potential for a bearish reversal from our 1st resistance at 0.75246 in line with 127.2% Fibonacci extension and -27.2% Fibonacci expansion towards our 1st support at 0.74427 in line with 23.6% Fibonacci retracement and 61.8% Fibonacci projection. Our bearish bias is supported by the stochastic indicator where price is at resistance level
Areas of consideration
- H4 1st resistance at 0.75246
- H4 1st support at 0.74427
NZD/USD:
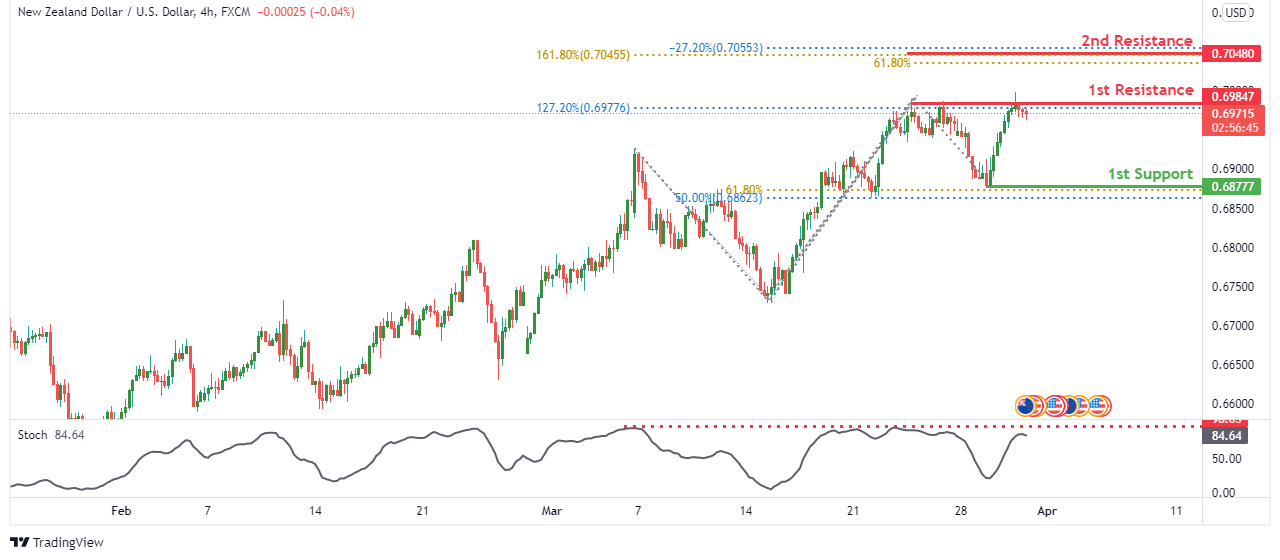
On the H4 timeframe, we see the potential for a bearish reversal from our 1st resistance at 0.69847 in line with 127.2% Fibonacci extension towards our 1st support at 0.68777 in line with 50% Fibonacci retracement. Our bearish bias is supported by the stochastic where it is trading at resistance level.
Areas of consideration :
- H4 1st resistance at 0.69897
- H4 1st support at 0.69145
USD/CAD:
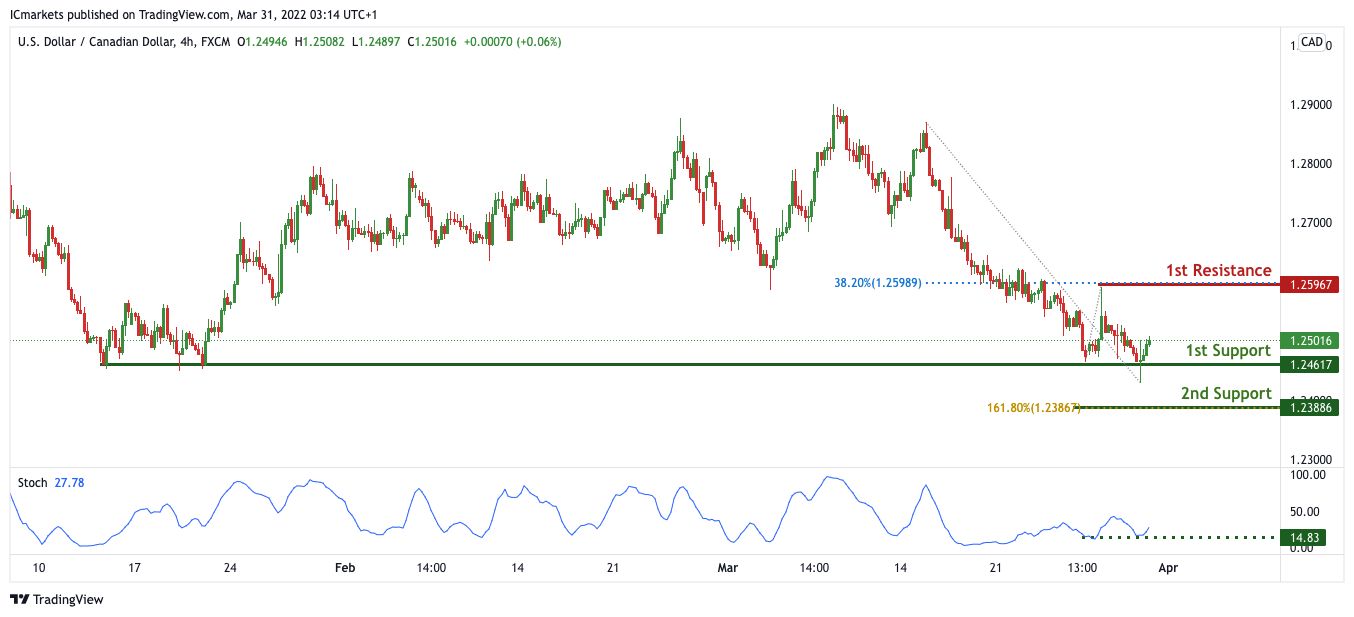
On the H4, with price expected to bounce off the support of the stochastics indicator, we have a bias that price will rise to our 1st resistance at 1.25967 in line with the 38.2% Fibonacci retracement from our 1st support at 1.24617 in line with the horizontal swing low support. Alternatively, price may break 1st support structure and head for 2nd support at 1.23886 in line with the 161.8% Fibonacci extension.
Areas of consideration:
- H4 time frame, 1st support at 1.24617
- H4 time frame, 1st resistance at 1.25967
OIL:
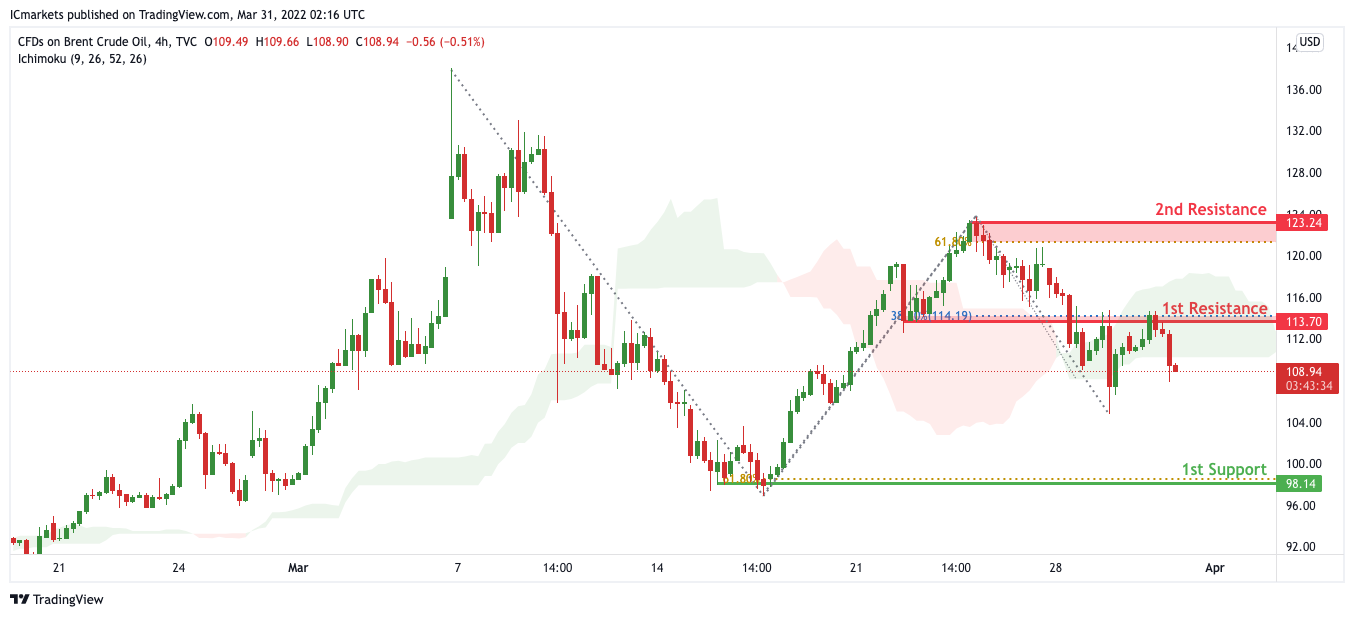
On the H4, with price expected to bounce off the support of the ichimoku cloud, we have a bias that price will rise to our 1st resistance at 113.70 in line with the 38.2% Fibonacci retracement from our 1st support at 98.14 in line with the horizontal swing low support and 61.8% Fibonacci retracement. Alternatively, price may break 1st support structure and head for 2nd support at 123.24 in line with the 61.8% Fibonacci retracement.
Areas of consideration:
- H4 time frame, 1st resistance of 113.70
- H4 time frame, 1st support of 98.14
Dow Jones Industrial Average:
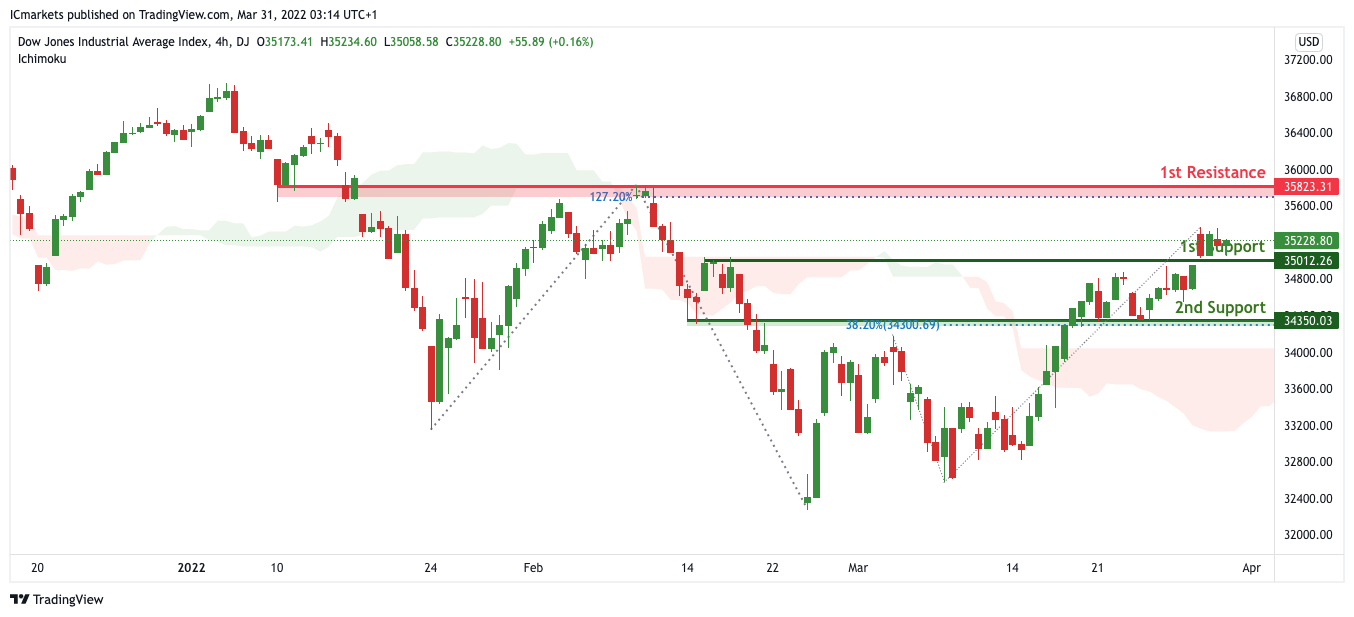
On the H4, with price moving above the ichimoku cloud, we have a bias that price will rise to our 1st resistance at 35823 in line with the 127.2% Fibonacci extension from our 1st support at 35012 in line with the horizontal pullback support. Alternatively, price may break 1st support structure and head for 2nd support at 34350 in line with the horizontal overlap support and 38.2% Fibonacci retracement.
Areas of consideration :
- H4 1st support at 35012
- H4 1st resistance at 35823
Crude Oil Price Aims Fresh Increase If It Clears $114
Key Highlights
- Crude oil price stayed above the $100 support zone.
- A key bearish trend line is forming with resistance near 112.50 on the 4-hours chart.
- Gold price must clear $1,940 and $1,950 to gain bullish momentum.
- The US GDP increased 6.9% in Q4 2021, less than the forecast of 7%.
Crude Oil Price Technical Analysis
After a steady increase, crude oil price faced sellers near the $118.40 level against the US Dollar. The price started a downside correction below the $115.00 support.
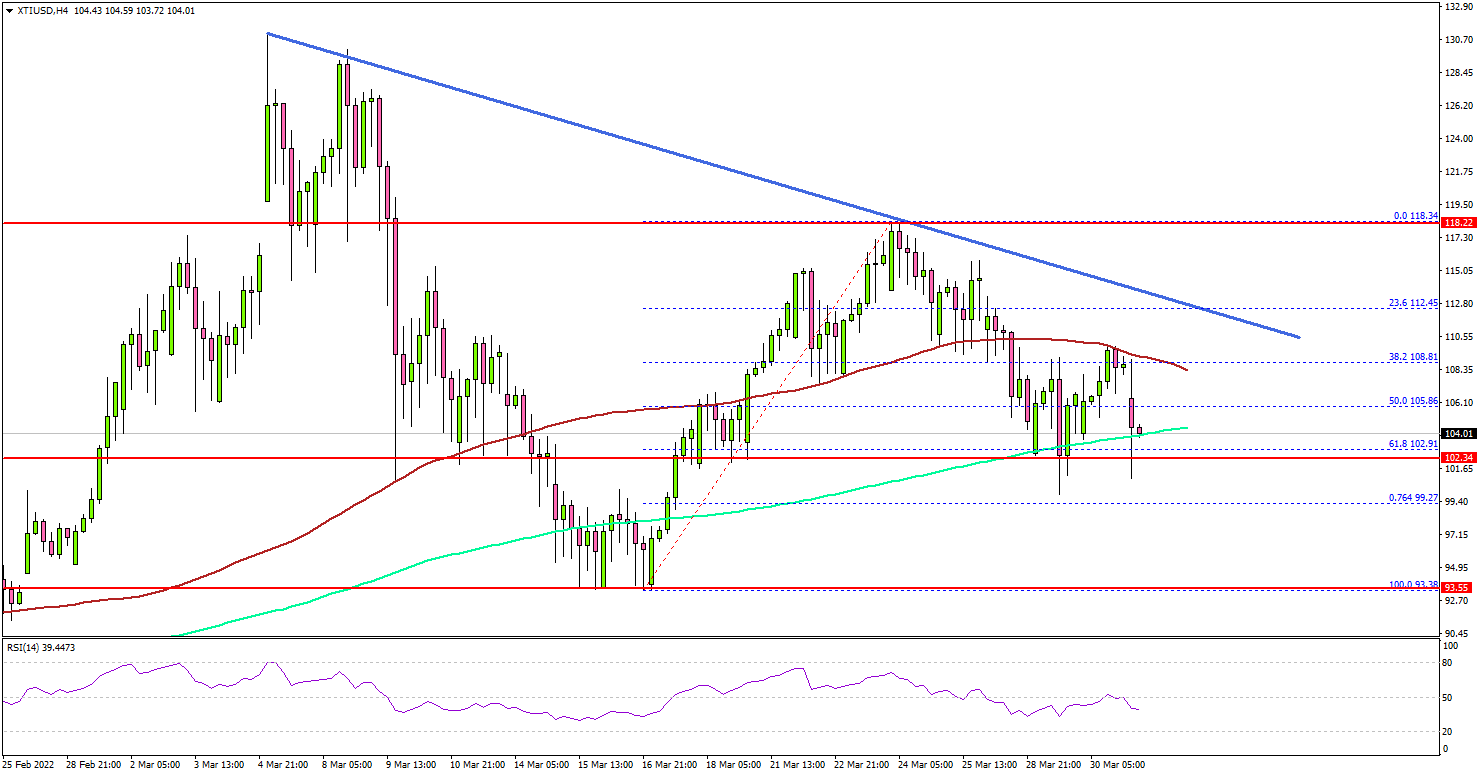
Looking at the monthly chart of XTI/USD, the price declined below the $105.00 support level and the 100 simple moving average (red, 4-hours). It even broke the 50% Fib retracement level of the upward move from the $92.36 swing low to $118.34 high.
However, the bulls remained active near the $100.00 level and the 200 simple moving average (green, 4-hours). The price stayed above the 76.4% Fib retracement level of the upward move from the $92.36 swing low to $118.34 high.
It is now recovering, but facing resistance near $112.00. There is also a key bearish trend line forming with resistance near 112.50 on the same chart.
A clear move above the trend line resistance and then $114.00 could start a strong increase. The next major resistance might be near the $118.00 level. If there is no upside break, the price could start another decline below $105.00.
The next major support is near $102, below which there is a risk of a move towards the $100 level. Any more losses might call for a test of the $94.00 support.
Fundamentally, the US Gross Domestic Product for Q4 2021 was released yesterday by the US Bureau of Economic Analysis. The market was looking for a growth rate of 7%.
The actual result was lower than the forecast, as the US Gross Domestic Product increased 6.9%. Besides, the GDP Price Index increased 7.1%, less than the forecast of 7.2%.
Looking at the gold price, the bulls prevented more losses below the $1,900 level, but it could struggle to climb above the $1,940 resistance.
Economic Releases to Watch Today
- UK GDP Q4 2021 (QoQ) - Forecast +1%, versus +1% previous.
- UK GDP Q4 2021 (YoY) - Forecast +6.5%, versus +6.5% previous.
- US Initial Jobless Claims - Forecast 197K, versus 187K previous.
Elliott Wave View: NZDUSD Rally Should Continue
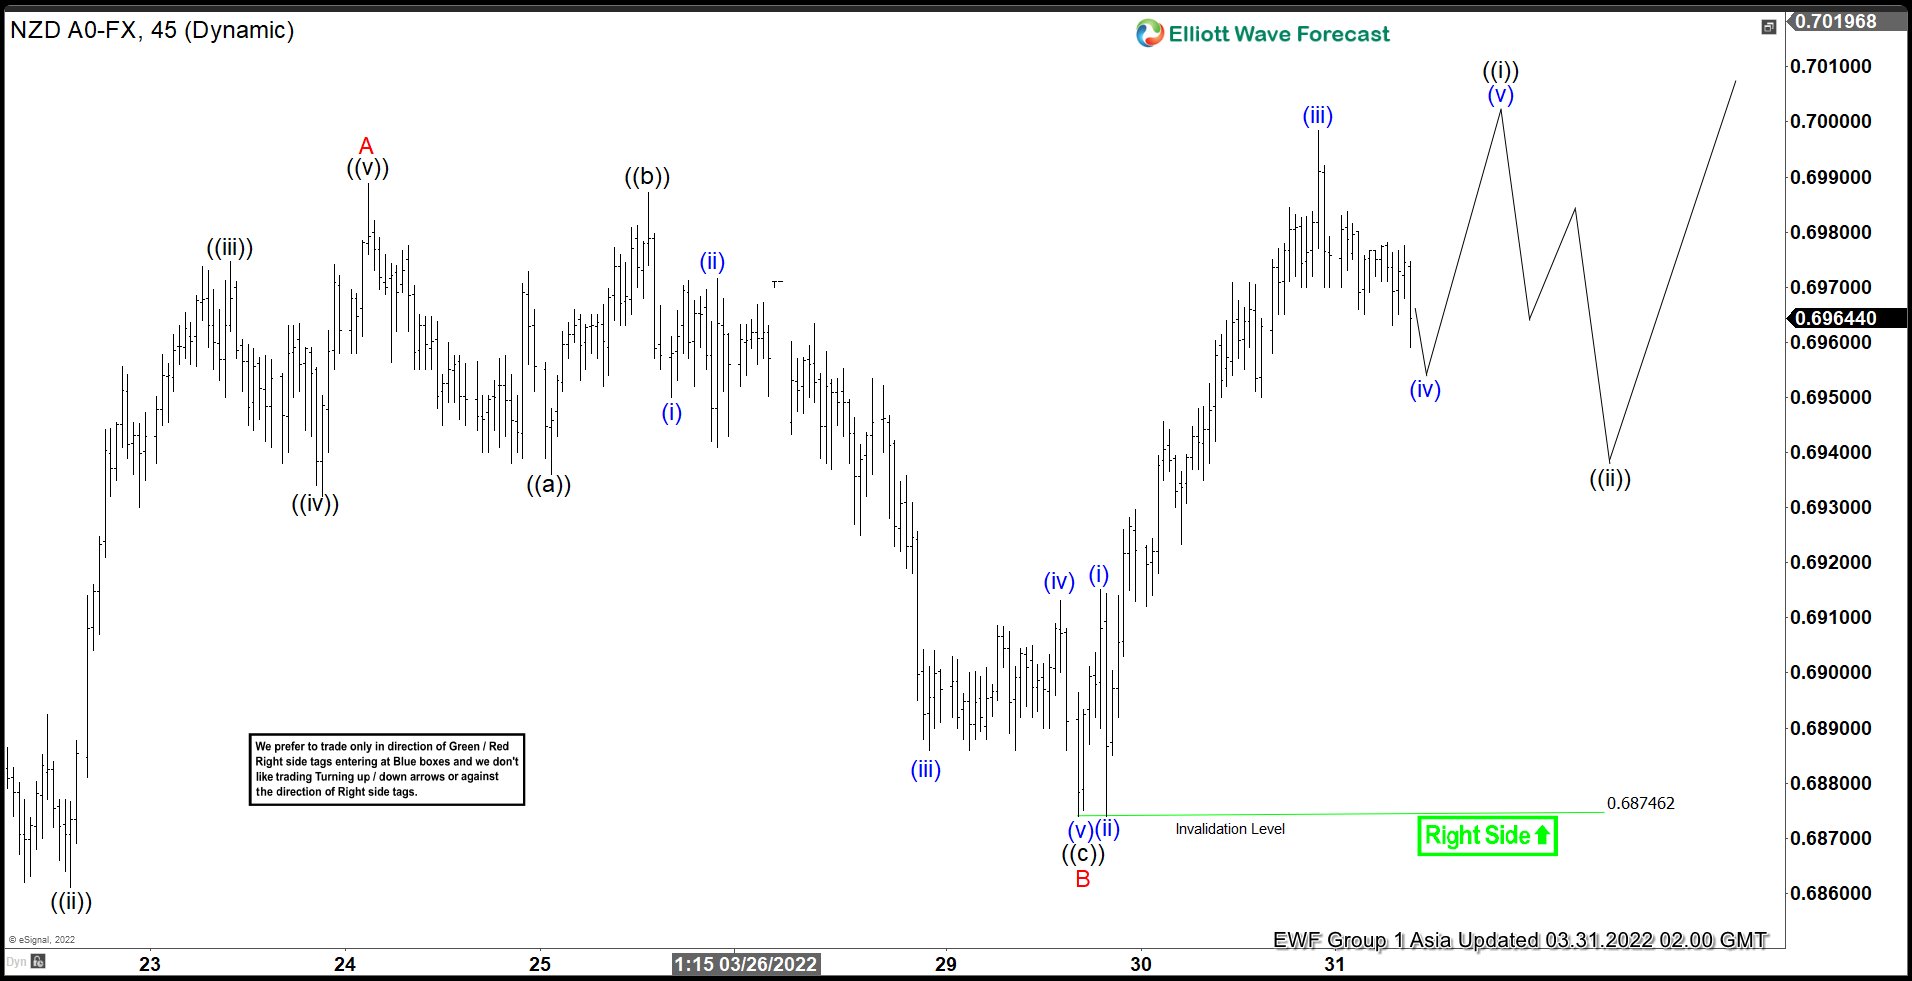
Short Term outlook in NZDUSD suggests rally from March 15, 2022 low is unfolding as a zigzag Elliott Wave structure. Up from March 15 low, wave ((i)) ended at 0.679 and dips in wave ((ii)) ended at 0.6738. Pair then rallies again in wave ((iii)) towards 0.692, and pullback in wave ((iv)) ended at 0.686. Final leg higher wave ((v)) ended at 0.6988. This completed wave A. Pullback in wave B finished at 0.687 with internal subdivision of a zigzag in lesser degree. Down from wave A, wave ((a)) ended at 0.693, wave ((b)) ended at 0.698, and wave ((c)) ended at 0.687.
Pair has resumed higher in wave C which subdivided in a 5 waves impulse in lesser degree. Up from wave B, wave (i) ended at 0.6915, and wave (ii) ended at 0.687. Wave (iii) ended at 0.70 and pullback in wave (iv) ended at 0.696. Near term, pair has scope to extend 1 more leg before ending wave (v) and ((i)) in higher degree. Afterwards, it should pullback in wave ((ii)) to correct cycle from March 29, 2022 low (0.6875) before the rally resumes. Near term, as far as pivot at 0.6875 low stays intact, expect dips to find support in 3, 7, or 11 swing for further upside.
NZDUSD 45 Minutes Elliott Wave Chart