Sample Category Title
EUR/USD Eyes 1.12xx Area: Elliott Wave Analysis
The latest news from Russia-Ukraine negotiations has some positive impact on stocks that are still climbing and searching for resistance. It was the Russian Defence Ministry that announced that they will scale down military activity around Kyiv and Chernihiv.
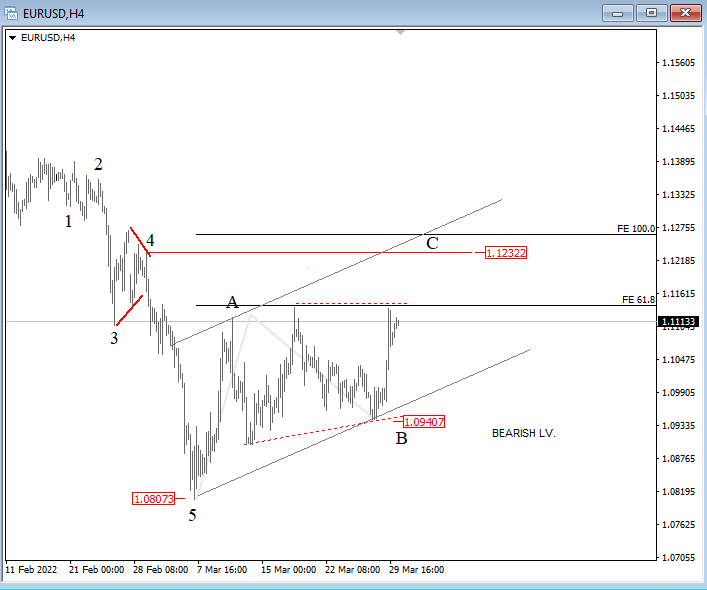
EURUSD is in new recovery mode in the 4-hour chart, but notice that the wave structure still looks corrective, so we are still tracking a bigger A-B-C corrective rally that can retest 1.12xx resistance area before we will potentially see another decline. Keep in mind that bears may step in only if turns back sharply beneath 1.0940 region. On the other hand, in case if goes impulsively towards 1.13 area, then it may have already found the support.
EUR/USD Elliott Wave analysis
ECB Lagarde emphasizes principles of optionality, gradualism and flexibility
ECB President Christine Lagarde said in a speech the economic impact of Ukraine war is a "supply shock" that " simultaneously pushes up inflation and reduces growth." Three main favors are likely to take inflation higher, including energy, food, and manufacturing bottlenecks.
The war also posses "significant risks" to growth, implying a loss of EUR 150B in the economy in one year. The conflict also "drain confidence" through at least two channels. Firstly, households become more pessimistic and cut back on spending. Secondly, business investment is likely to be affected.
As for ECB, Lagarde said the best way to navigate this uncertainty is to emphasize the "principles of optionality, gradualism and flexibility." Optionality means if incoming data support that medium term inflation will not weaken after the end of net asset purchases, the APP will be concluded in Q3. But ECB also stand ready to revise the schedule for net asset purchases in terms of size and/or duration. Gradualism means the adjustments to interest rate will take place "some time" after end of net purchases and will be gradual. Flexibility means ECB will use the its toolkit to ensure policy is transmitted evenly across all parts of Eurozone.
Bitcoin: It’s Not the End of the Rally
BTC was down 1.1% on Tuesday, ending the day near $47,400, and has been remaining close to that level on Wednesday morning. Ethereum lost 0.5%, while other leading altcoins from the top ten fell in price, from -0.8% (Binance Coin) to -4.1% (XRP). The only exception was Terra (+7%), which reached its all-time high.
According to CoinMarketCap, the total capitalization of the crypto market decreased by 0.7% over the day to $2.13 trillion. The Bitcoin dominance index remained at 42.1%.
The Cryptocurrency Index of Fear and Greed for Wednesday is down 1 point to 55, but still is in greed territory.
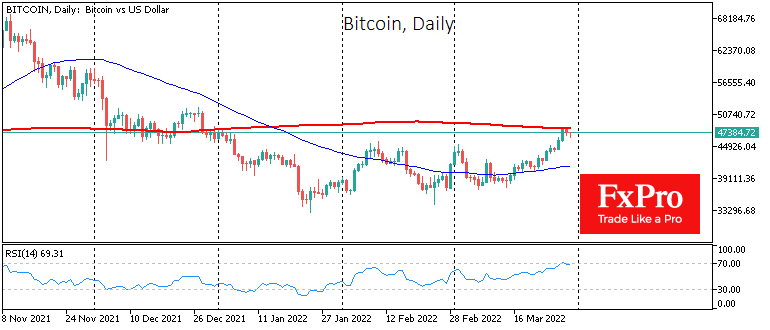
Bitcoin slowed down ahead of strong resistance at $48,000, near which the 200-day moving average also lies. The bulls are taking a tactical breather after the 28% rally from the lows seen on March 14th. At the same time, the positive mood on the global stock markets sets up that we will already see a test of this important level today.
The FxPro Analyst Team mentioned that now we will see the return of the bullish trend only after a couple of days of confident growth above the 200-day Moving Average. But even then, many participants may still have doubts about the rally since, in December, under similar conditions, it was not possible to develop an offensive.
According to CryptoQuant, Crypto whales have started sending bitcoin to exchanges again, which is a wake-up call. Typically, investors send cryptocurrencies back to the exchanges for their subsequent sale. CryptoQuant does not exclude that BTC will move to an active decline in the near future. However, the sale of bitcoins can also take place to buy altcoins, which are growing stronger than the first cryptocurrency in the bull market.
DataDash CEO Nicholas Merten believes that short-term investors and traders with leverage influence the volatility of bitcoin, and “whales” influence the growth. In his opinion, crypto whales have been buying up BTC over the past six months.
CEO of Tesla, Elon Musk, plans to create his own open-source social network with support for the DOGE cryptocurrency. Meanwhile, the Biden administration has proposed tightening tax reporting rules for cryptocurrency holders.
Gold Recoups Some Losses But 200-SMA Halts its Advance
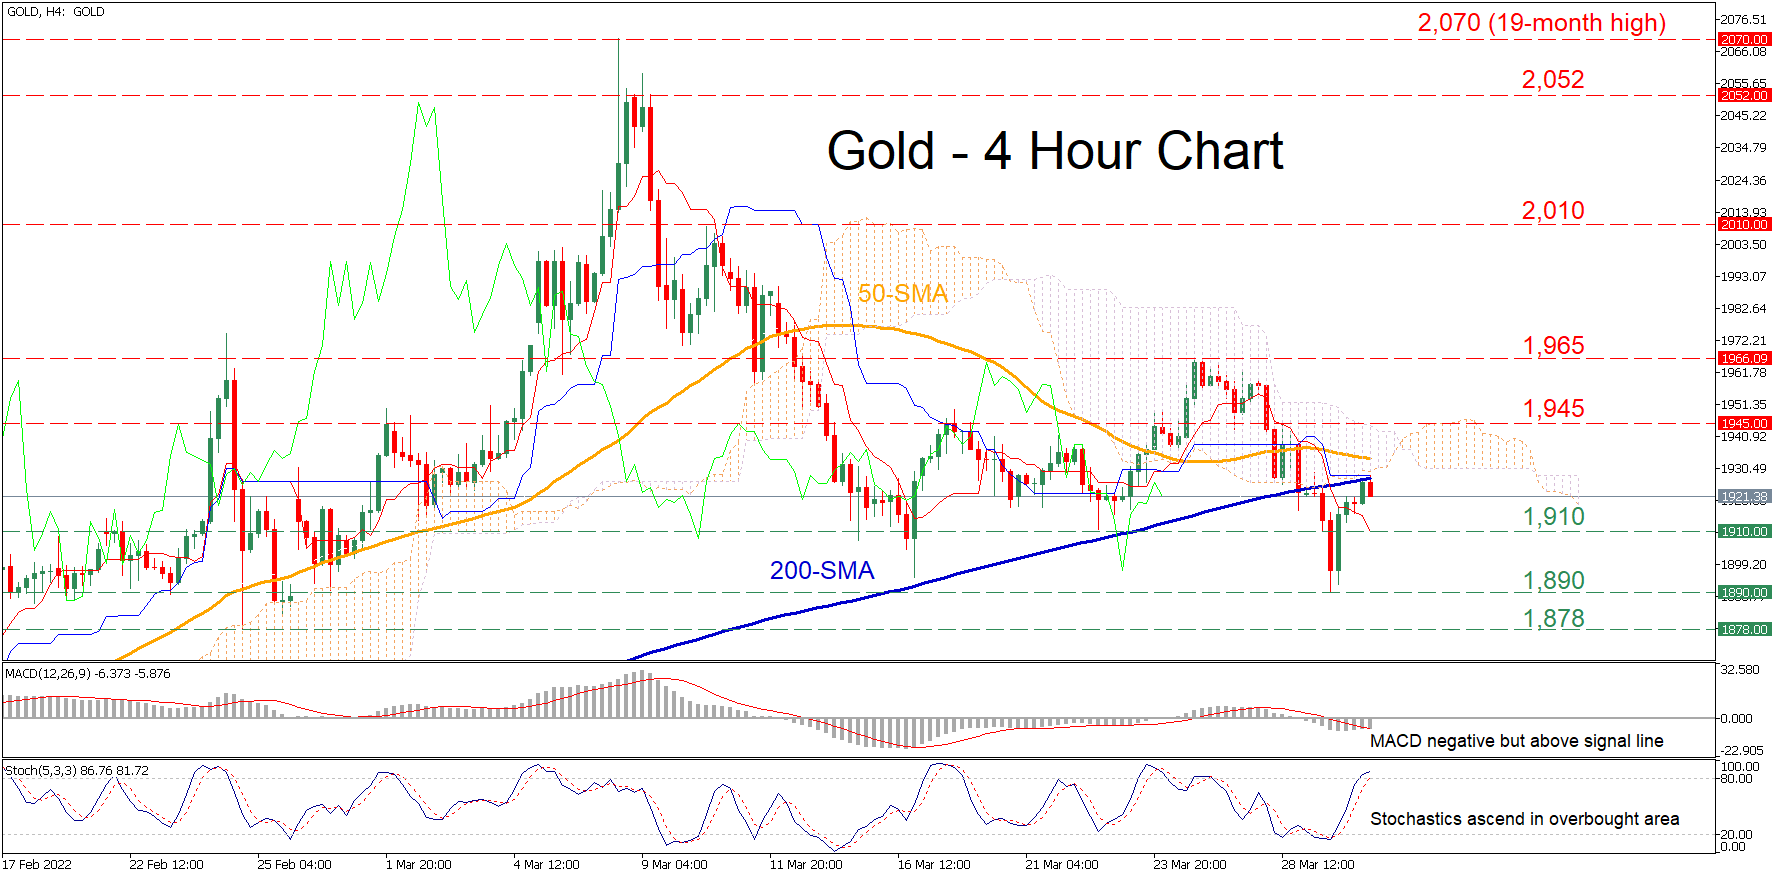
Gold experienced a sharp decline after trading sideways for the last two weeks. Although the precious metal has managed to bounce back in the last few four-hour sessions, the 200-period simple moving average (SMA) and the lower boundary of the Ichimoku cloud are capping its upside.
The momentum indicators suggest that the near-term bias is turning cautiously positive. Specifically, the stochastic oscillator is marching higher in the overbought region, while the MACD histogram is currently below zero but above its red signal line.
Should buying interest intensify further and the price slice through both is 50- and 200-period SMAs, initial resistance could be encountered at the 1,945 barrier. Further upside moves could stall at the recent high of 1,965 before the price ascends towards the 2,010 hurdle. Conquering the latter barricade, the bulls could aim for 2,052, a level which the price has failed to close above multiple times in March.
On the flipside, bearish actions could send the price to test the 1,910 obstacle. Piercing through this region, the March low of 1,890 could appear on the radar. Should that floor collapse, the price may descend towards the February resistance region of 1,878.
Overall, even though gold has staged a minor near-term rebound, both its short- and medium-term pictures remain bearish. Therefore, only a profound jump beyond the 1,965 ceiling could alter its short-term structure back to positive.
Nasdaq 100 Rally Accelerates as Corporate Consolidation Rebounds
US equities rallied on Tuesday as corporate consolidation did well. UnitedHealth Group announced that it would acquire LHC Group, a company that offers managed home services in the US. The value of the deal was estimated to be worth about $5.4 billion. Meanwhile, Nielsen, the TV ratings company agreed to be acquired by a group of private equity companies for $16 billion. Also, Goldman Sachs announced that it would buy NextCapital, a roboadvisor as it sought to diversify its income. The size of the deal was not revealed. The number of deals announced this year have been lower than those made in 2021 because of the difficult regulatory situation.
The US dollar retreated slightly as investors reflected on the latest economic data from the US and as negotiations between Russia and Ukraine continued. According to the Conference Board, the country’s consumer confidence rose from 105.7 to 107.2 in March. This increase was better than most analysts were expecting and it happened at a time when the country is seeing strong inflation. Additional data by the Bureau of Labor Statistics showed that the number of job openings in the US dropped slightly from 11.28 million to 11.26 million in January. And in a statement, Fed’s John Williams said that he will be open to a bigger rate hike if inflation persists.
The euro jumped against the US dollar as Russia and Ukraine continued their negotiations. Ukraine has expressed its openness for neutrality while Russia said that it will drop ‘denazification’ as a condition for talks. Moscow also said that it will stop its focus on Kyiv in the time being. The euro also rose after Russia reiterated that it will only accept rubles for its natural gas. The key numbers to watch will be the bloc’s industrial and services sentiment by the European Commission. Also, Christine Lagarde will give a speech.
EURUSD
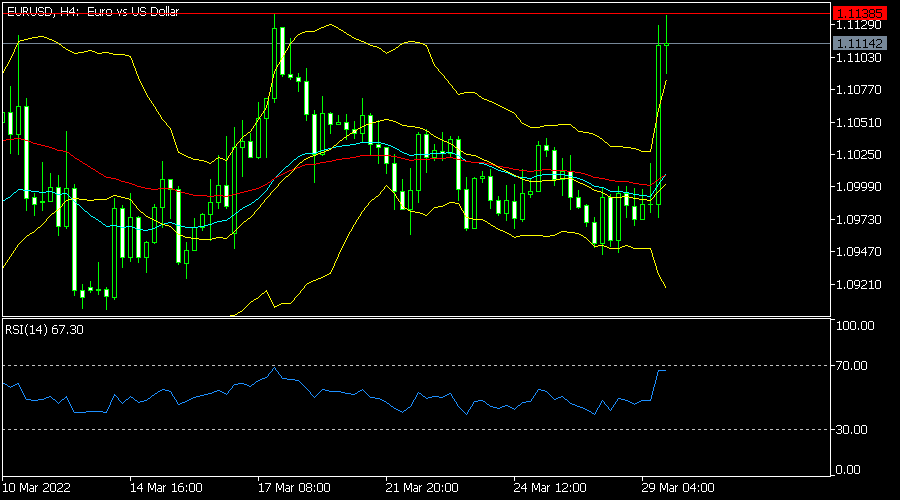
The EURUSD pair rose to a high of 1.1138, which was the highest level since March 17. This price was higher than the important resistance level at 1.1042. It also moved above the 25-day moving average and along the upper line of the Bollinger Bands. Also, it is between the 38.2% and 50% Fibonacci retracement level while the Relative Strength Index has been rising. Therefore, the pair will likely maintain a bullish trend today.
NAS100
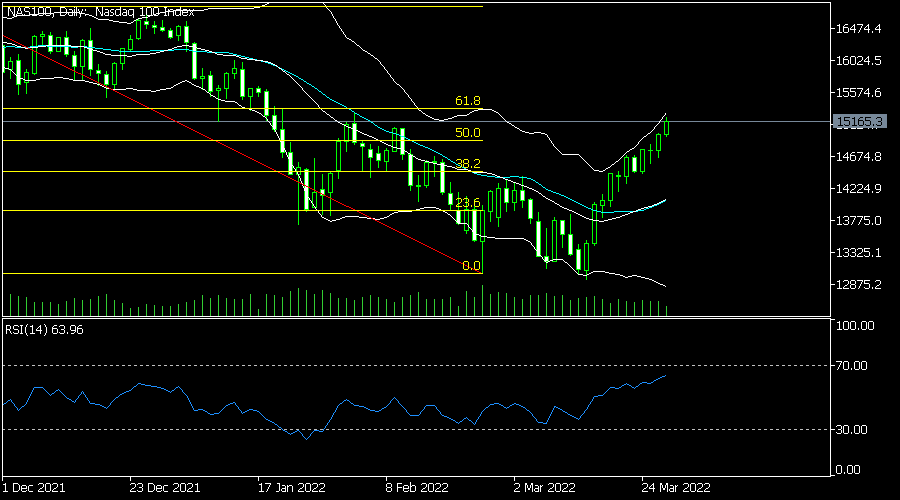
The Nasdaq 100 index maintained a bullish trend as demand for America’s tech companies rose. It is trading at $15,168, which was the highest point since February 16. On the daily chart, the price moved above the upper side of the Bollinger Bands while the RSI moved closer to the overbought level. The index is also approaching the 61.8% Fibonacci retracement level. Therefore, the bullish momentum will likely continue.
EURCHF
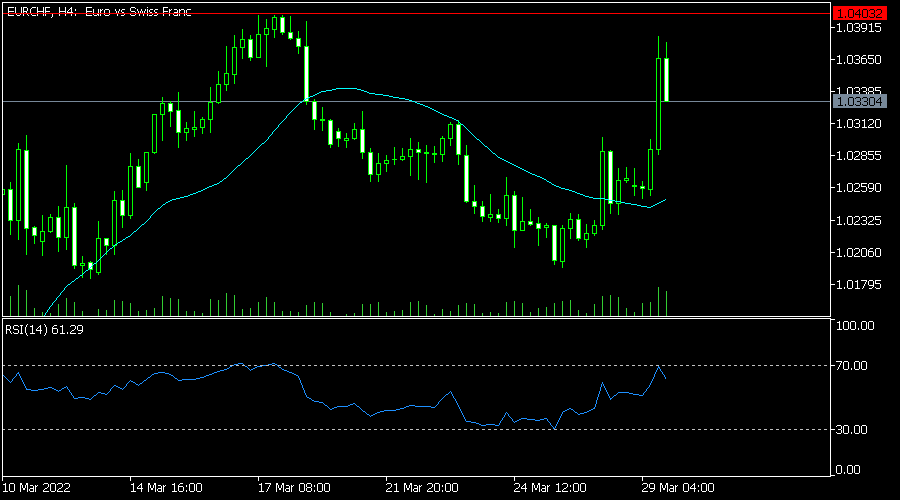
The EURCHF pair was little changed during the Asian session ahead of a speech by Christine Lagarde. It is trading at 1.0385, which is slightly below the important resistance at 1.0400. On the four-hour chart, the pair is slightly above the 25-day moving average while the RSI has been rising. Therefore, the pair will likely keep rising.
GBP/USD Pair Moved into a Bearish Zone Below $1.3150
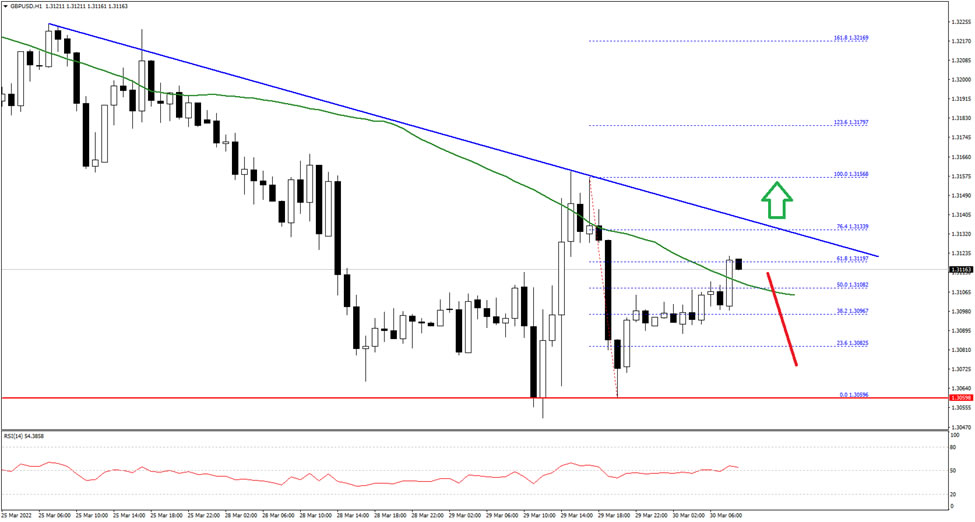
The British Pound started a fresh decline from the 1.3220 resistance against the US Dollar. The GBP/USD pair traded below the 1.3150 support zone to move into a bearish zone.
It even traded below the 1.3100 level and the 50 hourly simple moving average. The pair traded as low as 1.3059 and is currently correcting higher. An initial resistance on the upside is near the 1.3135 level and a bearish trend line on the hourly chart.
If there is a clear upside break above the trend line, the pair could rise steadily towards the 1.3200 level in the near term. The next major resistance sits near 1.3250 on FXOpen.
On the downside, an initial support is near the 1.3080 level. The main support is forming near the 1.3050 level. A break below the 1.3050 support could even push the pair below the 1.3000 support.
The Euro Cheered on FX Markets
Markets
Ceasefire talks in Istanbul showed signs of progress. Ahead of the negotiations, Ukraine indicated openness to neutrality and adopt a non-nuclear status in return for security guarantees. Afterwards, and to “increase mutual trust”, Russia said it would significantly scale back military activity around Kyiv.
Western officials stayed skeptical but equity markets didn’t. Stocks jumped up to 3% in Europe and almost 2% in the US. Oil prices intraday retreated 9% but capped losses to a little over 2% in the end (Brent at $110/b). EMU yields skyrocketed. Germany’s 2y rose more than 15 bps to trade positive for the first time since 2014 at some point as markets raised bets on ECB rate hikes. The rapid intraday decline in oil prices, however, offered counterweight via the inflation channel. Net changes amounted to 6.4-7.1 bps at the front-end of the German/EMU swap curve and 5.1-5.5 further out. In the US, where quite some Fed tightening is discounted by now, the oil price effect dominated completely. It resulted in a flattening move with yields up to 6.4 bps (10y) lower.
The euro cheered on FX markets, with EUR/USD testing the first meaningful resistance level at 1.1121 but eventually closing below 1.1086 (+1 big figure). EUR/GBP took out the 0.84 with great conviction and went for a test of the YtD highs at 0.845. The yen was not prepared for the euro but staged a minor comeback vs the USD. USD/JPY finished lower from 123.86 to 122.88.Japanese bonds sear at the (very) long end after the BoJ upped the ante (see below). The yen extends yesterday’s gains, this time also vs the euro. Technical considerations played a role as well. USD/JPY and EUR/JPY both entered overbought territory in recent days and momentum indicators showed signs of topping out. EUR/USD ekes out a gain to trade above 1.11. Core bonds rise.
The calendar starts to heat up today. We have ADP employment in the US and the EC’s economic confidence in the euro area. The first member state February inflation readings are due in Germany and Spain ahead of the EMU reading on Friday. An early reading in Germany’s state of North Rine-Westphalia (7.6% y/y, from 5.3%) clearly suggest upward risks. Markets will ponder the latest hopeful developments on the geopolitical front as well and what it may mean for central bank policy. If parties (Russia) are serious – and that’s a big if – it supports the case for (more, faster) tightening especially in Europe, even if commodity prices would ease. Keep a close eye at EUR/USD too. It is testing the upper bound of a closing triangle pattern. Will inflation readings today force a break higher?
News Headlines
Japanese retail sales declined of the third consecutive month by a bigger than expected -0.8% M/M, bringing sales also 0.8% below the level of the same month last year. Sales growth February was still hampered by restrictions to address the spread of the latest wave of the coronavirus. The data suggest the risk of very mediocre or even negative growth in Q1, complicating the government’s efforts to organize a demand driven recovery.
In this context, the BoJ this morning stepped up its efforts to prevent an unwarranted rise of yields/tightening of economic conditions. The bank today raised the amounts of bonds it planned to buy at regular operations in the 3y-10y segment. At the same time, it also offered to buy ultra-long JGB’s in an unscheduled operation. Earlier this week the bank already announced unlimited buying of 10-y bonds to protect the 0.25% cap for the 10-y yield. Contrary to yesterday, yields today declined across the curve. The 10-y yield currently trades near 0.21%. The 30-y yield dropped to 0.98%, compared to a peak level of 1.10% yesterday.According to the Australian trade Minister Tehan, Australia and India are getting very close to finalize a free trade agreement. An announcement might be released in coming days. According to the Australian government mutual trade between the two countries was about a$ 24 bln in 2020. Access of Australia to the Indian agriculture market is said to be one of the remain points of discussion. The attempt to reach a trade agreement between India and Australia come as trade relations between Australia and China are under pressure.
Solid Appetite Amid De-escalation in Ukraine and Cheaper Oil
Risk appetite improved, equities extended rally as talks between Ukraine and Russia hinted at progress, with Russia retreating from Kyiv to concentrate its military efforts in the Donbas region. The de-escalation gave a sigh of relief to investors, although many, including Joe Biden remain skeptical regarding the pullback from Kyiv, that could be ‘limited and tactical’.
But hope is hope, and it is being priced in. The German DAX rallied 2.80% yesterday and closed the session a touch below a major Fibonacci retracement. The French CAC40 rallied more than 3% to above its 200-DMA for the first time since the beginning of the war, as the FTSE100 lagged behind its European peers and gained less than 1% as oil tumbled. Yet the British blue-chip index lost much less than its peers thanks to its solid exposure to oil and commodities, and the outlook for energy and mining companies remain comfortably positive.
Critical 50-DMA holds
US crude dived to the 50-DMA yesterday, but that critical support held strong, and the price of a barrel rebounded back above the $105 level. The short-term outlook remains positive and price pullbacks are still seen as interesting dip buying opportunities if the 50-DMA is not cleared.
This week, OPEC and Russia are not expected to increase production by more than 400’000 barrels.
2-10y inversion
The three major US indices followed up on the European session gains on de-escalation of the situation in Ukraine, but the US 2-year yield caught up, and even briefly surpassed the 10-year yield for the first time since 2019.
No one knows if the latter means an imminent recession in the US, but we know for sure that the behaviour of the yield curve comes as a warning that the artificially supported growth since the subprime crisis will no longer be, and the economy will have to fly with its own wings until at least we see inflation coming back to policy target levels.
Rising US yields, and de-escalation in Ukraine weigh on gold prices. The price of an ounce tipped a toe below the $1900 mark yesterday, but bounced higher. Gold could return to its long-term down-trending channel if geopolitical tensions dissipate, but that may be just a wishful thinking for now, and the upside risks prevail as long as Russian soldiers remain on the Ukrainian territory.
Meme rally?
The curve inversion, nor rising inflation prevent Nasdaq from jumping above its 200-DMA. The S&P500 is up by near 13% since the latest February – March dip, and the meme stocks are on fire, with GameStop up by 158% in the past two weeks and AMC up by more than 160%.
Could the meme craze stretch higher? Yes, it could stretch to the levels the traders want them to! And because these stocks do not trade on fundamentals, the sky, or the moon, is the limit. It all depends on the overall risk appetite – but for now, the pajama traders defy rising inflation, tightening Fed, worsening pandemic and the war.
Data flow
The US will reveal how many private jobs it added in March today. Analysts predict a strong 455K print and a 7% GDP growth in the fourth quarter. Strong economic data will certainly boost the idea that the US economy is strong enough to withstand a tighter Fed policy to fight back inflation, while soft figures will hardly the doves, after JOLTs data confirmed more than 11 million jobs waiting to be picked up.
Soft dollar
US dollar rapidly gave back gains yesterday on de-escalation between Ukraine and Russia. The EURUSD rallied above the 1.11 mark and the dollar-yen returned below 122 after hitting 125 earlier this week.
If the diplomatic picture in Ukraine improved, we could see a deeper downside correction in the US dollar despite the hawkish shift in Fed expectations, as other central banks are turning hawkish on high inflation, as well. Today, the Eurozone flash inflation figures for March start flowing in, with inflation in Spain expected to reach 8%, and inflation in Germany seen at 6.3% from 5.1% printed a month earlier. The CPI figures rise fast, meaning that the European Central Bank (ECB) cannot continue turning a blind eye on the skyrocketing inflation, even with the growing threat of slower growth due to the pandemic and the war.
Daily Technical Analysis
EUR/USD
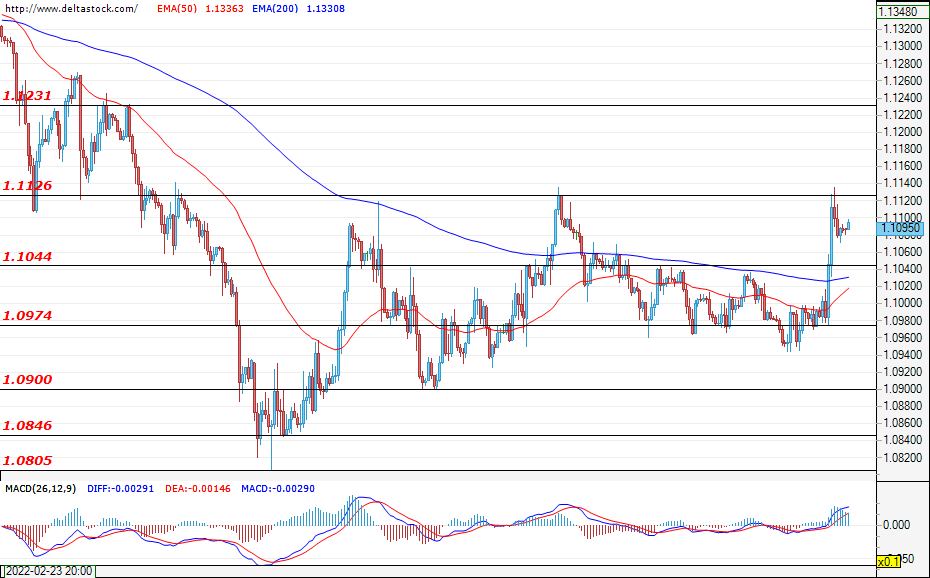
During yesterday’s trading session, the single European currency significantly increased its value against the U.S. dollar, reaching the critical resistance at 1.1126. However, this level appeared to be too strong of a resistance zone for the bulls to overcome. At the time of writing, the pair is hovering just below the mentioned resistance and the expectations are for another attack of this level. If it is successfully breached, then an upward movement towards the next resistance level at 1.1230 may be expected. On the other hand, if the bears prevail and the resistance at 1.1126 deflects the bullish pressure, then a test of the support at 1.1044 could be considered as an alternative scenario. Today, an increase in activity can be expected around the announcement of the GDP data for the United States at 12:30 GMT and the change in ADP non-farm employment data at 12:15 GMT, again for the United States.
USD/JPY
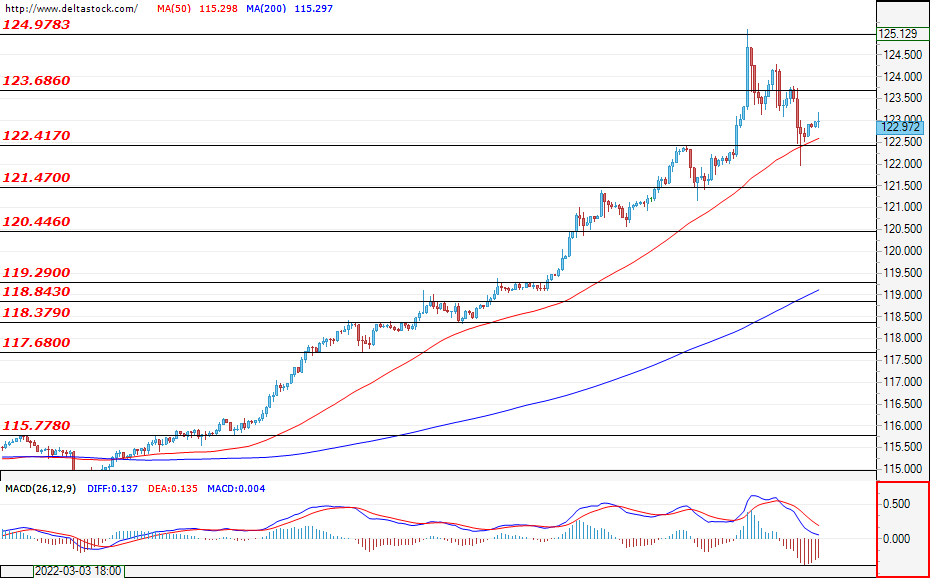
The currency pair entered a corrective phase following the unsuccessful attempt at breaching the resistance at 124.97 and made a fake breach of the support at 122.41. If the USD/JPY remains above this support level, then the uptrend may be restored and the pair could head towards a test of the resistance at 124.97. However, if the local resistance at 123.68 holds off the bulls’s attack, then a short consolidation in the range of 122.41 – 123.68 may be expected. In case the bears take control over the market and manage to violate the support at 122.41, then this may be considered as a signal that the correction could develop further and that the pair could move towards the zone at 121.47.
GBP/USD
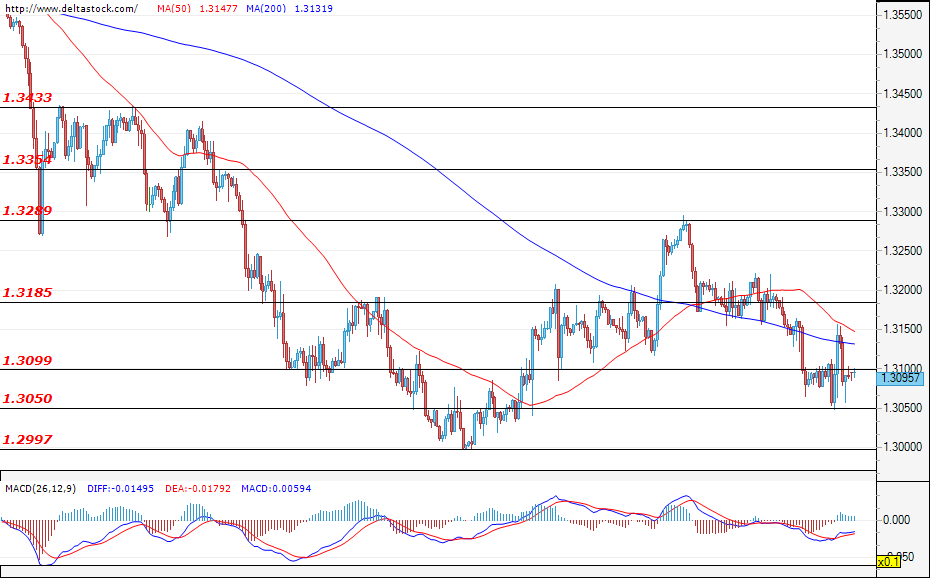
Neither the bears, nor the bulls managed to gain enough momentum and trading for the Cable remained locked in the zone between 1.3050 and 1.3100. A breach of the upper border, followed by a violation of the next target at 1.3185, could lead to a recovery and a move towards the major resistance at 1.3289. If the bears take control, then a breach of the support zone at 1.3050 could deepen the sell-off and could easily lead to new future losses for the sterling against the greenback and to a test of the psychological level at 1.3000.
EUGERMANY40
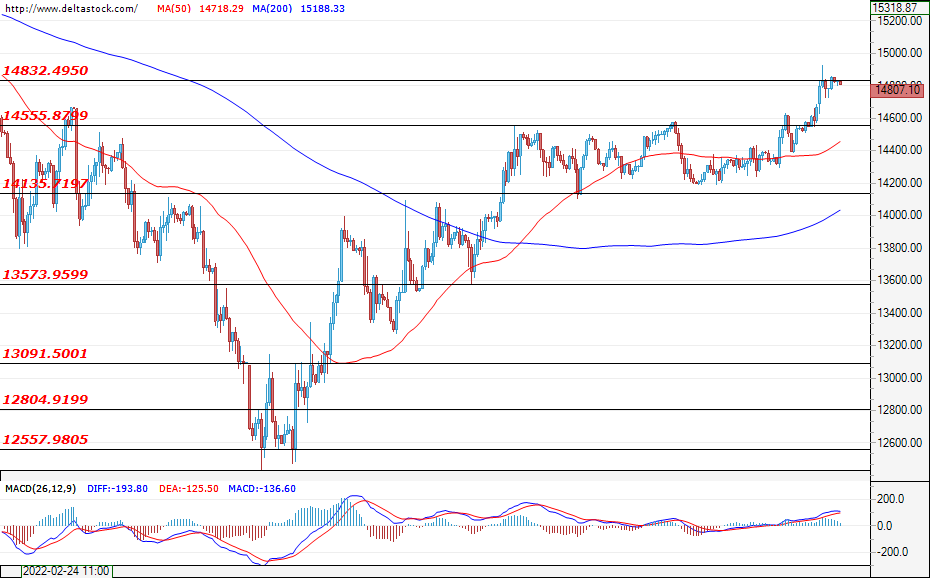
In recent days, optimism has returned to the market and the bulls have managed to overcome the key resistance at 14555. The price increase was mainly the result of the news that Russia agreed to reduce its military presence near Kyiv, which gave rise to new hopes that the war would soon end. The covering of short positions gave the rally some extra energy and the market is currently headed towards a test of the resistance at 14830. In case the bulls manage to violate this level, then the rally will most likely continue towards its next target – the resistance at 15000. On the other hand, the market participants are still very cautious because of the U.S. President Joe Biden’s sceptical remark that he will believe Russia when he actually sees it taking action, thus it is possible to witness a price correction towards the area at around 14555 before a potential resumption of the upward movement is to develop.
US30
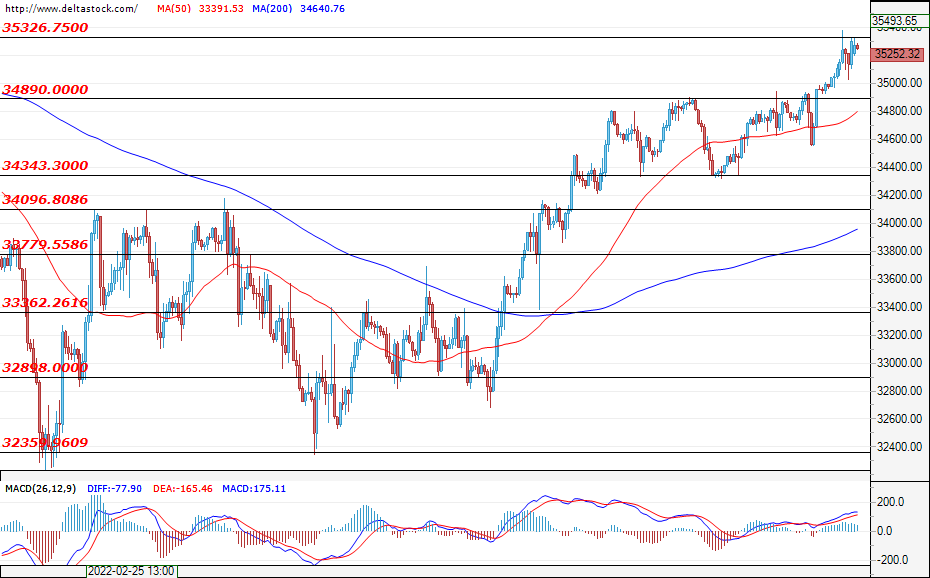
The recovery of the US30 continued throughout the previous session as well after we witnessed a successful breach of the resistance zone at 34890, and at the time of writing, the index is currently testing the 35326 level. A successful breach here could lead the index towards the next important area for the market participants at 35690. However, if the sellers re-enter the market and there is no confirmed breach of the mentioned resistance, then a corrective move towards the level at 34890 is a highly possible scenario for today’s trading session. The economic news, mentioned in the EUR/USD analysis, could have an impact on market participants’ sentiment, with volatility expected to increase around the announcement of the data.
FTSE 100 Heads Towards Recent Peak
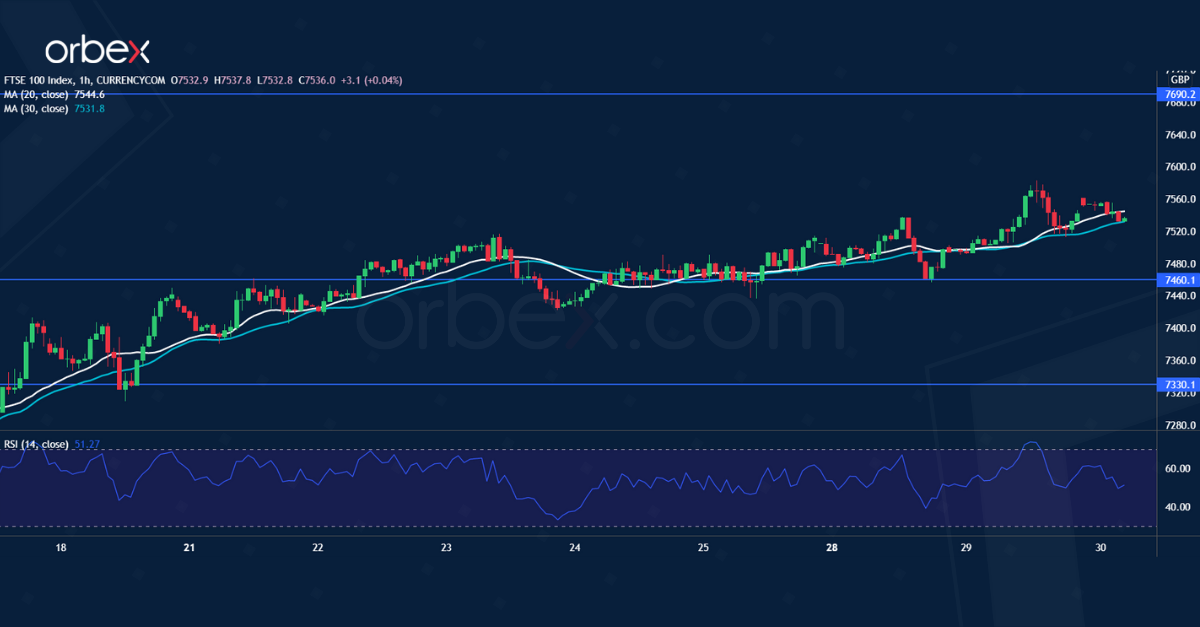
The FTSE 100 continues upward as Russia promises to de-escalate. A bullish close above the origin of the February sell-off at 7550 has put the index back on track.
Sentiment has become increasingly upbeat over a series of higher highs. The lack of selling pressure would send the index back to this year’s high at 7690.
A bullish breakout may resume the uptrend in the medium term. As the RSI shot into the overbought zone, profit-taking could drive the price down temporarily and 7460 would be the closest support.