Sample Category Title
EUR/GBP Daily Outlook
Daily Pivots: (S1) 0.8409; (P) 0.8445; (R1) 0.8505; More...
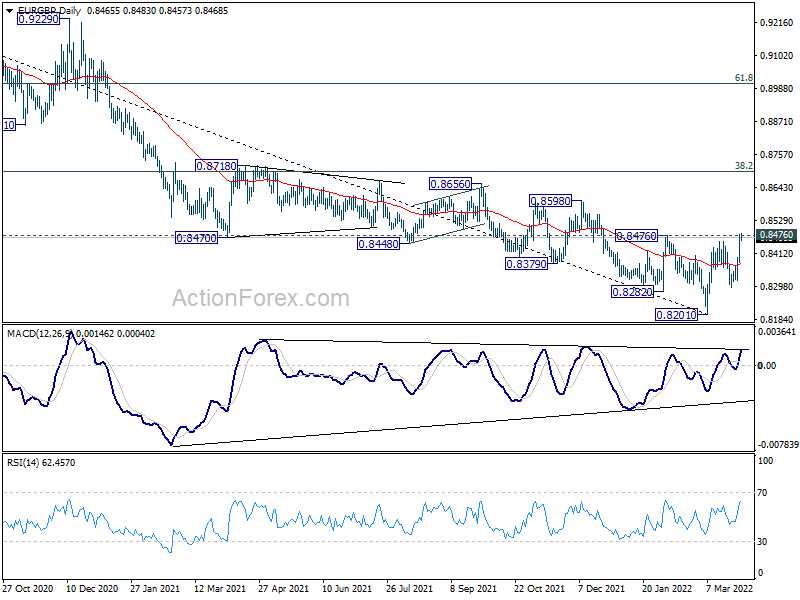
Intraday bias in EUR/GBP remains on the upside with focus on 0.8476 structural resistance. Decisive break there should confirm medium term bottoming at 0.8201, with a head and shoulder bottom pattern too (ls: 0.8282, h: 0.8201, rs: 0.8294). In this case, near term outlook will turn bullish for 0.8697 fibonacci level next. On the downside, however, below 0.8398 minor support will mix up the outlook and turn intraday bias neutral first.
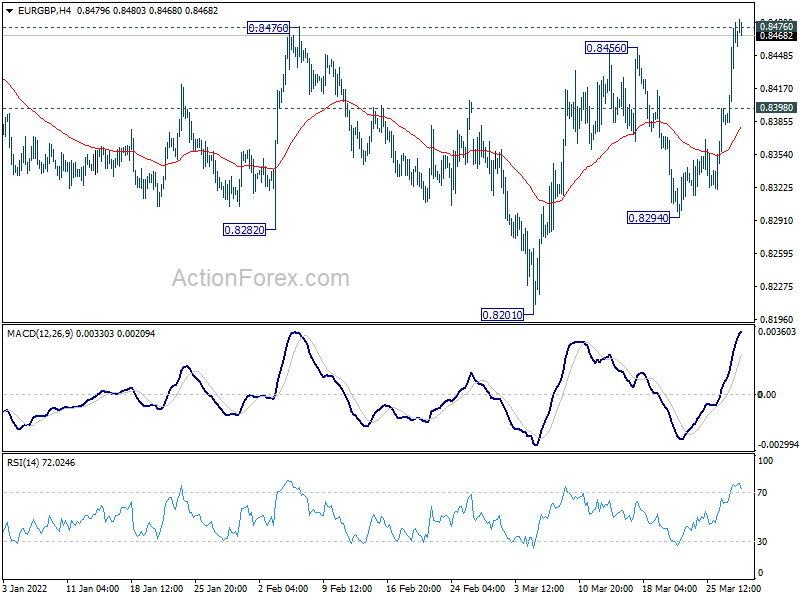
In the bigger picture, the down trend from 0.9499 is expected to continue as long as 0.8476 resistance holds. Sustained trading below 0.8276 support will argue that the whole up trend from 0.6935 (2015 low) has reversed. Deeper fall should be seen to 61.8% retracement of 0.6935 to 0.9499 at 0.7917 next. However, firm break of 0.8476 will indicate medium term bottoming at least, on bullish convergence condition in daily and weekly MACD. Stronger rally would be seen back to 38.2% retracement of 0.9499 to 0.8201 at 0.8697.
Yen Recovering, Euro Firm, Dollar and Sterling Struggle
It feels like the markets are turning a corner. Euro staged a strong rebound overnight on hope of cease-fire in Ukraine. Focus has then turned to Yen today, which is staging a notable recovery in Asia. On the other hand, both Dollar and Sterling are under some selling pressure. Commodity currencies are mixed for now. In other markets, US 10-year yield took a dive and the mostly watched 2-10yr yield curve is about to invert. US stocks shrugged the recession warning and closed higher. Gold is recovering after yesterday's fall but oil remains heavy.
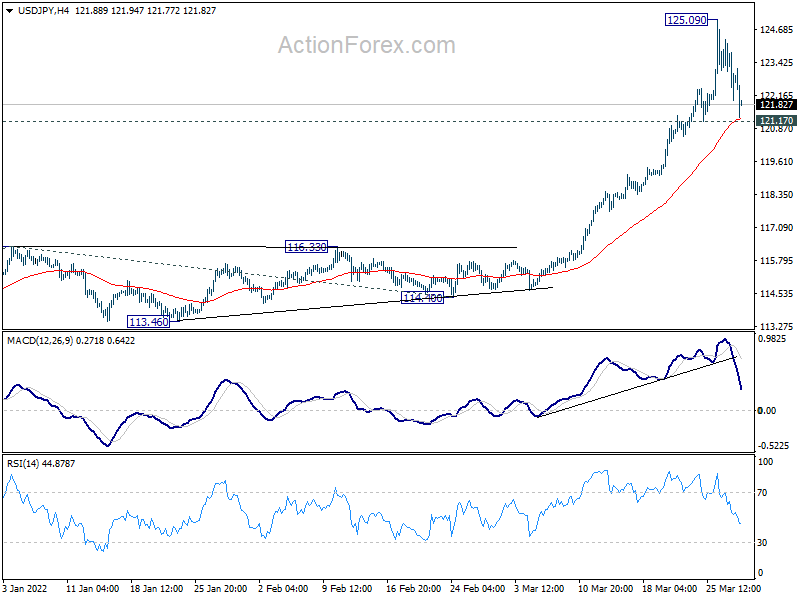
Technically, firstly, Euro will still have to do more to confirm that it's in a bullish reversal. Levels to watch include 1.1120 resistance in EUR/USD, 0.8476 resistance in EUR/GBP and 1.0400 resistance in EUR/CHF. These levels are not decisively taken out yet. Secondly, focus will also be on 121.17 minor support in USD/JPY. Break there will confirm short term topping, to be followed by deeper near term correction.
In Asia, at the time of writing, Nikkei is down -1.64%. Hong Kong HSI is up 1.14%. China Shanghai SSE is up 1.42%. Singapore Strait Times is up 0.04%. Japan 10-year JGB yield is down -0.0283 at 0.224, and it seems like BoJ's intervention is working. Overnight, DOW rose 0.97%. S&P 500 rose 1.23%. NASDAQ rose 1.84%. 10-year yield dropped -0.077 to 2.400.
S&P 500 broke key resistance, heading back to record high
S&P 500 rose 1.23% to close at 4631.60 overnight. The solid break of 4595.31 resistance should confirm that correction from 4818.62 has completed with three waves down to 4114.65. Further rise is now expected as long as 4455.61 support holds, for retesting 4818.62 record high.
At the same time, NASDAQ has taken out corresponding resistance level at 14509.55. It's time for DOW to break through 35824.28 resistance to align with the overall developments.
BoJ increases size of JGB purchases to defend yield cap
BoJ announced to increase the size of its JGB purchases to defend it's 10-year yield cap imposed under the yield curve control.
It increased the size of purchase of JGB with maturities of 3 to 10 years today, by a combined JPY 450B to JPY 1325B. It will additionally buy JPY 150B of JGB with maturities between 10 to 25 years, and JPY 100B with maturity more than 25 years.
"The BOJ will increase the number of auction dates and the amount of outright JGB purchases as needed, taking account of market conditions," the BOJ said in a statement.
Released from Japan, retail sales dropped -0.8% yoy in February, worse than expectation of -0.3% yoy.
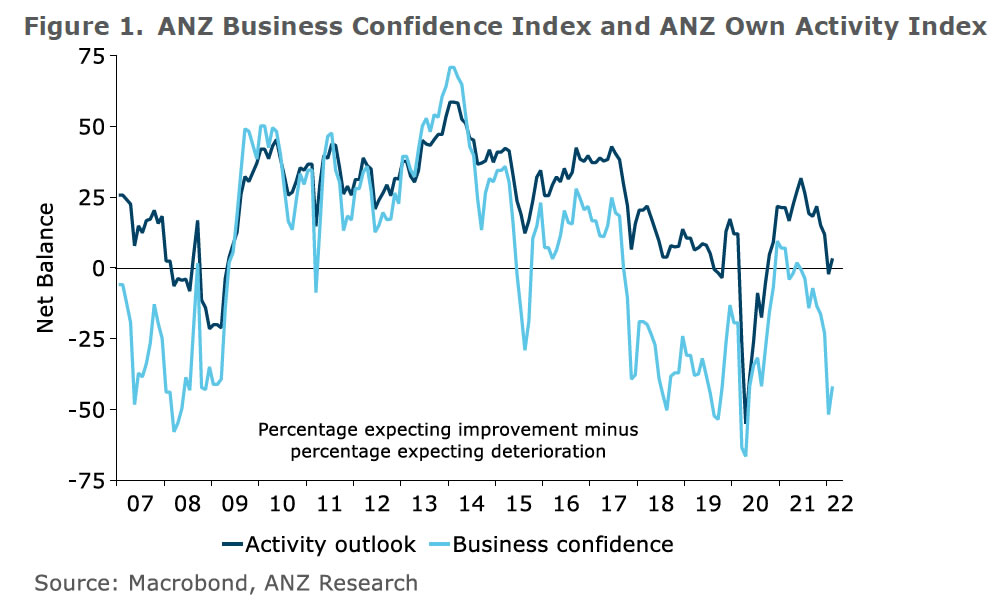
New Zealand ANZ business confidence rose to -41.9, inflation expectations rose again
New Zealand ANZ business confidence rose from -51.8 to -41.9 in March. Own activity outlook rose from -2.2 to 3.3. Looking at some details, export intentions rose from 0.9 to 7.9. Investment intentions rose from 4.5 to 5.2. Employment intentions rose from 2.3 to 12.3. Pricing intentions rose from 74.1 to 80.5. Cost expectations rose from 92.0 to 95.9. Inflation expectations rose back from 5.29 to 5.51.
ANZ said: "With inflation pressures now so extreme, and the RBNZ's inflation-targeting credibility on the line, it's full steam ahead for rate hikes – we're forecasting 50bp hikes in both April and May.
"It could well be a rough ride, but maintaining medium-term price stability is the best contribution monetary policy can make to New Zealand's big-picture economic prospects from this very difficult starting point."
Also from New Zealand, building permits rose 10.5% mom in February.
Looking ahead
Swiss KOF economic barometer and Credit Suisse economic expectations will be release in European session. Eurozone will release economic sentiment indicator. Germany will release March CPI flash.
Later in the day, main focus is on US ADP employment while Q4 GDP final will be published.
EUR/GBP Daily Outlook
Daily Pivots: (S1) 0.8409; (P) 0.8445; (R1) 0.8505; More...
Intraday bias in EUR/GBP remains on the upside with focus on 0.8476 structural resistance. Decisive break there should confirm medium term bottoming at 0.8201, with a head and shoulder bottom pattern too (ls: 0.8282, h: 0.8201, rs: 0.8294). In this case, near term outlook will turn bullish for 0.8697 fibonacci level next. On the downside, however, below 0.8398 minor support will mix up the outlook and turn intraday bias neutral first.
In the bigger picture, the down trend from 0.9499 is expected to continue as long as 0.8476 resistance holds. Sustained trading below 0.8276 support will argue that the whole up trend from 0.6935 (2015 low) has reversed. Deeper fall should be seen to 61.8% retracement of 0.6935 to 0.9499 at 0.7917 next. However, firm break of 0.8476 will indicate medium term bottoming at least, on bullish convergence condition in daily and weekly MACD. Stronger rally would be seen back to 38.2% retracement of 0.9499 to 0.8201 at 0.8697.
Economic Indicators Update
| GMT | Ccy | Events | Actual | Forecast | Previous | Revised |
|---|---|---|---|---|---|---|
| 21:45 | NZD | Building Permits M/M Feb | 10.50% | -9.20% | -8.70% | |
| 23:01 | GBP | BRC Shop Price Index Y/Y Feb | 2.10% | 1.80% | ||
| 23:50 | JPY | Retail Trade Y/Y Feb | -0.80% | -0.30% | 1.10% | |
| 00:00 | NZD | ANZ Business Confidence Mar | -41.9 | -51.8 | ||
| 07:00 | CHF | KOF Leading Indicator Mar | 101 | 105 | ||
| 08:00 | CHF | Credit Suisse Economic Expectations Mar | 9 | |||
| 09:00 | EUR | Eurozone Economic Sentiment Indicator Mar | 110 | 114 | ||
| 09:00 | EUR | Eurozone Industrial Confidence Mar | 8.9 | 14 | ||
| 09:00 | EUR | Eurozone Services Sentiment Mar | 10 | 13 | ||
| 09:00 | EUR | Eurozone Consumer Confidence Mar F | -18.7 | -18.7 | ||
| 12:00 | EUR | Germany CPI M/M Mar P | 1.60% | 0.90% | ||
| 12:00 | EUR | Germany CPI Y/Y Mar P | 6.10% | 5.10% | ||
| 12:15 | USD | ADP Employment Change Mar | 450K | 475K | ||
| 12:30 | USD | GDP Annualized Q4 F | 7.10% | 7.00% | ||
| 12:30 | USD | GDP Price Index Q4 F | 7.10% | 7.10% | ||
| 14:30 | USD | Crude Oil Inventories | -2.0M | -2.5M |
Technical Outlook and Review
DXY:
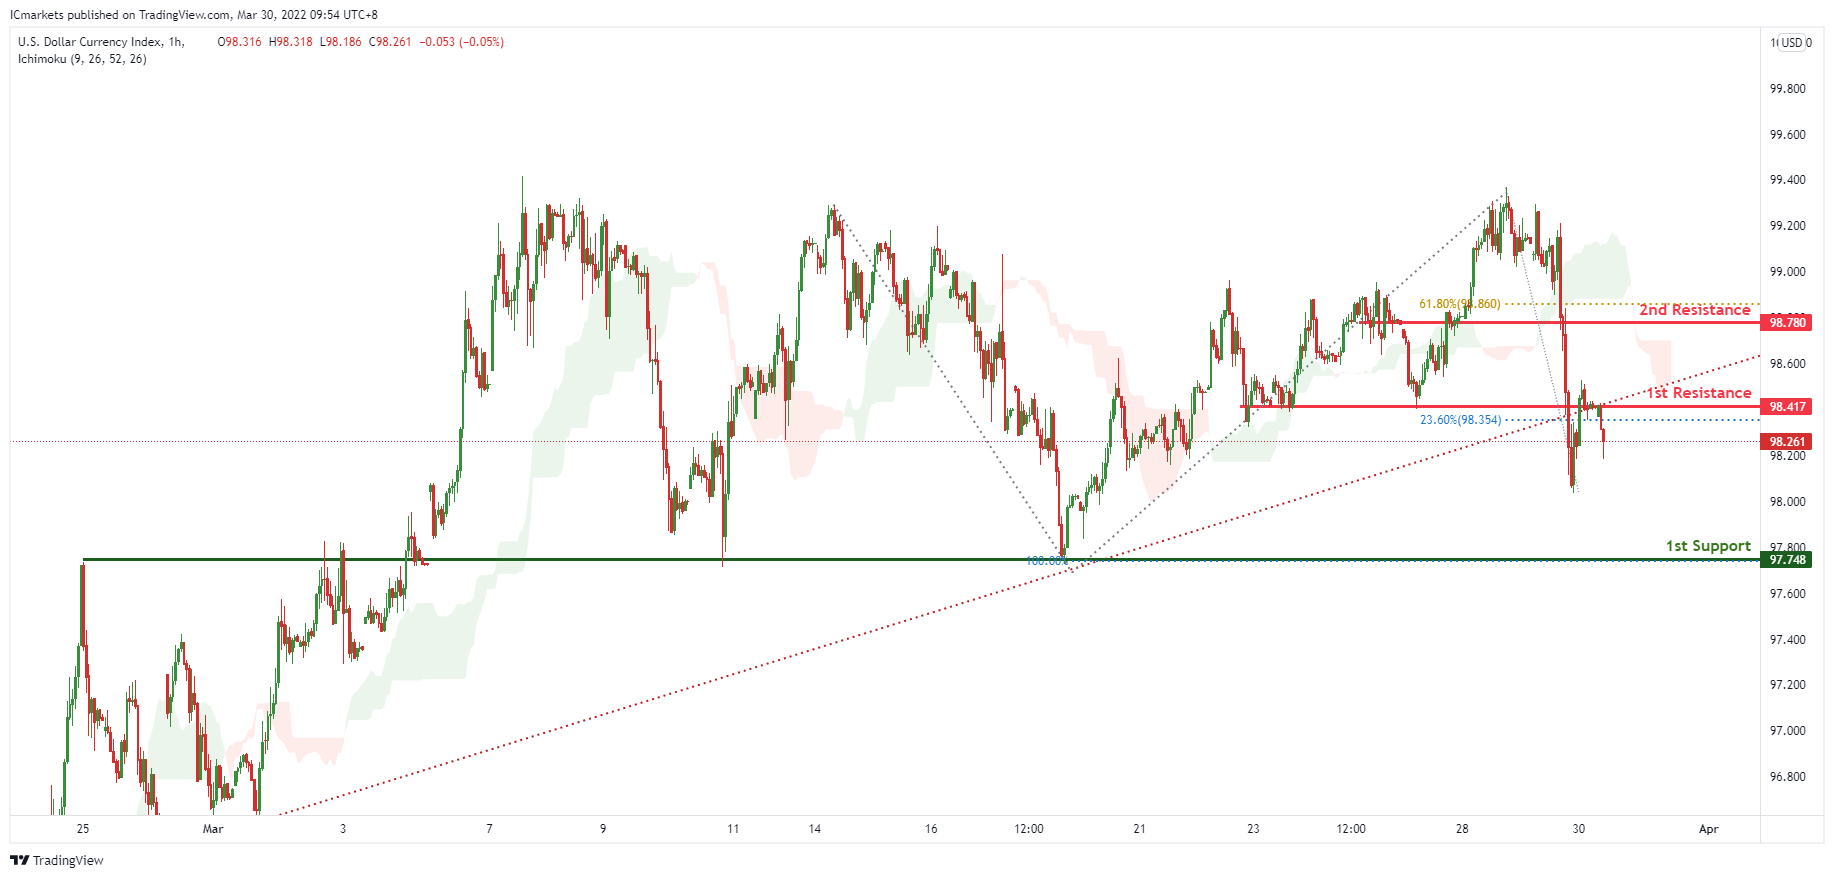
On the H1 timeframe, prices have broken out of our ascending trendline and done a retest. We see the potential for a dip from our 1st resistance at 98.417 in line with 23.8% Fibonacci retracement towards our 1st support at 97.748 in line with 100% Fibonacci projection. Prices are trading below our ichimoku cloud resistance, further supporting our bearish bias.
Areas of consideration:
- H4 time frame, 1st resistance at 98.417
- H4 time frame, 1st support at 97.748
XAU/USD (GOLD):
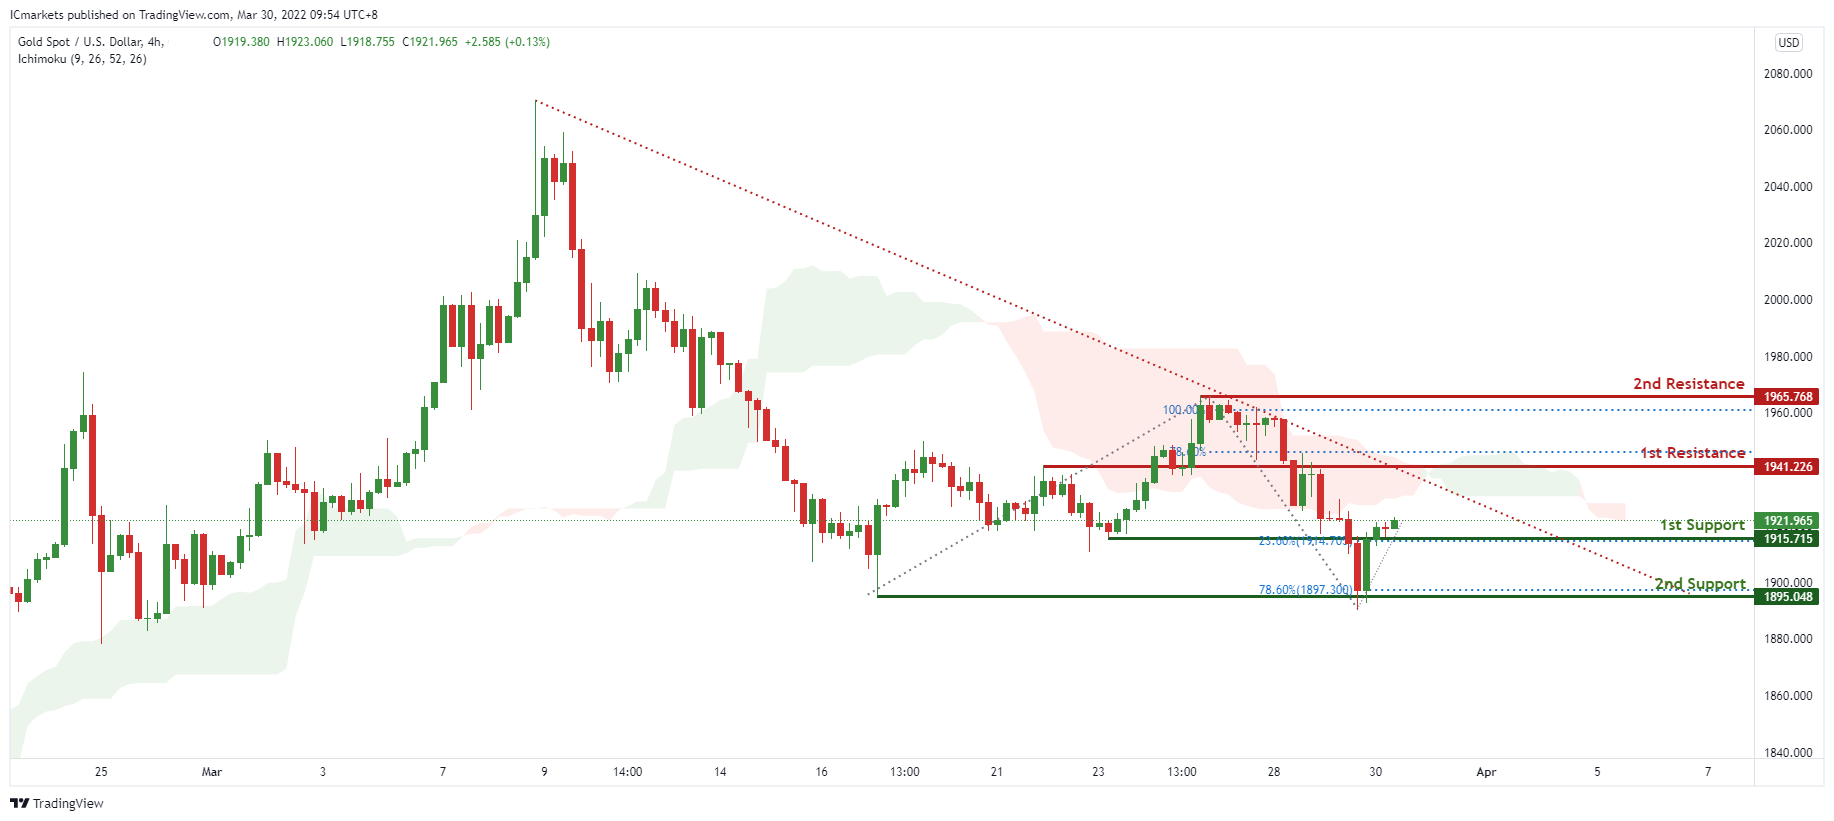
On the H4, prices are on bearish momentum and abiding by our descending trendline resistance. We see the potential for further bearish continuation from our 1st resistance at 1941.226 which is in line with 78.6% Fibonacci projection towards our 1st support at 1915.715 in line with 23.6% Fibonacci retracement and also graphical swing low.. Prices are trading below our ichimoku clouds, further supporting our bearish bias.
Areas of consideration:
- 4h 1st support at 1915.715
- 4h 1st resistance at 1941.226
GBP/USD:
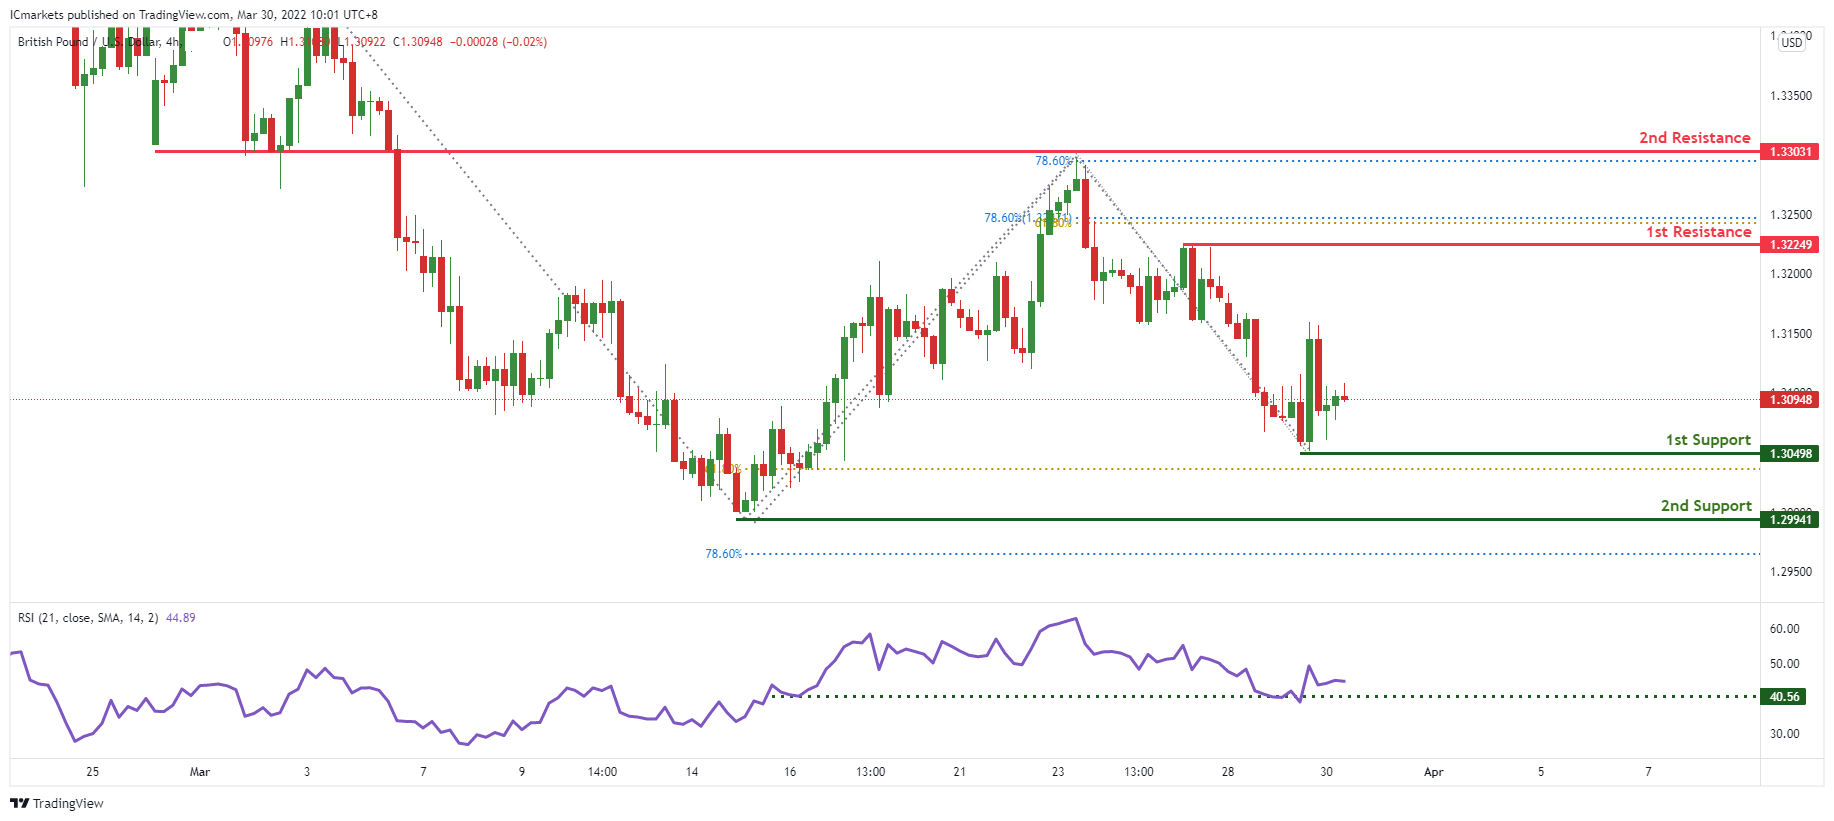
On the H4, prices are on bullish momentum. We see the potential for a bounce from our 1st support at 1.30498 which is a graphical swing low and in line with 61.8 Fibonacci retracement towards our 1st resistance at 1.32249 which is an area of Fibonacci confluences. RSI is at levels where bounces previously occured, further supporting our bullish bias. Alternatively, breaking the 1st support at 1.30498 in line with 61.8% Fibonacci retracement will call for further bearish continuation towards our 2nd support at 1.29941 in line with 78.6% Fibonacci retracement.
Areas of consideration:
- H4 1st resistance at 1.32232
- H4 1st support at 1.30890
USD/CHF:
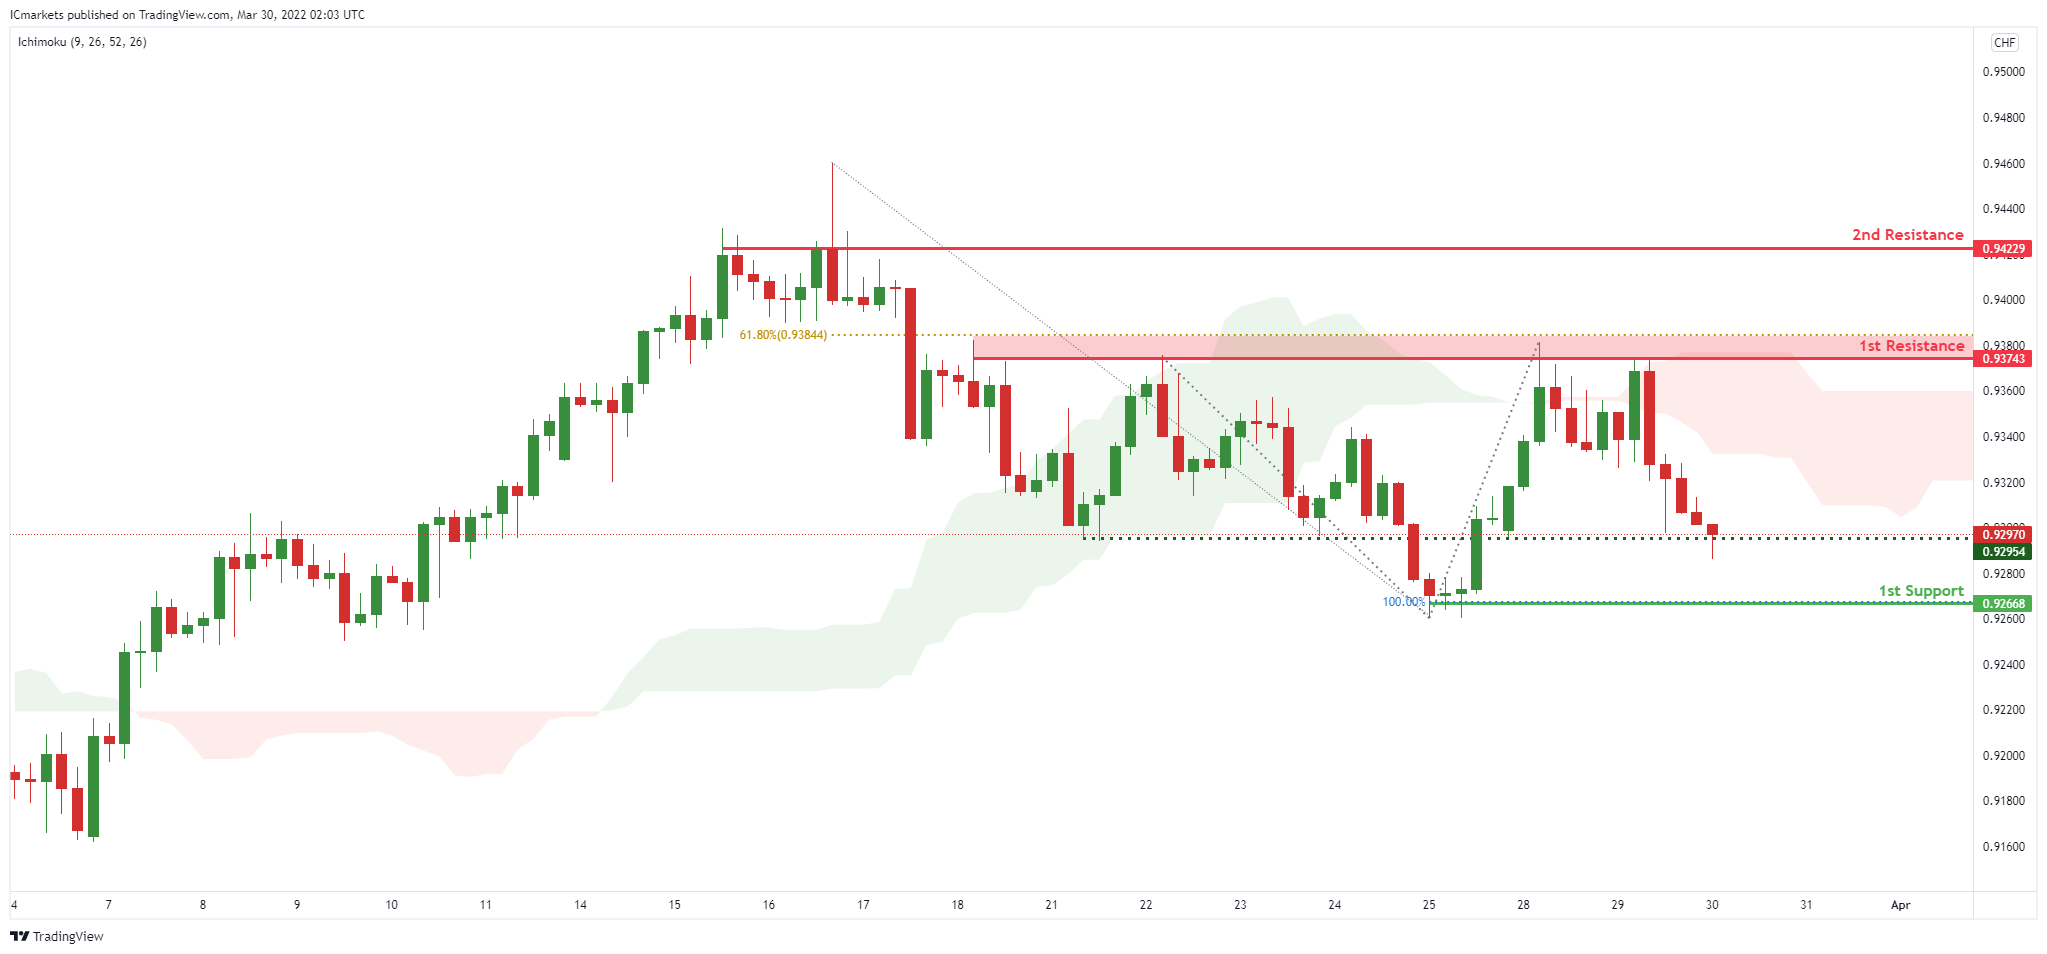
On the H4, with price moving below our ichimoku cloud, we have a bias that price will drop from 1st resistance at 0.93743 in line with the horizontal swing high resistance and 61.8% Fibonacci retracement to 1st support at 0.92668 in line with the horizontal swing low support and 100% Fibonacci projection. Alternatively, price may break 1st resistance and head for 2nd resistance at 0.94229 in line with the horizontal swing high resistance. Do take note of intermediary support at 0.92954.
Areas of consideration
- 1st support level at 0.92668
- 1st resistance level at 0.93743
EUR/USD :
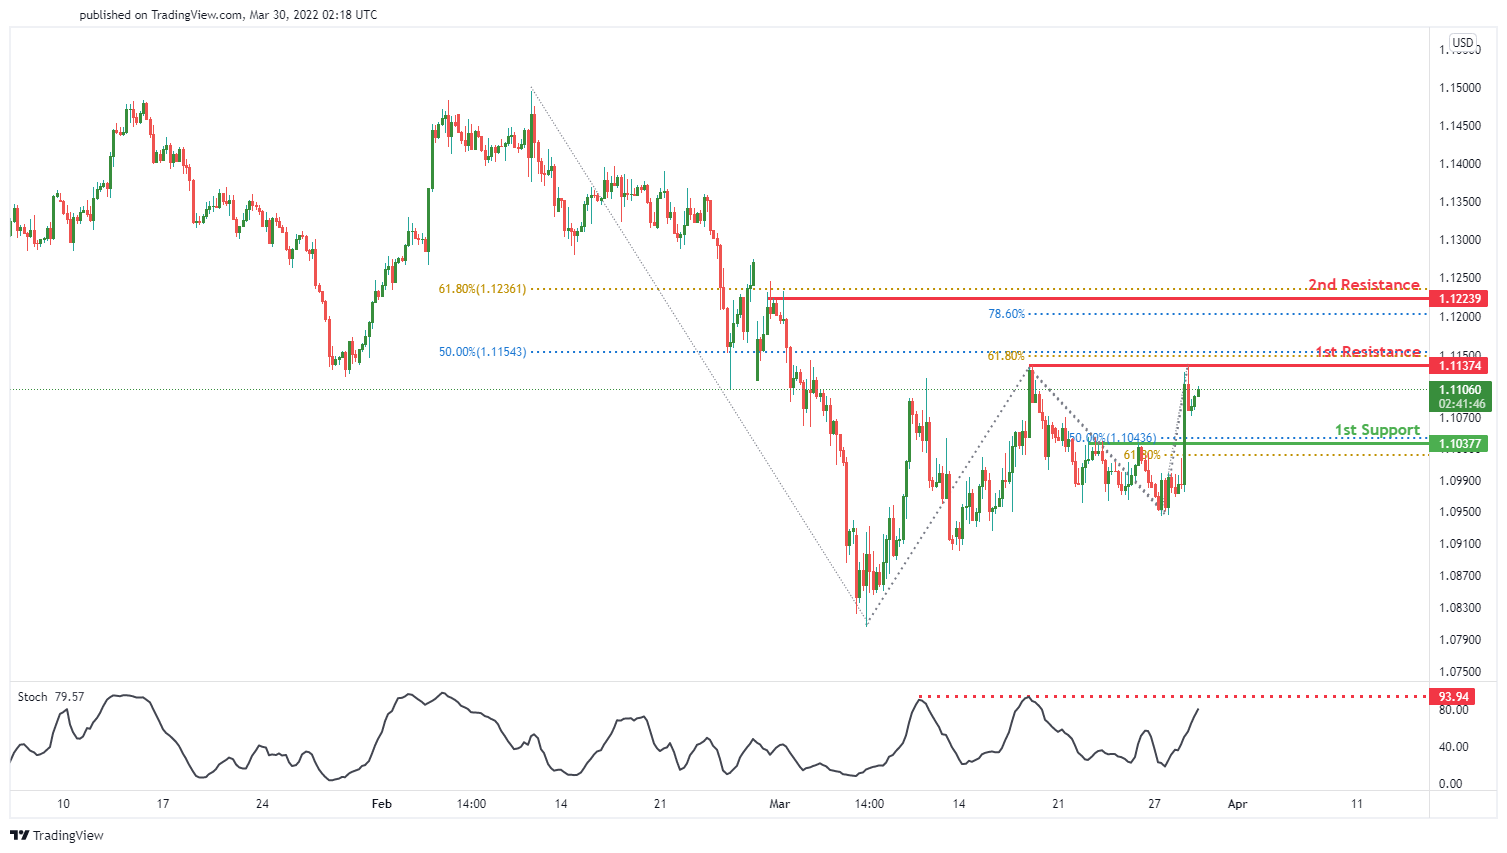
On the H4 timeframe, we see the potential for a bearish reversal from our 1st resistance at 1.11374 in line with 61.8% Fibonacci projection and 50% Fibonacci retracement towards our 1st support at 1.10377 in line with 50% Fibonacci retracement and 61.8% Fibonacci projection. Our bearish bias is supported by the stochastic indicator where price is at resistance level.
Areas of consideration :
- H4 1st resistance at 1.11374
- H4 1st support at 1.10377
USD/JPY:
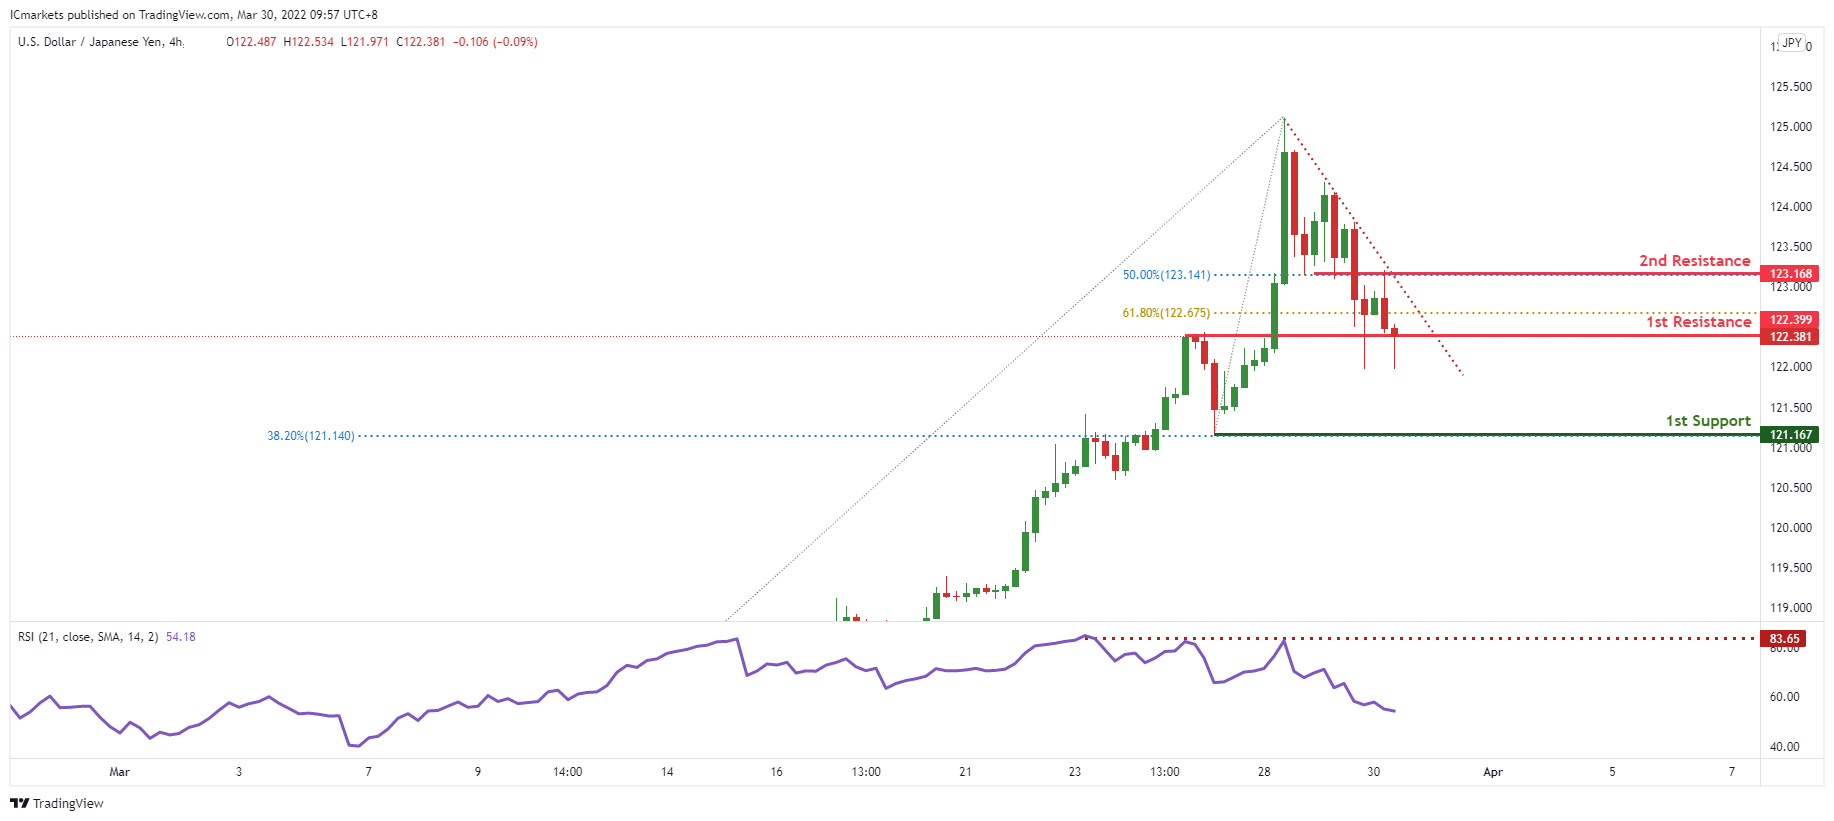
On the H4 timeframe, prices are on bearish momentum and abiding to a descending trendline. We see the potential for further bearish continuation from our 1st resistance at 122.381 in line with 61.8% Fibonacci retracement towards our 1st support at 121.167 which is in line with 38.2% Fibonacci Retracement. RSI is at levels where dips previously occurred.
Areas of consideration:
- H4 time frame, 1st resistance at 122.399
- H4 time frame, 1st support at 121.607
AUD/USD:
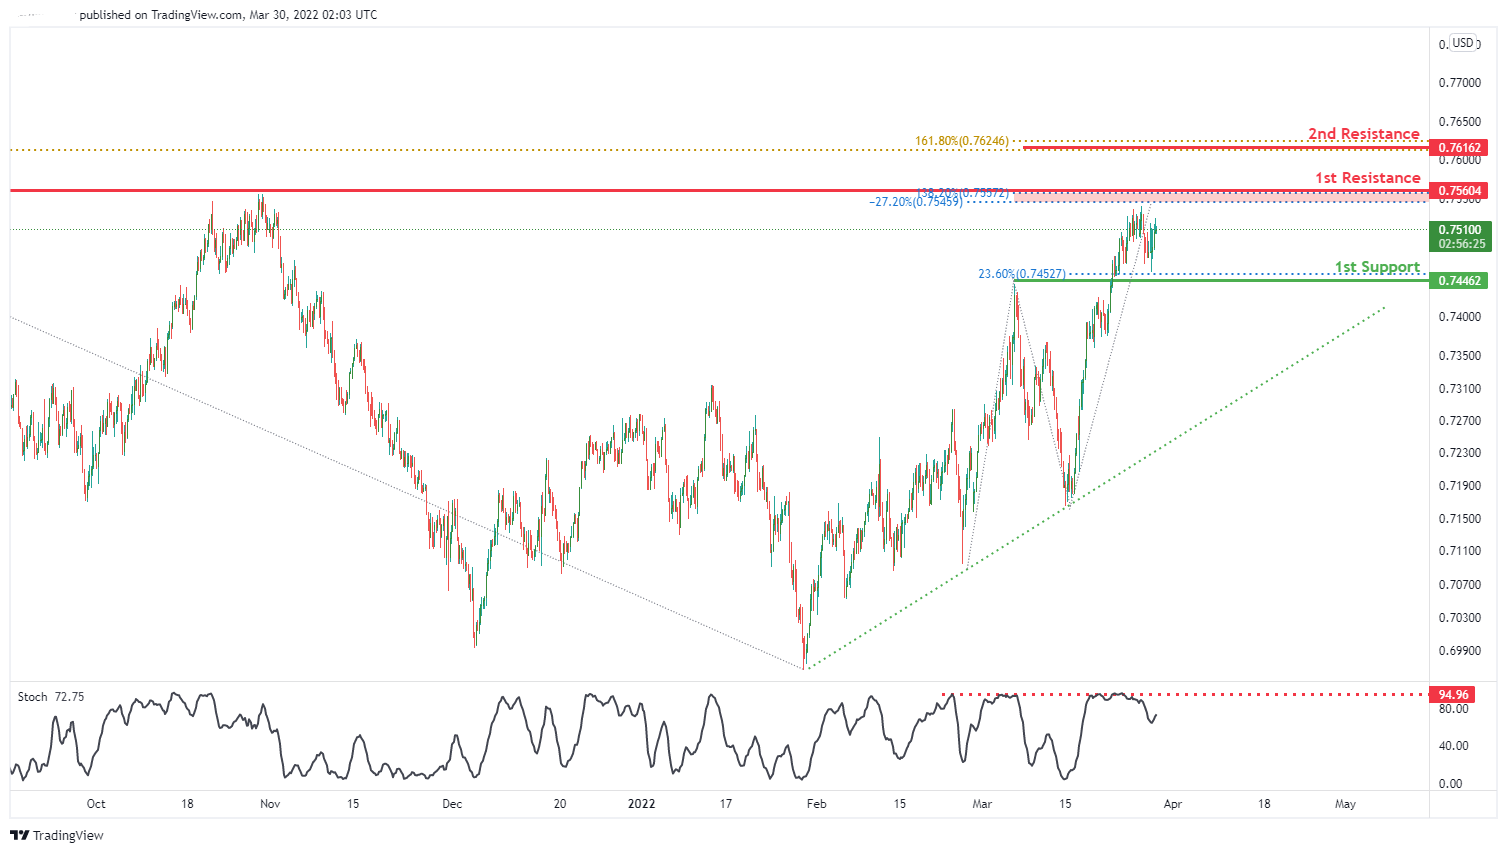
On the H4 timeframe, we see the potential for a bearish reversal from our 1st resistance at 0.75604 in line with 138.2% Fibonacci extension and -27.2% Fibonacci expansion, along with a graphical overlap resistance towards our 1st support at 0.74462 in line with 23.6% Fibonacci retracement. Our bearish bias is supported by the stochastic indicator where price is at resistance level
Areas of consideration
- H4 1st resistance at 0.75604
- H4 1st support at 0.74462
NZD/USD:
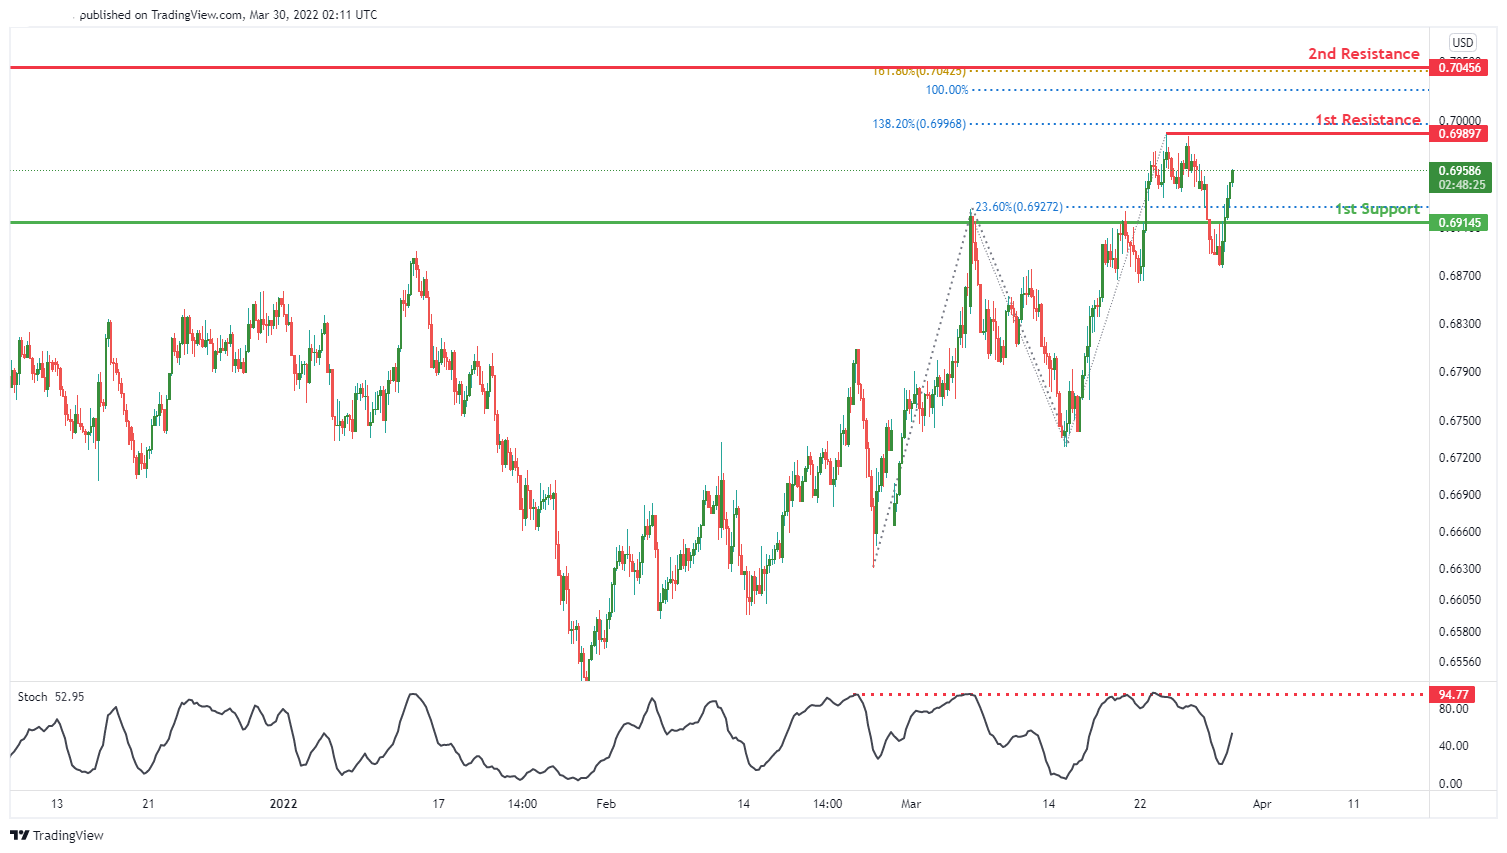
On the H4 timeframe, we see the potential for a bearish reversal from our 1st resistance at 0.69897 in line with 138.2% Fibonacci extension towards our 1st support at 0.69145 in line with 23.6% Fibonacci retracement. Our bearish bias is supported by the stochastic where it is trading at resistance level.
Areas of consideration :
- H4 1st resistance at 0.69897
- H4 1st support at 0.69145
USD/CAD:
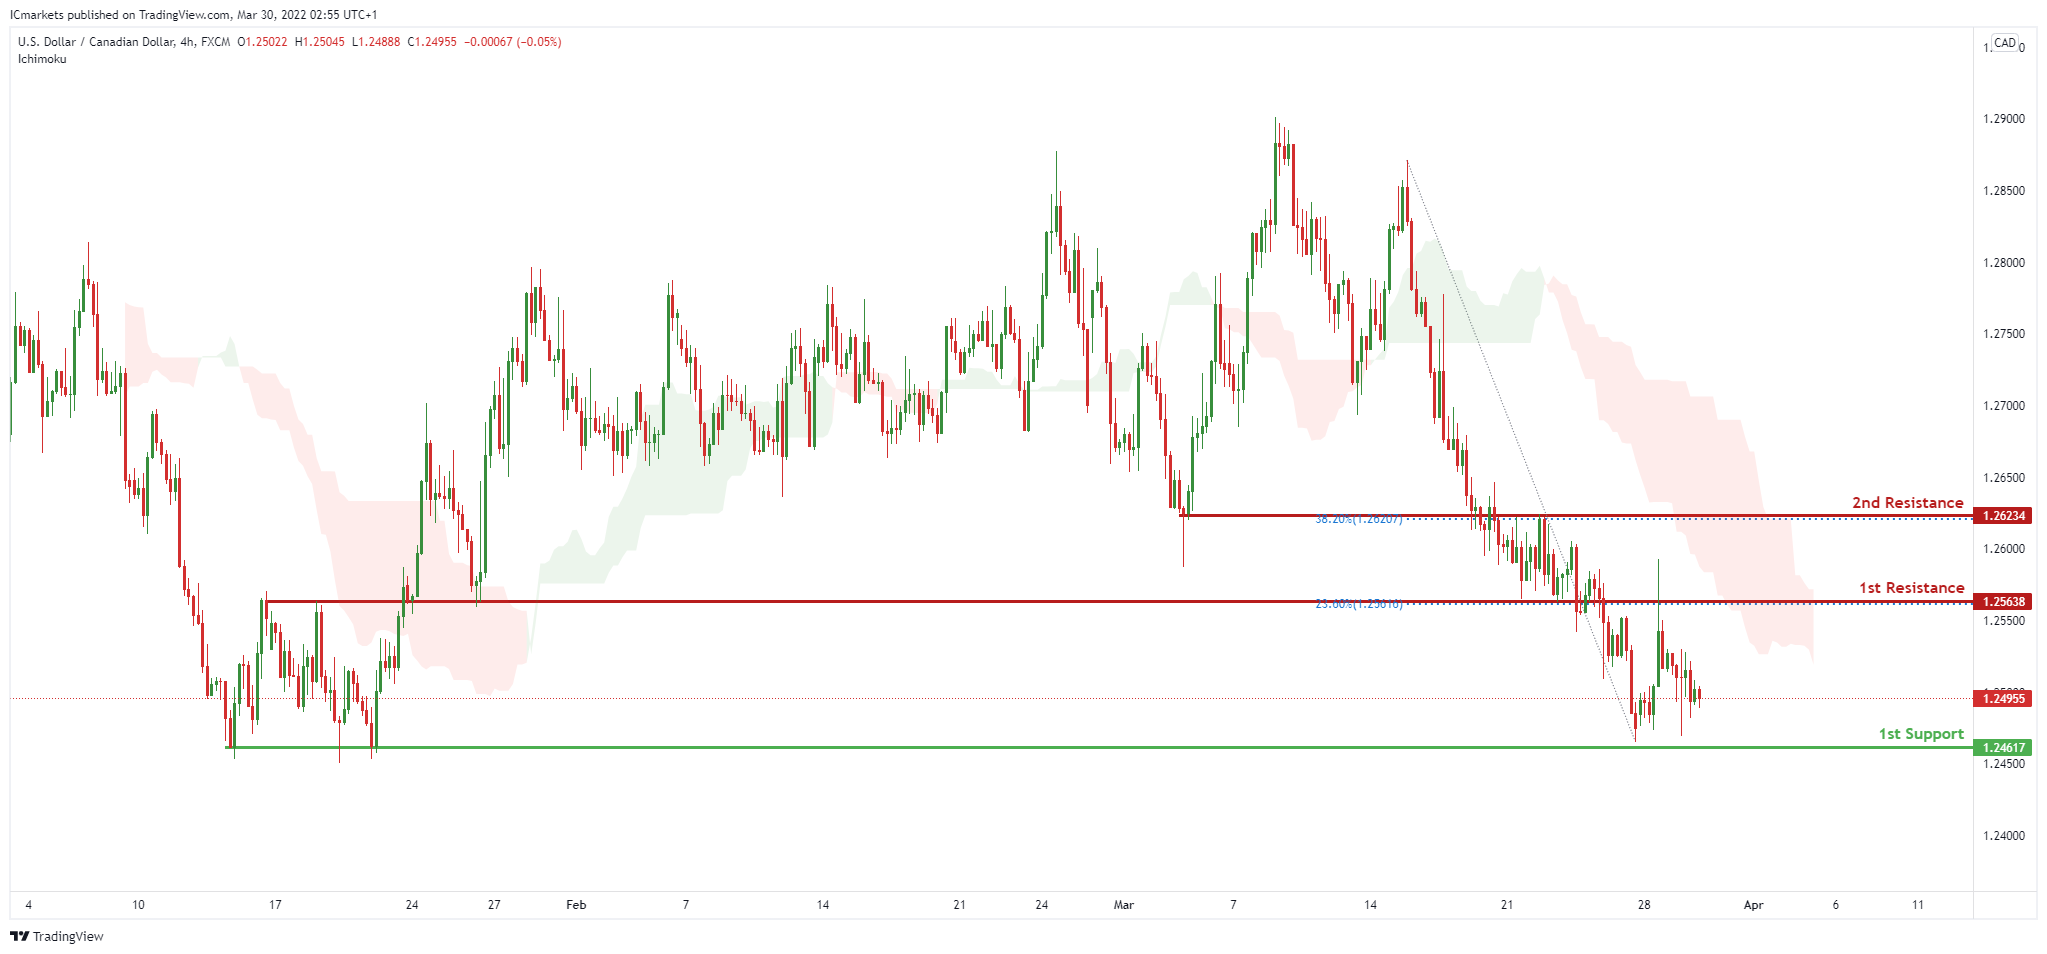
On the H4, price moving below our ichimoku cloud. At this current juncture, we have a bias that price will drop from 1st resistance at 1.25638 in line with the horizontal overlap resistance and 23.6% Fibonacci retracement to 1st support at 1.24617 in line with the swing low support . Alternatively, price may break 1st resistance and head for 2nd resistance at 1.26234 in line with the 38.2% Fibonacci retracement.
Areas of consideration:
- H4 time frame, 1st support at 1.24617
- H4 time frame, 1st resistance at 1.25638
OIL:
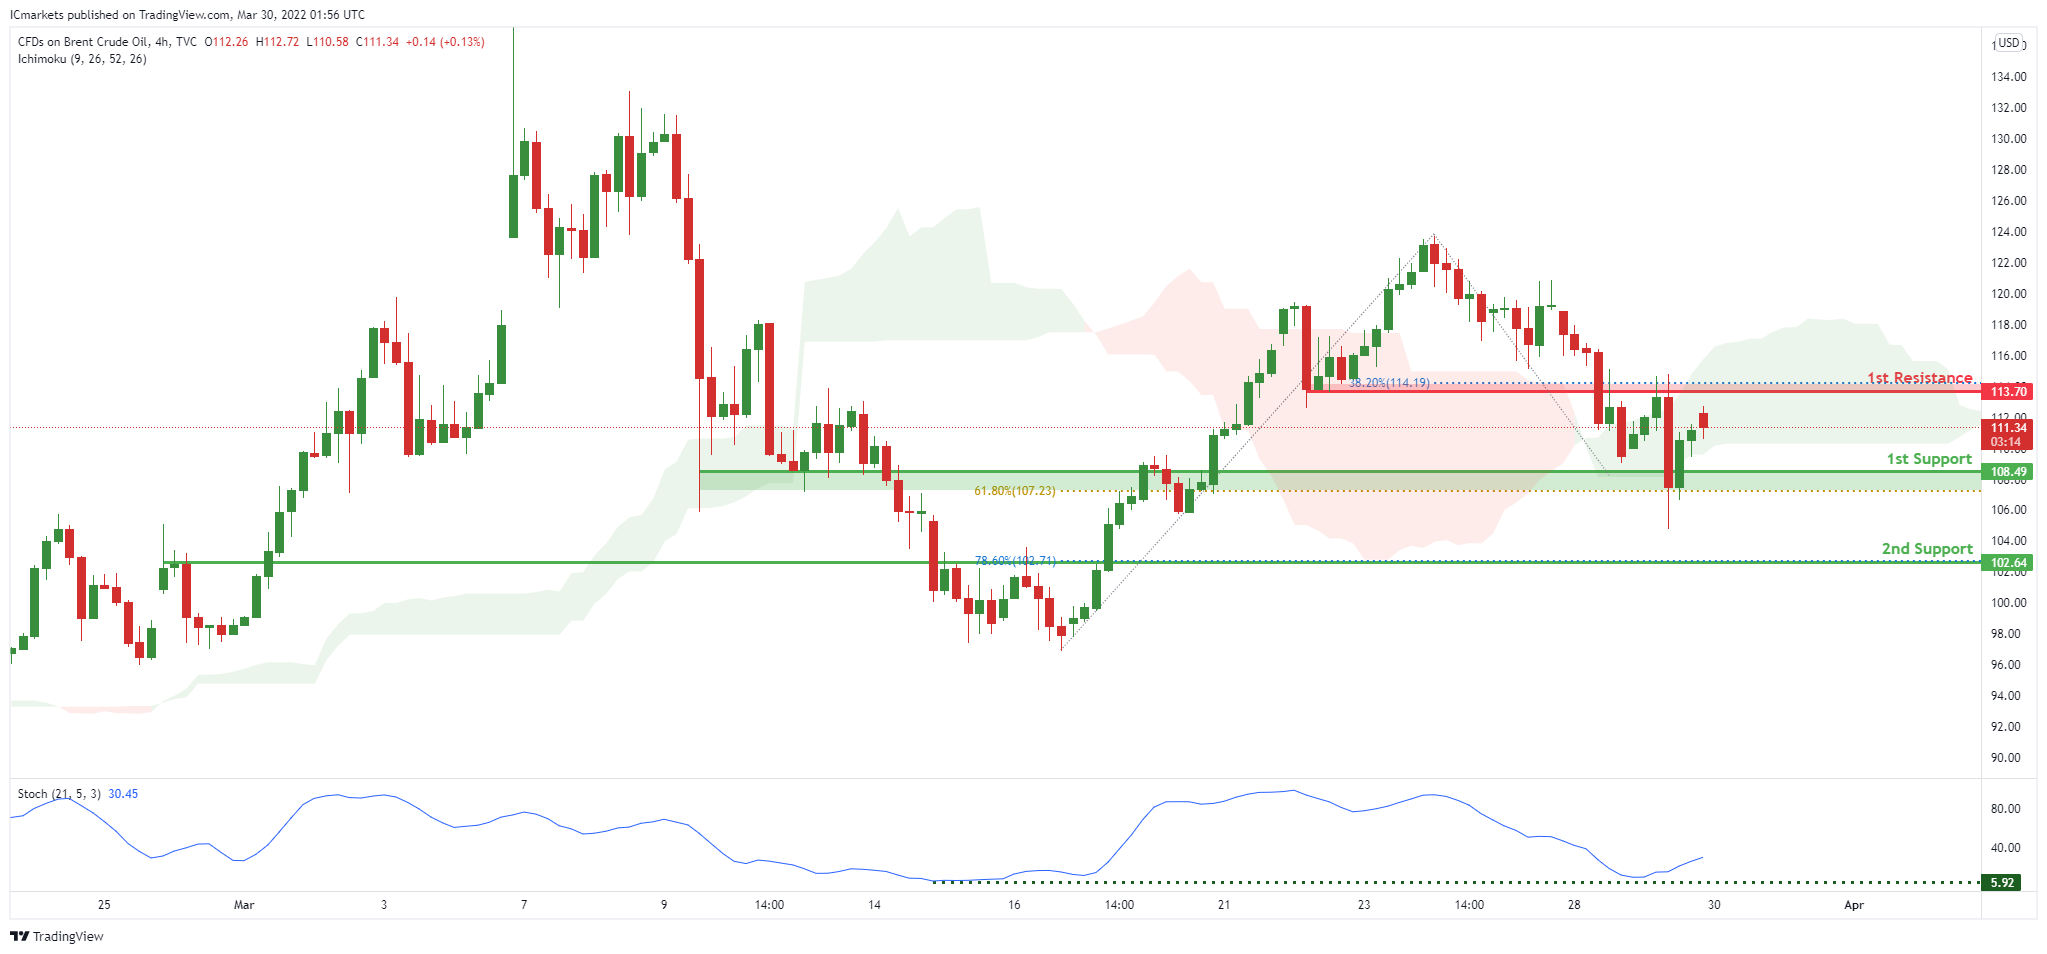
On the H4, with price expected to bounce off the support of the ichimoku cloud, we have a bias that price will rise to our 1st resistance at 113.70 in line with the 38.2% Fibonacci retracement from our 1st support at 108.49 in line with the horizontal overlap support and 61.8% Fibonacci retracement. Alternatively, price may break 1st support structure and head for 2nd support at 102.64 in line with the horizontal overlap support and 78.6% Fibonacci retracement.
Areas of consideration:
- H4 time frame, 1st resistance of 113.70
- H4 time frame, 1st support of 108.49
Dow Jones Industrial Average:
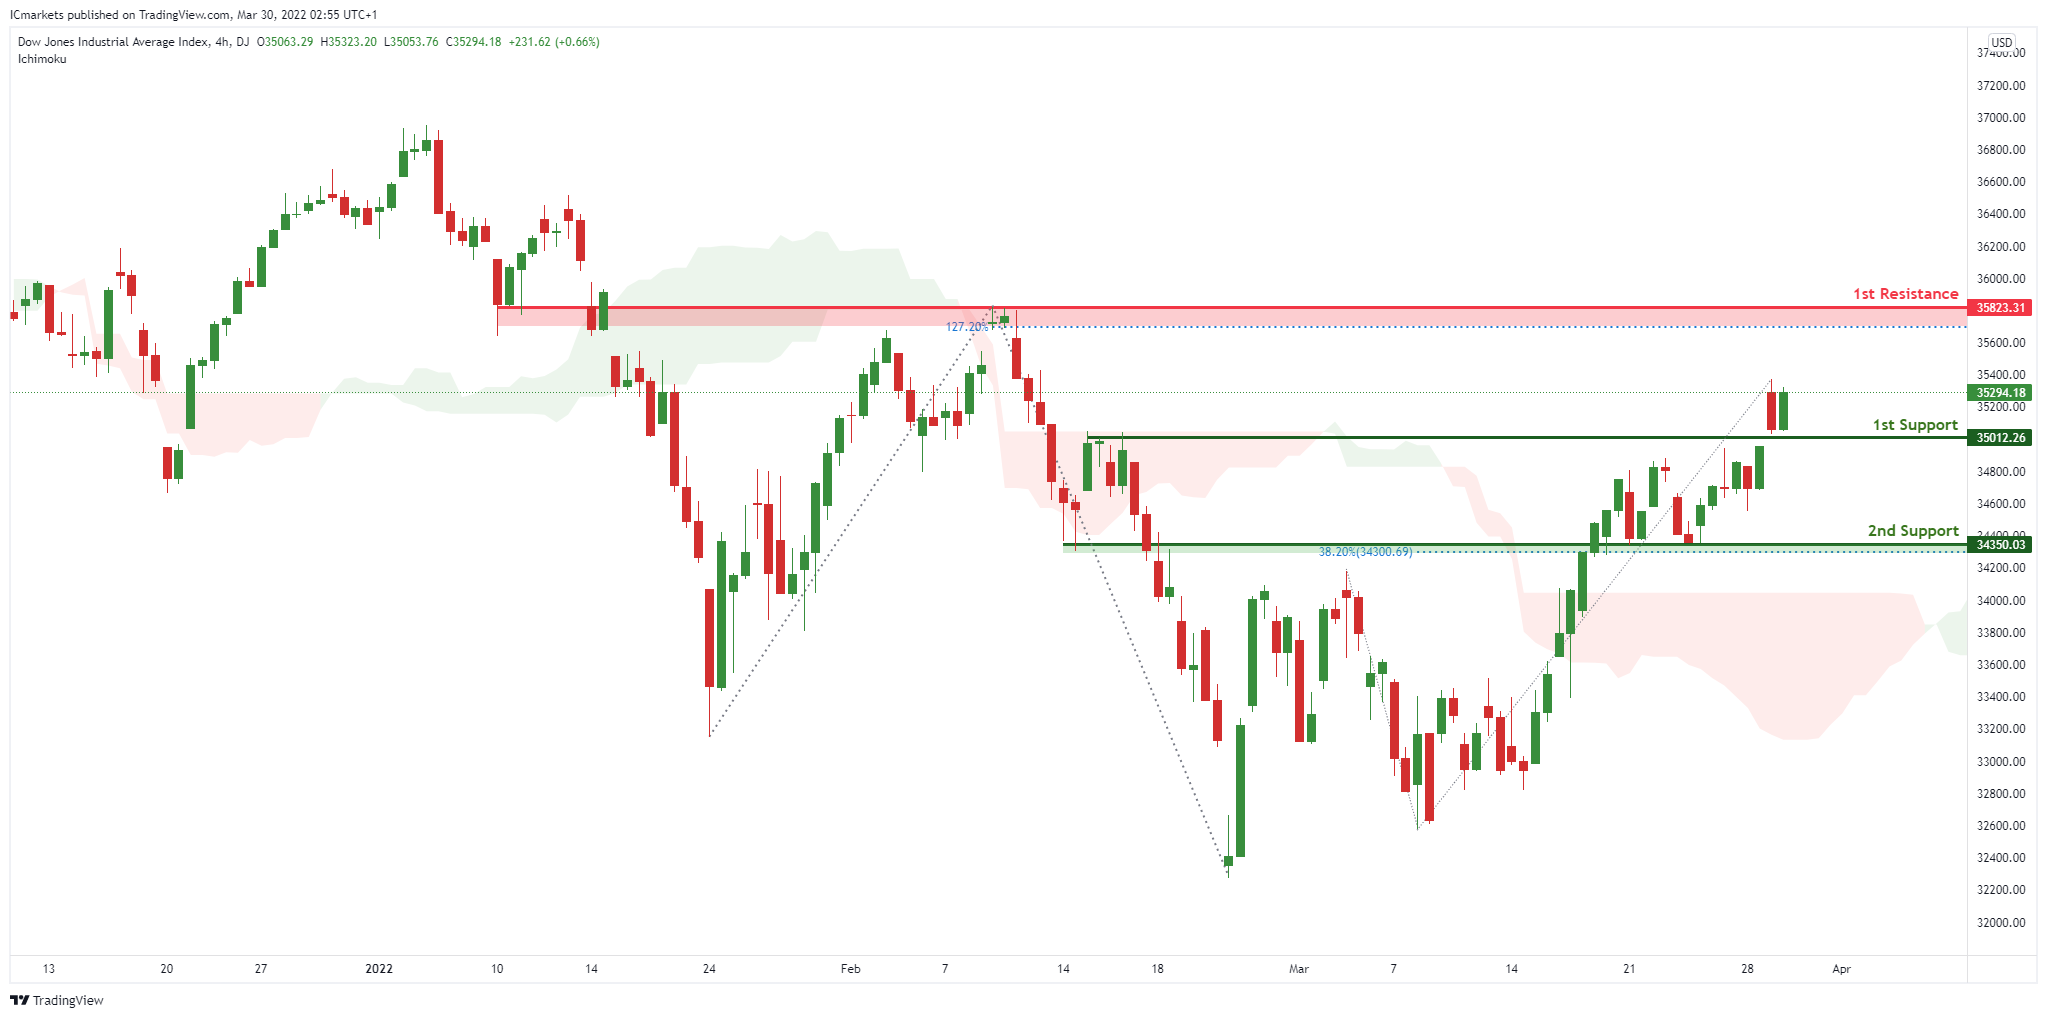
On the H4, with price moving above the ichimoku cloud, we have a bias that price will rise to our 1st resistance at 35823 in line with the 127.2% Fibonacci extension from our 1st support at 35012 in line with the horizontal pullback support. Alternatively, price may break 1st support structure and head for 2nd support at 34350 in line with the horizontal overlap support and 38.2% Fibonacci retracement.
Areas of consideration :
- H4 1st support at 35012
- H4 1st resistance at 35823
S&P 500 broke key resistance, heading back to record high
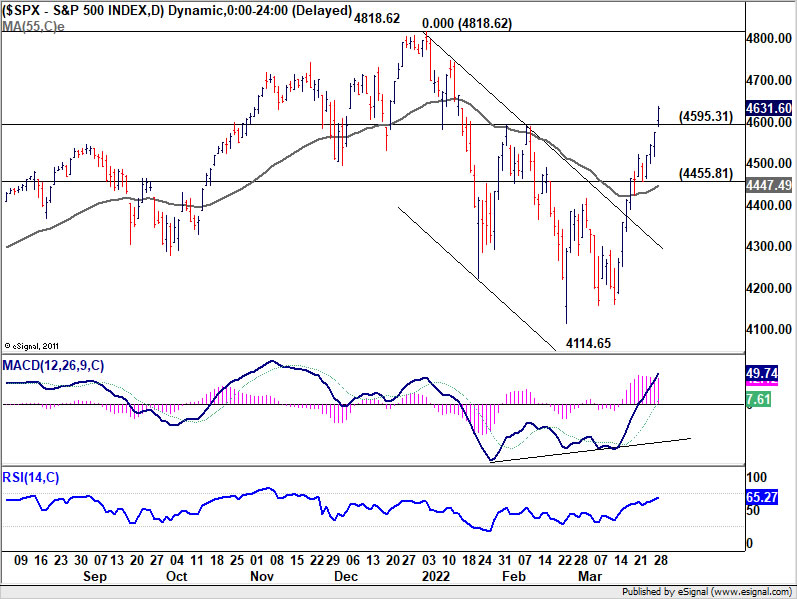
S&P 500 rose 1.23% to close at 4631.60 overnight. The solid break of 4595.31 resistance should confirm that correction from 4818.62 has completed with three waves down to 4114.65. Further rise is now expected as long as 4455.61 support holds, for retesting 4818.62 record high.
At the same time, NASDAQ has taken out corresponding resistance level at 14509.55. It's time for DOW to break through 35824.28 resistance to align with the overall developments.
New Zealand ANZ business confidence rose to -41.9, inflation expectations rose again
New Zealand ANZ business confidence rose from -51.8 to -41.9 in March. Own activity outlook rose from -2.2 to 3.3. Looking at some details, export intentions rose from 0.9 to 7.9. Investment intentions rose from 4.5 to 5.2. Employment intentions rose from 2.3 to 12.3. Pricing intentions rose from 74.1 to 80.5. Cost expectations rose from 92.0 to 95.9. Inflation expectations rose back from 5.29 to 5.51.
ANZ said: "With inflation pressures now so extreme, and the RBNZ's inflation-targeting credibility on the line, it's full steam ahead for rate hikes – we're forecasting 50bp hikes in both April and May.
"It could well be a rough ride, but maintaining medium-term price stability is the best contribution monetary policy can make to New Zealand's big-picture economic prospects from this very difficult starting point."
BoJ increases size of JGB purchases to defend yield cap
BoJ announced to increase the size of its JGB purchases to defend it's 10-year yield cap imposed under the yield curve control.
It increased the size of purchase of JGB with maturities of 3 to 10 years today, by a combined JPY 450B to JPY 1325B. It will additionally buy JPY 150B of JGB with maturities between 10 to 25 years, and JPY 100B with maturity more than 25 years.
"The BOJ will increase the number of auction dates and the amount of outright JGB purchases as needed, taking account of market conditions," the BOJ said in a statement.
Fed Update – Quickly Back to Neutral by Front-Loading Rate Hikes
Key takeaways
- Recent Fed speeches and interviews have been to the hawkish side suggesting the Fed is about to front-load rate hikes in order to ease high underlying inflation pressure by raising the target range quickly back to neutral.
- We change our Fed call accordingly, as we have argued for a long time that the Fed is behind the curve and it seems like the Fed has come to the same conclusion.
- We now expect the Fed to deliver 50bp rate hikes in May, June and July. We expect the Fed to hike by 25bp at each of the following meetings, implying a Fed funds rate of 2.50-2.75% by year-end.
- Risk is still skewed towards faster rate hikes and we cannot rule out a larger 75bp rate hike at some point or that the Fed continues hiking by 50bp for longer.
- Inflation is higher and the labour market tighter than when the Fed hiked by 50bp in 2000 and 75bp in 1994, respectively.
NFP and PCE Inflation to Support Hawkish Fed Bets as Dollar Stands Tall
Amidst the Ukraine crisis and dimming global growth outlook, the latest jobs report out of the United States will take centre stage on Friday (12:30 GMT). Before that, the Fed’s favourite inflation metric is released on Thursday. The data is expected to reinforce confidence in the US economy even as the risk of a recession grows in Europe. But is there a danger the Fed is about to tighten policy too aggressively and how much will this week’s numbers matter for the US dollar?
A very tight labour market
There can be no doubt that the US labour market is extremely tight right now and Friday’s jobs figures will probably show that hiring conditions got even tighter in March. Nonfarm payrolls are projected to have risen by 490k over the month – a lower pace than in February but a very healthy gain, nevertheless. Accordingly, the unemployment rate is forecast to have dipped by 0.1 percentage point to 3.7% in what would mark a new post-pandemic low.
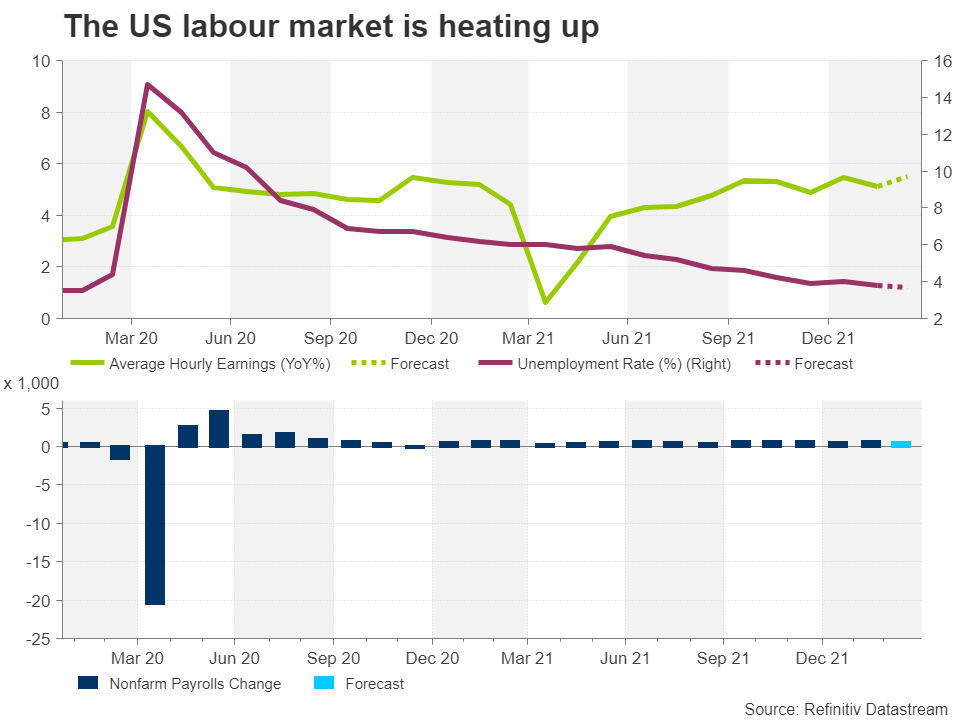
Wage growth is expected to have accelerated after slowing down in February. Average hourly earnings are anticipated to have increased by 5.5% year-on-year in March, up from 5.1% in the prior month.
Fed getting more hawkish as inflation continues to surge
A day earlier, data on personal income, consumption and PCE inflation is expected to be equally upbeat. Personal income and spending likely both rose by 0.5% month-on-month in February, while the core PCE price index is forecast to have edged higher to 5.5% y/y to yet another multi-decade high.
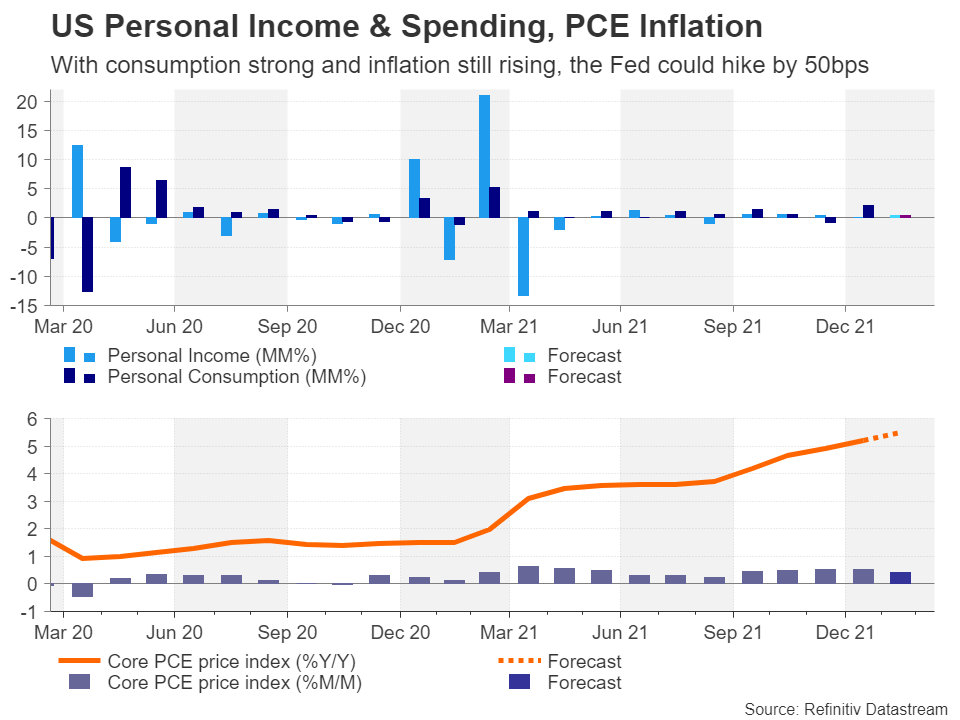
Speculation about how many times the Fed will hike interest rates this year went into overdrive last week after Chair Jerome Powell hinted that the central bank might need to move faster at the upcoming meetings following the 25-basis-points liftoff in March. All the economic indicators so far support a more aggressive tightening cycle, but the main worry is that the positive outlook might not last very long.
Are US consumers about to turn more cautious?
In Europe, the latest survey data suggest both consumer and business confidence have started to take a hit from the fallout of the war in Ukraine. Policymakers at the European Central Bank and increasingly, the Bank of England as well, are cautious about committing to a specific rate path as they anticipate that some of the inflationary pressures will begin to fade as demand stumbles due to the squeeze on consumers and businesses from soaring prices.
There’s only mild evidence of a weakening outlook among US businesses and Friday’s ISM manufacturing PMI should shed more light on this. However, some measures of consumer sentiment tell a different story. Specifically, the University of Michigan’s closely watched gauge fell to the lowest since 2011 in March, suggesting consumers are becoming more and more alarmed by the worsening spiral in the cost of living.
Risk of Fed overtightening
The problem, though, is that the Fed is already so behind the inflation curve, it’s unlikely to backtrack from its hawkish stance unless inflation shows signs of peaking – the chances of which are very slim as long as the sanctions against Russia stay in place – or the labour market recovery goes into reverse.
Traders have currently priced in a more than 200 basis points increase in the fed funds rate by December, implying at least two hikes of 50-bps increments. The bond market seems to agree. But even though both short- and long-term Treasury yields have rallied extensively since the start of the year, parts of the yield curve have either briefly converted or are close to inverting, signalling a possible recession.
However, for most investors, it is too soon to be getting overly concerned about the risk of a US downturn and the Fed is only at the very early stages of policy normalization. Hence, the dollar rally potentially has a few more legs to go.
Can the dollar extend its impressive uptrend?
The mighty greenback hit a 6½-year high of 125.10 yen on Monday before retreating to nearer 123 yen. If the upcoming data are stronger-than-expected, the dollar might stretch its gains a bit more, although they’re unlikely to dramatically change the policy outlook for the Fed.
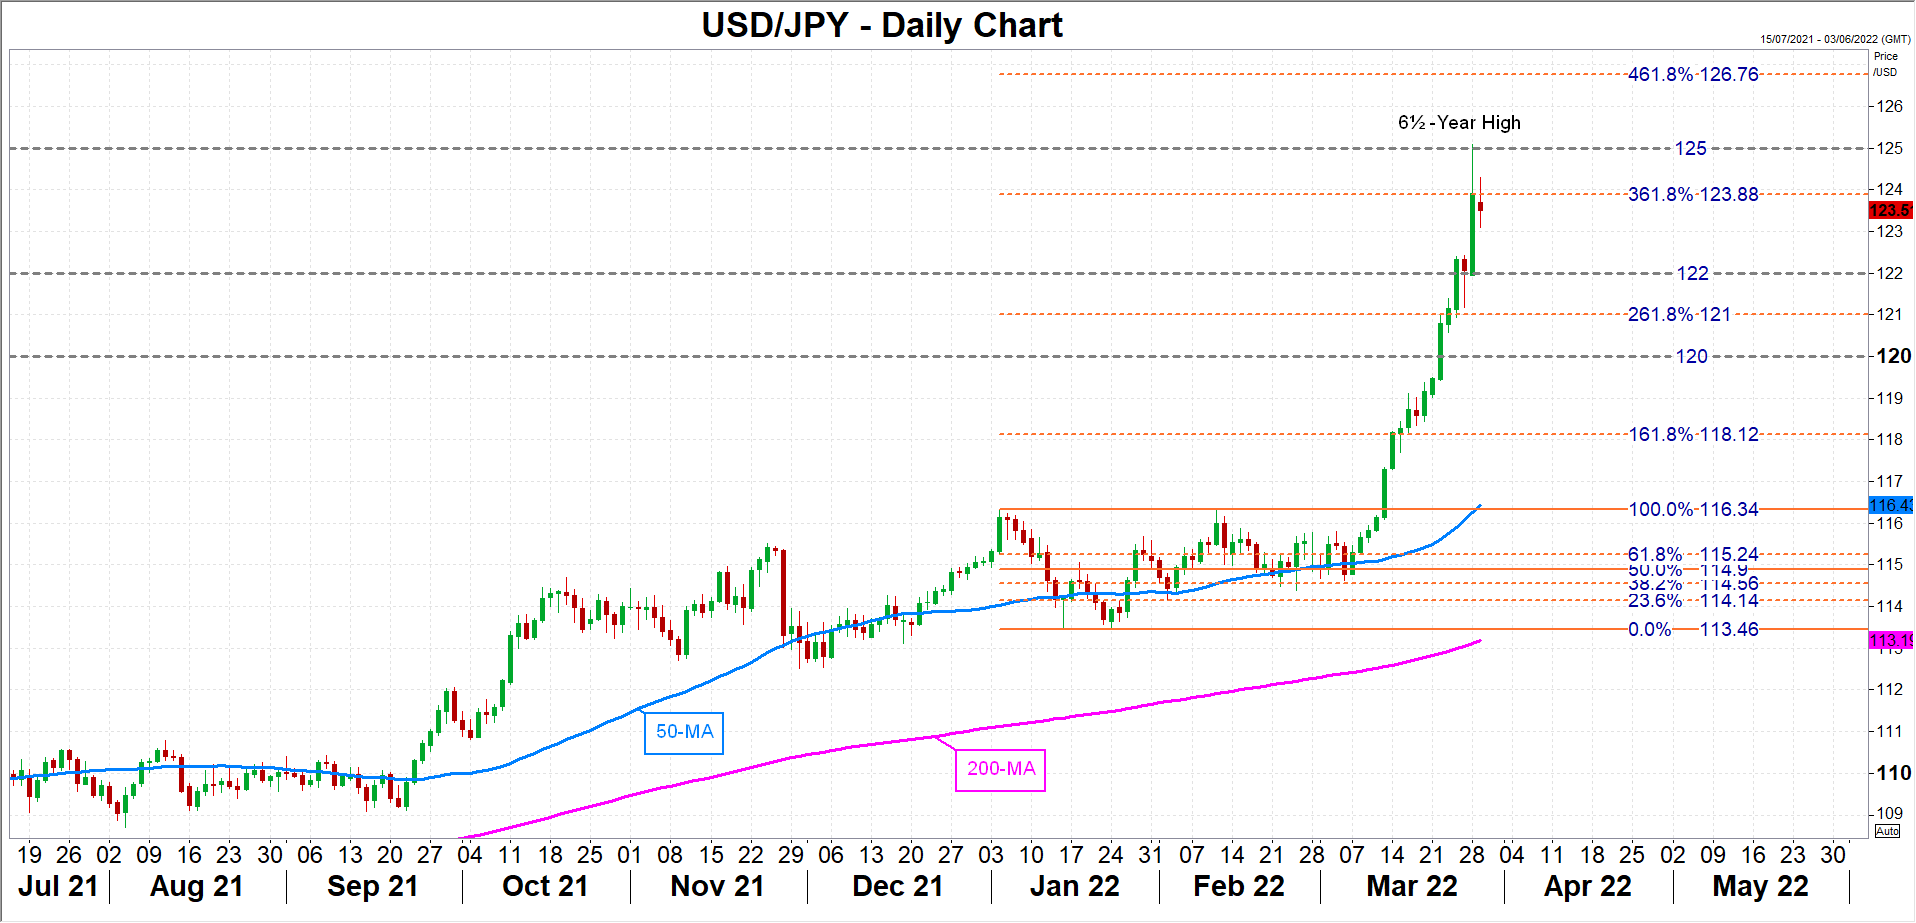
Dollar/yen could climb back towards the 125 handle and if it has better luck second time to overcome this barrier, the 461.8% Fibonacci extension of the January downleg at 126.76 could be the next target for the bulls.
Alternatively, should dollar/yen fall back, the 122 level followed by the 261.8% Fibonacci extension of 121 could stall any declines, while steeper losses would bring the 161.8% Fibonacci of 118.12 into focus.
Judging from the CPI report and the recent weekly jobless claims, big negative surprises are not looking too likely in either the NFP or PCE inflation numbers, so it’s possible there might be a bigger reaction to any shocks in the ISM manufacturing print.
Gold Price Struggle Ahead of US GDP Release
Key Highlights
- Gold price started a fresh decline from the $1,965 zone.
- A key bearish trend line is forming with resistance near $1,920 on the 4-hours chart.
- EUR/USD attempted a recovery wave from 1.0950, and GBP/USD is still above 1.3050.
- The US Gross Domestic Product could increase 7% in Q4 2021.
Gold Price Technical Analysis
Gold price attempted a fresh increase above the $1,950 level against the US Dollar. However, the price failed to clear $1,965 and started another decline.
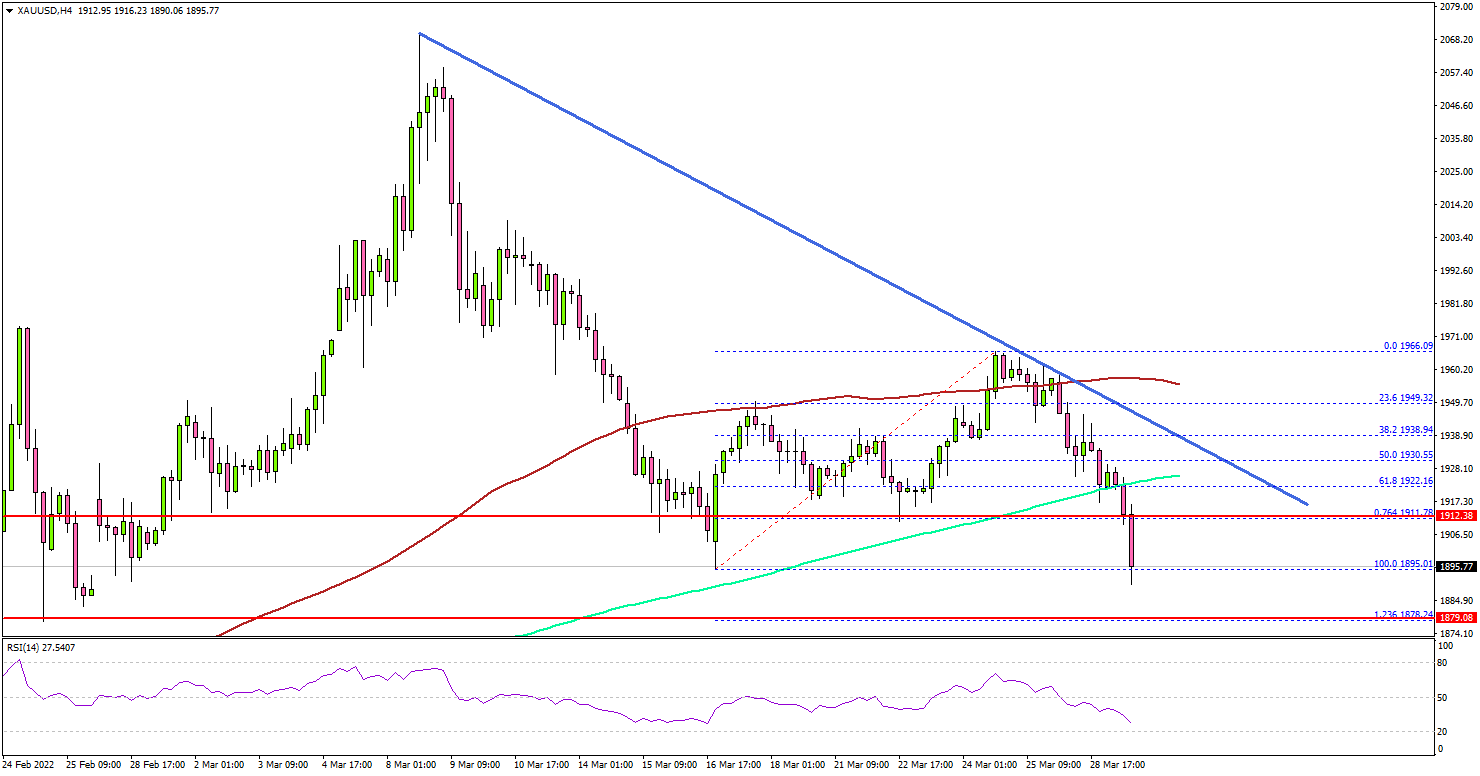
The 4-hours chart of XAU/USD indicates that the price declined steadily below the $1,950 support level. There was a close below the $1,920 level, the 100 simple moving average (red, 4-hours), and the 200 simple moving average (green, 4-hours).
The price declined below the 76.4% Fib retracement level of the upward move from the $1,895 swing low to $1,966 high.
If the bears remain in action, the price may perhaps test the $1,880 support. The next major support is near the $1,850 level. It coincides with the 1.618 Fib extension level of the upward move from the $1,895 swing low to $1,966 high.
On the upside, the price might face resistance near $1,920. There is also a key bearish trend line forming with resistance near $1,920 on the same chart. The next key resistance could be $1,960, above which the bulls might aim a test of the $1,980 resistance zone or even $2,000.
Looking at EUR/USD, the pair found support near the 1.0950 level and attempted a recovery wave. Besides, GBP/USD remained well bid above the 1.3050 support zone.
Economic Releases to Watch Today
- German Consumer Price Index for March 2022 (YoY) (Prelim) – Forecast +6.3%, versus +5.1% previous.
- German Consumer Price Index for March 2022 (MoM) (Prelim) – Forecast +1.6%, versus +0.9% previous.
- US Gross Domestic Product Q4 2021 – Forecast 7% versus previous 7%.
Gold Report: Will the US Employment Report Increase Volatility for Gold?
Gold managed to finish the previous week moving higher but has lost substantial ground so far in the current week, almost reversing the previous gains. At the same time, the gold market continues to display same inactivity and muted reaction, implying the current market fundamentals may be more supportive for other markets. In this report, we will be emphasizing the main developments from around the world that could be creating volatility for Gold’s price. Our ending will consist of Gold’s technical analysis identifying the most important technical levels.
Gold’s largest daily movement came on Monday the 28th of March, when the price action was dropping throughout the session. This may have been a result of the ongoing strengthening of the USD Index which on the day reached highs tested previously in the early part of March. The dollar has been on an uptrend since the 17th of March possibly supported by a tight labor market and solid economic data from the US. Last week’s US Flash PMI data displayed strength in the Services and Manufacturing sectors, with the readings moving higher, while the weekly Initial Jobless claims was notably lower than the previous and forecasted figure. Evidence of the US economy growing may have not been a positive sign for Gold which tends to respond positive to negative data and vice versa. Since the latest US economic releases improved, the need for Gold as a hedge instrument is limited and may invite bearish tendencies. Gold’s upward movement in the past week was interrupted after the release of the PMIs and may continue to spill in the current week with more releases expected. Currently, we have evidence that the greenback and Gold keep a negative correlation between them.
Despite the somewhat muted price action by Gold in the past week, from our point of view the metal has managed to maintain its movement to higher grounds compared to where it started the year. First and most important Russia’s war in Ukraine is impacting both the supply chains and consequently inflationary pressures. The war has created resentment between nations which have applied a number of sanctions for commodities and energy sources which has seemingly worsened the economic global outlook currently. The overall economic risk may have remained elevated so far in the past month and may continue to do so even as Gold may be shying away from the large swings in the most recent weeks. Moreover, if Ukraine and Russia do not agree on a ceasefire and tensions intensify further, we could be looking at a complete disruption of supply chains that could cause major problems to the global economy like unemployment or stagflation.
On a separate note, in the past days Shanghai boosted lockdown restrictions as local Covid infections jumped to a record. Calculating the loss of economic output from Shanghai’s lockdown may be challenging for now, yet it remains to be seen if it will impact the global economy. Overall China’s surge in new cases is worrying and poses a great threat to the global economy considering its contribution to the world.
In the following days traders expect the March US employment report coming up on the 1st of April. Analysts expect this to be the third consecutive solid employment report in a row for the US economy and the first after the Fed’s rate hike. This event is important, and caution is advised as it can create volatility waves across the board.
Technical Analysis
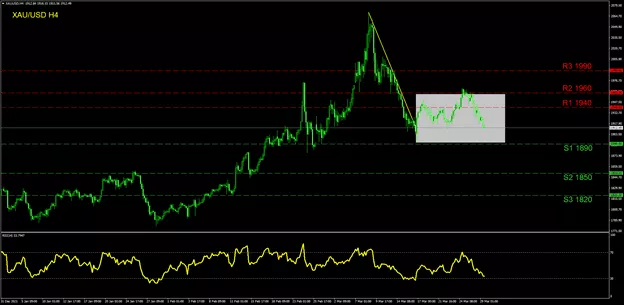
XAU/USD H4
In the most recent sessions, Gold has headed lower and could be moving in a sideways motion. At the moment the trend could be heading towards the (S1) 1890 support level which was last tested on the 28th of February. If the downward trend continues to unfold, we could see a move even lower to the (S2) 1850 line while even lower the (S3) 1820 line is also imminent. If the bulls take charge, we may see the (R1) 1940 level being tested first while the (R2) 1960 was the peak of the upward momentum formed in the past week. At the top, the (R3) 1990 is our highest resistance. We would like to emphasize the grey area on our chart, which the price action has been moving within since the 14th of March. Finally, the RSI indicator below our chart has dropped nearby the 30-level highlighting the recent selling.