Sample Category Title
US 500 Lacks Support
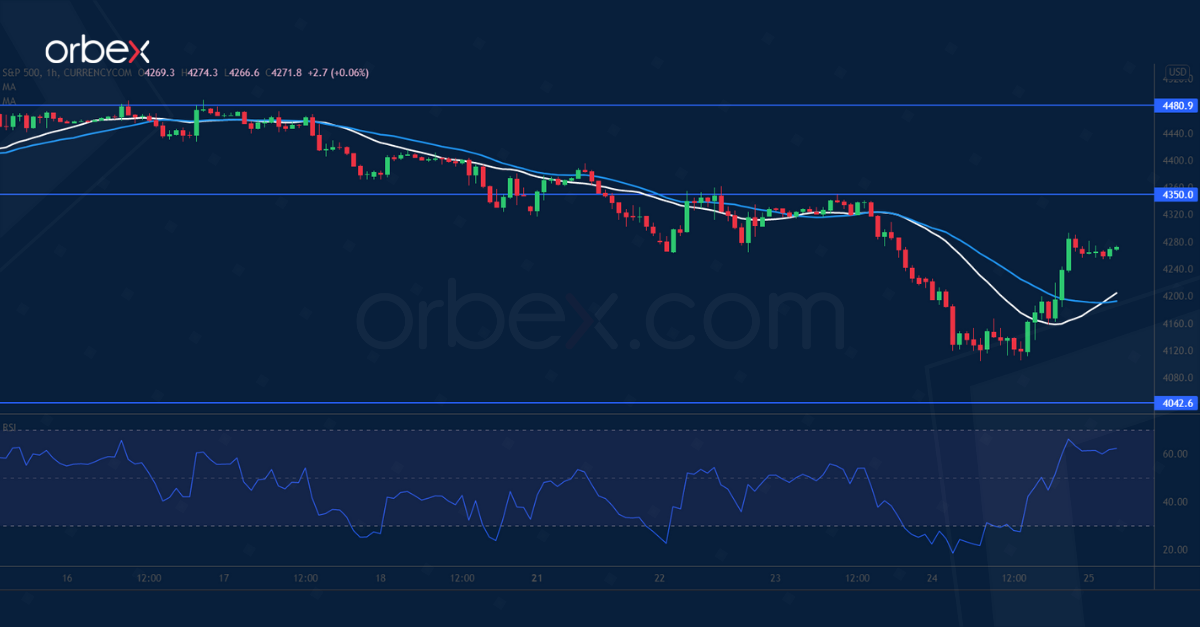
The S&P 500 weakens as investors fear spillover from the conflict in Ukraine. A break below the daily support at 4280 further put the bulls on the defensive.
Last May’s lows, near 4040, are the next target as liquidation continues. The index may have entered the bear market as the sell-off could speed up in the coming weeks.
On the daily chart, the RSI’s double-dip in the oversold area may offer temporary relief. 4350 is the first hurdle ahead and the bears may look to fade any rebound amid soured sentiment.
XAU/USD Seeks Support
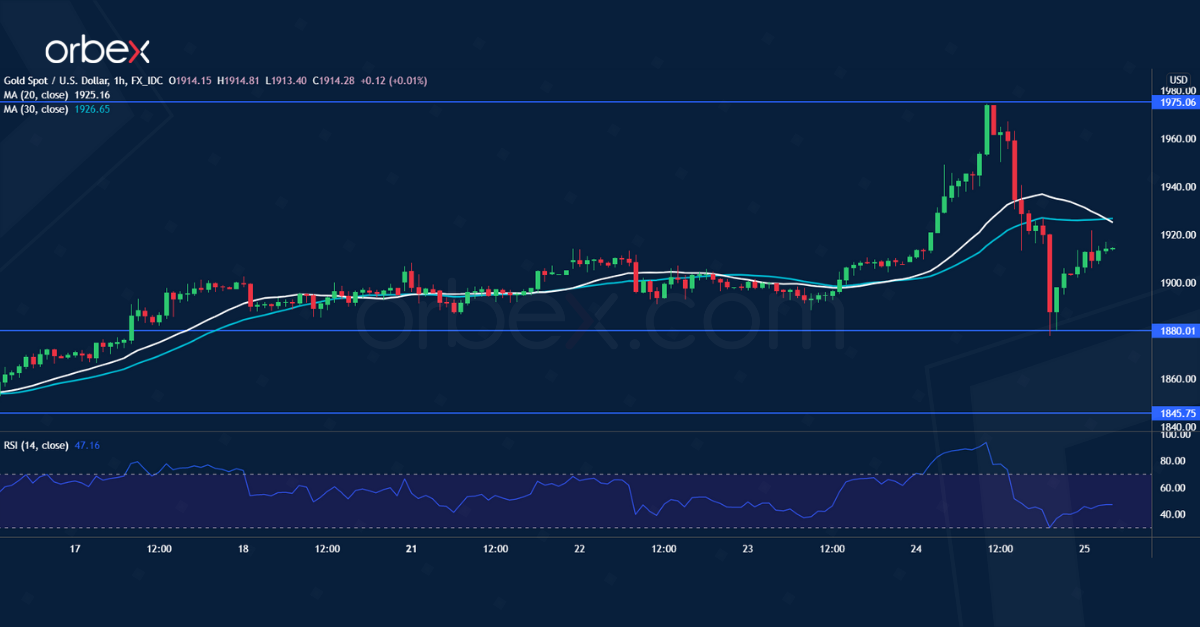
Gold whipsawed as markets await the Western response to the invasion of Ukraine. The rally accelerated after it broke above last June’s high at 1912.
Momentum trading pushed the price to September 2020’s highs (1975) before reversing its course. 1880 is fresh support after intraday buyers took profit.
As sentiment shifts to the bullish side, the current pullback combined with a depressed RSI could trigger a bargain-hunting behavior. Renewed buying frenzy may send the metal to the psychological level of 2000.
USD/JPY Bounces Off Daily Support
The US dollar jumps as traders seek safe-haven assets over the Russia-Ukraine conflict.
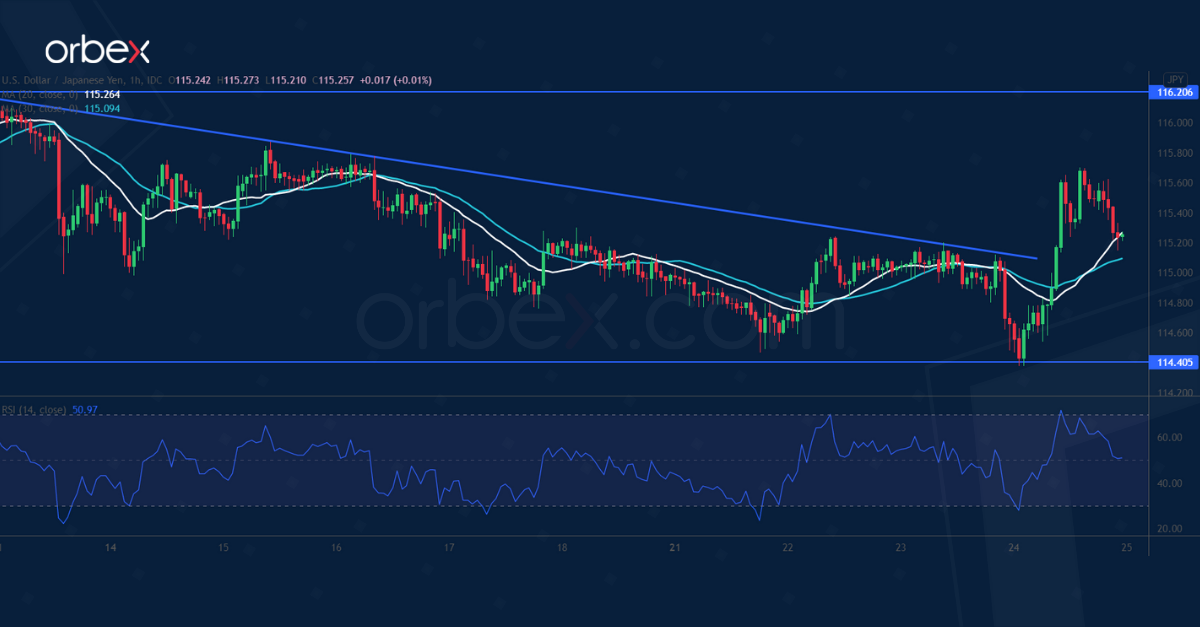
The pair struggled for bids after it turned away from the double top (116.20) and has been grinding down a falling trend line. However, the daily support at 114.40 has proved to be a solid demand area by keeping February’s rebound intact.
Strong momentum above the trend line and 115.20 forced sellers out of the game and would attract more purchasing power. A close above 116.20 would extend the rally towards 117.00.
High Voltage
What’s happening in Ukraine is a Black Swan event; it’s worse than the worst-case scenario that has been put on paper over the past couple of months, and it’s clearly not a limited military operation, it’s really a full invasion of a country, that no one could explain other than Putin’s regret for the Soviet Union’s demise and his unacceptance of the post-Cold War security architecture.
Sanctions are being imposed on Russian financial sectors, transport, and exports. Major economies will stop financing the Russian debt and cut the provision of semiconductors. Taiwan’s chipmaker TSMC said it’s fully committed to complying with new export rules. But there are sanctions that didn’t go through. Europe for example opposed to leave the Russian banks out of Swift, and Biden won’t impose sanctions on Russian energy, aluminum, and wheat industries to avoid penalizing the rest of the world. Still, the Russian energy companies are taking a very heavy toll right now. Gazprom shares dived up to 50% yesterday before closing the session 25% lower. Lukoil sank near 45% and closed almost 23% down, while the Moscow Exchange lost up to 30% before closing 20% lower. That’s understandable as Russian companies will be cut off from the rest of the world in terms of business and financing. But it is also said that only about 16% of the Russian companies’ cash holdings are in US dollars, the rest is in Chinese yuan, euro and gold, to help the companies carry on, at least for a while, as the crisis extends.
Bitcoin dilemma
Bitcoin could be a potential safe haven for Russian oligarchs avoiding sanctions as there will be no censor on the Bitcoin network and on cryptocurrency transactions. Russians will have trouble converting their money back to fiat money, yet the cryptocurrencies could act as a powerful store of value for a major part of holdings that don’t need to be liquid.
As a result, the Russian dilemma for cryptocurrencies could accelerate the regulation efforts and be a road bump in the process of adoption of these decentralized currencies in the traditional system.
Bitcoin has rebounded after dipping a toe below the $35K level, yet the price action was parallel to other risk assets, as the rebound happened as Nasdaq stocks rallied big, as well. We will see how Bitcoin will perform over the weekend when there will be no hint on how the other assets would react. The risks are tilted to the downside due to the intensifying geopolitical situation.
Why US equities rallied yesterday?
There is no satisfactory explanation that would grant the US equities a healthy positive correction. Among the most popular explanations, there is the possibility that investors gave a deeper thought about the US exposure to the Russian crisis, or the likelihood that the Ukrainian war could soften the Fed’s policy tone.
But in reality, it’s about volatility, high volatility that results from a high-voltage environment.
The rising volatility in Nasdaq warns that the winds could change direction very rapidly. This morning, the US equity futures are again in the red. It’s impossible to tell what direction the market will take in the next five minutes. The only certainty is uncertainty, and this is how it will be for the next couple of sessions unfortunately.
Oil: Strategic reserves & Iranian oil could help ease prices
The direct impact of the Ukrainian crisis to US equities could be limited, but the indirect impact, which is the rising energy prices could take a severe toll. This is why the war’s biggest threat to the American companies is inflation.
The barrel of US crude traded above the $100 mark yesterday then eased back to around $96 as Joe Biden said the US will release its strategic oil reserves to ease the pressure at the pump. If there is an ideal time to use the strategic reserves, it’s now!
Also, there is increased possibility of a nuclear deal with Iran to unlock the Iranian oil potential - which would provide up to 800’000 barrels of additional supply per day. That could help easing the energy crisis and pull the energy prices lower, yet the easing impact could remain limited as long as the OPEC+ constraints supply and the post-pandemic demand quickly absorbs the available reserves.
Daily Technical Analysis
EUR/USD
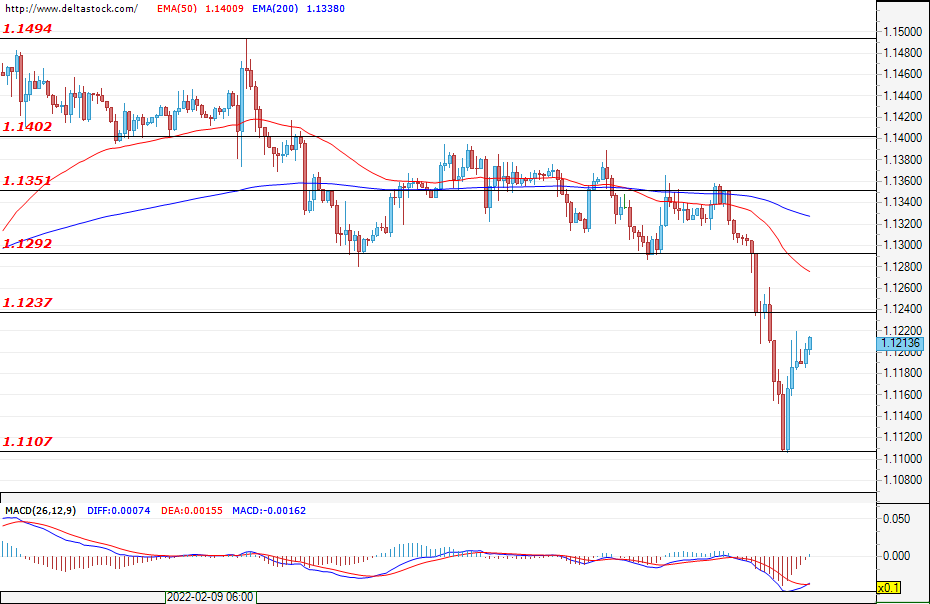
The market corrected yesterday's panic sell-offs as the pair managed to bottom out at 1.1107. This area can be defined as a weekly support. The previous support at 1.1170 was breached, but the session managed to end above this level. Today, it is possible that this zone will be reaffirmed as valid if the pair manages to close above it. The corrective movement is expected to become deeper and more aggressive, with the first resistances for the bulls being the zones at around 1.1237 and at 1.1290. If prices stay below 1.1290, then a possible new wave of sell-offs could test the bottom at around 1.1107. Sentiment remains negative at the moment due to the dynamic situation in Ukraine. Bullish scenarios are possible, provided that prices stay permanently above 1.1350. Geopolitical events are shifting investors’ focus away from the economic calendar, but today they will nevertheless still follow the data on the business climate and consumer confidence for the euro area at 09:00 GMT.
USD/JPY
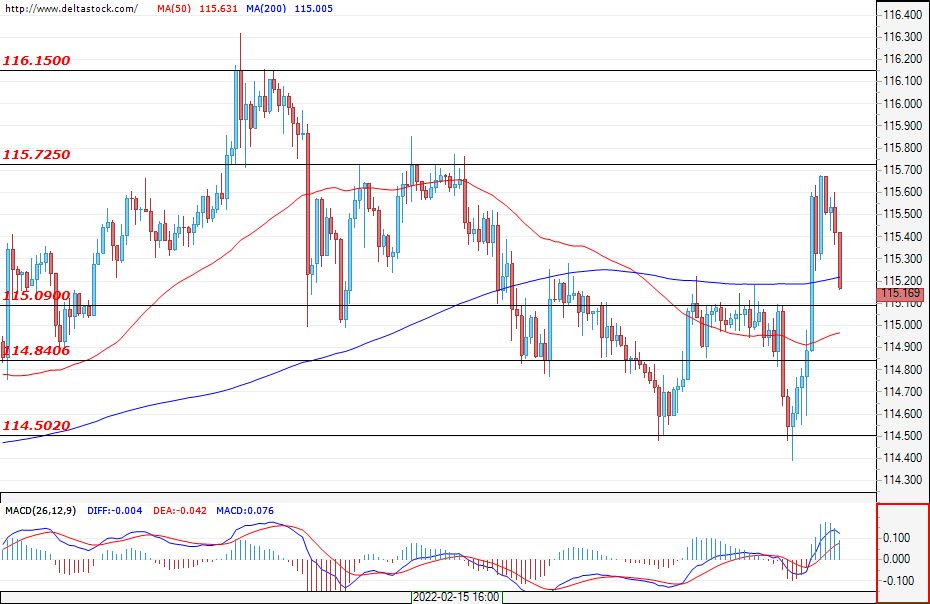
The U.S. dollar attracted asylum seekers and the pair moved closer to a resistance test at 115.72. The first support for the bulls is 115.09, and if the zone manages to limit the current correction, then a new impulse towards 115.72 is possible. In case of another failed test of 115.72, the market is likely to remain in the range between the support at 114.50 and the resistance at 115.72. If the bulls maintain their momentum and manage to overcome the double peak at 116.33, then a rally targeting the range of 117.50 – 118.00 is expected.
GBP/USD
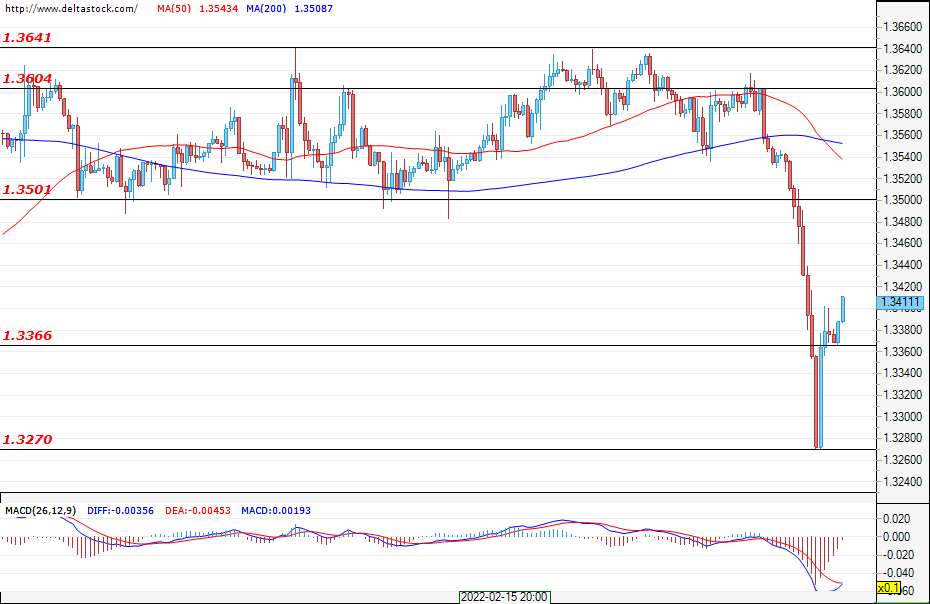
The Cable also heavily tanked during yesterday's session as the pair managed to bottom out at 1.3270. The daily close was above the weekly support of 1.3370, and in the early hours of today, the market has stayed true to this level. The correction, which is currently under development, could reach 1.3500, from which a new wave of sell-offs is expected. At the moment, expectations remain negative, but in case the recovery reaches 1.3600, then a change in the trend can be expected.
EUGERMANY40
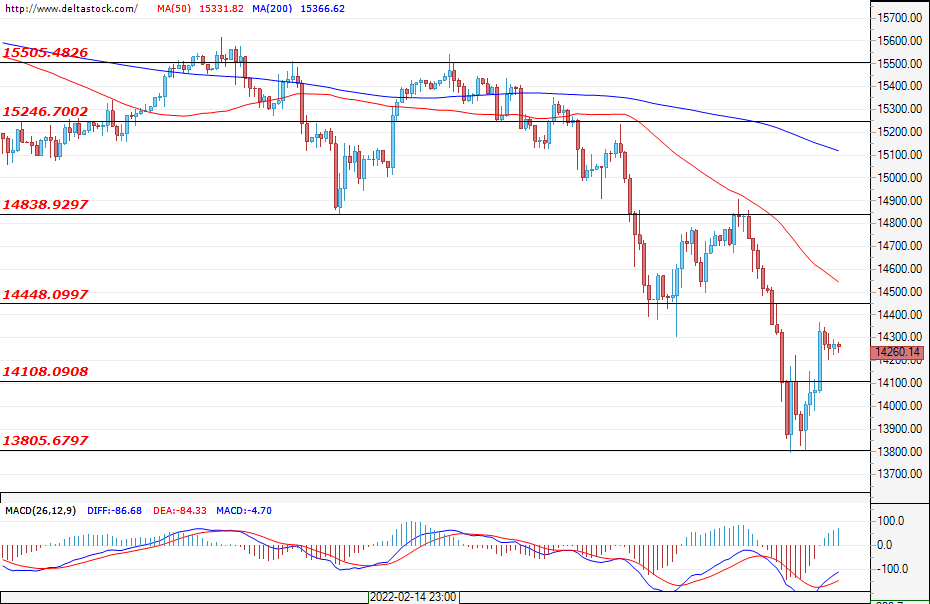
EUGERMANY40 Current level - 14027 The German index managed to recover some of its losses and the weekly support at 13800 managed to stop the bearish pressure. The first resistance for the bulls is 14450 and the still unconfirmed support is 14100. The main area that would limit new sell-offs remains 13800. Despite the sour market sentiment, an aggressive correction, aimed at pressuring the bears, is still possible, with the main resistance shaping out to be 14800. Volatility is expected to remain high and a new test of 13800 is also possible.
US30
The U.S. blue chips made an impressive recovery and the index closed almost unchanged. If the zone is confirmed at 32655 or the rally continues, then 32360 can be considered to be the bottom of the market. Given that the bulls maintain their momentum, their next target would be the resistance at 33570. Geopolitical risks tend to fade over time and the market may offer more gains if the 32360 area remains intact. Many investors currently remain on the sidelines due to market uncertainties, but their return would provide the energy needed for more sustainable rallies.
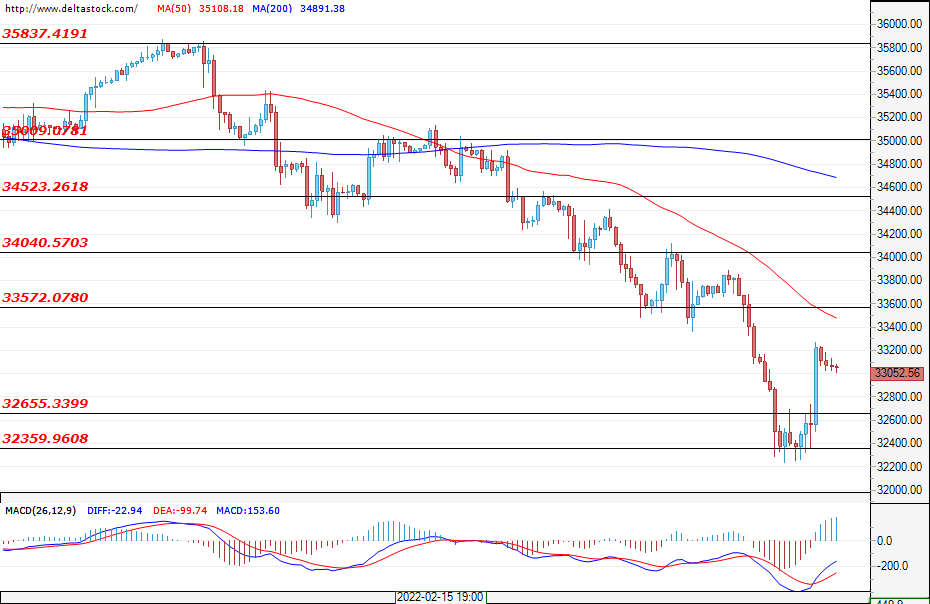
Nasdaq 100 Sell-Off Intensifies Amid Ukraine Crisis
American equities declined sharply in the overnight session as investors continued to focus on the ongoing crisis in Ukraine. On Thursday morning, Russia’s president announced that he was launching an attack on Ukraine. By the end of the day, several Ukrainian military bases were hit and over 40 people killed. In a statement, Joe Biden blamed Putin for the crisis and imposed severe sanctions that targeted key officials and exports to the country. The Dow Jones, Nasdaq 100, and S&P 500 indices declined by more than 1%.
The US dollar strengthened against other currencies as investors rushed to its safety. The currency also reacted to the latest American GDP and initial jobless claims data. According to the statistics agency, the American economy expanded by 7.0% in Q4, which was in line with expectations. The GDP price index rose by 7.2%. Additional data showed that the country’s initial jobless claims dropped to 232k last week after they rose by 249k in the previous month. Meanwhile, new home sales rose by 801k in January. The biggest concern for the US economy is that rising oil prices are affecting the GDP. According to Goldman Sachs, a $10 increase of oil prices was taking about 10 basis points from the economy.
Focus among investors will remain on the ongoing crisis in Europe. There will be other key events in the economic calendar. For example, Germany, the biggest economy in Europe, will publish the latest GDP numbers for the fourth quarter. The European Commission will also publish the latest business and consumer confidence data. The most important data will be the American personal consumer expenditure data, which is the Fed’s most important inflation figure.
EURUSD
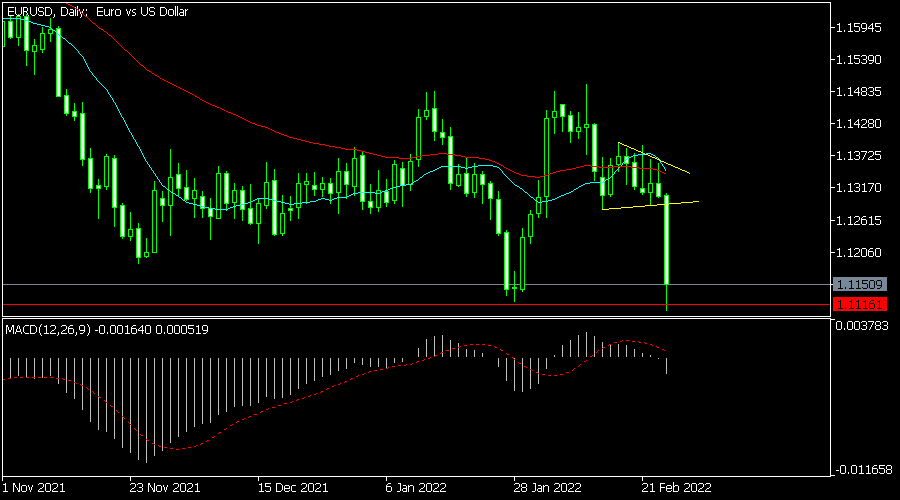
The EURUSD pair dropped sharply as demand for the US dollar rose. The pair is trading at 1.1150, which is substantially lower than this week’s high of 1.1392. On the daily chart, the MACD moved below the neutral level for the first time in weeks. The pair also moved below the 25-day and 50-day moving averages. It also moved below the year-to-date low of 1.1115. Therefore, the pair will likely keep falling as bears target the next key support at 1.11050.
XBRUSD
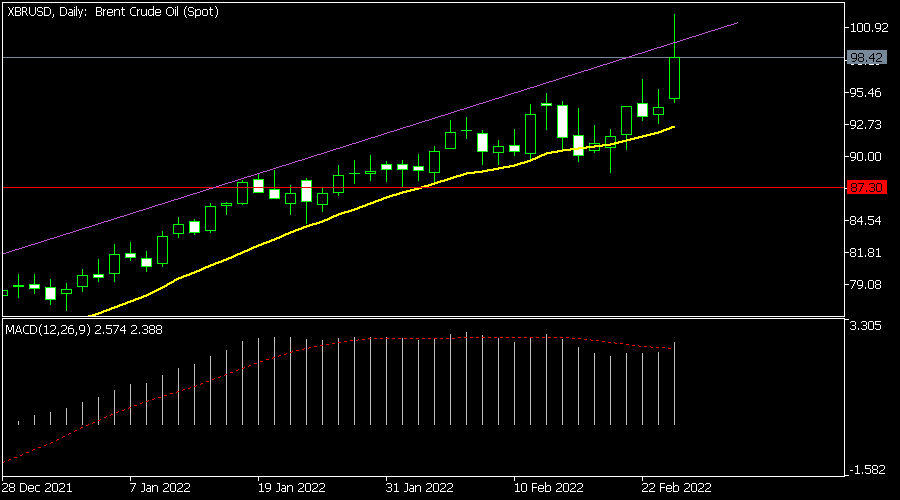
The XBRUSD pair crossed the 101 resistance level for the first time in more than 8 years. The pair managed to move above the upper side of the ascending channel that is shown in purple. It also remains above the short and long term moving averages. Oscillators like the Relative Strength Index and the MACD have also tilted upwards. Therefore, the pair will likely keep rising in the coming weeks.
XAUUSD
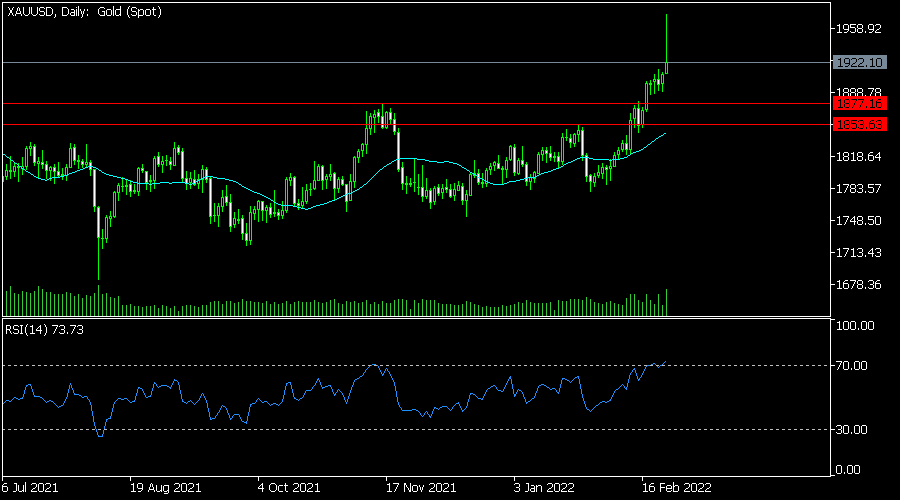
The XAUUSD pair jumped sharply as demand for safe havens rose. It rose to a high of 1,972, which was the highest level since 2020. On the daily chart, the pair moved above the short and long term moving averages. It also managed to cross several resistance levels like the YTD high of 1,877. The pair will likely keep rising today.
EUR/USD Daily Outlook
Daily Pivots: (S1) 1.1096; (P) 1.1204; (R1) 1.1301; More...
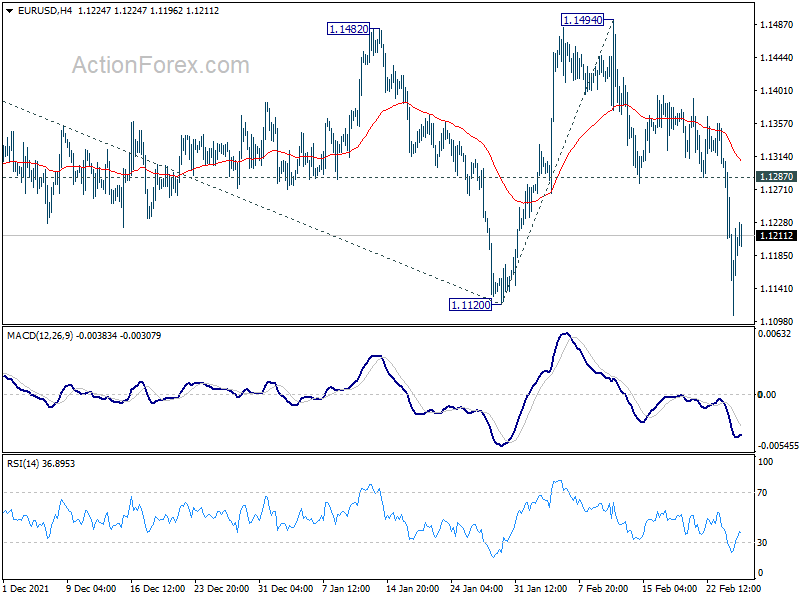
EUR/USD recovered after hitting 1.1105 but further fall is still expected with 1.1287 support turned resistance intact. Sustained break of 1.1120 will confirm resumption of larger down trend from 1.2348. Next target is 61.8% projection of 1.2265 to 1.1120 from 1.1494 at 1.0786. However, firm break of 1.1287 will dampen this bearish view and turn bias back to the upside for 1.1494 resistance.
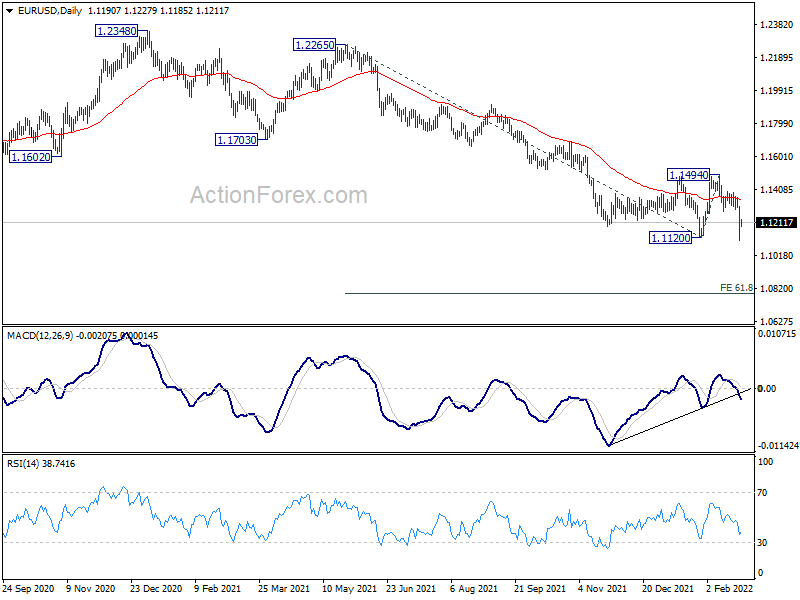
In the bigger picture, the decline from 1.2348 (2021 high) is seen as a leg inside the range pattern from 1.2555 (2018 high). Sustained trading above 55 week EMA (now at 1.1593) will argue that it has completed and stronger rise would be seen back towards top of the range between 1.2348 and 1.2555. However, firm break of 1.0635 (2020 low) will raise the chance of long term down trend resumption and target a retest on 1.0339 (2017 low) next.
GBP/USD Daily Outlook
Daily Pivots: (S1) 1.3247; (P) 1.3399; (R1) 1.3524; More...
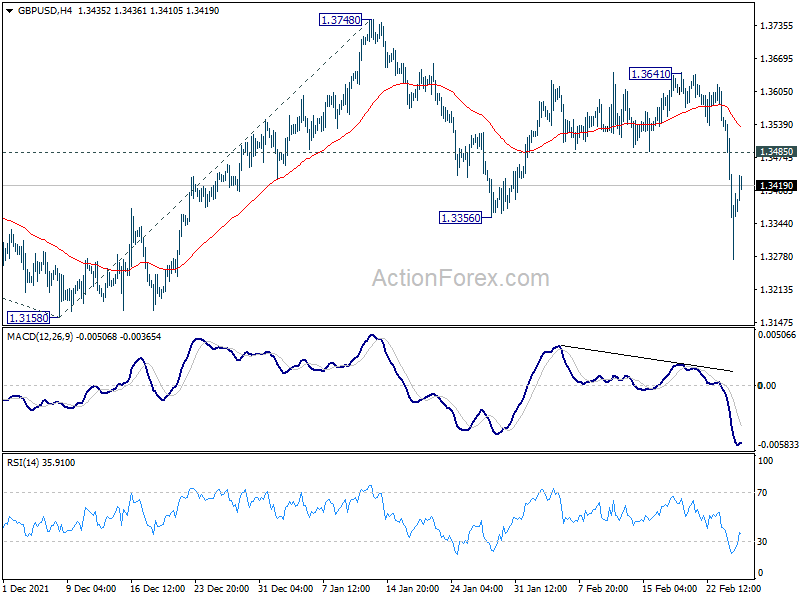
GBP/USD recovered after hitting 1.3272, but further fall is still expected with 1.3485 support turned resistance intact. Current development suggest larger decline from 1.4240 is still in progress. Firm break of 1.3158 will target 61.8% projection of 1.4248 to 1.3158 from 1.3748 at 1.3074 next. However, firm break of 1.3485 will dampen this bearish view and turn bias back to the upside for 1.3641 resistance.
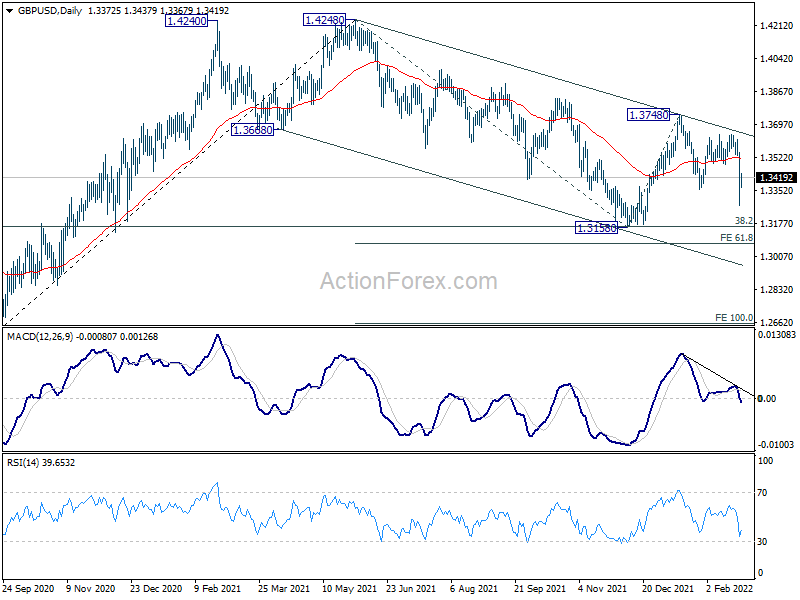
In the bigger picture, as long as 38.2% retracement of 1.1409 to 1.4248 at 1.3164 holds, up trend from 1.1409 (2020 low) is still in progress. On resumption, next target will be 38.2% retracement of 2.1161 to 1.1409 at 1.5134. Nevertheless sustained break of 1.3164 will argue that whole rise from 1.1409 has completed and bring deeper fall to 61.8% retracement at 1.2493.
USD/CHF Daily Outlook
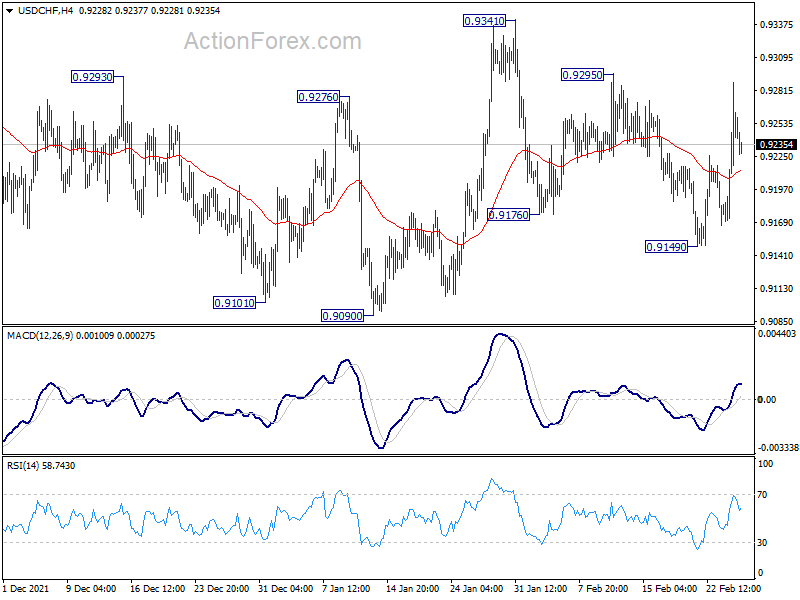
Daily Pivots: (S1) 0.9189; (P) 0.9239; (R1) 0.9305; More....
Intraday bias in USD/CHF remains neutral as range trading continues. Choppy rise from 0.8925 would still be in favor to extend higher as long as 0.9090 support holds. Break of 0.9341 will target 0.9372 resistance and then 0.9471. On the downside, however, break of 0.9090 will bring deeper fall back to 0.8925 support.
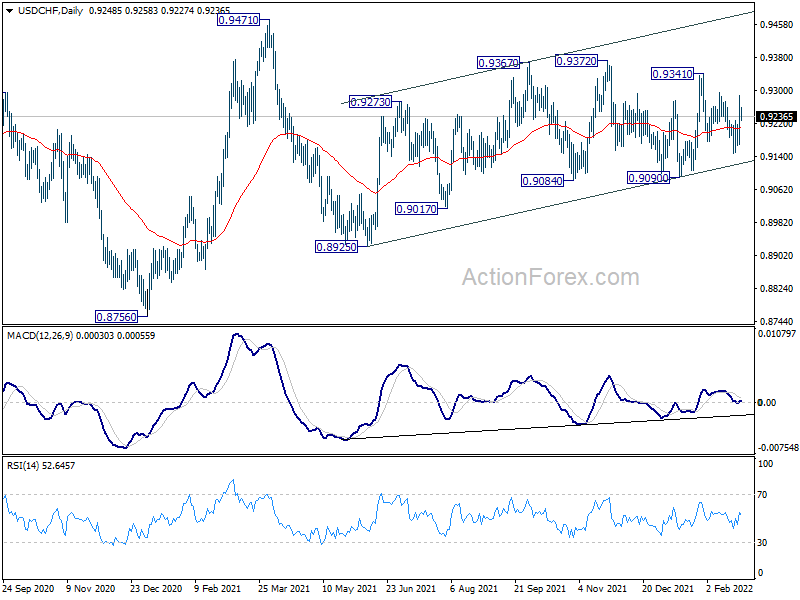
In the bigger picture, medium term outlook will be neutral at best as long as 0.9471 resistance holds. Larger down trend could still extend through 0.8756 (2021 low). However, firm break of 0.9471 will argue that the trend has already reversed and rebound the rally from 0.8756 with another impulsive move.
USD/JPY Daily Outlook
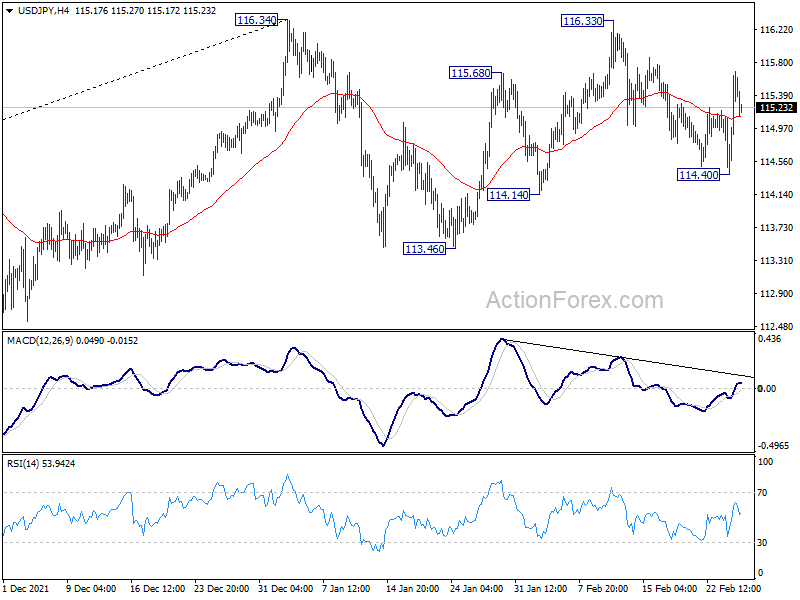
Daily Pivots: (S1) 114.73; (P) 115.21; (R1) 116.01; More...
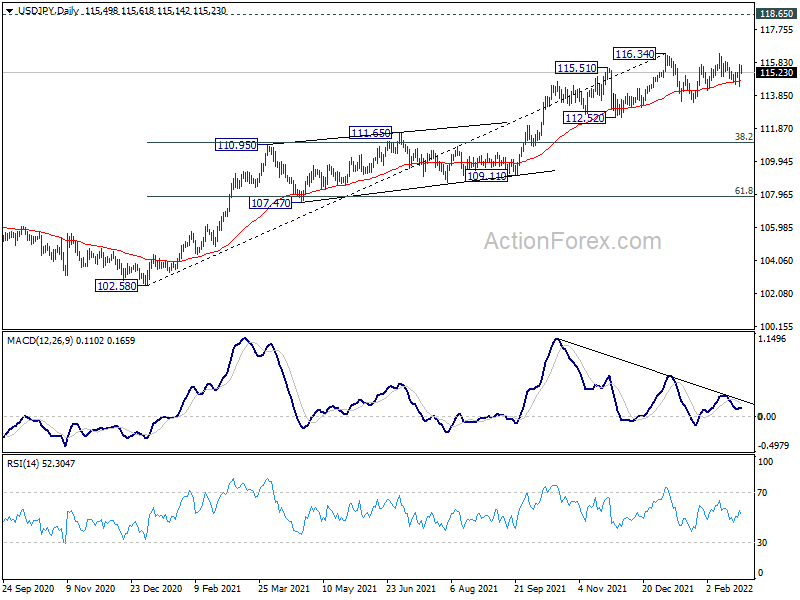
Intraday bias in USD/JPY remains neutral for the moment. On the upside, firm break of 116.34 will resume larger up trend from 102.58 to 118.65 long term resistance next. On the downside, though, break of 114.40 will continue the corrective pattern from 116.34 with another fall to 113.46 support.
In the bigger picture, no change in the view that rise from 102.58 is the third leg of the up trend from 101.18 (2020 low). Such rally should target a test on 118.65 (2016 high). Sustained break there will pave the way to 120.85 (2015 high) and raise the chance of long term up trend resumption. This will remain the favored case as long as 55 week EMA (now at 111.61) holds.