

Sample Category Title
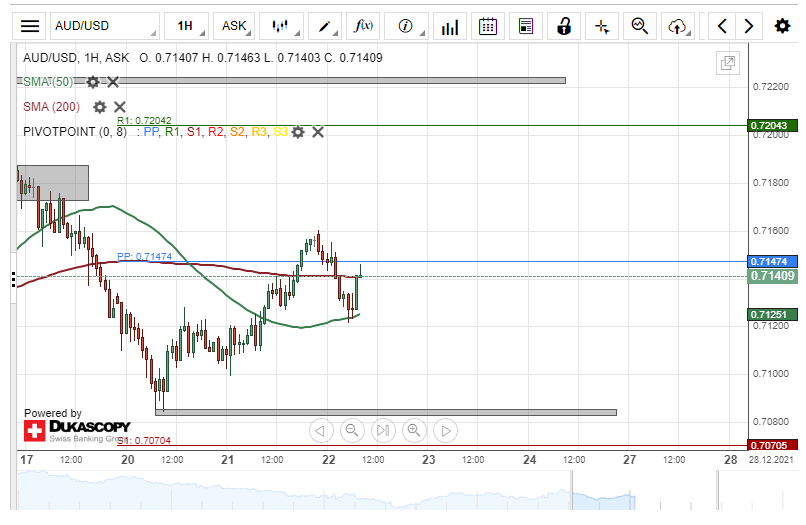
AUD/USD Bounces Off 0.7160
The recovery of the AUD/USD found resistance at the 0.7160 level. By the start of Wednesday's European trading hours, the rate had retreated to the support of the 50-hour simple moving average near 0.7120.
A move below the simple moving average might look for support in the 0.7100 mark. Below the round exchange rate level, the Australian Dollar could find support against the USD in the Monday's low levels at 0.7083/0.7086.
However, a push upwards by the 50-hour SMA would face the resistance of the 200-hour SMA near 0.7140, the weekly simple pivot point at 0.7147, before returning to the 0.7160 mark.
EUR/JPY Surge Reaches Above 128.50
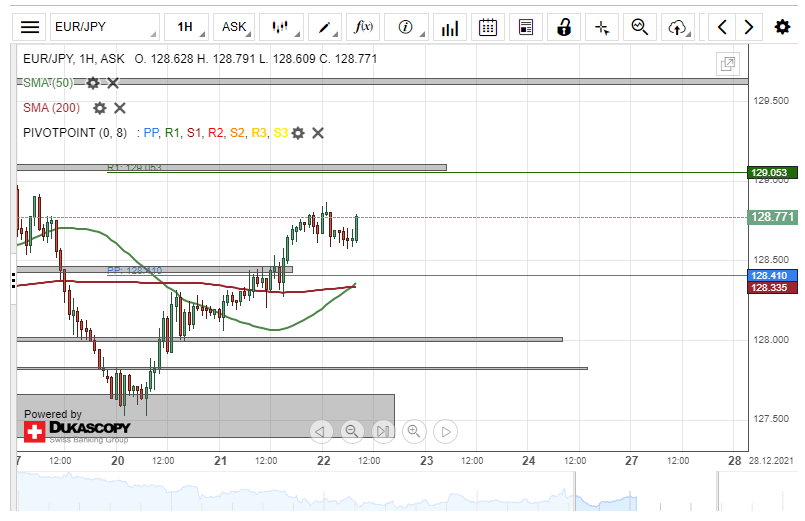
The EUR/JPY passed above technical resistance levels and the 128.50 mark on Tuesday. On Wednesday morning, the rate appeared to be consolidating by slightly retracing back down. However, the rate had no close by technical resistance as high as 129.00 and no support as low as 128.50.
A resumption of the surge of the Euro against the Japanese Yen might reach the resistance of the 129.00 mark, the weekly R1 simple pivot point and the December 8 high level at 129.10. Higher above, note the December high level at 129.64.
On the other hand, a decline of the pair might look for support in the 128.50 level, the weekly simple pivot point at 128.41 and the combination of the 50 and 200-hour simple moving averages near 128.30.
EURCHF Holds Neutral But Bullish Scenario Is On The Cards
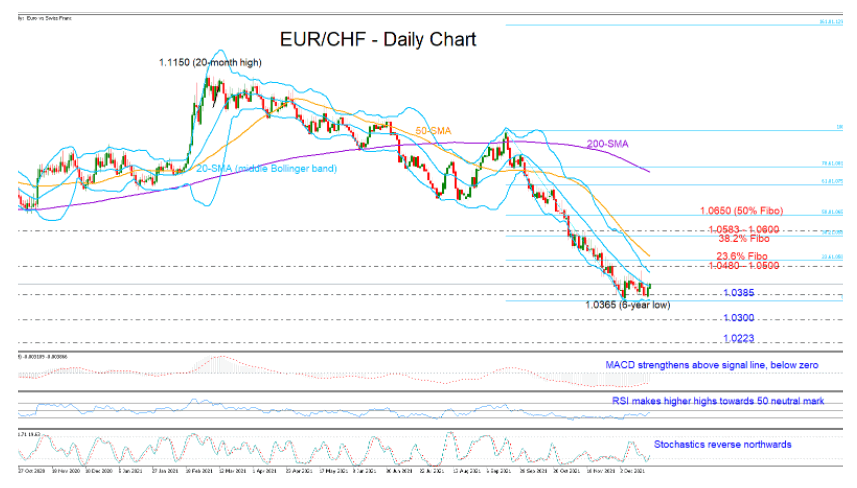
EURCHF keeps trading sideways marginally above its six-year low of 1.0365, unable to find enough power to breach the limits from the 20-day simple moving average (SMA).
Despite the ongoing neutral trajectory, the higher highs in the RSI and the improvement in the MACD keep hopes for an upside reversal alive. The positive momentum in the Stochastics is adding to this optimism, while the squeeze in Bollinger bands is another indication that volatility could soon expand.
In the bullish scenario, a forceful move above the 20-day SMA could immediately pause somewhere between the 1.0480 barrier and the 23.6% Fibonacci retracement of the 1.0937 -1.0365 down leg at 1.0500. Running higher, the price could visit the 38.2% Fibonacci of 1.0583 and the 1.0600 psychological mark, while a sustainable advance above the 50% Fibonacci of 1.0650, which overlaps with the November 2020 lows, would upgrade the big picture from bearish to neutral.
In the event the 20-day SMA stands firm, pressing the pair below the six-year low of 1.0360, traders could seek support around the 1.0300 level before targeting the 1.0223 handle. This is the territory where the price found shelter in the second-half of 2015 following the bounce from 0.9649. The 1.000 number could be of psychological importance; hence, it is expected to provide some footing if the descent continues.
In brief, although EURCHF is barely exhibiting any directional moves at the bottom of its downtrend, the technical indicators suggest the bulls could be around the corner.
UK 100 Makes A Bullish Attempt
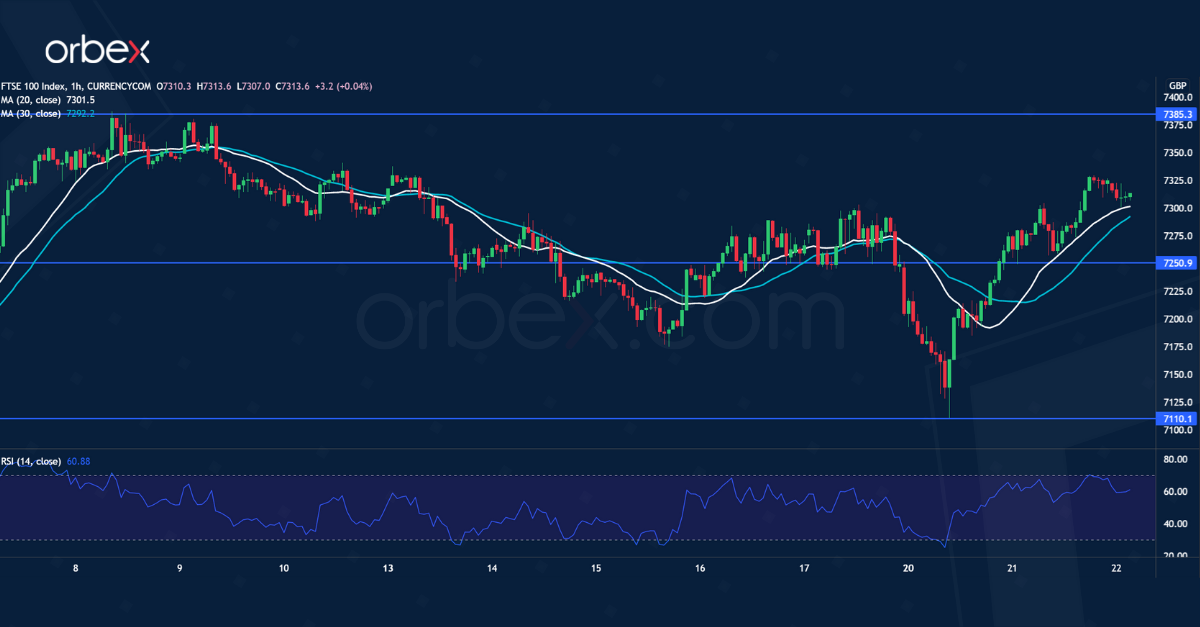
The FTSE 100 recovered some ground after the Omicron sell-off. The index has found solid buying at 7110.
An oversold RSI has attracted a buying-the-dips crowd. A tentative break above 7300 suggests strong interest in keeping the market afloat. A bullish MA cross could lead to acceleration on the upside.
7385 is a major hurdle on the daily chart. Its breach could cause a runaway rally and resume the uptrend. On the downside, 7250 is the first support, and 7110 is the second line of defense in case of weakness.
USD/CAD Consolidates Gains
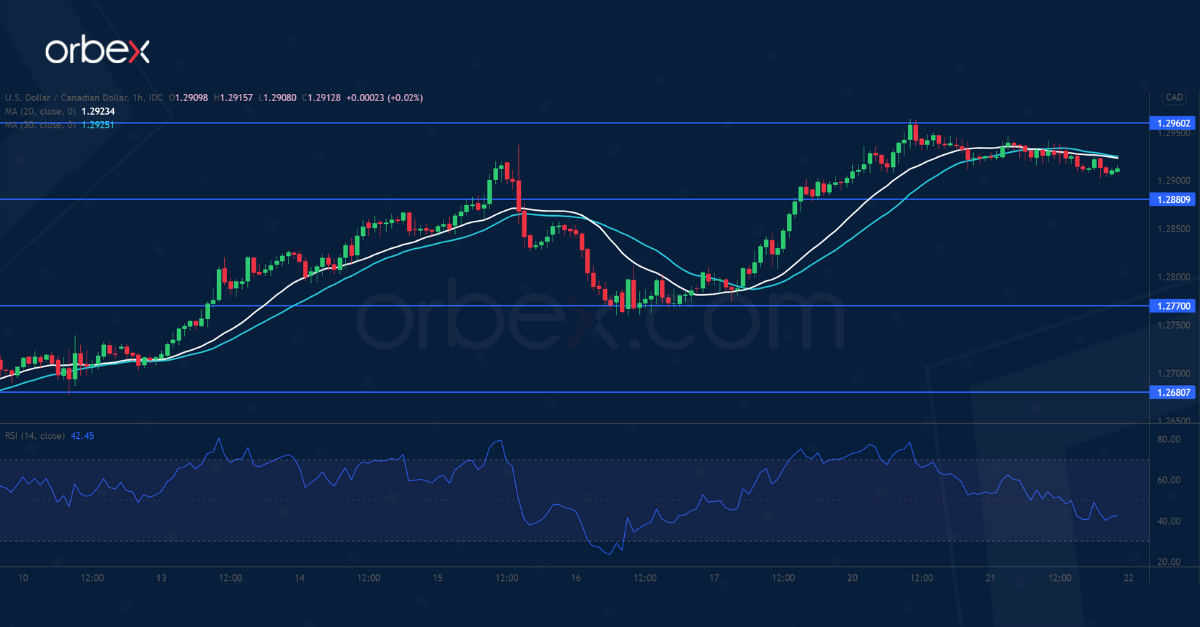
The Canadian dollar recouped some losses after better-than-expected retail sales. A break above the major daily resistance at 1.2930 has put the bulls back in control of the direction.
The RSI’s repeated overbought situation may cause a temporary pullback. Trend followers would be looking to jump in at a better price. 1.2880 is the closest support.
Sentiment would remain upbeat as long as price action is above 1.2770. A rally above the intermediate resistance at 1.2960 may trigger an extended rally towards 1.3200.
XAU/USD Seeks Support
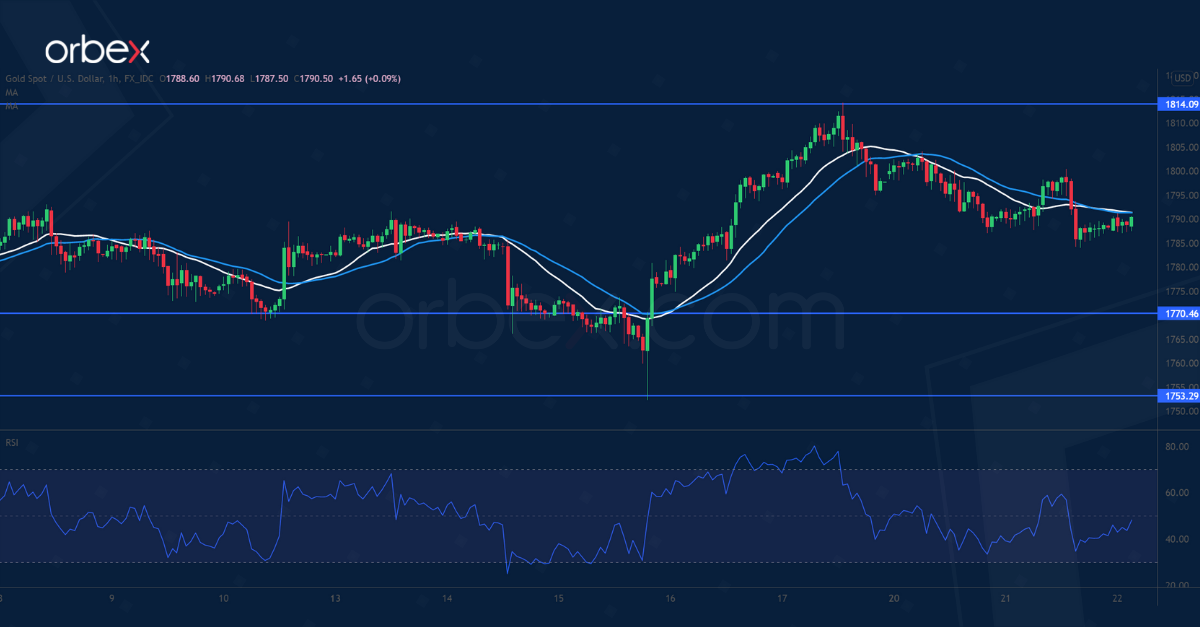
Gold softens as the US dollar edged higher. A surge above 1788 and then 1808 has prompted the bears to cover.
The precious metal is looking for support after the breakout stalled with an overextended RSI. A bearish MA cross may weigh on short-term sentiment.
The base of the initial breakout around 1770 is key support. A deeper correction would lead to the daily support at 1753, a critical level to keep the rebound relevant. Gold may climb towards 1850 if the bulls succeed in pushing above 1814.
Daily Technical Analysis
EUR/USD
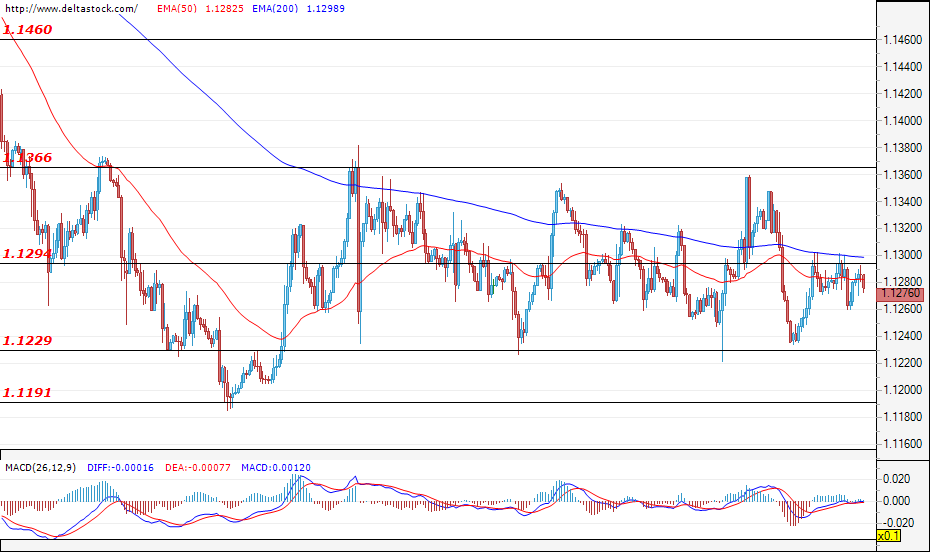
Current level - 1.1276
The currency pair continues to trade in the range between 1.1229 and 1.1366 and, since the start of the week, volatility has been rather low. The forecast is for the pair to continue trading in the mentioned range. At the time of writing, the EUR/USD is headed for a test of the resistance level of 1.1294, and a possible breach here could pave the way towards the upper border of the range at 1.1366. Today, increased activity can be expected around the release of the GDP data for the U.S. (13:30 GMT) and the consumer confidence data for the U.S. (15:00 GMT).
| Resistance | Support | ||
| intraday | intraweek | intraday | intraweek |
| 1.1294 | 1.1460 | 1.1230 | 1.1190 |
| 1.1360 | 1.1510 | 1.1230 | 1.1100 |
USD/JPY
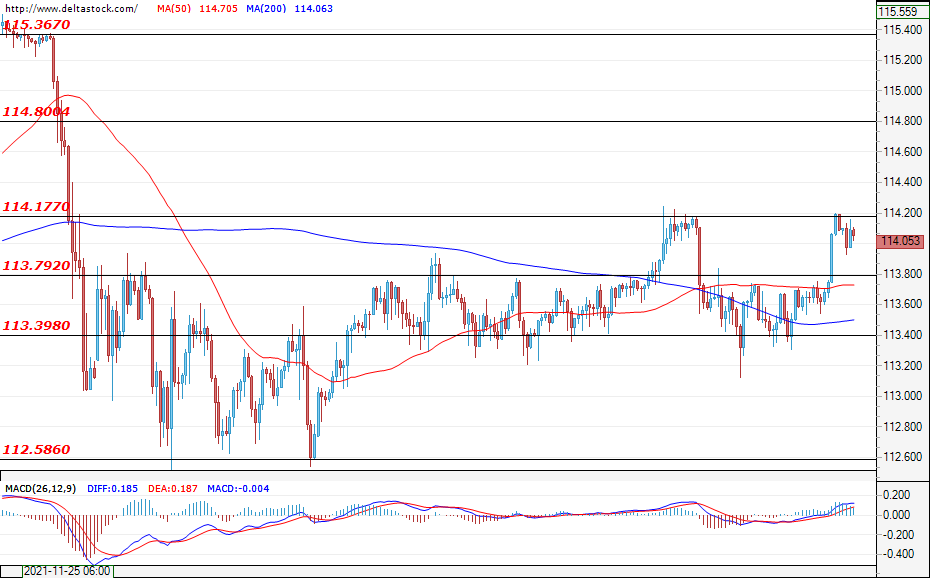
Current level - 114.05
The Ninja managed to violate the resistance at 113.79 and, at the time of writing, is headed towards a test of 114.17 – a level that was tested unsuccessfully last week. In case the pair manages to breach 114.17 this time around, then it is expected to continue rising towards the next resistance zone at around 114.80. If the resistance at 114.17 withholds the bullish pressure, then the most likely scenario would be for the pair to shift back into the range between 113.39 - 113.79.
| Resistance | Support | ||
| intraday | intraweek | intraday | intraweek |
| 114.17 | 115.37 | 113.80 | 112.58 |
| 114.80 | 115.37 | 113.40 | 110.80 |
GBP/USD
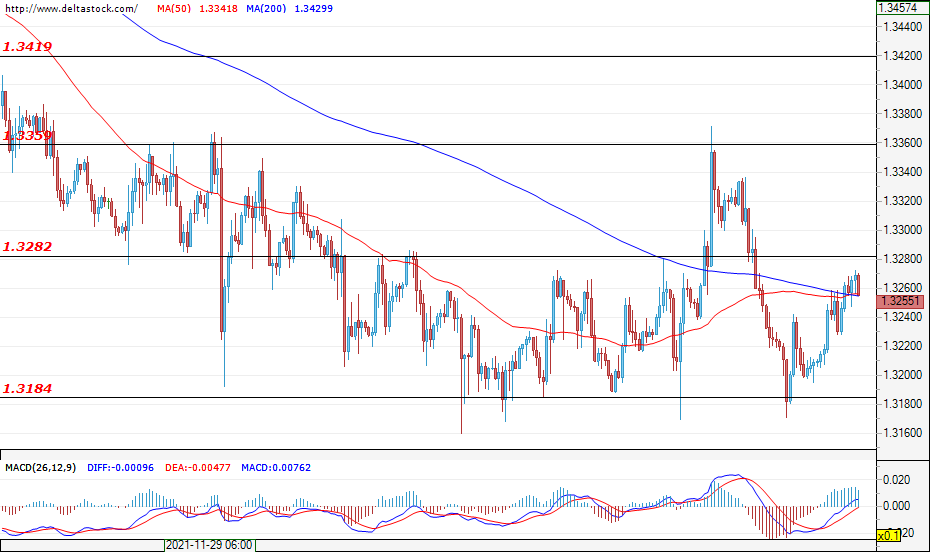
Current level - 1.3255
The Cable bounced back after the unsuccessful test of 1.3184 and, at the time of writing, is headed towards the resistance level of 1.3282. A confirmed breach of this level would mean that the correction would deepen and that a test of 1.3359 would be the next move. In the negative direction, the major support level remains the level of 1.3184.
| Resistance | Support | ||
| intraday | intraweek | intraday | intraweek |
| 1.3282 | 1.3360 | 1.3180 | 1.3000 |
| 1.3360 | 1.3500 | 1.3100 | 1.2900 |
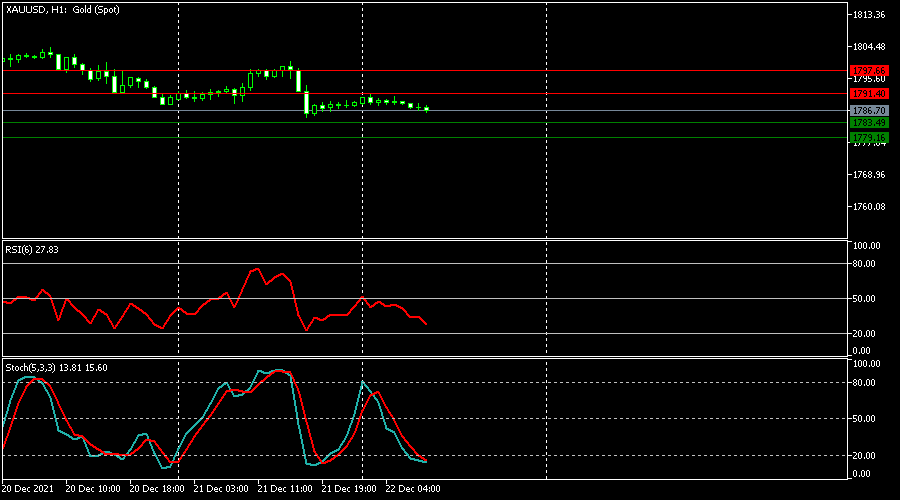
XAUUSD Is Possibly Bearish
Technical analysis
The RSI is below level 50.
The RSI is at the oversold zone.
Most likely scenario – SELL
Target prices: 1,783.49 1,779.16
Alternative scenario – BUY
Target prices: 1,791.40 1,797.66
Key levels
Support 1,783.49 1,779.16
Resistance 1,791.40 1,797.66
Dow Jones In A Relief Rally Ahead Of US Consumer Confidence Data
The Canadian dollar was little changed as investors reflected on the latest retail sales from the country. According to Statistics Canada, retail sales rose by 1.6% in November after crashing by 0.6% in the previous month. This increase was better than the median estimate of 1.0%. In the same period, the core retail sales rose by 1.3% after falling by 0.2% in the previous month. These numbers show that the country’s economy is doing relatively well. As such, there is a likelihood that the bank will maintain a hawkish tone in January’s meeting.
The US dollar index rose slightly as fears over Omicron faded. On Tuesday, Joe Biden announced new measures to boost vaccination as the number of cases continued rising. The country will also provide more at-home vaccine tests for free. Later today, the currency will react to the latest US GDP data. Economists expect the data to show that the economy expanded by 2.1% in the third quarter. Still, these being the third estimates, the impacts on the greenback will be limited. The key mover will be the latest consumer confidence data to be published by the Conference Board. Analysts expect the data to show that confidence improved modestly in December.
It was a green day in Wall Street as concerns about Omicron eased. The Dow Jones index rose by more than 285 points while the Nasdaq 100 index rose by more than 50 points. The best performing stocks were in the energy and airline sector. At the same time, the price of crude oil rose by more than 2%. Later today, the price of oil will react to the latest US inventories data by the Energy Information Administration (EIA). Analysts expect the data to show that inventories declined by more than 2.6 million barrels last week. This will be the second straight week of drawdown.
USDCAD
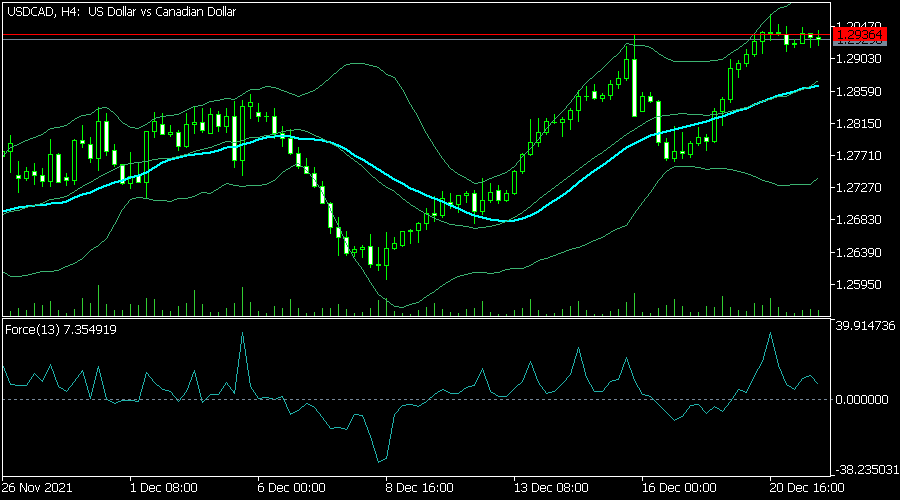
The USDCAD pair is trading at 1.2928, which is a few pips below Tuesday’s high of 1.2965. On the four-hour chart, the pair is at an important level since this price is along the highest level on December 15th. The pair has formed a deep cup and handle pattern. The price is above the 25-day moving average. It is also slightly below the upper side of the Bollinger Bands while the force index is above the neutral level. Therefore, the pair will likely keep rising as bulls target the key resistance at 1.300.
EURUSD
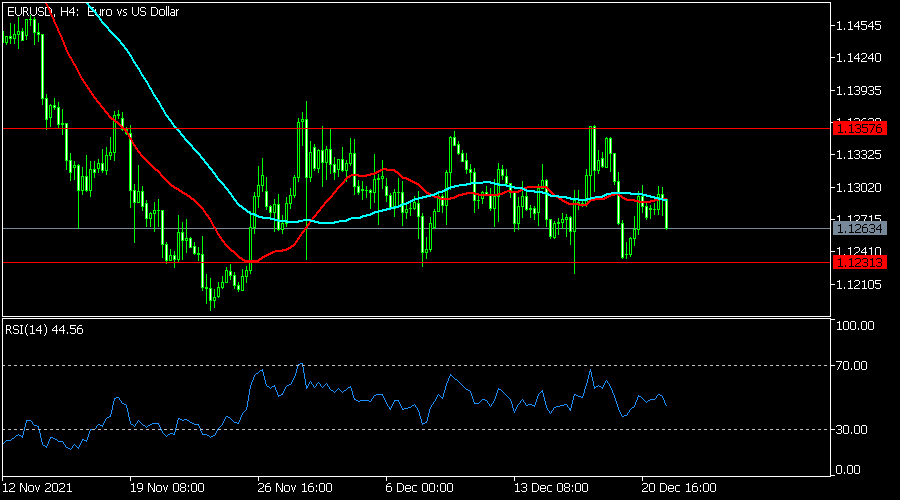
The EURUSD pair declined to a low of 1.1270, which is slightly below this week’s high of 1.1300. The pair has moved slightly below the 25-day and 50-day moving averages. It has also formed a rectangle pattern that is shown in red. The Relative Strength Index (RSI) has moved to the neutral level of 50. Therefore, the pair will likely retest the lower side of the rectangle at 1.1230 after the latest consumer confidence data.
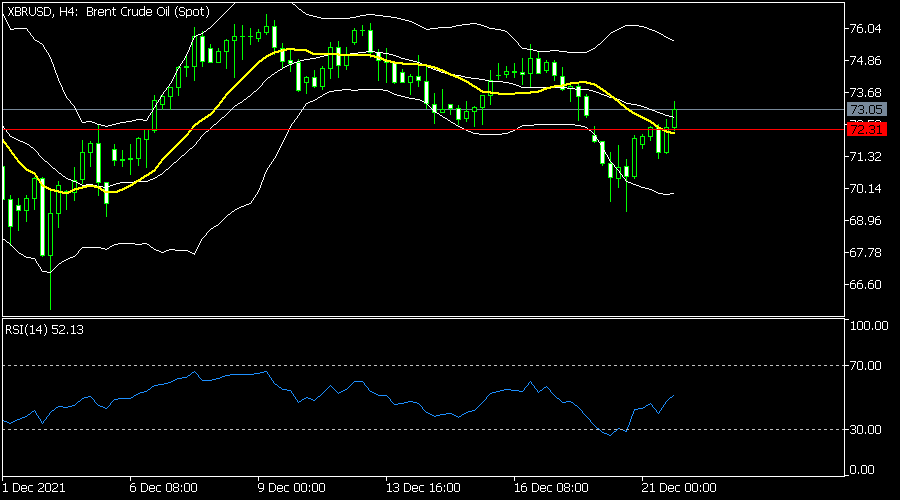
XBRUSD
The XBRUSD pair rose to a high of 73, which was the highest level since December 17. The pair moved slightly above the 25-day moving average. It also moved slightly above the middle line of the Bollinger Bands while the Relative Strength Index (RSI) has been rising. Therefore, the pair will likely keep rising as bulls target the upper side of the Bollinger Bands.
ECB Schnabel: A weak Q4 to spillover to beginning of next year
ECB Executive Board member Isabel Schnabel said in an interview, "in general, I think the recovery continues". But due to new wave of infections, "we are seeing headwinds in the short term". ECB is looking at a "weaker fourth quarter" which is "likely to spill over to the beginning of next year". But she expected "a strong rebound thereafter". So, "we see the recovery as being delayed rather than derailed."
She added that the factors that pushed up inflation are "likely to either reverse or at least become less pronounced over the coming year", including supply bottlenecks, energy prices and base effects. Inflation is going to "decline over the course of next year", but ECB is "less certain about how fast and how strong the decline will be".
Schnabel also said ECB is taking a "step-by-step approach to normalization" of monetary policy". The pace can be adjusted to the incoming data. And, "we need to retain optionality to make sure that we sustainably reach our 2% target."