Sample Category Title
The Analytical Overview Of The Main Currency Pairs
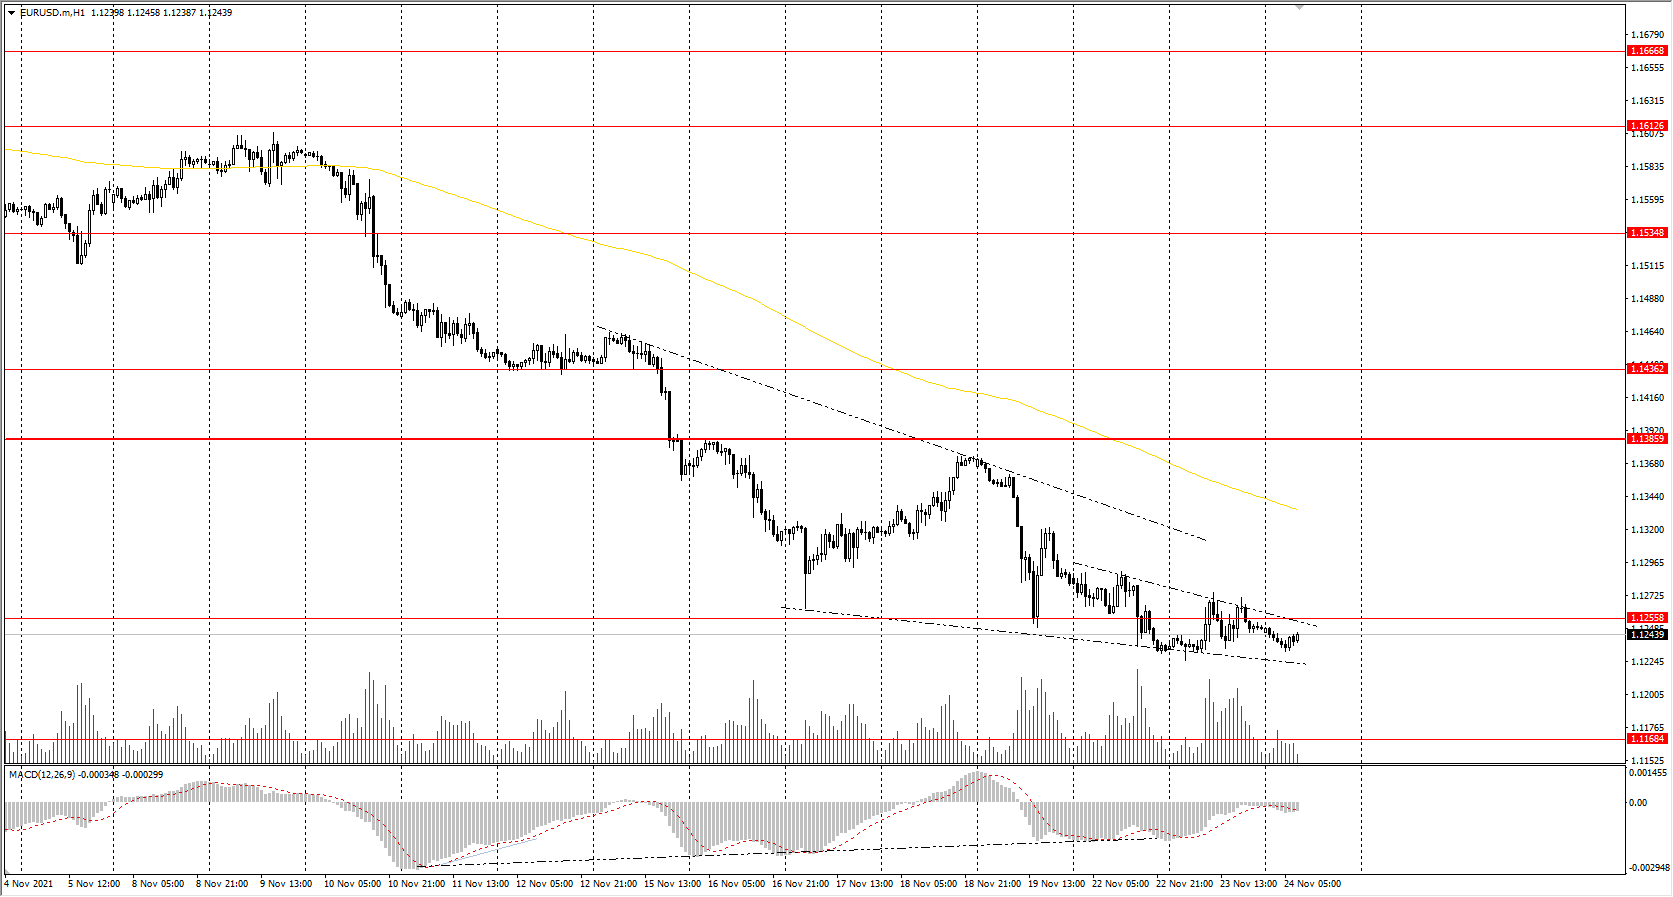
The EUR/USD currency pair
Technical indicators of the currency pair:
Prev Open: 1.1234
Prev Close: 1.1248
% chg. over the last day: +0.12%
Europe continues to face power shortages in the region. Electricity prices in some countries are approaching historic highs. The business activity index in Europe increased unexpectedly, which was a surprise to analysts who had expected a slowdown in activity, especially in the manufacturing sector. However, there are no fundamental reasons for the euro to rise now as the ECB continues to print money actively.
Trading recommendations
Support levels: 1.1256, 1.1168
Resistance levels: 1.1386, 1.1436, 1.1535, 1.1613, 1.1667, 1.1717
From a technical point of view, the EUR/USD pair is bearish on the hour time frame. The Euro continues to show weakness, but the price is narrowing in a triangle, suggesting an impulsive movement. The MACD indicator has become inactive, but there are signs of divergence at several time frames, so traders should expect a technical rebound. Under such market conditions, traders should consider sell positions from the resistance levels near the moving average since the price has deviated strongly from the averages. Buy trades should be considered only from the support levels of the higher time frame, given the buyers’ initiative, but only with short targets.
Alternative scenario: if the price breaks out through the 1.1386 resistance level and fixes above, the mid-term uptrend will likely resume.
News feed for 2021.11.24:
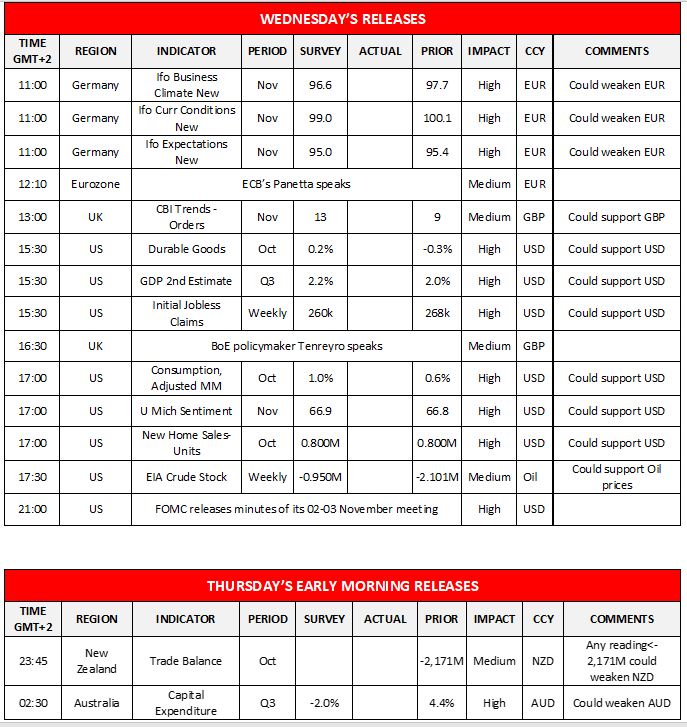
- German Ifo Business Climate (m/m) at 11:00 (GMT+2);
- US Prelim GDP (q/q) at 15:30 (GMT+2);
- US Core Durable Goods Orders (m/m) at 15:30 (GMT+2);
- US Initial Jobless Claims (w/w) at 15:30 (GMT+2);
- US PCE price index (m/m) at 17:00 (GMT+2);
- US New Home Sales (m/m) at 17:00 (GMT+2);
- US Michigan Consumer Sentiment (m/m) at 17:00 (GMT+2);
- US FOMC Meeting Minutes at 21:00 (GMT+2).
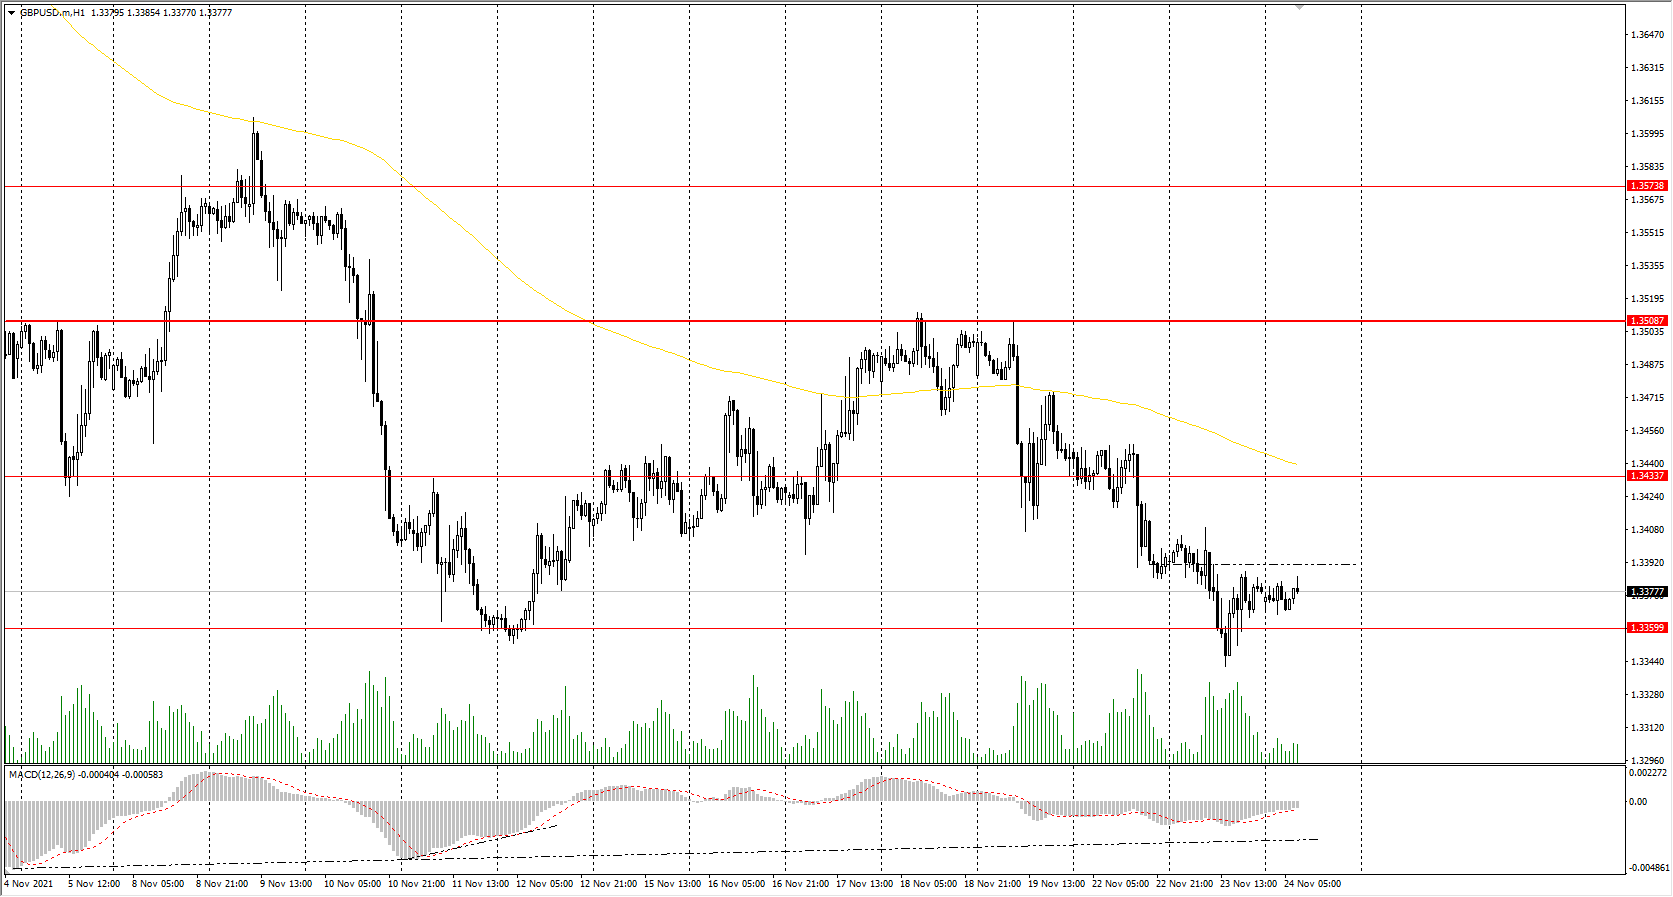
The GBP/USD currency pair
Technical indicators of the currency pair:
Prev Open: 1.3392
Prev Close: 1.3378
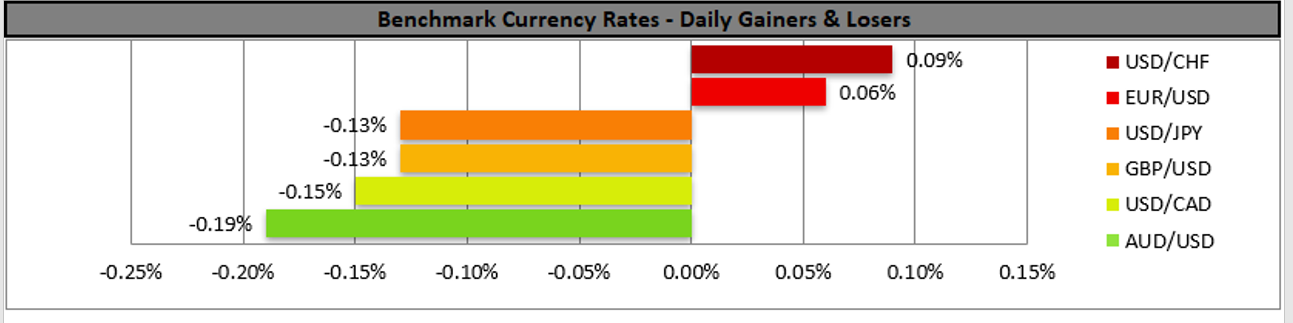
% chg. over the last day: -0.10%
In the UK, there is an increase in business activity. Data for October showed an increase in the manufacturing sector, while in the services sector, the data was negative. With expectations of an interest rate hike from the Bank of England, the British pound might be strengthened soon.
Trading recommendations
Support levels: 1.3360
Resistance levels: 1.3434, 1.3507, 1.3575, 1.3685, 1.3748
On the hourly time frame, the trend on GBP/USD is bearish. The MACD indicator has become inactive. The currency pair has formed a clear flat corridor with the range of 1.3360-1.3508. Under such market conditions, traders should consider sell positions from the upper border of the range. Buy trades should be considered only from the lower border of the range, given the buyers’ initiative.
Alternative scenario: if the price breaks out through the 1.3507 resistance level and consolidates above, the bullish scenario will likely resume.
The USD/JPY currency pair
Technical indicators of the currency pair:
Prev Open: 114.87
Prev Close: 115.12
% chg. over the last day: +0.22%
Japan's business activity index showed an improvement for October. The lifting of the restrictions has already been reflected in the economic data more than a month ago. The economic situation in Japan will improve slowly. However, the JPY will be losing its position against the USD because the Bank of Japan does not plan to cut its stimulus program at the moment.
Trading recommendations
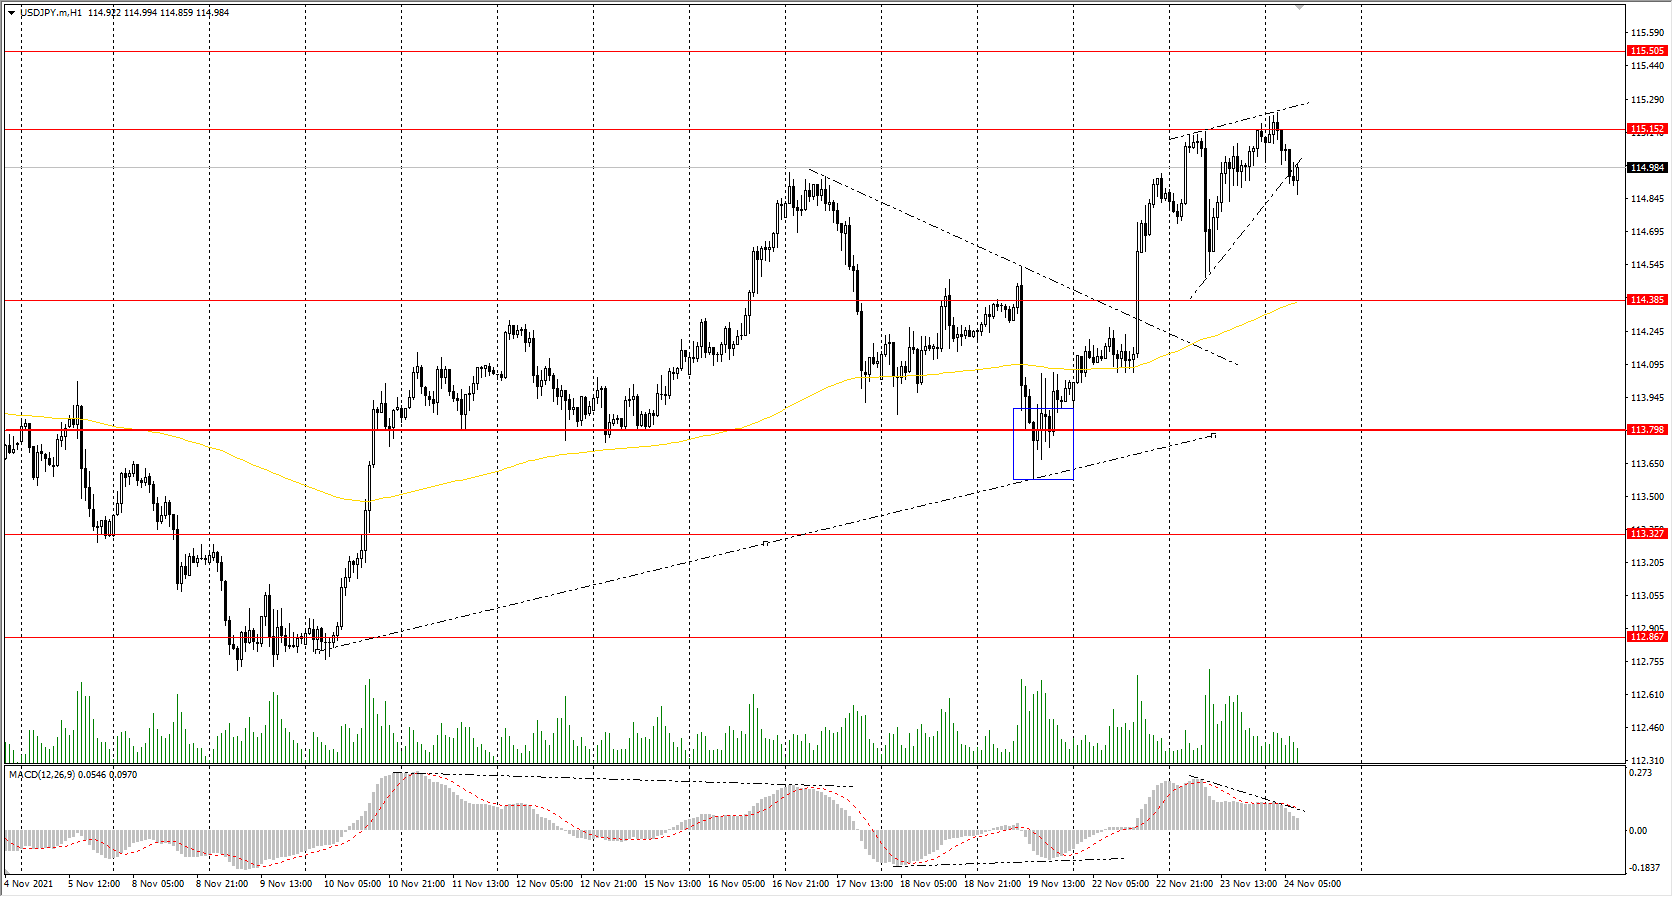
Support levels: 114.38, 113.79, 113.32, 112.87, 112.30
Resistance levels: 115.15, 115.50
The global trend on the USD/JPY currency pair is bullish. The MACD indicator is positive, but there are the first signs of divergence. Under such market conditions, it’s better to look for buy positions from the buyers' initiative zone near the moving average. Sell positions should be considered from the resistance levels of higher time frames, given there is sellers' initiative, but only with short targets.
Alternative scenario: if the price falls below 113.79, the uptrend will likely be broken.
News feed for 2021.11.24:
- Japan Manufacturing PMI (m/m) at 02:30 (GMT+2);
The USD/CAD currency pair
Technical indicators of the currency pair:
Prev Open: 1.2698
Prev Close: 1.2668
% chg. over the last day: -0.23%
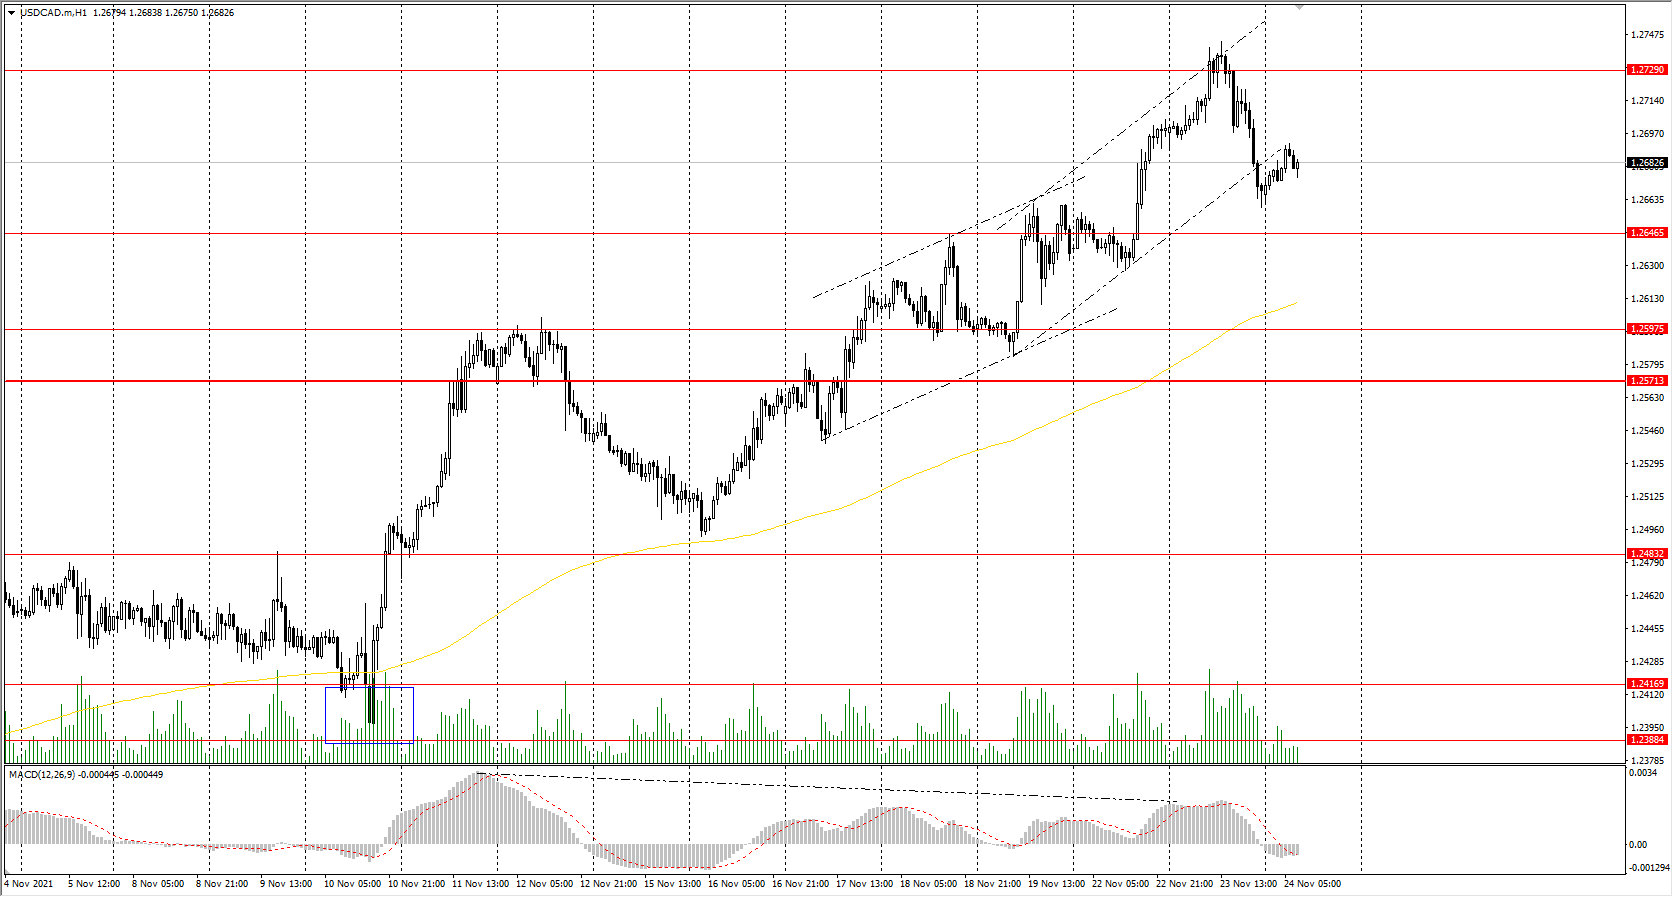
The Canadian dollar is a commodity currency, so the USD/CAD currency pair highly depends on the dynamics of the dollar index and oil prices. Yesterday, the dollar index was trading in a narrow range, while the oil prices increased by more than 3%, despite the possible oil reserves released by the USA, Japan, China, and India. As a result, the USD/CAD currency pair increased due to the strengthening of the Canadian dollar.
Trading recommendations
Support levels: 1.2646, 1.2598, 1.2571, 1.2483, 1.2416, 1.2388
Resistance levels: 1.2729
From a technical point of view, the trend of the USD/CAD currency is bullish. The MACD indicator has become inactive. There are signs of divergence on several time frames while indicating a weakness of buyers. Under such market conditions, it is better to look for buy trades from the support levels near the moving average since the price has strongly deviated from the average values. Sell deals should be considered from the resistance levels of the higher time frames.
Alternative scenario: if the price breaks down through the 1.2571 support level and fixes below, the downtrend will likely resume.
News feed for 2021.11.24:
- US Crude Oil Reserves (w/w) at 17:30 (GMT+2).
Mixed Signals Ahead Of FOMC Minutes Release
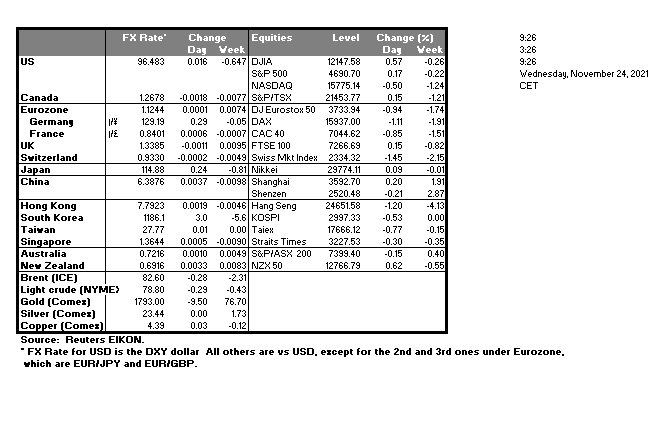
The USD seemed to stabilise against a number of its counterparts yesterday albeit there are still some bullish tendencies present, as the market today is about to get the minutes of FOMC November meeting. The Fed’s intentions are still a hot topic for the market and we expect the document to be closely scrutinised by investors and analysts. Fed officials in recent statements seemed to lean towards the hawkish side last week and market expectations seemed to rise. Should the document verify a more hawkish approach by a number of policymakers, we may see the USD gaining and vice versa. At the same time we would also note the slew of data we get from the US today as the durable goods rate for October, the weekly initial jobless claims figure, the consumption rate for October, the final University of Michigan consumer confidence for November, and October’s number of new home sales are due out, yet the high impact release of the day could be the 2nd estimate of the US GDP rate for Q3. All of the above combined into one trading day could create substantial volatility for the USD as well as US stock markets and Gold. It should be noted that gold’s prices were also under pressure due to the rising US yields. The same also seemed to apply on the tech sensitive Nasdaq, thus the movement of the US yields should also be kept under watch today.
XAU/USD dropped yesterday testing the 1786 (S1) support line before correcting a bit higher. We tend to maintain our bearish sentiment for the precious metal given also that the RSI indicator below our 4-hour chart is below the reading of 30, confirming the bearish sentiment of the market for Gold, yet may also imply that the precious metal is at oversold levels and the correction higher could be extended. Should the selling interest be renewed for the precious metal, we may see it breaking the 1786 (S1) support line and aim for the 1768 (S2) level. Should the correction higher be extended and buyers gain traction, we may see gold’s price reaching if not breaking the 1808 (R1) resistance line in search of higher grounds.
Oil rises as US prepares for reserve release
Oil prices tended to rise yesterday as the US announced its intentions to tap its emergency reserves in order to tackle rising oil prices. It should be noted that the move was made in a period that the average US consumer pays multi-year high prices according to media. At the same time India also announced its intentions to release a part of its reserves at a number of 5 million barrels. Overall, these moves are aimed at countering the tight supply for the commodity by petroleum producing countries cartel OPEC, which includes Saudi Arabia and Russia. The move by the US though may prove not to be a game changer for the international oil market according to analysts as OPEC may slow its production rate even further, which may have instigated the rise of oil prices yesterday. At the same time, we note the release of the weekly EIA crude oil inventories figure in the American session later today for oil traders and should another substantial drawdown be reported we may see oil prices gaining further.
WTI prices rose yesterday breaking the 76.60 (S1) resistance line, now turned to support. In their upward movement WTI’s prices also broke the downward trendline guiding it since the 10th of November hence we switch our bearish outlook in favor of a bias movement currently. Should the bears regain the momentum we may see the commodity’s price dropping breaking the 76.60 (S1) support line and aim for the 73.45 (S2) level. Should the bulls take over and extend yesterday’s rise, we may see the commodity’s price breaking the 79.00 (R1) resistance line and aim for the 82.00 (R2) level.
Other market highlights for today
Besides the US releases mentioned earlier we also note Germany’s Ifo indicators and UK’s CBI industrial trends both for November. In tomorrow’s Asian session we get New Zealand’s Trade data for October and Australia’s Capital Expenditure for Q3.
XAU/USD H4 Chart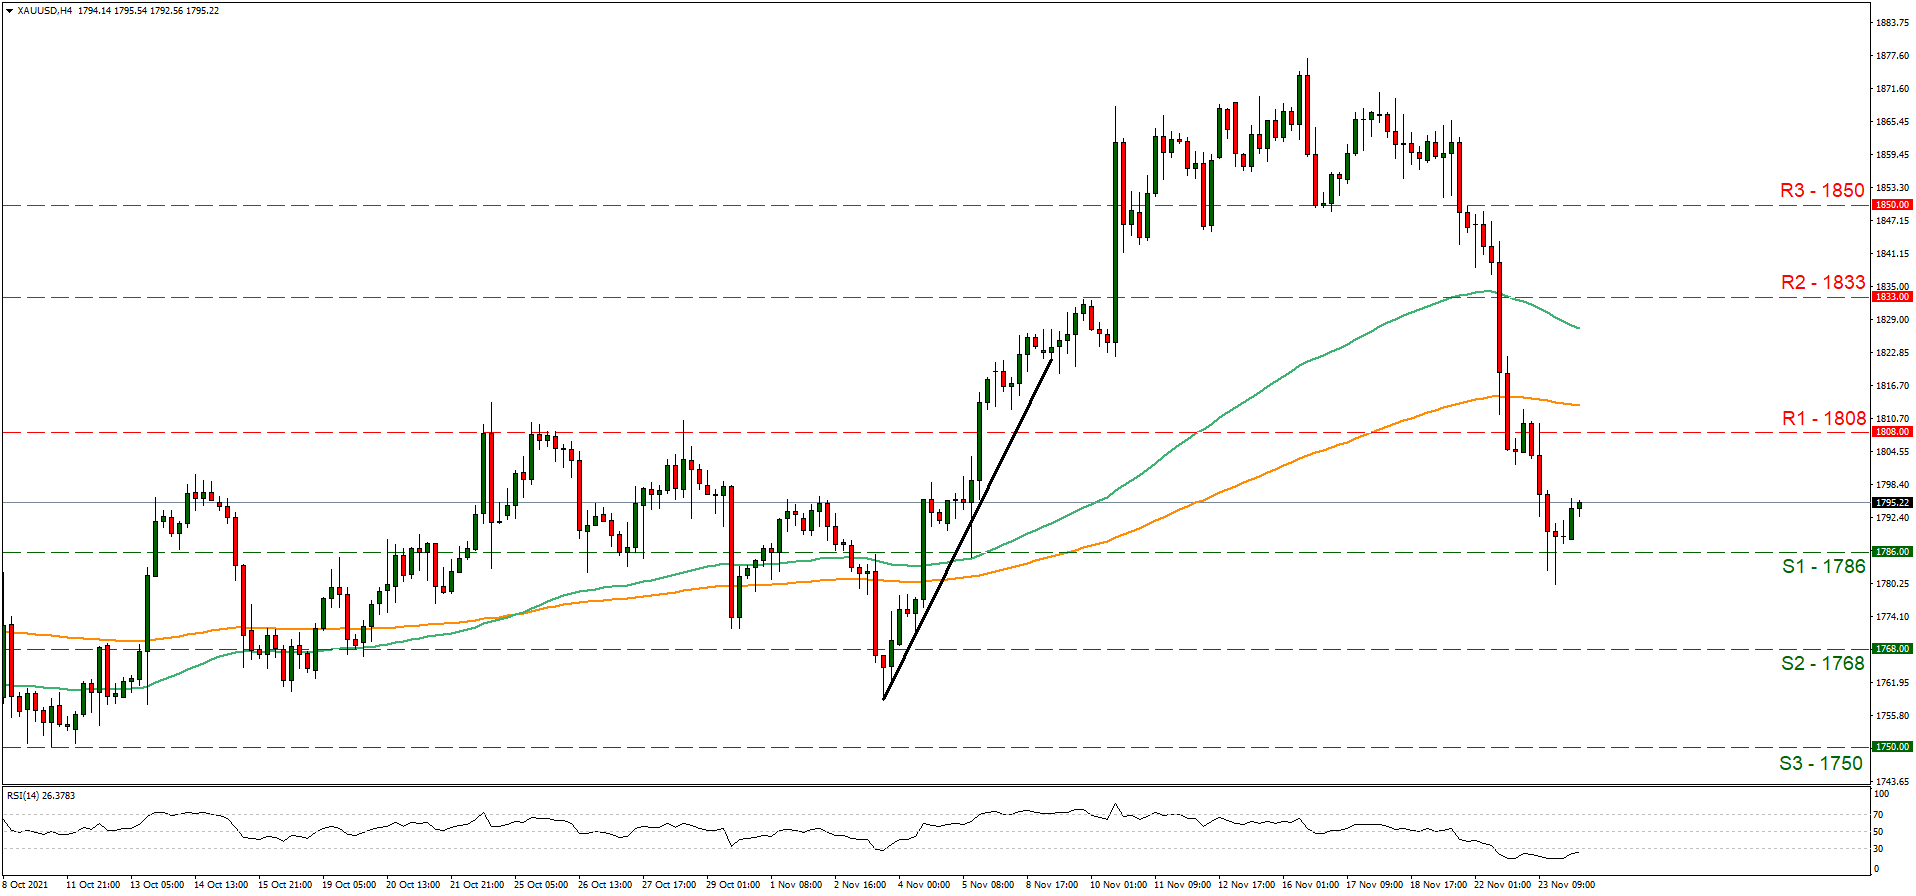
Support: 1786 (S1), 1768 (S2), 1750 (S3)
Resistance: 1808 (R1), 1833 (R2), 1850 (R3)
WTI H4 Chart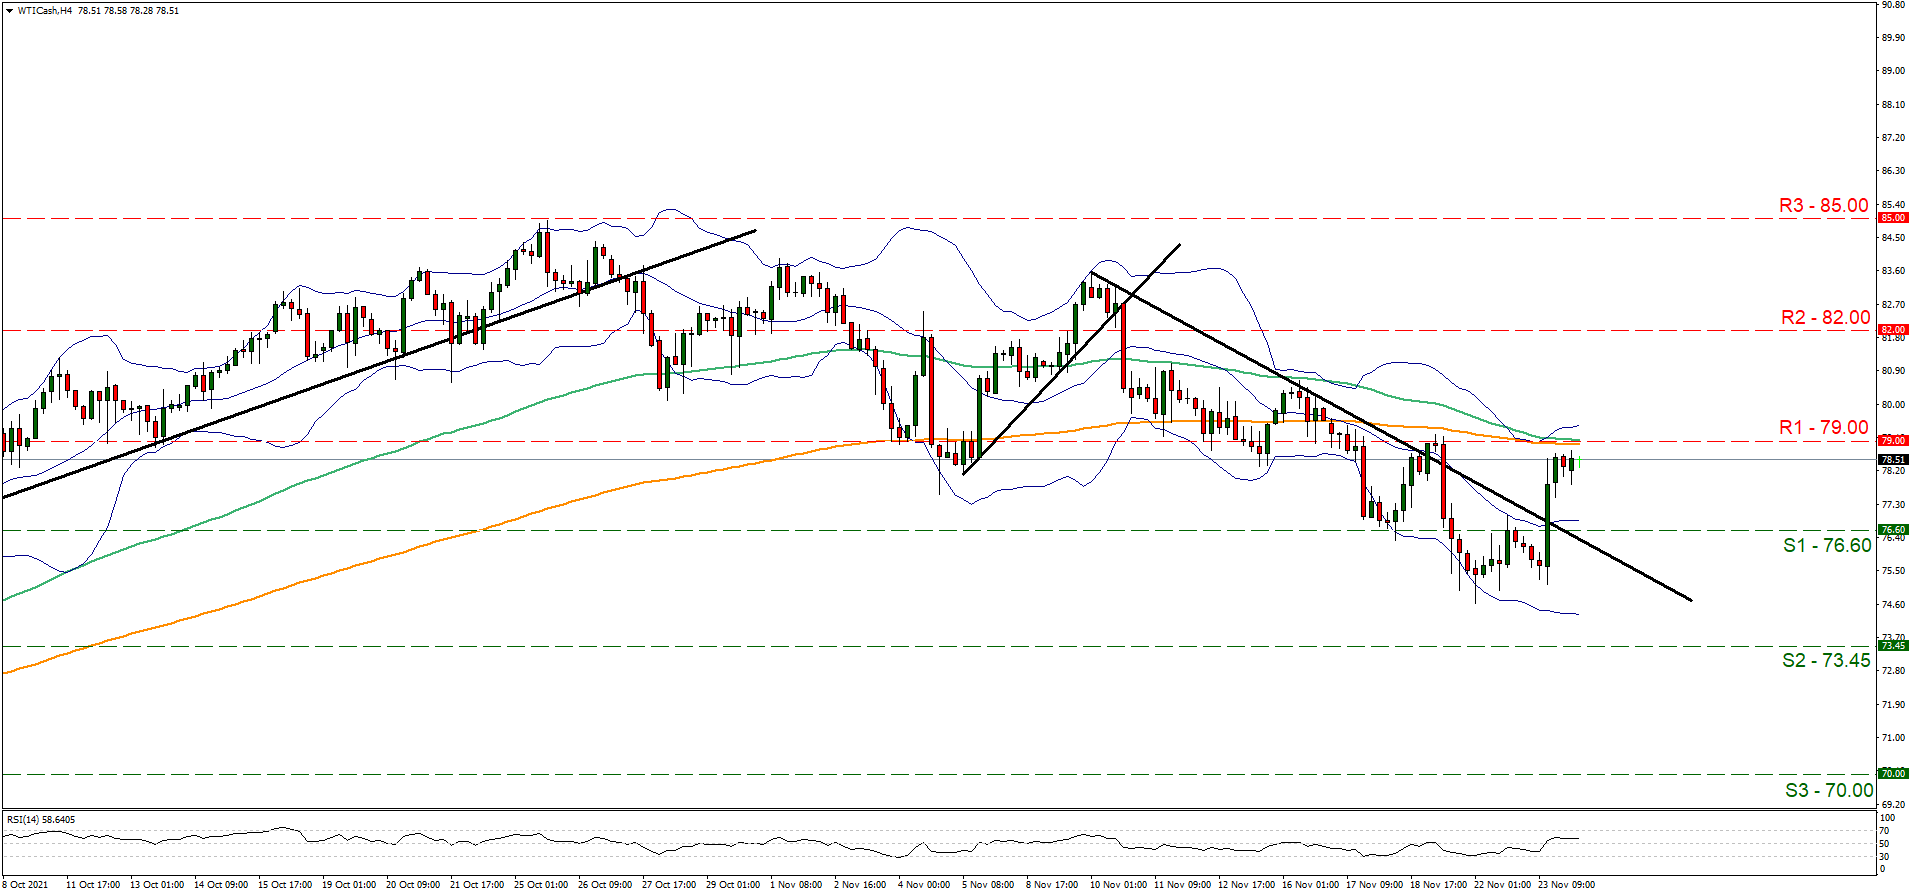
Support: 76.60 (S1), 73.45 (S2), 70.00 (S3)
Resistance: 79.00 (R1), 82.00 (R2), 85.00 (R3)
USDJPY Inches Up To Fresh 4½-Year High, Next Target At 115.50
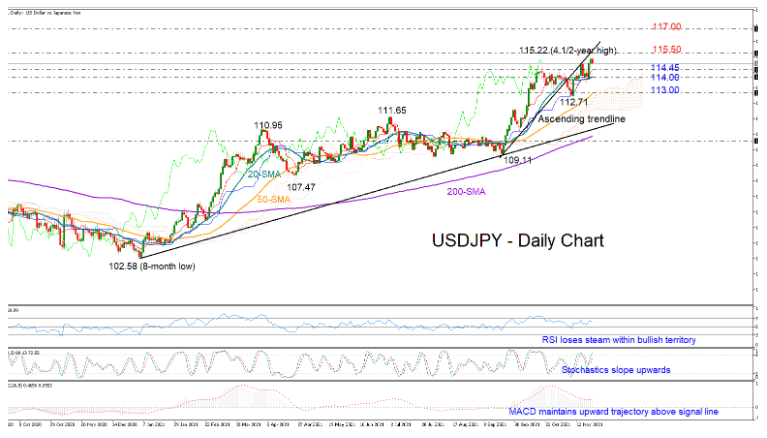
USDJPY ticked to a fresh 4½-year high of 115.22 early on Wednesday before easing slightly below the 115.00 level again.
Previously, the price strengthened its bullish bias by bouncing forcefully near the 114.00 number and the 20-day simple moving average (SMA). Currently, the RSI is losing some momentum, indicating weakening buying pressures, though as long as it remains above its 50 neutral mark, the bulls may have new opportunities to drive the market higher. Note that the red Tenkan-sen line keeps pointing upwards above the blue Kijun-sen line, while the positive trajectory in the MACD is another encouraging sign that bullish forces may re-emerge in the short term.
However, the 115.50 area could prove to be a hurdle on the way up. This is where the pair stalled in early 2017, while the presence of the support-turned-resistance trendline is adding more importance to the region, increasing the case for a sharp rally towards the next barrier of 117.00 if the bulls indeed breach the wall around 115.50.
Otherwise, should sellers dominate, the red Tenkan-sen line and the 20-day SMA could immediately support the market within the 114.45 – 114.00 zone. If not, the decline could extend towards the 50-day SMA and the previous low of 112.71. Any close lower from here would put September’s upleg into question, downgrading the short-term outlook to neutral.
In brief, USDJPY seems to have more bullish fuel in the tank, though whether this will be enough to overcome the 115.50 bar remains to be seen.
GBP/USD Outlook: Limited Correction May Precede Bearish Continuation
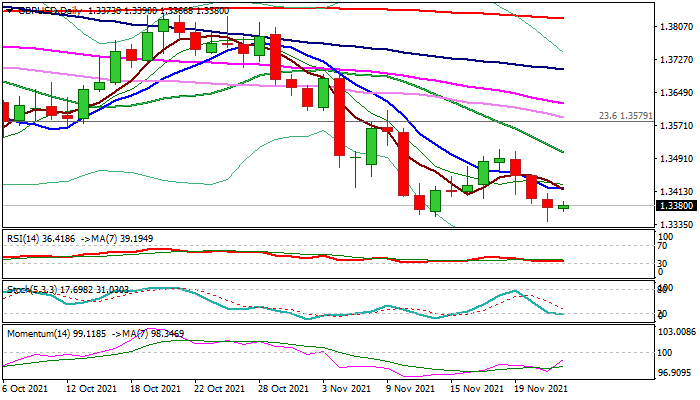
Cable is trading within a narrow range in early Wednesday after hitting new 2021 low (1.3342) on Tuesday but failing to sustain break below previous low of Nov 12 (1.3353).
Overall structure remains bearish but long tail of Tuesday’s candle, accompanied with fading negative momentum and oversold stochastic on daily chart, suggest that bears may take a breather before larger downtrend resumes.
Initial resistance lays at 1.3420 (converged 5/10DMA, attempting to form a bear-cross) with extended upticks expected to remain below 1.3500 zone (Nov 18 lower top / falling 20DMA) to keep bears in play for extension towards 1.3288 (100WMA) and more significant support at 1.3164 (Fibo 38.2% of 1.1409/1.4249/200WMA).
Caution on firm break of 1.3500 zone that would confirm a double bottom and generate reversal signal.
Traders focus on release of US data (weekly jobless claims, Q3 GDP estimation, durable goods orders and FOMC minutes) which would provide some signals, but also consider a lower volume on Thursday as the US will be shut for a Thanksgiving Day.
Res: 1.3400, 1.3420, 1.3454, 1.3513.
Sup: 1.3342, 1.3288, 1.3200, 1.3164.
UK Oil Bounces Back
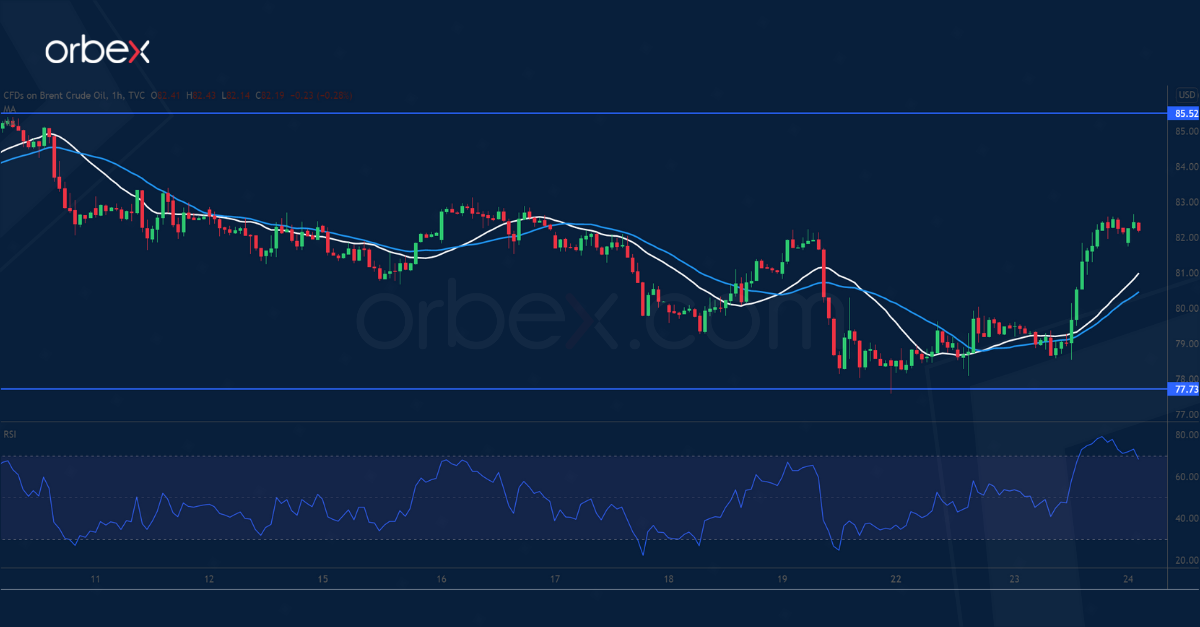
Brent crude recovers on speculation that OPEC+ may lower production to counter a release of strategic reserves.
A break below 79.30 has shaken out the weak hands. The price has met buying interest over the daily demand zone around 77.70, which coincides with last July’s peak. A surge above 82.00 puts the bears on the defensive.
Short-covering would exacerbate short-term volatility. An overbought RSI may cause a brief pullback. Then 85.50 is a key hurdle before the uptrend could resume.
NZD/USD Lacks Support
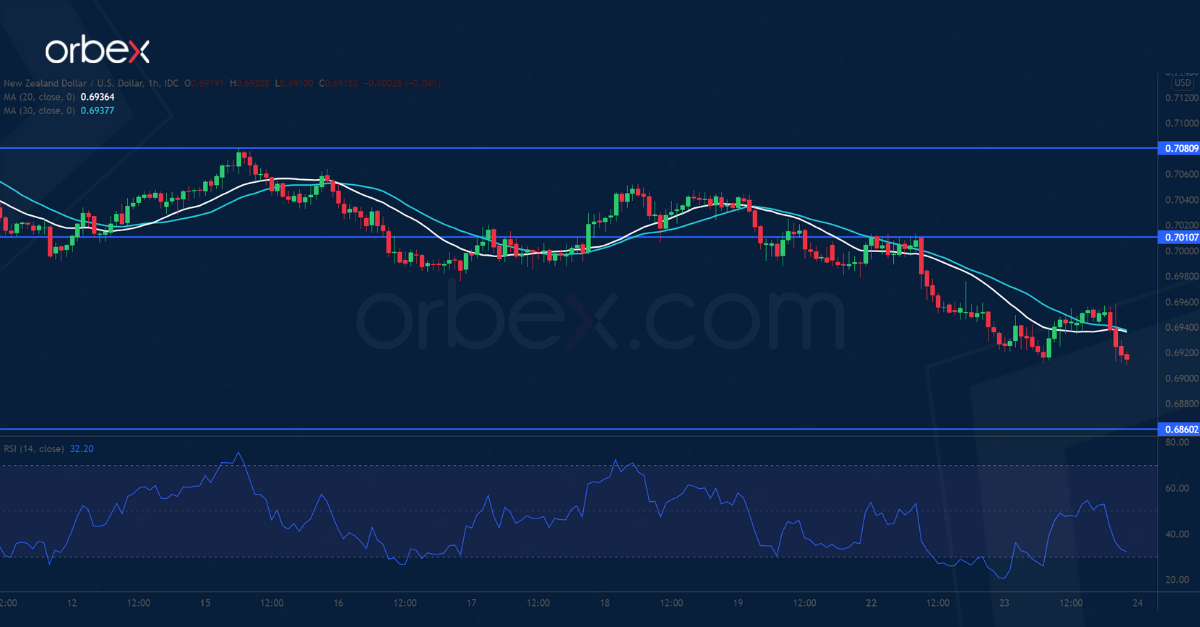
The New Zealand dollar softened after the RBNZ met market expectations and raised its cash rate by 25bps.
The downward pressure has increased after 0.6980 failed to contain the sell-off. The pair has given up all gains from the October rally, suggesting a lack of interest in bidding up the kiwi.
An oversold RSI caused a rebound as short-term traders took profit and the bears were swift in selling into strength. The directional bias remains bearish unless 0.7010 is cleared. The September low at 0.6860 is the next support.
EUR/USD Struggles To Rebound
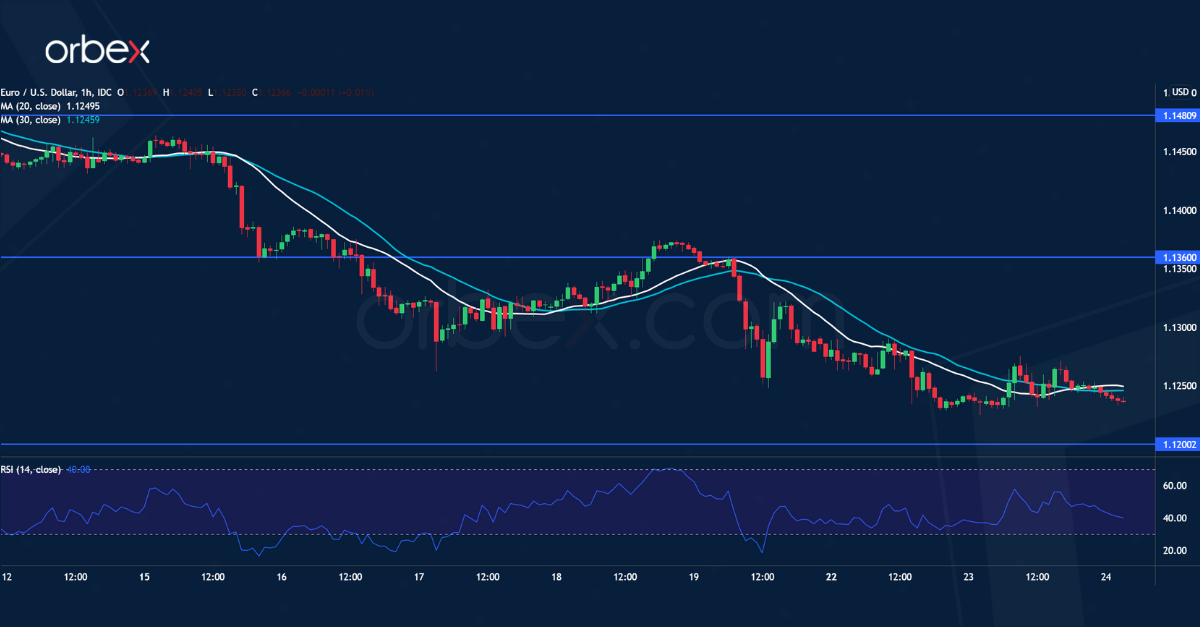
The euro bounced back after PMI readings in the eurozone exceeded expectations. The pair is testing July 2020’s lows around 1.1200.
The RSI’s oversold situation on the daily chart may limit the downward pressure for now. We can expect a ‘buying-the-dips’ crowd as price action stabilizes. Sentiment remains fragile though and sellers may fade the next rebound.
The bulls will need to lift 1.1360 before a reversal could take shape. Failing that, a bearish breakout would trigger a new round of sell-off towards 1.1100.
Markets Await Pre-Thanksgiving Data Dump
- Fed policy outlook remains primary focus for markets.
- Traders looking to FOMC minutes, US data to support hawkish narrative.
- Oil could climb higher on US stockpiles drawdown, OPEC+ pause.
Asian stocks are mixed and US equity futures are little changed, while the benchmark dollar index is holding around its highest level since July 2020. The strong greenback has dragged gold prices back below the psychologically important $1800 mark.
Market participants are fixated on the outlook for US interest rates, with Fed Funds futures now pointing to three hikes in 2022, with the first one priced in the June FOMC meeting. That’s a more aggressive policy tightening cycle compared to what was being priced in just after the September meeting when the futures market and six FOMC members expected just one rate hike next year.
Near-term market sentiment is set to be dominated by the obsession over how persistently higher inflation could affect the timing of the Fed’s policy adjustments, and this will frame today’s release of the November FOMC meeting minutes. Fresh hawkish signals could push the dollar and yields higher, in turn potentially prompting tech stocks and gold to shed more of their gains from recent months.
It appears that markets are already pre-empting potential outcomes from the December FOMC meeting, with traders believing they may see the Fed signal a faster pace to the ongoing tapering, or a more hawkish shift on the Fed’s dot plot; perhaps even both. Still, such expectations would have to be supported by the data, with global investors set to digest a slew of US economic releases later today. This pre-Thanksgiving data deluge, which includes the core PCE data, US durable goods and weekly initial claims, could also trigger more volatility across various asset classes, as markets shift their expectations in line with the latest readings on the US economy.
Oil extends rebound on underwhelming strategic reserves release
Brent and WTI futures are building on Tuesday’s surge, with oil bulls taking comfort in the lower-than-expected number of barrels being released from strategic reserves of major economies, including the US, China and India. Prices could get another boost later Wednesday if the EIA confirms a larger-than-expected drawdown in US inventories, though the whisper number points to a meeker 669k barrel drop in contrast to the 1.8million barrel median estimate.
The bigger risk event for oil markets could be next week’s OPEC+ meeting, and whether prices can mount another charge towards the multi-year highs seen in late October. Oil bulls could be on the rampage if OPEC+ responds to this coordinated release of reserves by halting its own plans for restoring output. Such a move would also dent expectations for markets to shift back into oversupplied conditions by next quarter, which would buffer support for prices as well.
Daily Technical Analysis
EUR/USD
Current level - 1.1234
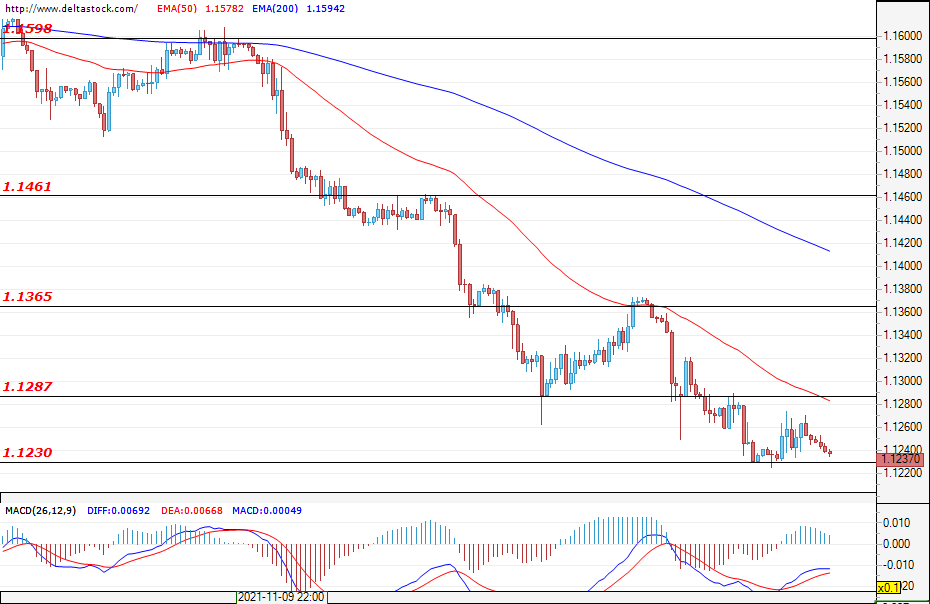
The Greenback continues to dominate other major currencies and, in the early hours of today, the euro erased yesterday's modest gains. The market still seems overstretched and its initial reaction to the news regarding Jerome Powell's second term seemed exaggerated. In case the 1.1230 support lasts, a deeper retracement is possible. The resistance at 1.1287 is expected to be tested and probably breached. The correction should then be limited to 1.1365, from which a new push on the negative front can be expected. Due to the shorter trading week in the U.S., an avalanche of news is expected today, with the most significant impact being the data on the GDP and the initial weekly jobless claims (13:30 GMT), as well as the new home sales (15:00 GMT). If the data supports the bearish sentiment, the pair could sink towards 1.1180.
| Resistance | Support | ||
| intraday | intraweek | intraday | intraweek |
| 1.1287 | 1.1460 | 1.1230 | 1.1125 |
| 1.1365 | 1.1517 | 1.1180 | 1.1060 |
USD/JPY
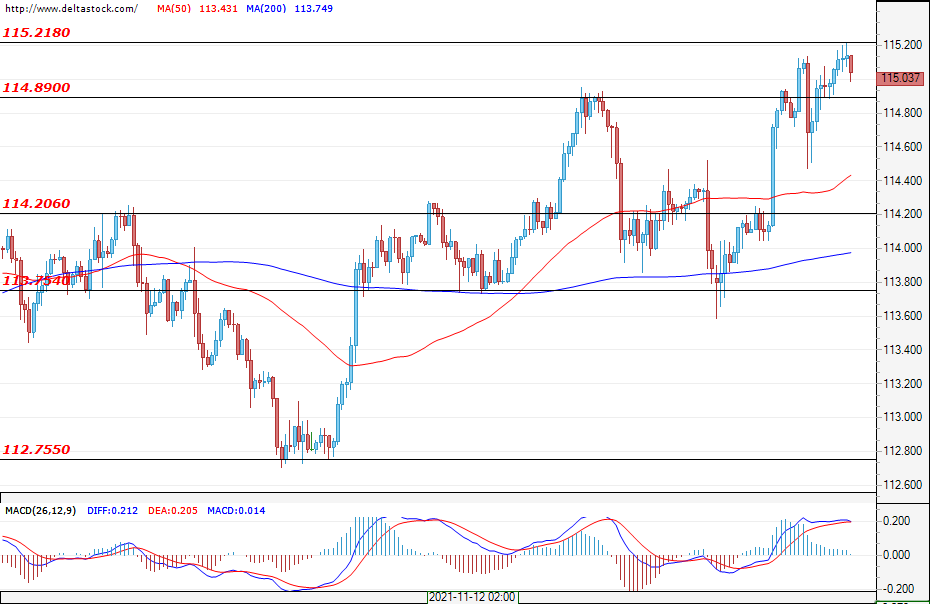
Current level - 115.06
The Ninja is trading above 115.00 again, but the bulls’ behaviour seems uncertain at these market levels. The expectations are rather neutral, with the market likely to enter a new range between the resistance at 115.20 and the support at 114.20. The bulls can expect their first local support at 114.90 and a more solid one at 114.20. A breach above 115.20 would provoke a new rally and a potential target for the bulls could be the area at around 116.50 - 117.00.
| Resistance | Support | ||
| intraday | intraweek | intraday | intraweek |
| 115.50 | 115.50 | 114.40 | 113.40 |
| 117.00 | 117.00 | 113.40 | 112.75 |
GBP/USD
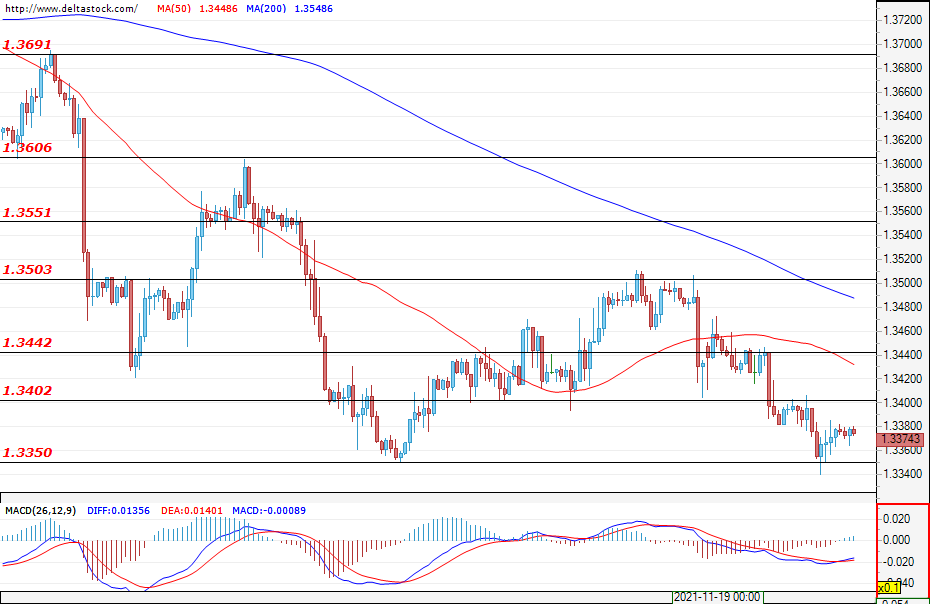
Current level - 1.3387
The Sterling marked a series of losses again, which currently remain above the support of 1.3350. The zones at 1.3400 and 1.3440 have been breached several times in both directions and cannot be considered as particularly reliable. It is likely that the bulls will try to form a double bottom аt the support of 1.3350. In such a scenario, a deep correction with a strong movement targeting the areas above 1.3500 can be expected. To validate the model, a new failed bearish attempt at attacking the area above 1.3500 is needed. If the bears end up prevailing instead, then the expected scenario is for a breach of 1.3350.
| Resistance | Support | ||
| intraday | intraweek | intraday | intraweek |
| 1.3400 | 1.3500 | 1.3350 | 1.3200 |
| 1.3440 | 1.3550 | 1.3350 | 1.3060 |
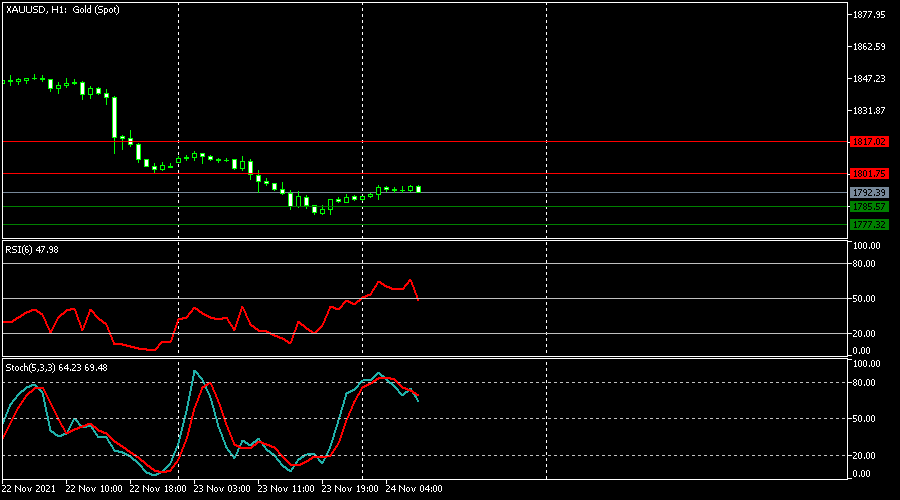
XAUUSD Is Possibly Bearish
Technical analysis
The RSI is above level 50 and headed downwards.
The Stochastics left the overbought zone and headed downwards to level 50.
Most likely scenario – SELL
Target prices: 1,785.57 1,777.32
Alternative scenario – BUY
Target prices: 1,801.75 1,817.02
Key levels
Support 1,785.57 1,777.32
Resistance 1,801.75 1,817.02