Sample Category Title
Investment Banks Believe In The Continuation Of The Bullish Trend In The Stock Market
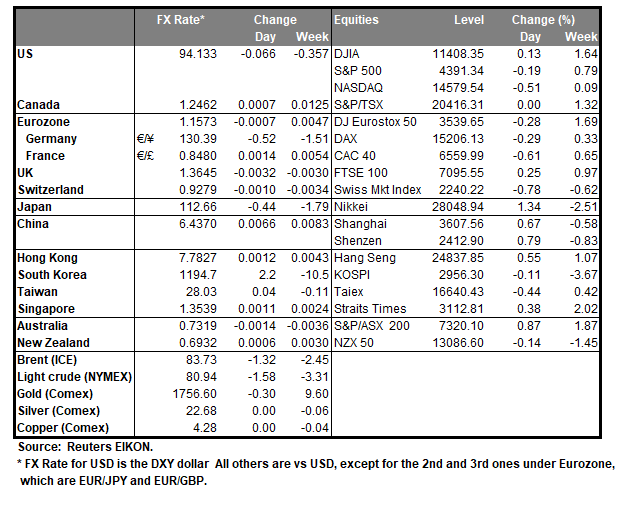
Last week, investors’ main focus was on US nonfarm payrolls data. The labor market statistics were disappointing. The US economy added only 194,000 jobs in September (490,000 expected). But despite such data, analysts are still confident that the Fed will start to reduce the quantitative easing (QE) program in November. Otherwise, the surge in inflation may just stop economic growth, which is already slowing down, and the decline in consumer expectations indicates that the US economy is in recession now. Treasury bond yields increased on Friday, with 10-year and 30-year notes reaching their highest levels since June, suggesting that funds and investors have concluded that the Federal Reserve’s schedule of asset purchases will probably not change, despite the weak labor market statistics. By Friday’s close, the S&P 500 index decreased by 0.19% (for the week +0.98%), the Dow Jones index decreased by 0.03% (for the week +1.26%), and the Nasdaq index lost 0.51% (for the week +0.6%).
White House officials say China produces more steel per month than the US does in a year and spends three times as much on infrastructure as the US, so a bipartisan infrastructure deal would allow investment in modernizing the country’s physical infrastructure.
Southwest Airlines canceled more than 1,000 flights (27% of its schedule) on Sunday because of air traffic control problems and bad weather.
European stock indices traded flat on Friday. The British FTSE 100 increased by 0.25% (+0.97% for the week), the German DAX decreased by 0.29% (+0.96% for the week), the French CAC 40 decreased by 0.61% (+1.16% for the week), the Spanish IBEX 35 lost 0.09% (+1.76% for the week), and Italian FTSE MIB added 0.23% on Friday and finished the week at +2.27%, the best performance among all the stock indices in Europe.
In addition to problems with truck drivers, Britain also faces a pilot shortage, which can prevent the resumption of the travel industry after hundreds of airline crew retired early or changed careers during the pandemic. Britain is working on supporting energy-intensive industries hit by soaring gas prices, Business Minister Kwasi Kwarteng said Sunday, calling the situation critical. Manufacturers of steel, glass, ceramics, paper, and other industries said they could be forced to halt production if the government does nothing about energy prices.
WTI crude oil in the US has reached $80 a barrel for the first time since November 2014. JPMorgan Bank believes that the continued rise in oil prices will not end the bull market in the US, and the market can see oil prices rising to $130-150 a barrel and the 10-year US Treasury bond yields rising to 2.50%.
Amid rising US government bond yields, gold and silver are under selling pressure as these metals are inversely correlated with the dollar index and government bond yields.
Asian stock markets mostly rose at the end of last week. Japan’s Nikkei 225 added 1.34% (-3.43% for the week), China’s CSI 300 increased by 1.31% (+1.21% for the week), Australia’s ASX 200 added 0.87% (+1.87% for the week), and only South Korea’s KOSPI decreased by 0.11% (-3.27% for the week). Exports to China have declined for the first time since August 2020. Over the past 12 months, only 103.9 billion euros worth of goods and services have been exported to China. This may be the first sign that China’s economy is slowing down. Chinese real estate developer Evergrande has already missed 2 weeks of obligation payments and is due to pay nearly $150 million in coupons this week.
Malaysia lifted interstate and international travel restrictions for residents fully vaccinated against COVID-19 as the country reached its goal of vaccinating 90% of the adult population.
Main market quotes:
- S&P 500 (F) 4,391.34 −8.42 (−0.19%)
- Dow Jones 34,746.25 −8.69 (−0.03%)
- DAX 15,206.13 −44.73 (−0.29%)
- FTSE 100 7,095.55 +17.51 (+0.25%)
- USD Index 94.10 −0.11 (−0.12%)
The Analytical Overview Of The Main Currency Pairs
The EUR/USD currency pair
Technical indicators of the currency pair:
Prev Open: 1.1551
Prev Close: 1.1574
% chg. over the last day: +0.20%
Europe may face gas shortages this winter if cold weather exhausts reserves to zero, making the region completely dependent on additional flows from Russia. In turn, some European politicians blame Russia for the low volume of gas stored in the region, which has led to record increases in gas and electricity prices.
Trading recommendations
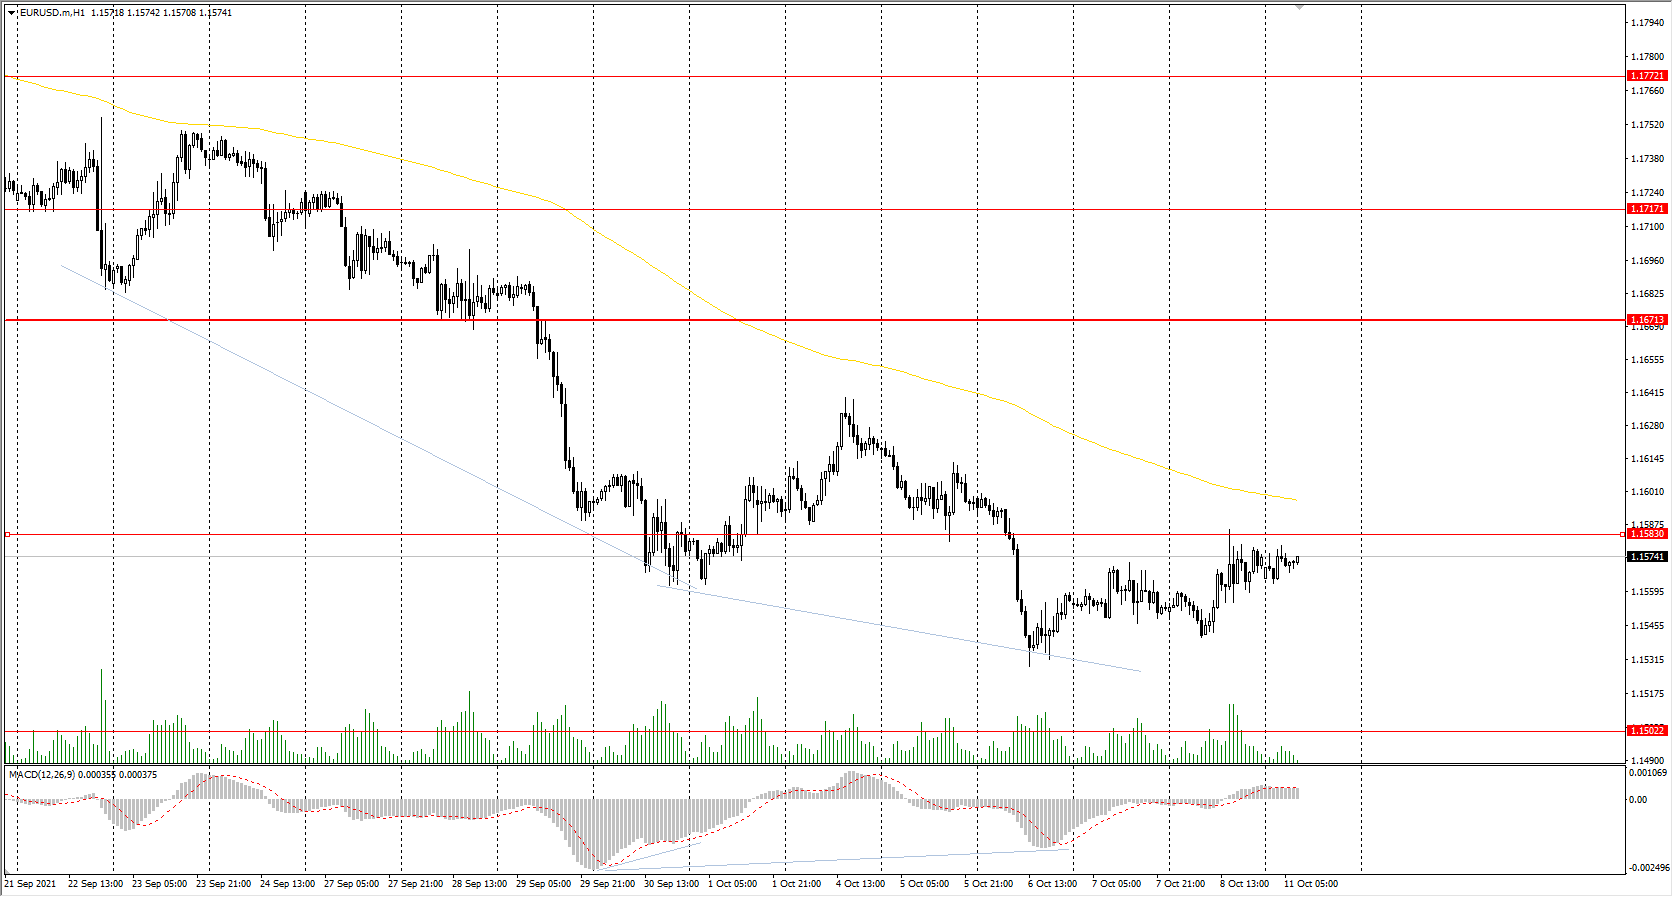
Support levels: 1.1502, 1.1453
Resistance levels: 1.1583, 1.1671, 1.1717, 1.1772, 1.1802, 1.1835
From the technical point of view, the EUR/USD trend is bearish. The MACD has become positive. Under such market conditions, traders should consider sell deals from the resistance levels near the moving average, as the price has deviated from the middle line. Buy trades should be considered only from the support levels with additional confirmation in the form of a buyers' initiative.
Alternative scenario: if the price breaks out through the 1.1671 resistance level and fixes above, the mid-term uptrend will likely resume.
The GBP/USD currency pair
Technical indicators of the currency pair:
Prev Open: 1.3606
Prev Close: 1.3611
% chg. over the last day: +0.04%
In addition to problems with truck drivers, Britain also faces a pilot shortage, which can prevent the resumption of the travel industry after hundreds of airline crew retired or changed careers during the pandemic. Britain's business secretary, Kwasi Kwarteng, says that inflation is a concern, but the country's central bank will do its best to keep it at a moderate level.
Trading recommendations
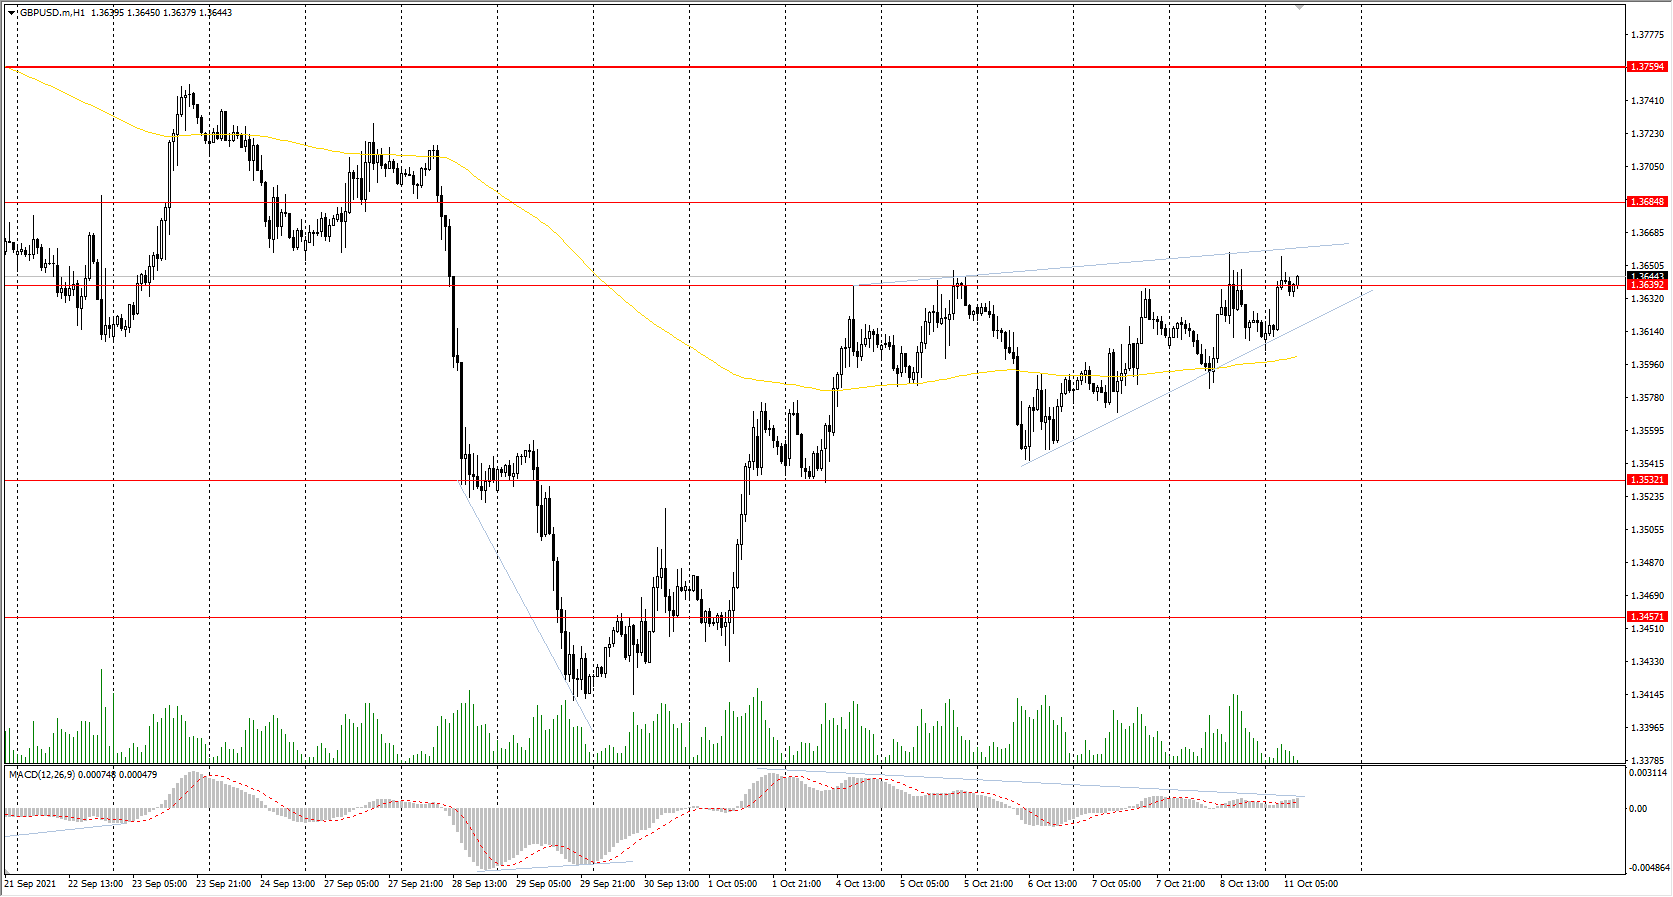
Support levels: 1.3532, 1.3457, 1.3360, 1.3282
Resistance levels: 1.3639, 1.3685, 1.3759, 1.3812, 1.3886
On the hourly time frame, the GBP/USD trend is bearish. But the British currency looks more confident than the euro due to a direct correlation with oil prices. The MACD indicator is in the positive zone but with signs of divergence. There are also signs of narrowing liquidity in the form of a triangle pattern. Buy trades should be considered only within the day and only after the buyer's initiative upward from the triangle. It is best to look for sell trades after the price breaks down the triangle.
Alternative scenario: if the price breaks out through the 1.3759 resistance level and consolidates above, the bullish scenario will likely resume.
The GBP/USD currency pair
Technical indicators of the currency pair:
Prev Open: 1.3606
Prev Close: 1.3611
% chg. over the last day: +0.04%
In addition to problems with truck drivers, Britain also faces a pilot shortage, which can prevent the resumption of the travel industry after hundreds of airline crew retired or changed careers during the pandemic. Britain's business secretary, Kwasi Kwarteng, says that inflation is a concern, but the country's central bank will do its best to keep it at a moderate level.
Trading recommendations
Support levels: 1.3532, 1.3457, 1.3360, 1.3282
Resistance levels: 1.3639, 1.3685, 1.3759, 1.3812, 1.3886
On the hourly time frame, the GBP/USD trend is bearish. But the British currency looks more confident than the euro due to a direct correlation with oil prices. The MACD indicator is in the positive zone but with signs of divergence. There are also signs of narrowing liquidity in the form of a triangle pattern. Buy trades should be considered only within the day and only after the buyer's initiative upward from the triangle. It is best to look for sell trades after the price breaks down the triangle.
Alternative scenario: if the price breaks out through the 1.3759 resistance level and consolidates above, the bullish scenario will likely resume.
The USD/JPY currency pair
Technical indicators of the currency pair:
Prev Open: 111.61
Prev Close: 112.21
% chg. over the last day: +0.53%
Japan's new Prime Minister, Fumio Kishida, says he has no plans to change capital gains and dividend taxes, as he intends to take other steps to distribute wealth better, such as raising healthcare workers' salaries. The Japanese yen was declining all week as investors were concerned that the new prime minister may go ahead with a capital gains tax hike and move away from the investor-friendly economic policies conducted by Japanese Prime Minister Shinzo Abe from 2013 to 2020.
Trading recommendations
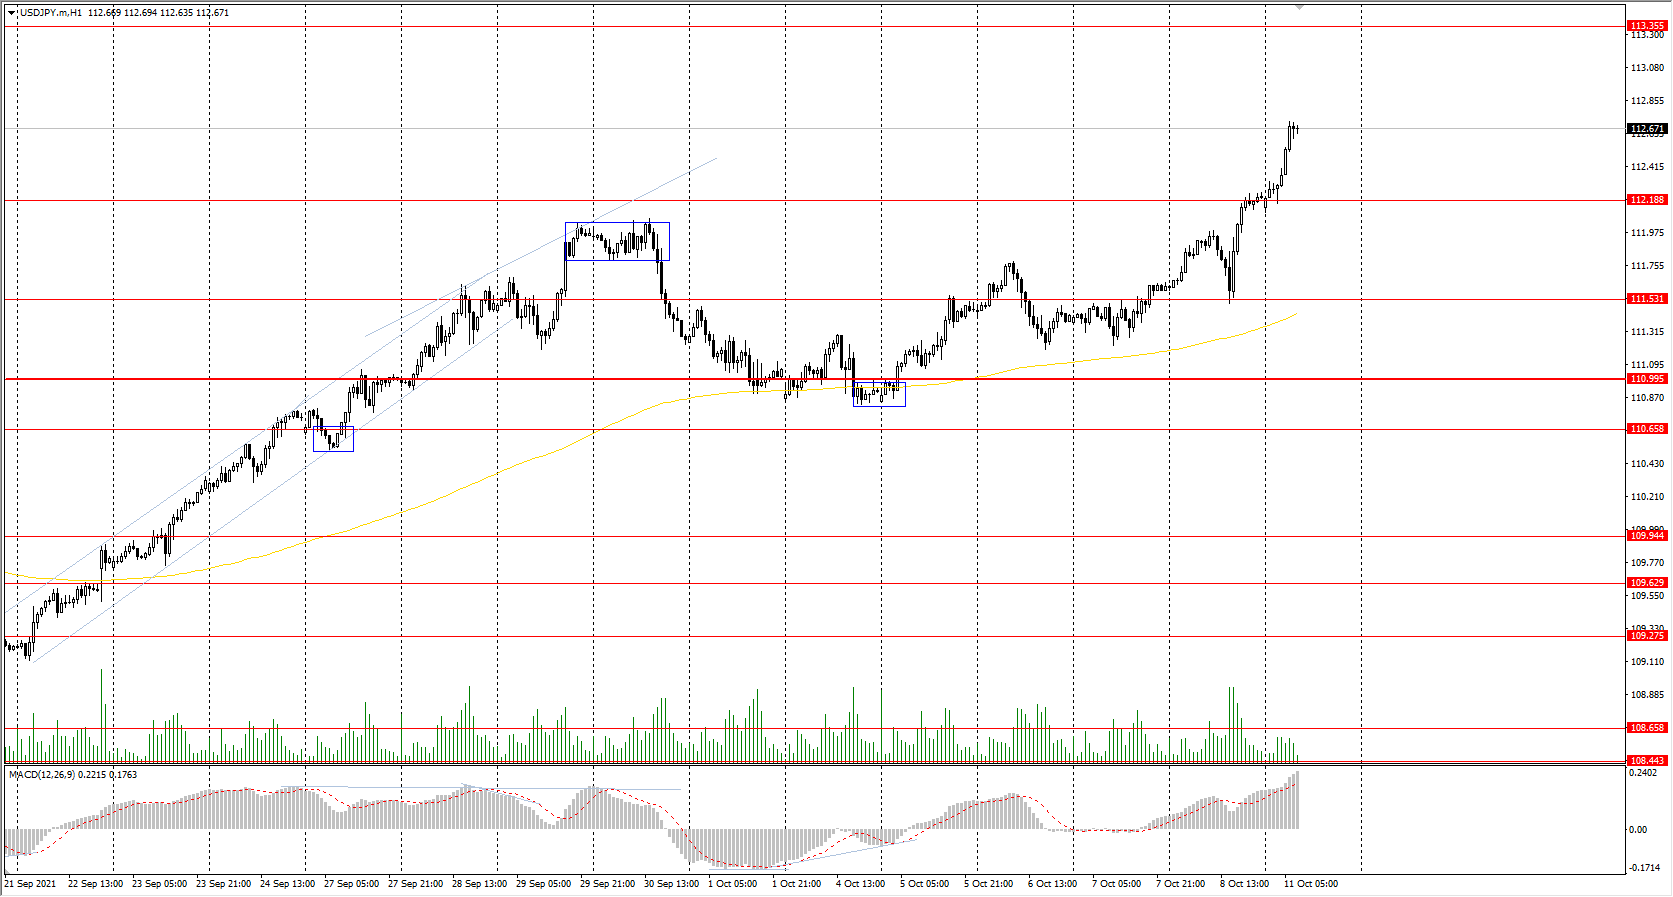
Support levels: 112.19, 111.53, 110.99, 110.65, 109.95, 109.63
Resistance levels: 113.35
The main trend of the USD/JPY currency pair is bullish. The Japanese yen is rapidly declining against the US dollar; the last time such a price was in April 2019. The MACD indicator is positive again, and there are signs of overbuying but no signs of reversal. Under such market conditions, it’s better to look for buy positions from the support levels near the moving average, as the price has deviated strongly from the average line. Sell positions should be considered only throughout the day from the resistance levels, given there is sellers' initiative.
Alternative scenario: if the price falls below 110.99, the uptrend is likely to be broken.
USD Remains Soft After Big NFP Miss
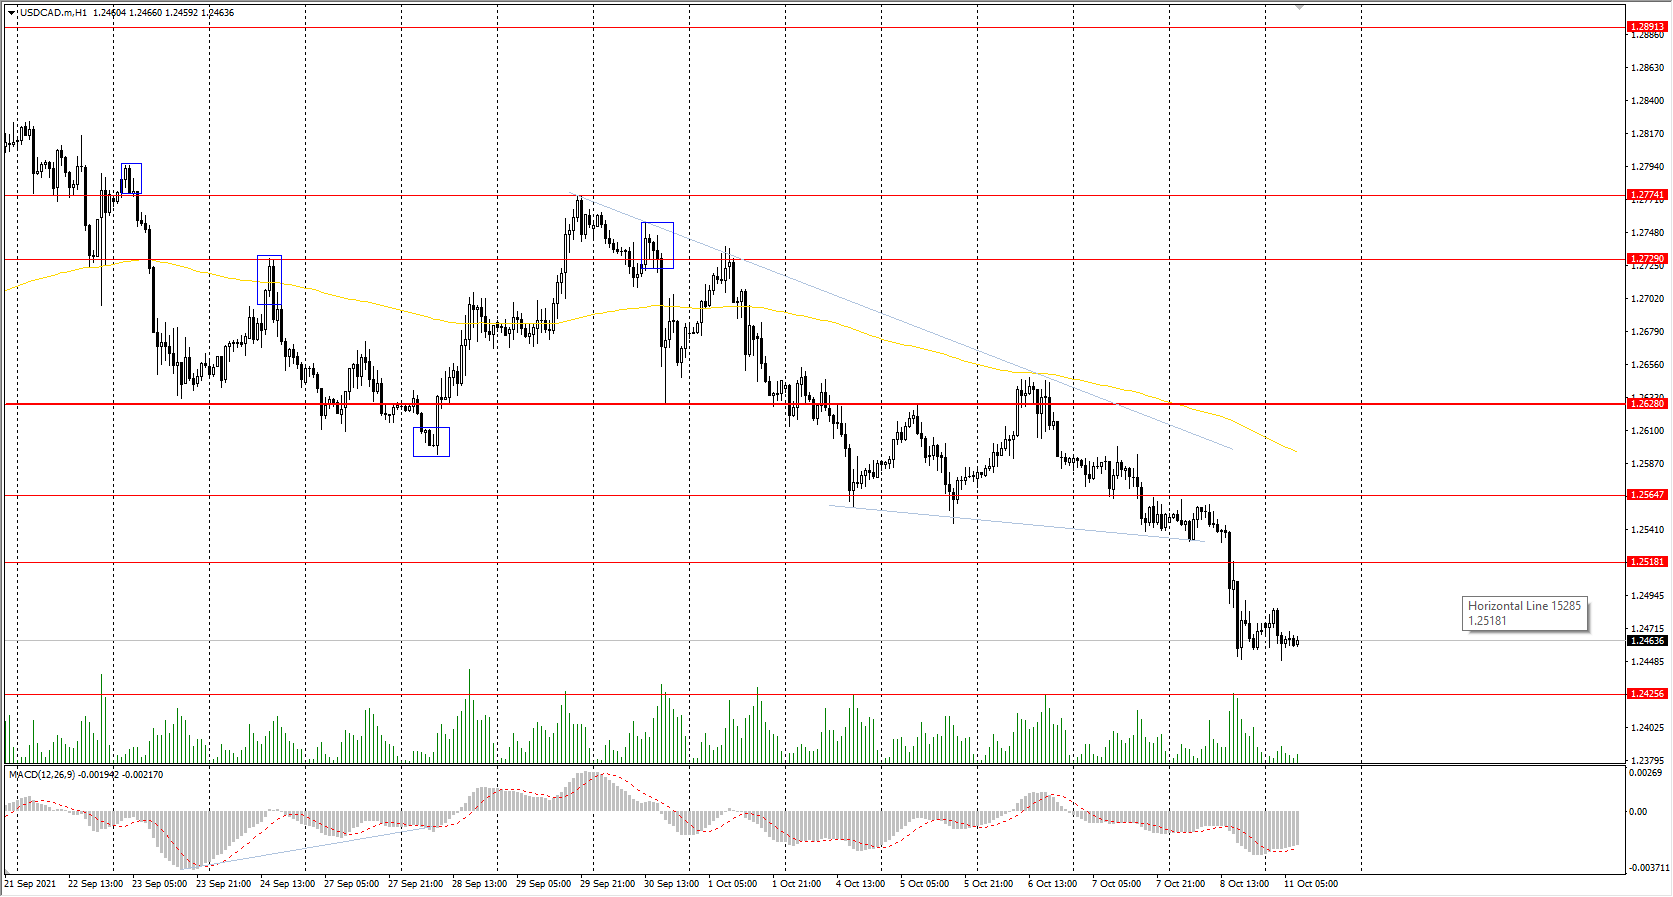
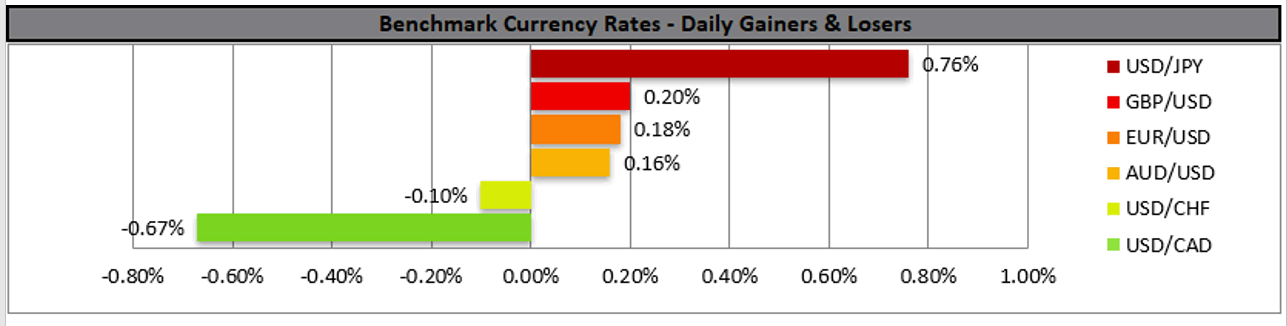
The USD was soft against a number of its counterparts on Friday and during today’s Asian session, after a big miss on September’s NFP figure, which was released on Friday. On the other hand, it should be noted that the unemployment rate ticked down and average earnings growth rate accelerated which could have prevented the bears from totally taking over. On the other hand, the Loonie strengthened considerably against the USD as Canada’s employment data for the same month outperformed market expectations and highlighted the contrast in the situation of the two. However, the Loonie may have enjoyed additional support as WTI prices were on the rise surpassing $80 per barrel, a level not seen since 2014 caused by increased demand while it should be noted that natural gas prices were also on the rise. Safe haven Yen weakened on Friday and today’s early morning, given that despite the soft US employment data for September, market expectations for a possible announcement for a tapering of the Fed’s QE program seemed to remain unchanged thus prompted US yields to rise. Rising US yields on the other hand also tended to victimize the Tech sector in the US stockmarkets as Nasdaq dropped, while may also have prevented Gold bulls from taking considerable action after the release of the US employment report. Overall, we see the market being driven by fundamentals today given the low number of high impact financial releases, while trader’s attention may have started to shift towards the release of the Fed’s last meeting minutes and the US CPI rates for September, both due out on Wednesday.
USD/JPY rose breaking the 112.25 (S1) resistance line now turned to support. We tend to remain bullish for the pair, yet the RSI indicator below our 4-hour chart is above the reading of 70 confirming the bull’s dominance yet may imply that the pair is overbought and may correct lower. Should the bulls maintain control over the pair, we may see it breaking the 112.90 (R1) resistance line thus paving the way 113.70 (R2) level. On the other hand, should the bears take over we may see the pair reversing course, breaking the 112.25 (S1) support line and aim for the 110.90 (S2) level.
USD/CAD dropped on Friday dropped breaking the 1.2500 (R1) support line, now turned to resistance. We maintain our bearish outlook for the pair, yet we highlight that the RSI indicator below our 4-hour chart has dropped below the reading of 30 implying that the pair may have reached oversold levels and a correction higher is possible. Should the selling interest be extended, we may see the pair breaking the 1.2425 (S2) support line and aim for the 1.2330 (S1) support level. Should a correction higher take place we may see the pair breaking the 1.2500 (R1) line and aim for the 1.2580 (R2) resistance level.
Today’s events and expectations
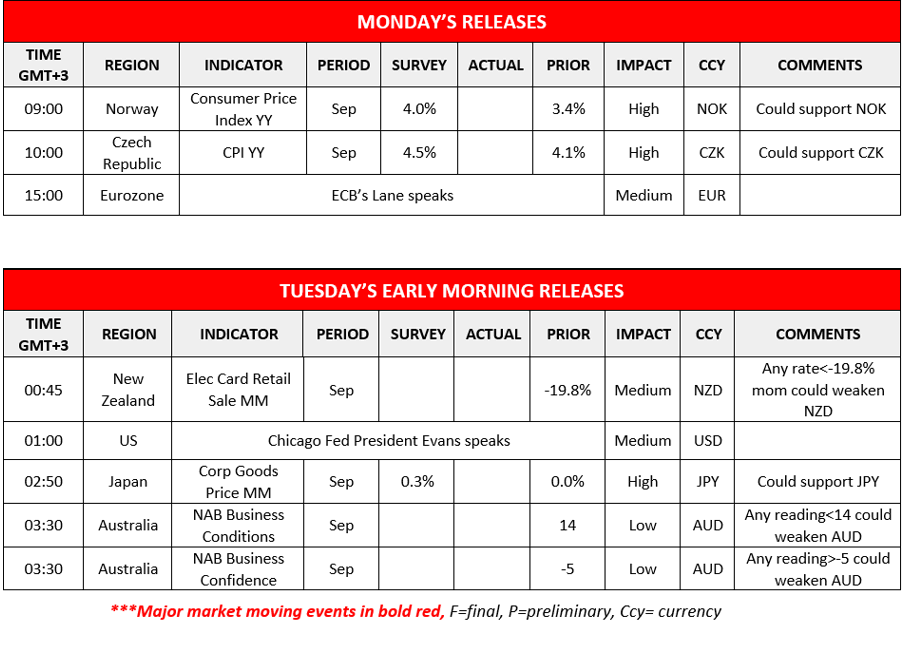
Today during the European session, we get the CPI rates for September from the Czech Republic and Norway.
As for the rest of the week
On Tuesday, we get Japan’s Corporate Goods price growth rate for September, UK’s employment data for August, and Germany’s ZEW indicators for October. On Wednesday we get China’s trade data for September, UKs’ GDP and manufacturing output rates for August, Eurozone’s industrial production rate for August and most importantly the US CPI rates for September, while later the Fed is expected to release the minutes of its September meeting. On Thursday, we get Australia’s employment data for September, China’s and Sweden’s inflation rates for September the US weekly initial jobless claims figure and Canada’s manufacturing Sales growth rate for August. On Friday we note the release of France’s final HICP rates for September, and from the US we get the NY Fed manufacturing index for October, the Retail sales for September and the preliminary University of Michigan consumer sentiment for October.
USD/JPY H4 Chart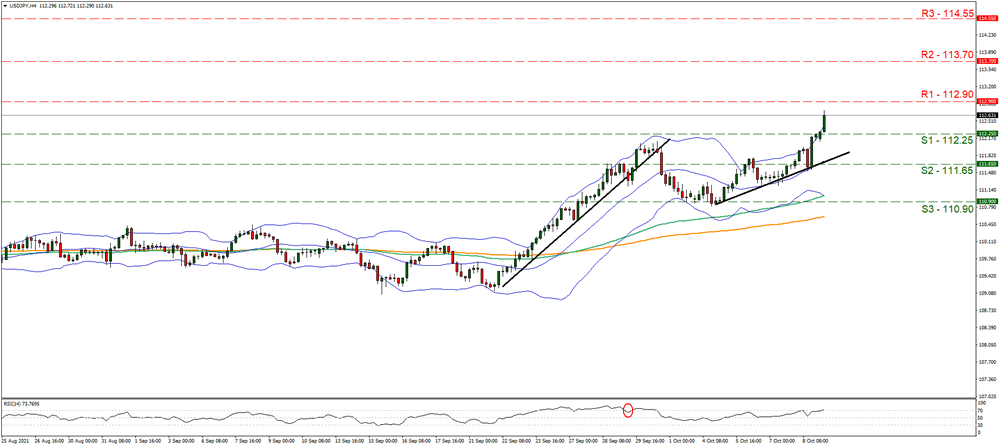
Support: 112.25 (S1), 111.65 (S2), 110.90 (S3)
Resistance: 112.90 (R1), 113.70 (R2), 114.55 (R3)
USD/CAD H4 Chart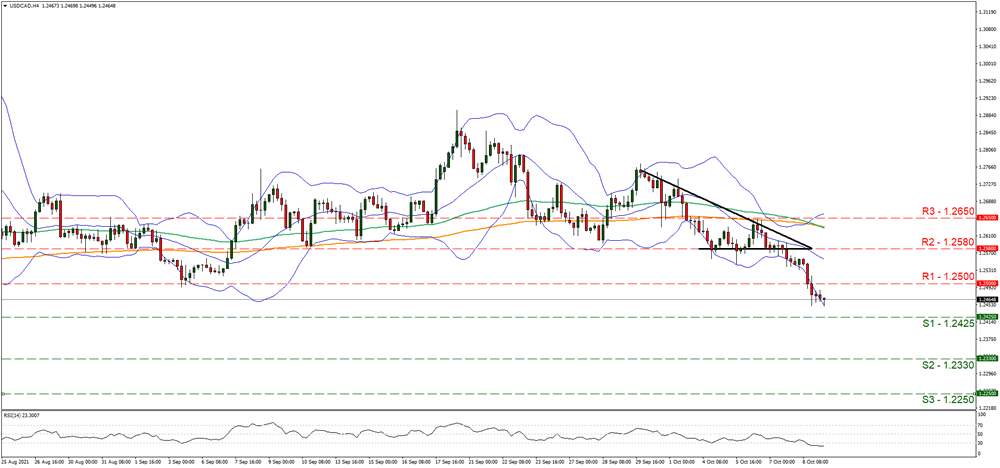
Support: 1.2425 (S1), 1.2330 (S2), 1.2250 (S3)
Resistance: 1.2500 (R1), 1.2580 (R2), 1.2650 (R3)
USD/JPY Outlook: Extends Strong Rally, Bullish Studies Point To Further Gains
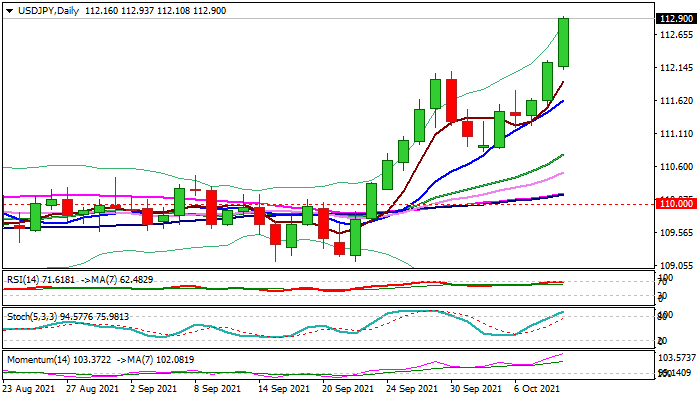
The USDJPY remains in strong bullish mode and advanced 0.6% in Asia / early Europe on Monday, following 1.2% rally last week.
Bulls pressure psychological 113 barrier after break above tops of 2020/2019 (112.22/112.40) and monthly cloud top (112.41) triggered stops and accelerated higher, also boosted by rise in US Treasuries following last Friday’s NFP miss.
Daily studies in full bullish setup point to further gains, as above 113 barrier there are no obstacles until 113.82/114.20 (Dec 2018 high / 2018 peak).
Count on some price adjustments on overbought conditions, which should provide better buying opportunities.
Broken former tops reverted to strong supports which should ideally contain dips.
Res: 113.00, 113.82, 114.20, 114.53.
Sup: 112.40, 112.22, 112.07, 111.63.
EURUSD Sets The Stage For An Upside Reversal
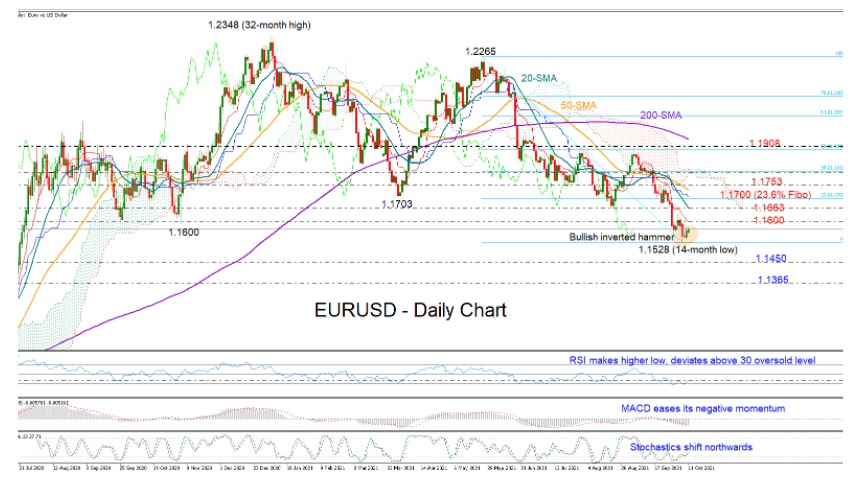
EURUSD has barely distanced itself above Wednesday’s 14-month low of 1.1528, but the recent faint bullish attempt could still see further continuation according to the technical picture.
First the pair seems to have created a bullish inverted hammer candlestick near its recent lows before rotating higher – a sign that buyers could gain confidence in the near term. Then, the RSI and the fast-Stochastics have both registered a higher low after bottoming out in the oversold area, while the MACD has eased its negative momentum, all endorsing improvement in market sentiment.
The 1.1600 psychological mark may first attract interest if the positive scenario materializes. This is also where the red Tenkan-sen line, which has been curbing upside movements since the start of September, happens to be. A violation at this point could extend up to the 20-day simple moving average (SMA) at 1.1663, while within breathing distance, the 23.6% Fibonacci of the 1.2265 – 1.1528 down leg could motivate some selling ahead of the 1.1753 restrictive region.
In the big picture, however, only a sustainable move above the key resistance of 1.1908 and particularly a close above the 200-day SMA would dissolve the bearish trend.
Should the bulls lose the battle instead, with the price retreating below the 1.1528 trough, immediate support could develop around the challenging barrier of 1.1450, last active during the March-July 2020 period. Below that, traders may next seek footing around 1.1365.
In summary, Friday’s recovery mode is expected to continue in the short term, likely facing some restrictions around 1.1600.
AUD/USD Outlook: A Key Bullish Trend Line Is Forming With Support Near 0.7300
The Aussie Dollar started a steady increase from the 0.7220 support zone against the US Dollar. The AUD/USD pair broke the 0.7280 resistance zone to move into a positive zone.
The pair traded above the 0.7300 level and the 50 hourly simple moving average. A high was formed near 0.7337 before there was a downside correction. On the downside, there is a key bullish trend line forming with support near 0.7300 on the hourly chart.
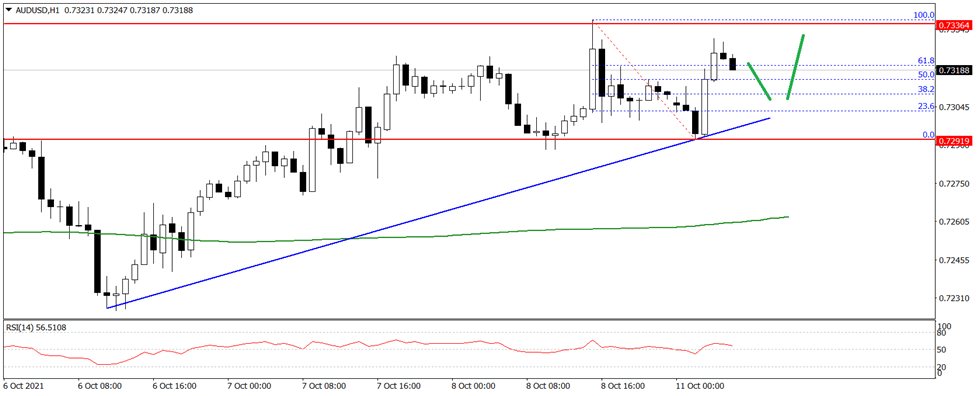
A clear break below the trend line support could lead the pair towards the 0.7280 support. Any more losses may possibly open the doors for a move towards the 0.7220 level.
On the upside, the pair is facing hurdles near 0.7335 on FXOpen. The next major resistance is near the 0.7350 level, above which the pair could rise steadily towards the 0.7400 level in the near term.
AUD/JPY accelerating up, to target 85.78 high
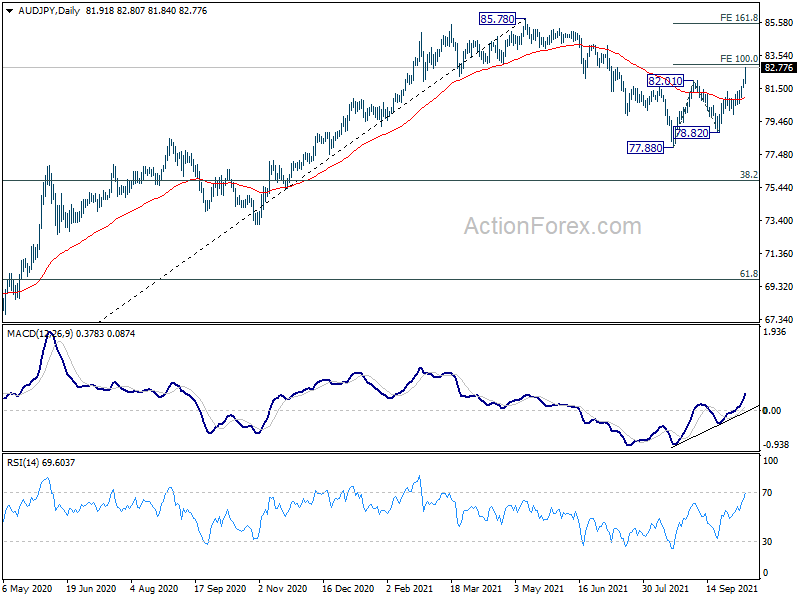
AUD/JPY follows other Yen crosses and accelerates higher today. The decisive break of 82.01 resistance firstly confirms resumption of rebound from 77.88. More importantly, it also affirms that correction from 85.78 has completed. Immediate focus is now on 100% projection of 77.88 to 82.01 from 78.82 at 82.95. Strong break there would indicate further upside acceleration and raise the chance that it's indeed resuming larger up trend from 59.85. Further rise would be seen to 161.8% projection at 85.50, which is close to 85.78 high.
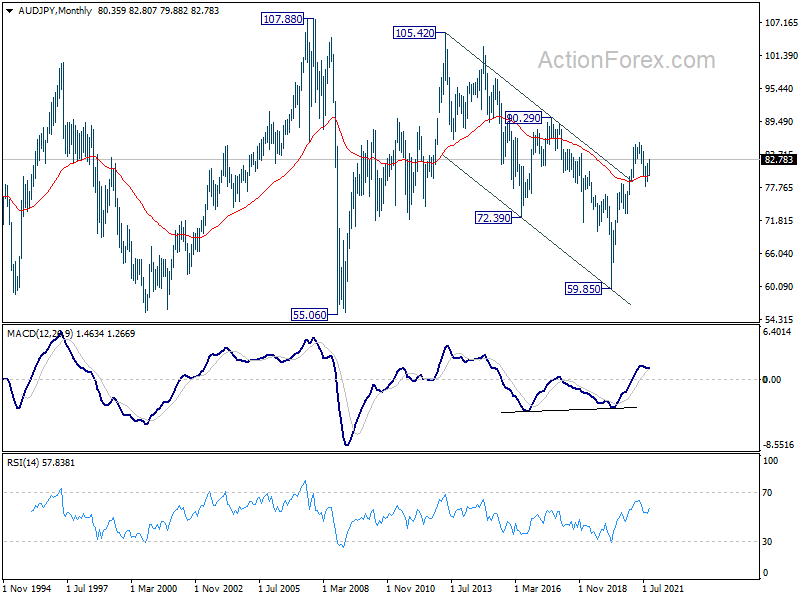
Also, note that AUD/JPY is being support by 55 month EMA, which is a long term bullish sign. That affirms the case that down trend from 105.42 (2013 high) has completed with three waves down to 59.85, on bullish convergence condition in monthly MACD. That is, on resumption, rise from 59.85 should power through 90.29 structural resistance, towards 105.42/107.88 resistance zone in the medium to long term. But of course, let's see how it goes with 85.78 first.
Gold Moves With Weak Momentum In 4-Month Trading Range
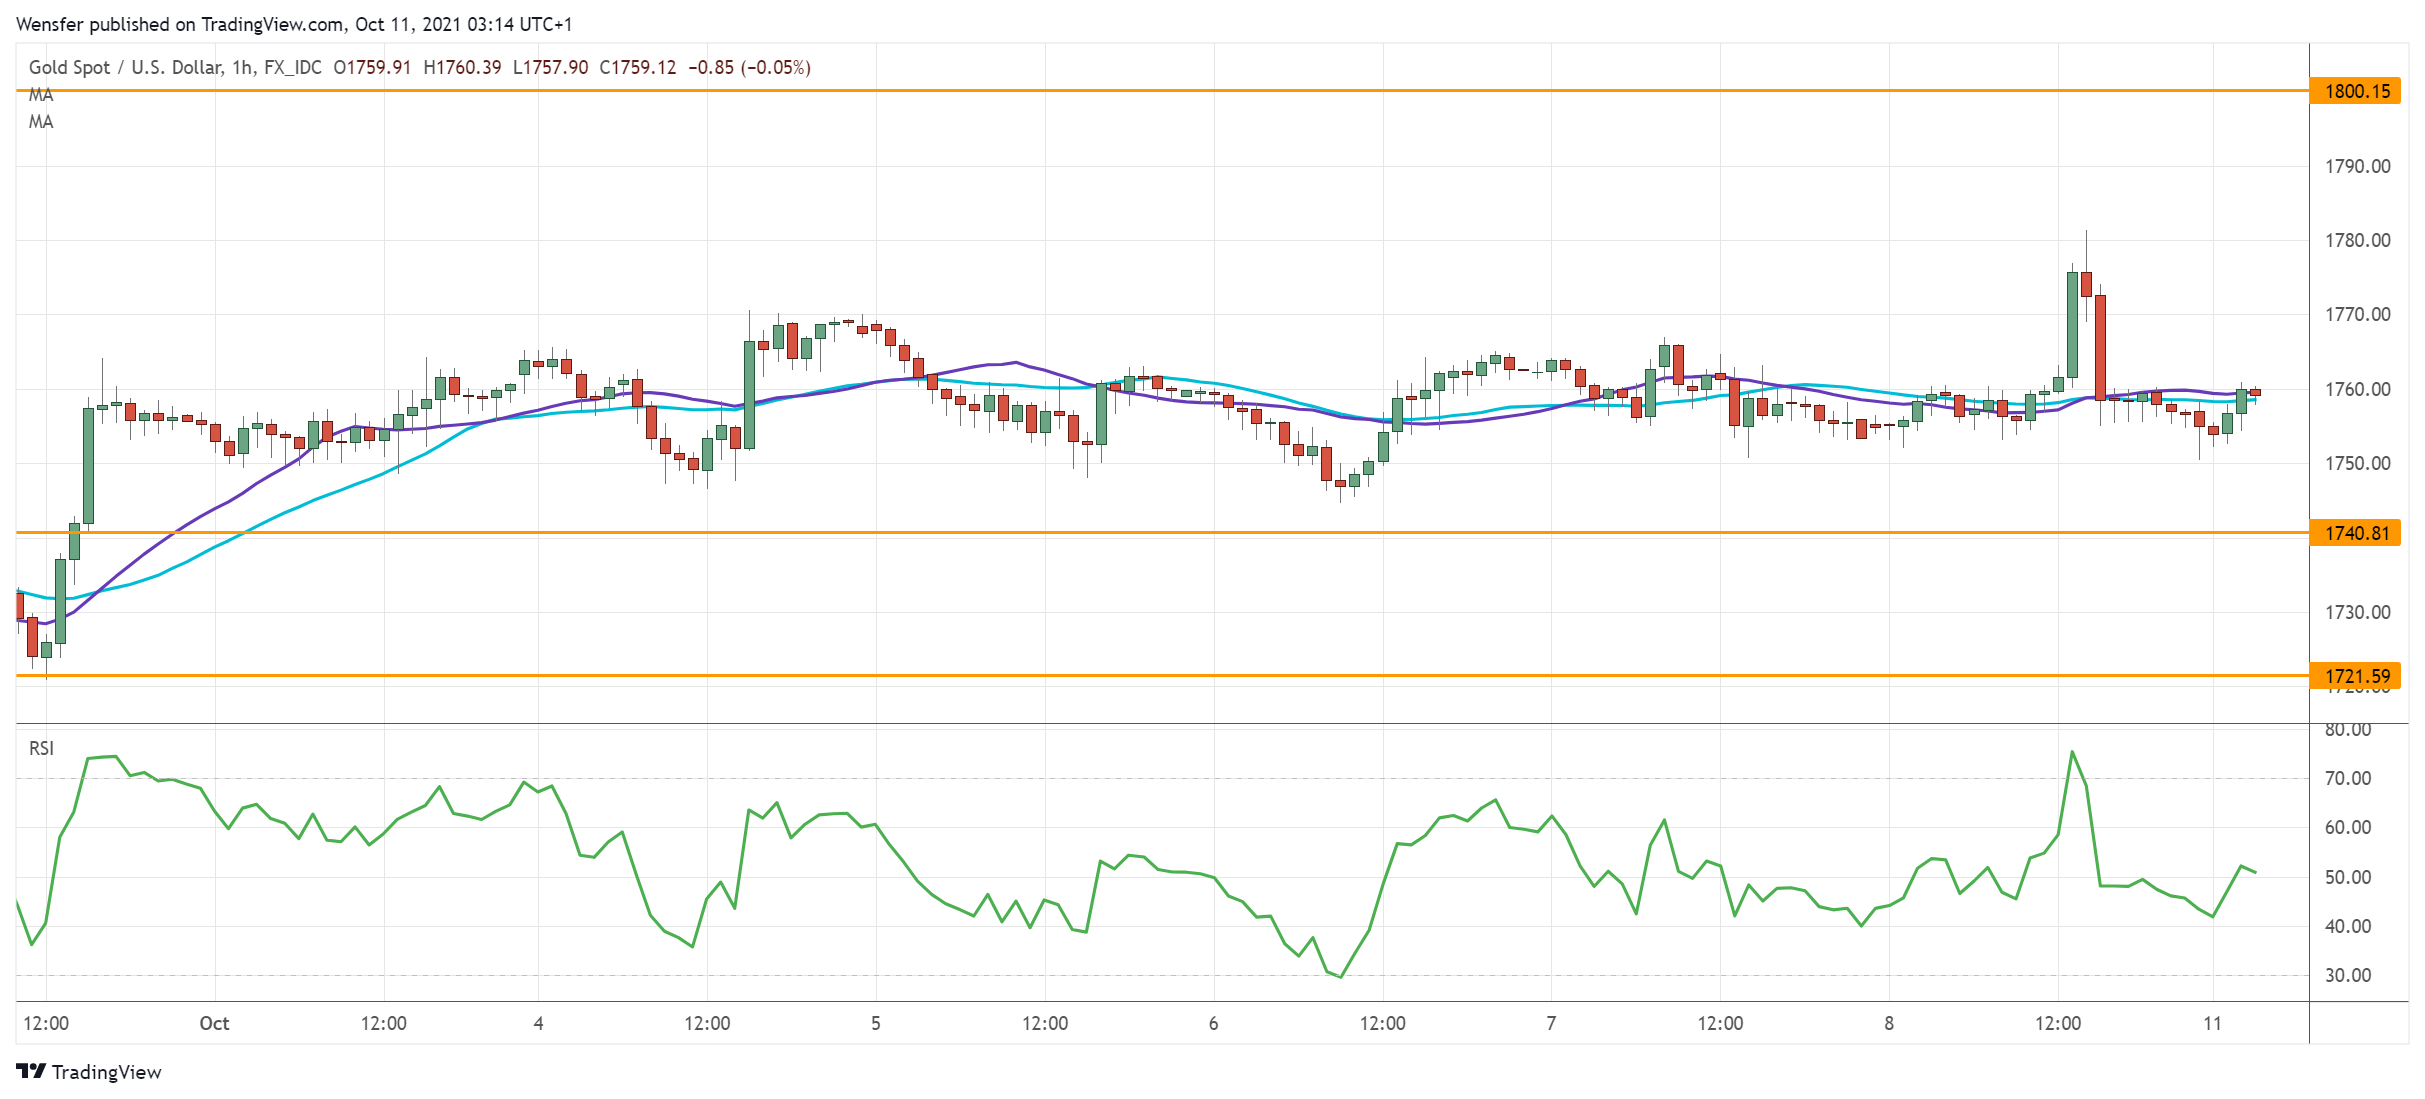
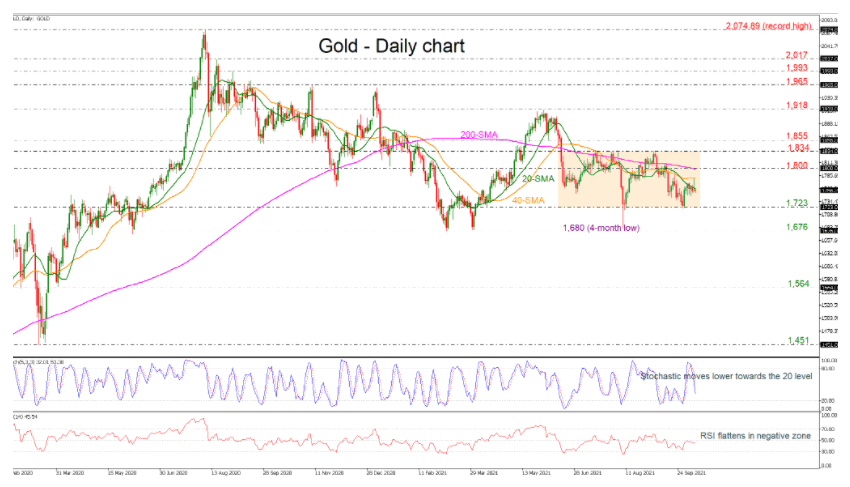
Gold prices have been moving sideways with very weak momentum over the last couple of sessions, remaining below the 20- and 40-day simple moving averages (SMAs). The market has been in a trading range since June 16 and regarding the technical indicators the stochastic is heading south, approaching the oversold zone, while the RSI is flattening in the negative region.
If the price dips further, immediate support for the bears could be the 1,723 support level before increasing the negative momentum towards the 1,676 barrier. More declines could open the way for a retest of the 1,564 hurdle, registered in April 1.
On the other side, a successful climb beyond the short-term SMAs could challenge the 200-day SMA, which overlaps with the 1,800 significant resistance. Overcoming this obstacle, the commodity could meet the upper boundary of the channel at 1,834 before adding to the optimism for a penetration of the consolidation area to the upside, hitting 1,855. The next target could then be at the 1,918 high.
Summarizing, the precious metal is neutral and only a decisive close above the 1,834 resistance or below the 1,723 support may change the current picture.
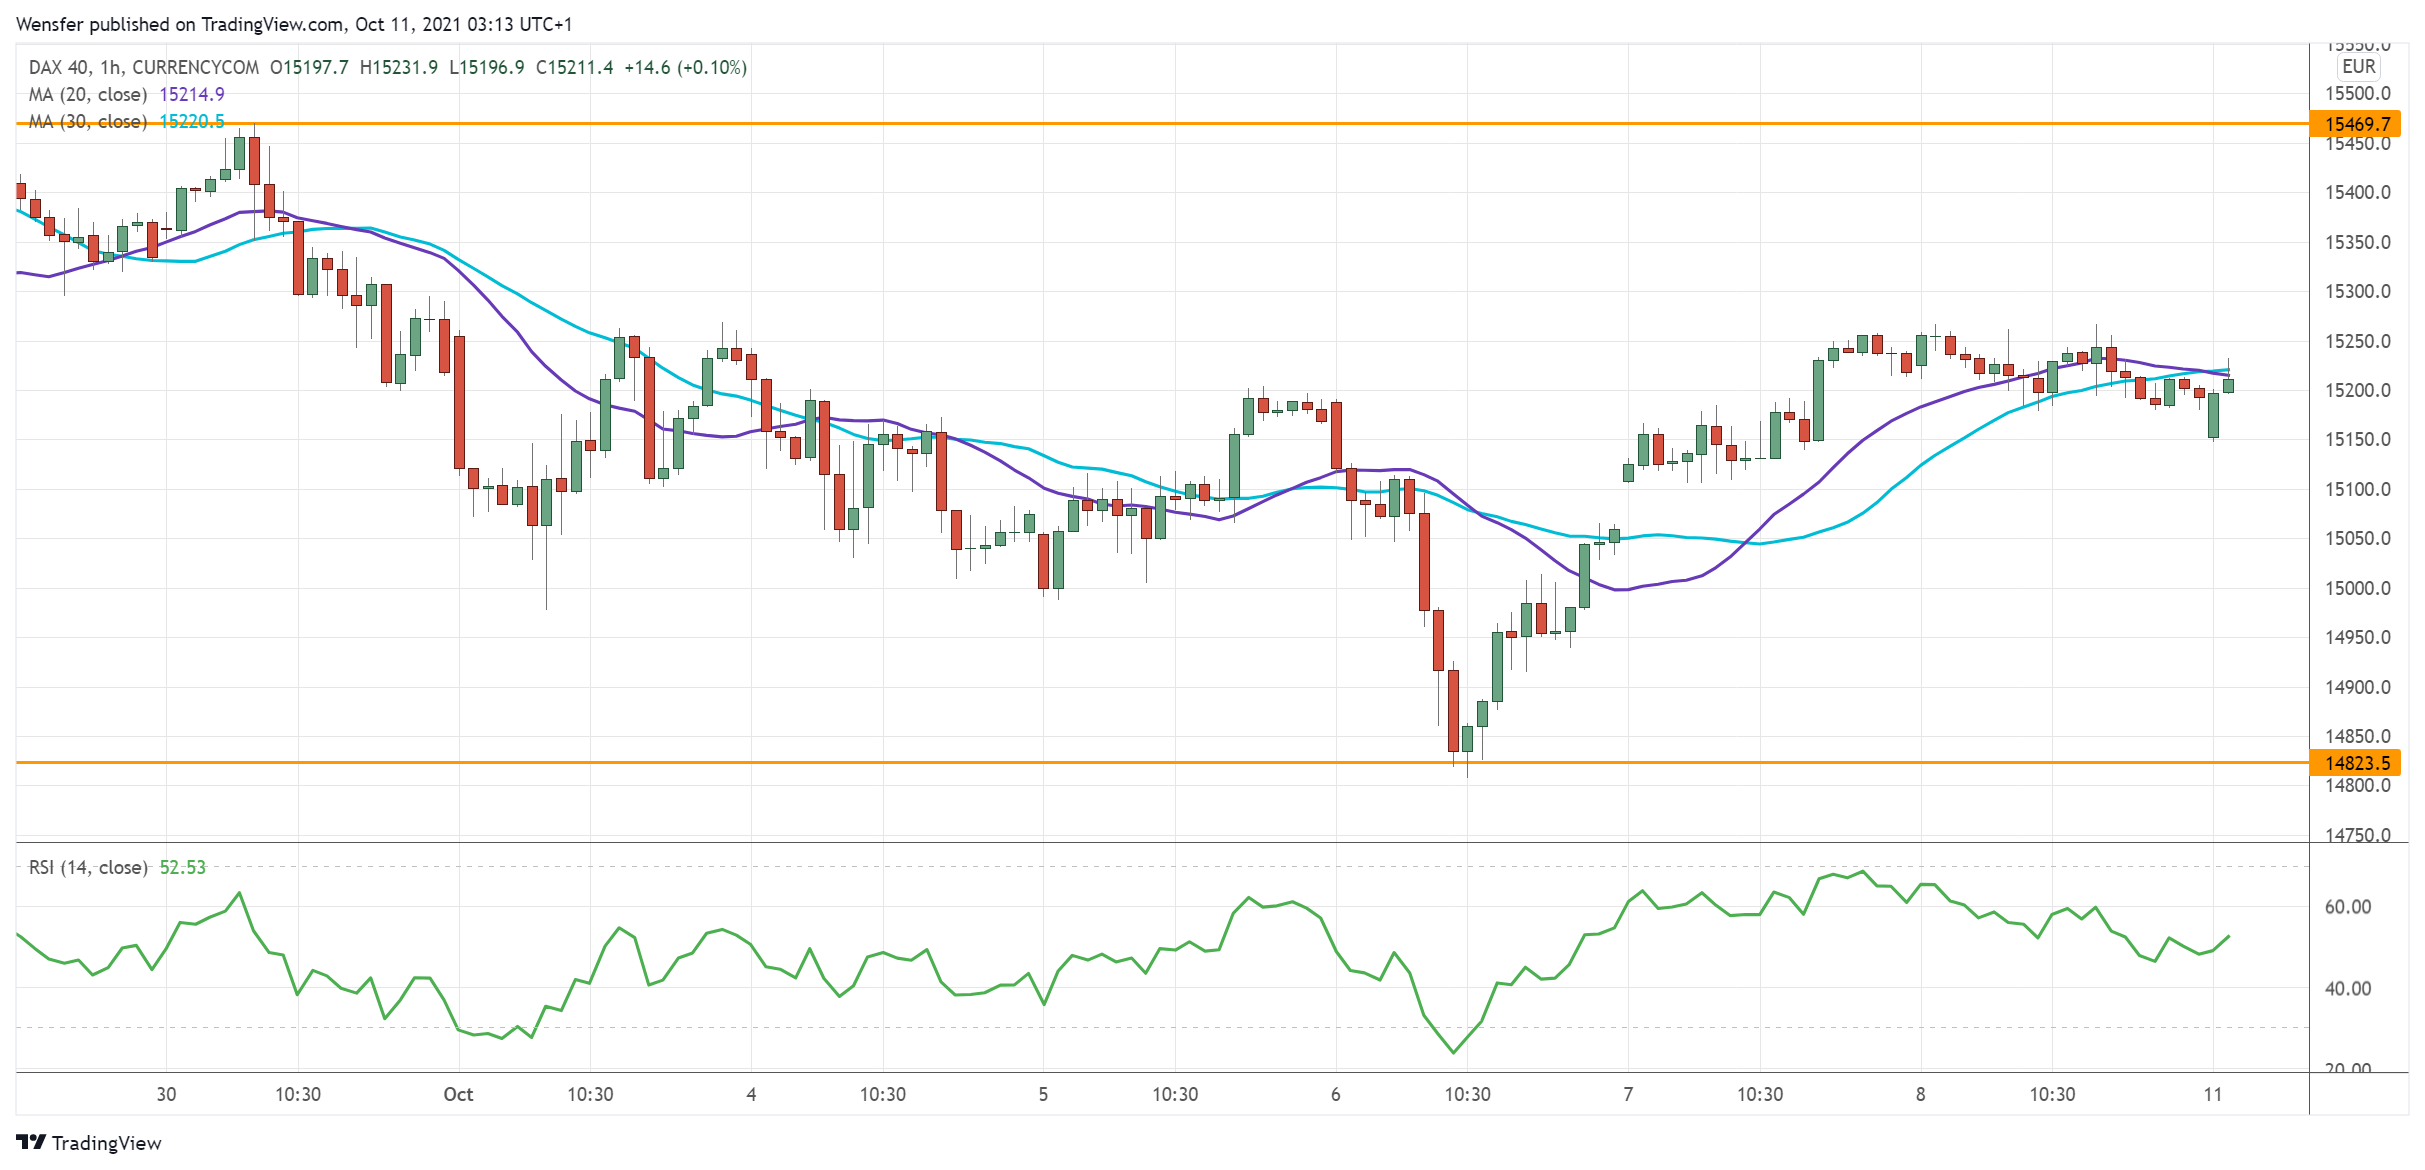
GER 40 Bounces Off Major Support
The Dax 40 rallies as risk sentiment returns.
The index has bounced off last May’s lows around 14820. A depressed RSI in this major demand area has attracted solid buying interest. A close above 15200 may have prompted short-term sellers to cover.
The bulls will have the challenging task of clearing several resistance levels, the first being 15470 on the 30-day moving average. A pullback may test the psychological level of 15000. Further down, 14820 is a critical floor to keep the uptrend intact in the medium term.
XAU/USD Attempts Bullish Reversal
Gold surges as a slowdown in the US job market weighs on the US dollar.
A bullish candle above the first resistance on the daily chart (1775) has forced the bears to cover their positions, exacerbating the momentum in the process. Now that the selling pressure is out of the way, the bulls may consolidate their gains and build strength for a reversal.
The psychological level of 1800 would be the next target. However, an overbought RSI has caused a temporary pullback towards the demand area between 1740 and 1755.