Sample Category Title
CFTC Commitments of Traders – Energy Prices Rallied amidst Concerns of Prolonged Power Shortage
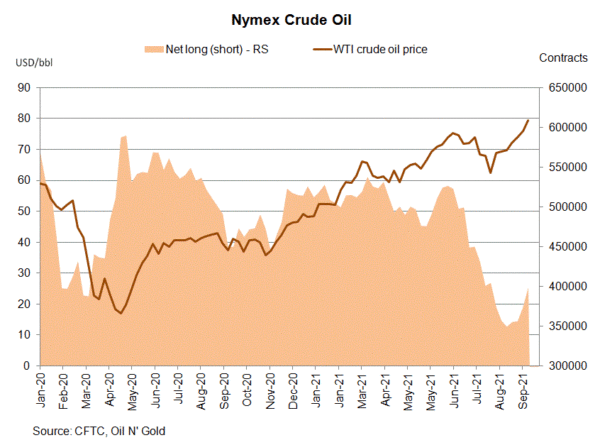
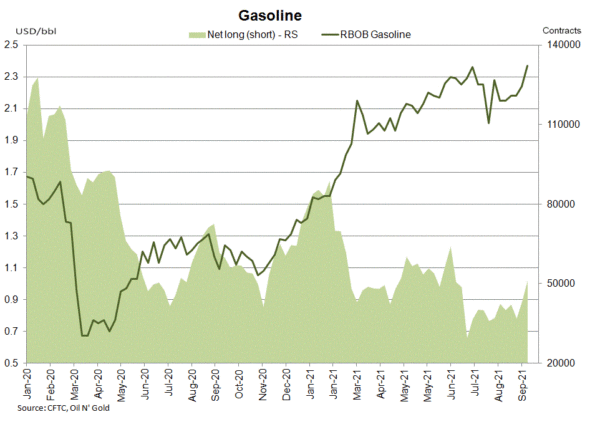
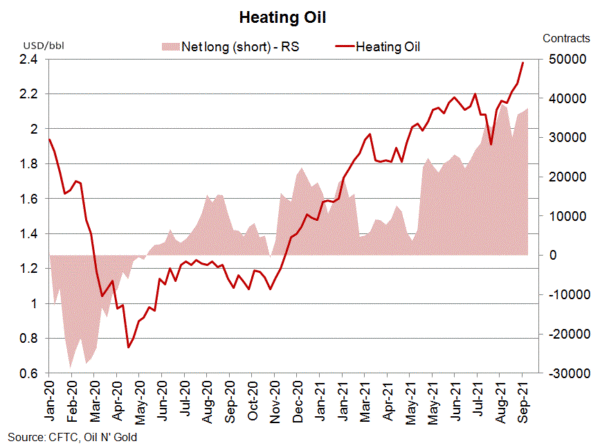
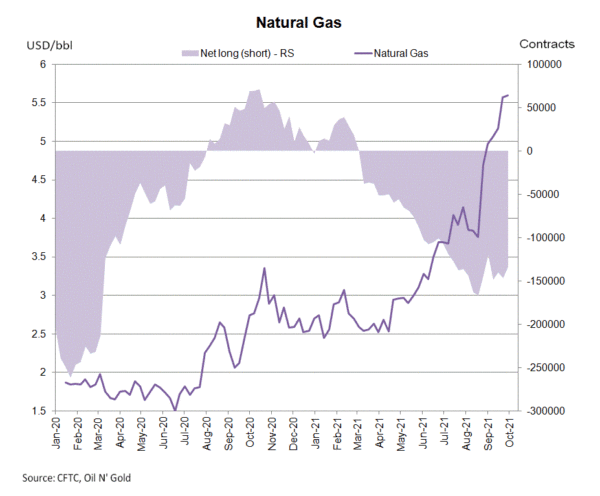
Energy prices rallied across the board as the problem of energy shortage across the globe has exacerbated. According to the CFTC Commitments of Traders report for the week ended October 5, NET LENGTH of crude oil futures rallied +24 493 contracts to 398 307. Speculative longs jumped +21 038 contracts while shorts dropped -3 455 contracts. For refined oil products, NET LENGTH for heating oil added +958 contracts to 37 548, while that for gasoline rose +7 875 contracts to 51 052. NET SHORT of natural gas futures sank -12 972 contracts to 133 708 during the week.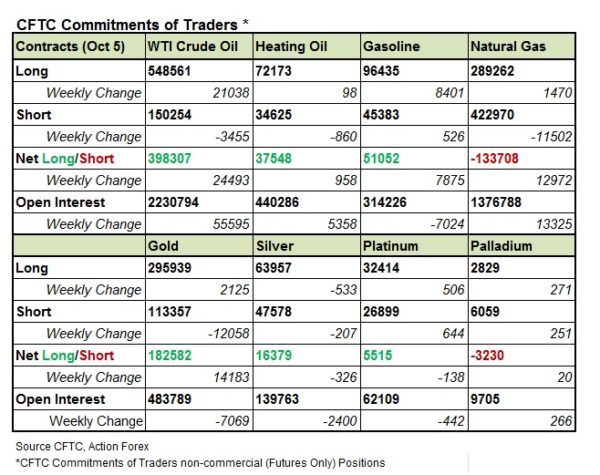
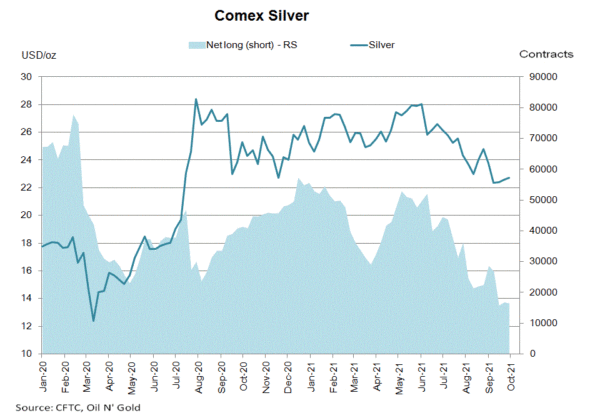
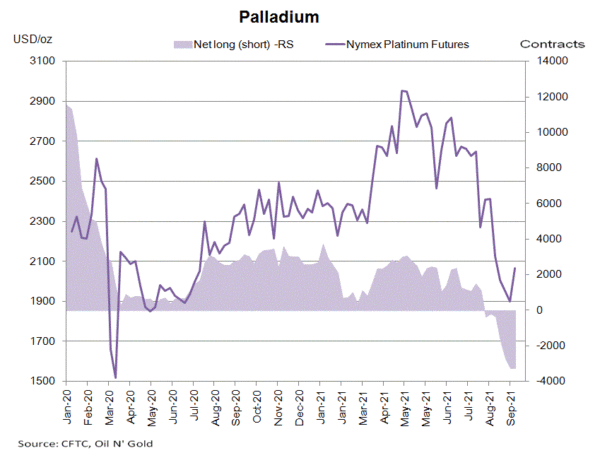
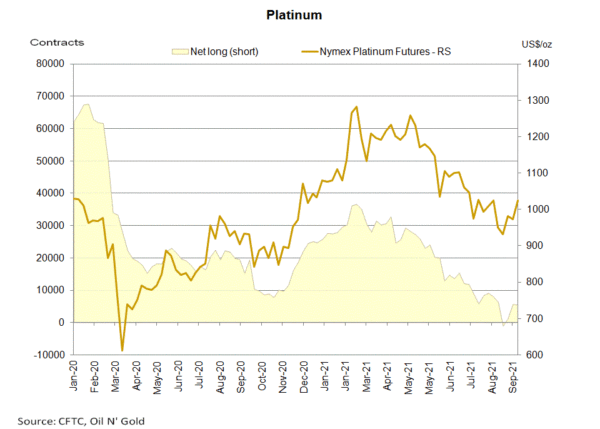
 Gold futures’ NET LENGTH jumped +14 183 contracts to 182 582. Silver futures’ NET LENGTH slipped -326 contracts to 16 379. For PGMs, NET LENGTH of Nymex platinum futures slipped -138 contracts to 5 515, while NET SHORT for palladium futures was down -20 contracts to 3 220.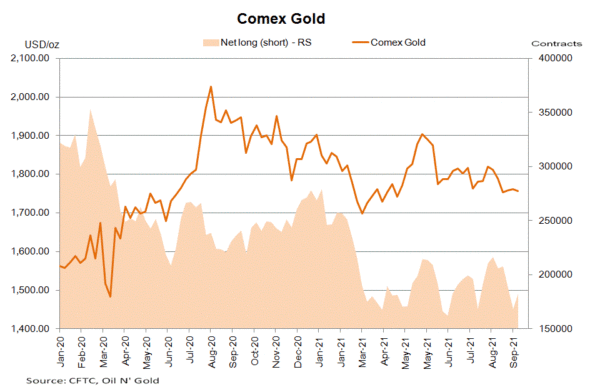
CFTC Commitments of Traders – Bets on Lower European Currencies Accelerated amidst Power and Supply Chain Crisis
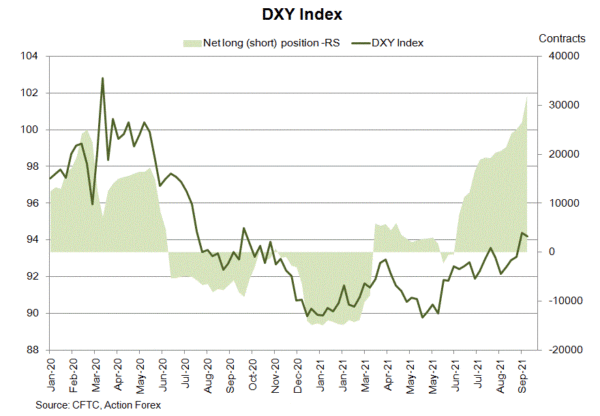
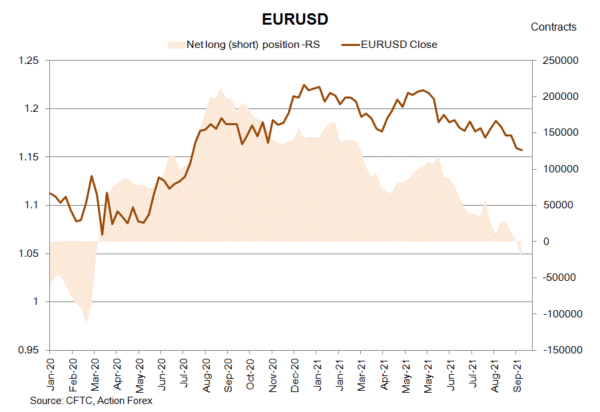
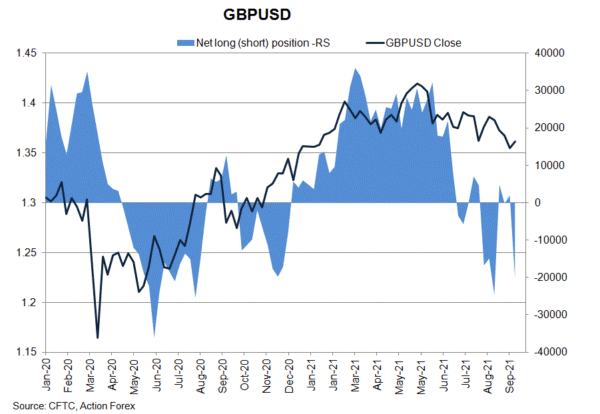
As suggested in the CFTC Commitments of Traders report in the week ended October 5, NET LENGTH of USD index futures rose +5 565 contracts to 32 026. Bets were trimmed on both sides. Concerning European currencies, EUR futures drifted to NET SHORT of 22 334. Speculative shorts rallied 24 982 contracts as the bloc is struggling with power shortage and protests were seen against higher electricity prices. GBP futures drifted back to NET SHORT of 20 018 contracts. High energy prices and supply chain disruption are expected to worsen in coming months, heightening the risks of stagflation.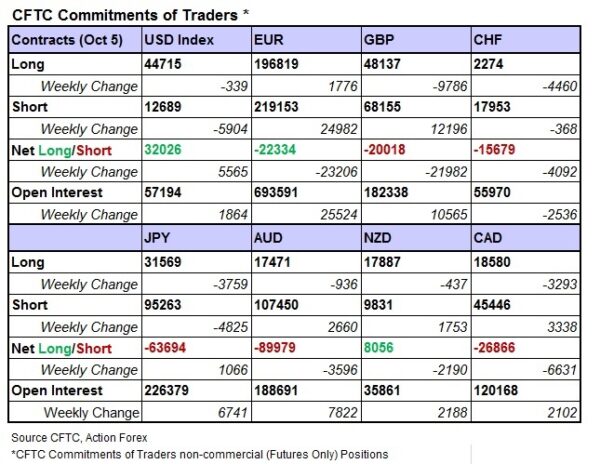
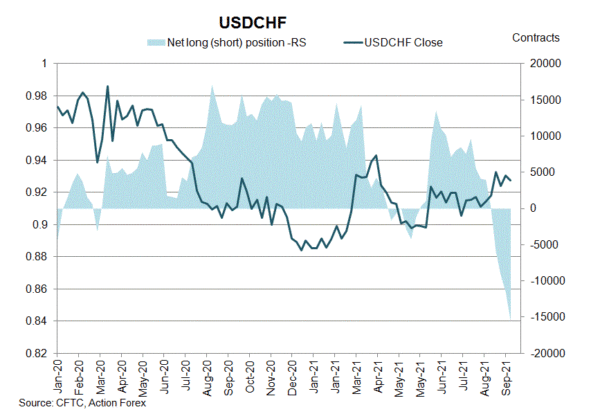
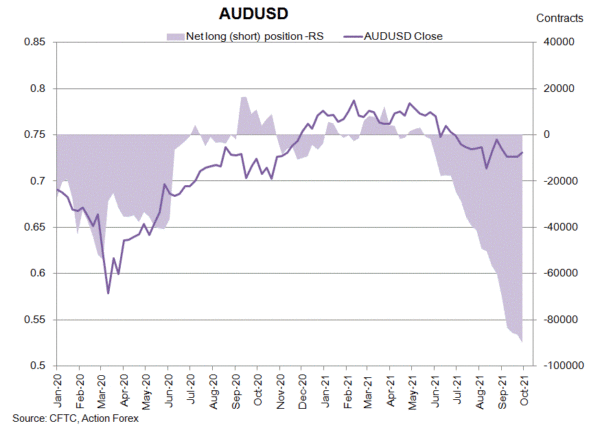
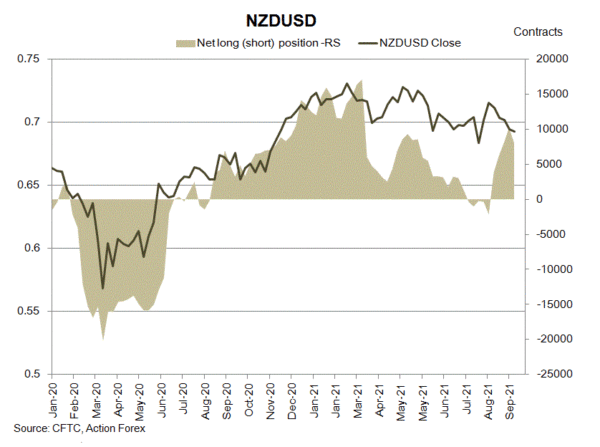
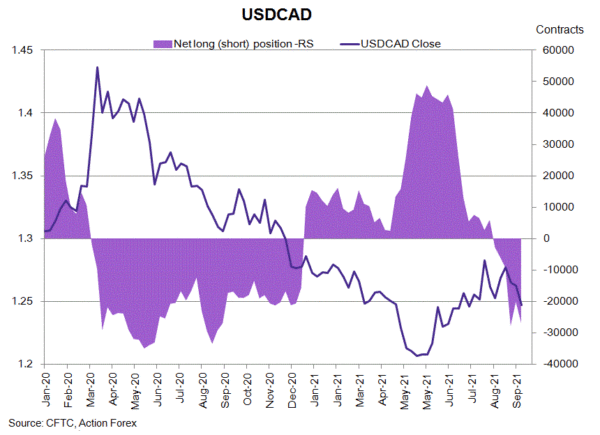
On safe-haven currencies, NET SHORT of CHF future rose +4 092 contracts to 15 679 while that of JPY futures dropped -1 066 contracts to 63 694. Concerning commodity currencies, NET SHORT of AUD futures increased +3 596 contracts to 89 979. NET LENGTH for NZD futures dropped -2 190 contracts to 8 056 during the week. CAD futures' NET SHORT jumped +6 631 contracts to 26 866.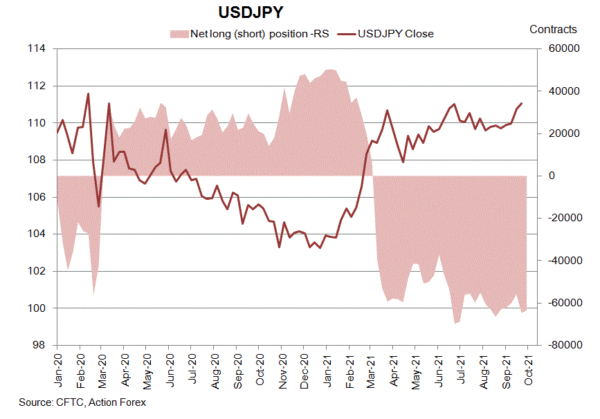
EUR/USD Weekly Outlook
EUR/USD edged lower to 1.1528 last week but lost momentum again. Initial bias is neutral this week first, but further fall is still in favor as long as 1.1639 minor resistance holds. Break of 1.1528 will resume larger decline towards 1.1289 medium term fibonacci level. On the upside, break of 1.1639 resistance, however, will indicate short term bottoming. intraday bias will be turned back to the upside for stronger rebound.
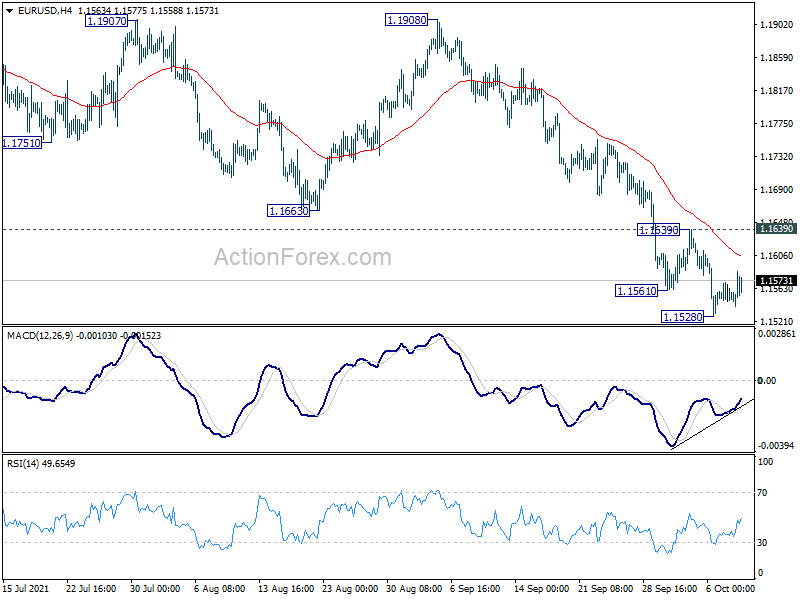
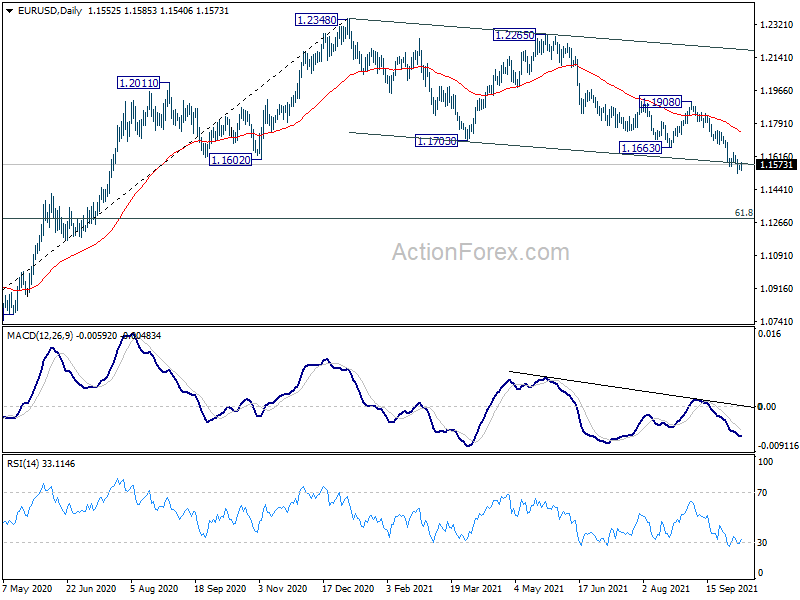
In the bigger picture, sustained break of 1.1602 will argue that rise from 1.0635 (2020 low) has completed at 1.2348. Deeper fall would be seen to 61.8% retracement of 1.0635 to 1.2348 at 1.1289. Note also that rejection by 55 week EMA (1.1830) also carries medium term bearish implication. Firm break of 1.1289 will pave the way to retest 1.0635 low. On the upside, though, break of 1.1908 resistance will revive medium term bullishness and turn focus back to 1.2348 high.
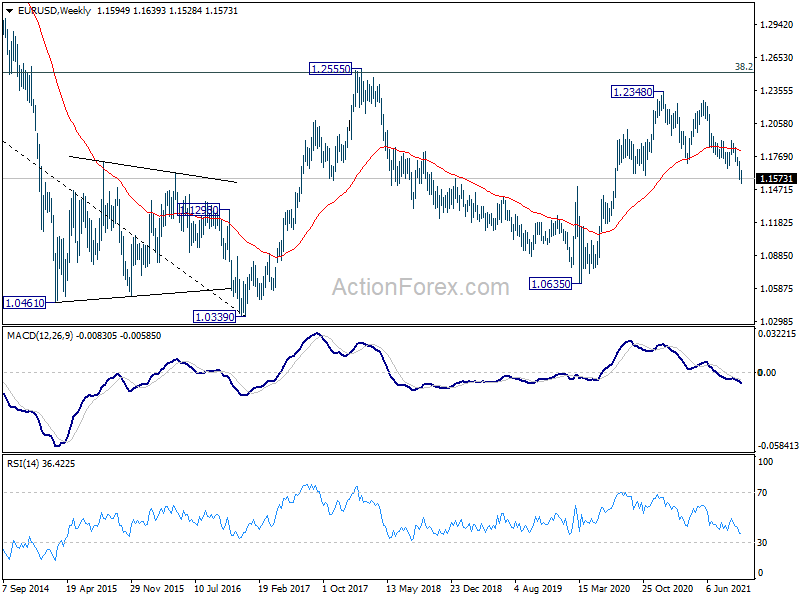
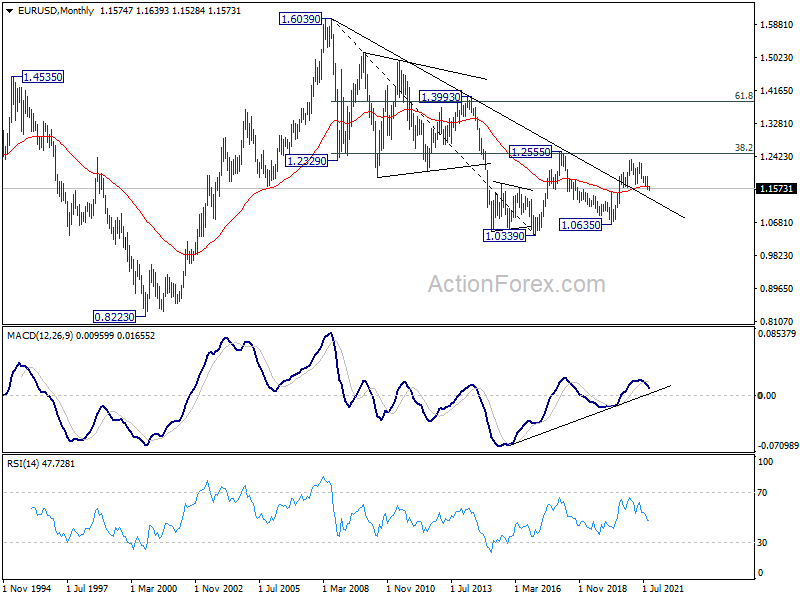
In the long term picture, EUR/USD has possibly failed 1.2555 cluster resistance (38.2% retracement of 1.6039 to 1.0339 at 1.2516) already. Long term outlook will remain neutral as sideway pattern from 1.0339 (2017 low) is extending with another medium term fall. For now, we'd hold back from assessing the change of downside breakout, and monitor the momentum of the decline from 1.2348 first.
USD/JPY Weekly Outlook
USD/JPY's rally resumed last week by breaking 112.07 temporary top and hit as high as 112.24. Initial bias stays on the upside this week. Current up trend from 102.58 should target 61.8% projection of 102.58 to 111.65 from 109.11 at 114.71 next. On the downside, below 111.50 minor support will turn intraday bias neutral first. But near term outlook will stay bullish as long as 110.81 support holds.
In the bigger picture, corrective decline from 118.65 (2016 high) should have completed at 101.18 already. Rise from the 102.58 is seen as the third leg of the up trend from 101.18. Next target is 114.54 resistance and then 118.65 high. This will now be the preferred case as long as 108.71 support hold, even in case of pull back.
In the long term picture, the rise from 75.56 (2011 low) long term bottom to 125.85 (2015 high) is viewed as an impulsive move, no change in this view. Price actions from 125.85 are seen as a corrective pattern which could still extend. In case of deeper fall, downside should be contained by 61.8% retracement of 75.56 to 125.85 at 94.77. Up trend from 75.56 is expected to resume at a later stage for above 135.20/147.68 resistance zone.
GBP/USD Weekly Outlook
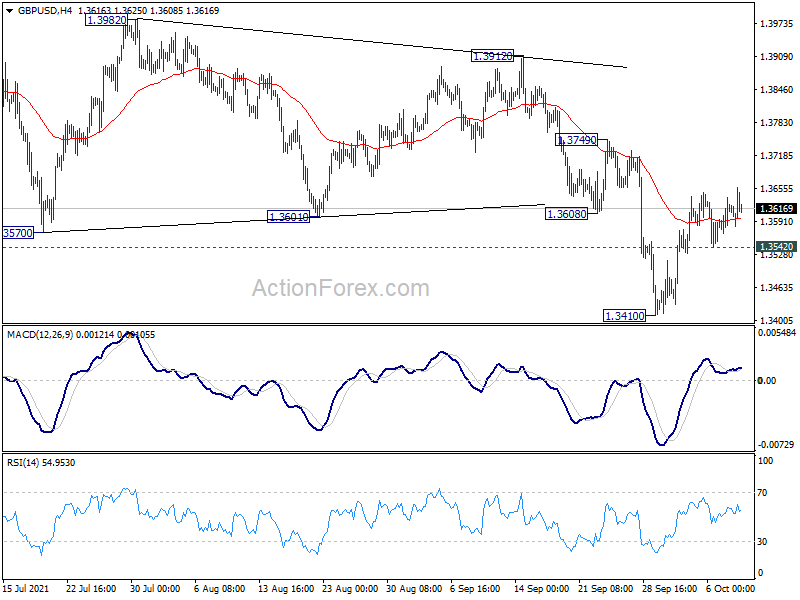
GBP/USD's rebound from 1.3410 extended higher last week. Further rise is mildly in favor this week as long as 1.3542 minor support holds. Sustained trading above 55 day EMA (now at 1.3727) will target 1.3912 key near term resistance. On the downside, below 1.3542 minor support will retain near term bearishness, and turn bias back to the downside for 1.3410 low.
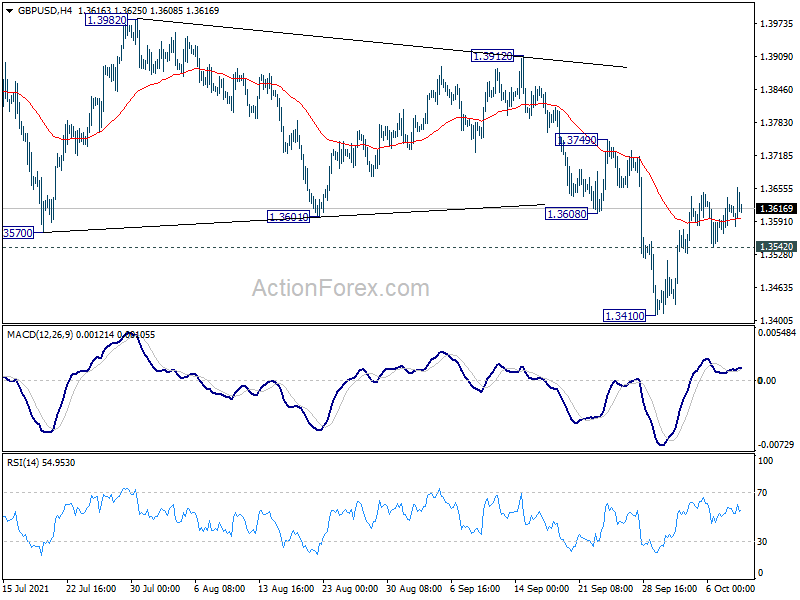
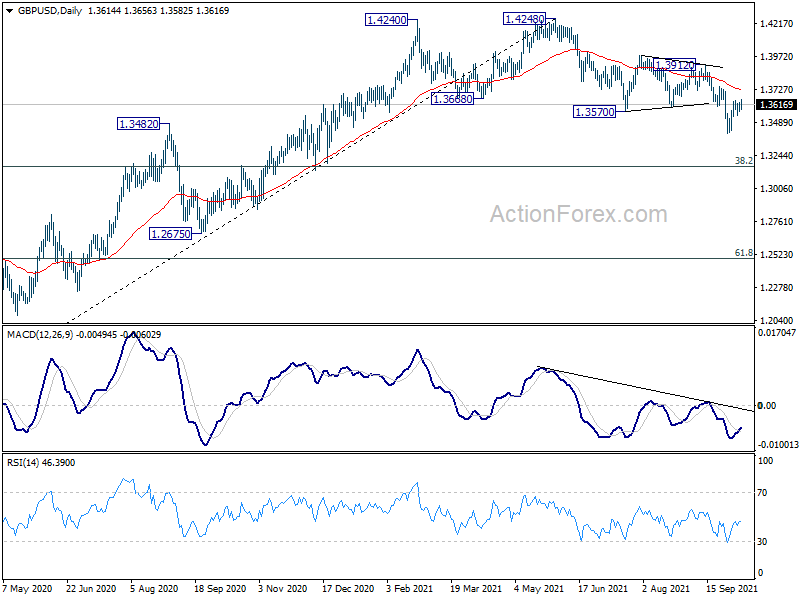
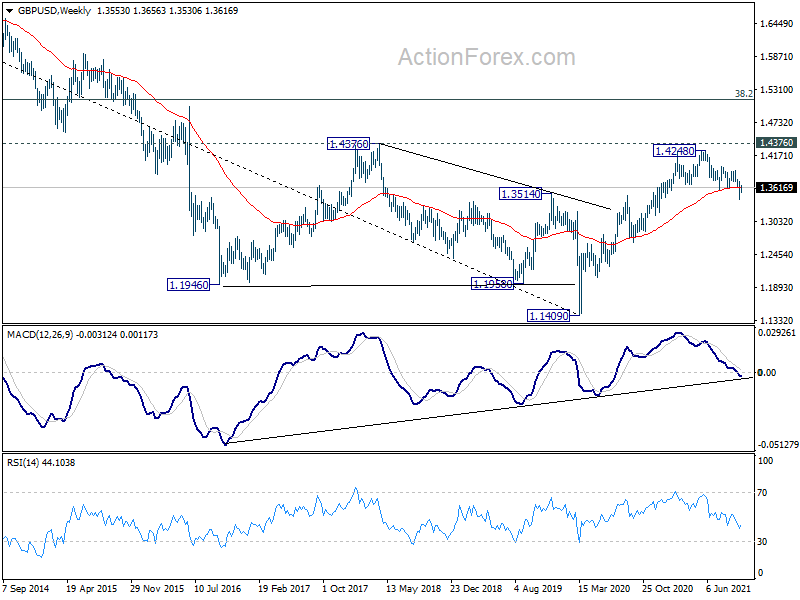
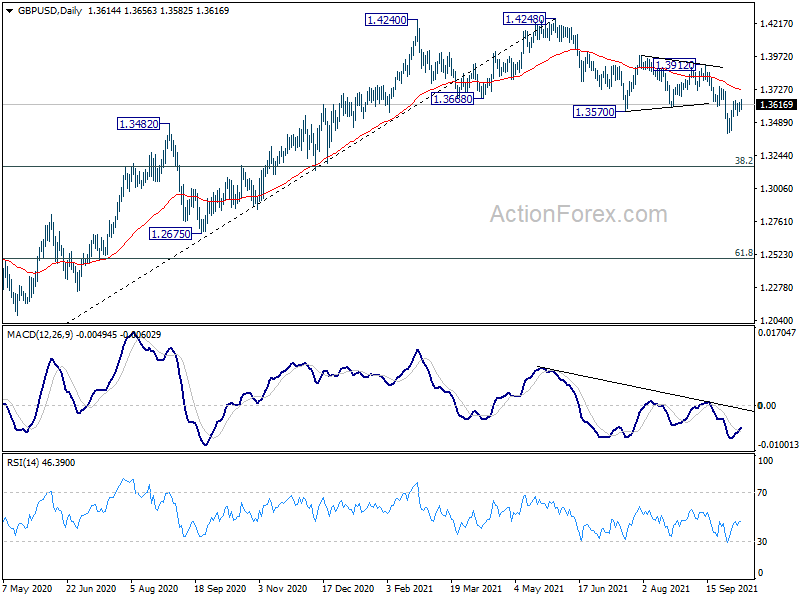
In the bigger picture, fall from 1.4248 is at least a correction to the up trend from 1.1409 (2020 low). Such correction could extend to 38.2% retracement of 1.1409 to 1.4248 at 1.3164 before completion. However, considering the rejection by 1.4376 key resistance (2018 high), sustained trading below 1.3164 will argue that it's indeed a bearish trend reversal and would target 61.8% retracement at 1.2493. Nevertheless, break of 1.3912 resistance will revive medium term bullishness and target 1.4248/4376 resistance zone again.
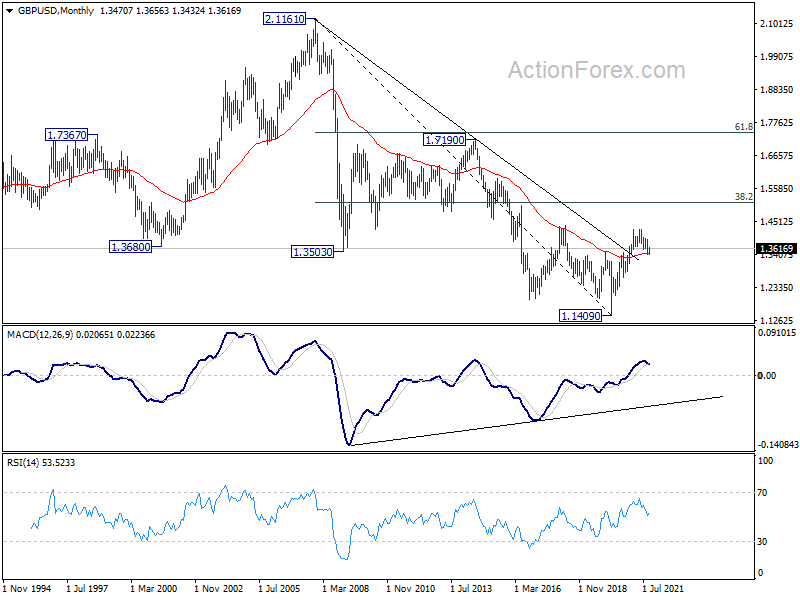
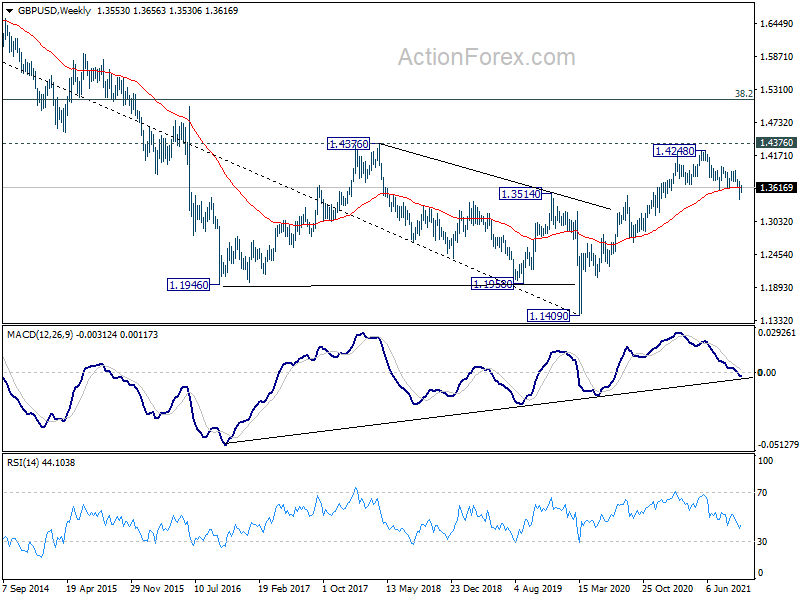
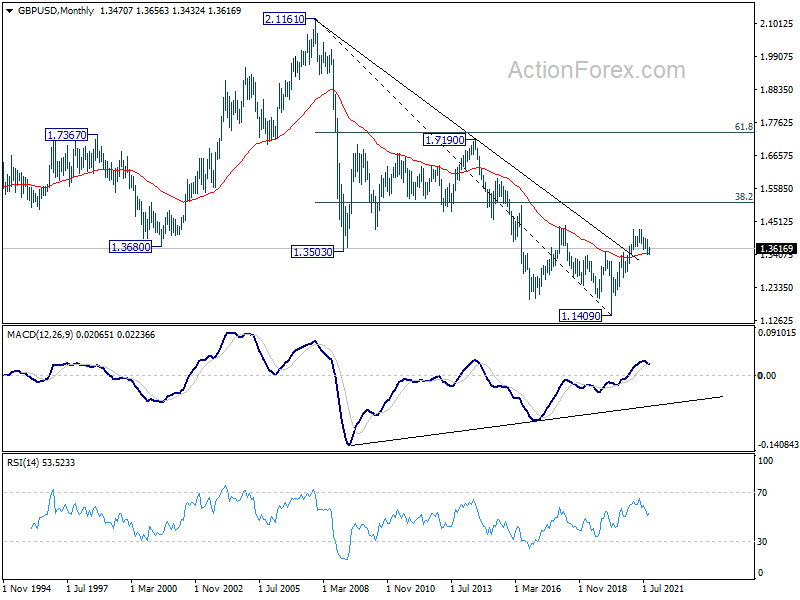
In the longer term picture, a long term bottom should be in place at 1.1409, on bullish convergence condition in monthly MACD. Rise from there would target 38.2% retracement of 2.1161 to 1.1409 at 1.5134. Reaction from there would reveal whether rise from 1.1409 is just a correction, or developing into a long term up trend.
USD/CHF Weekly Outlook
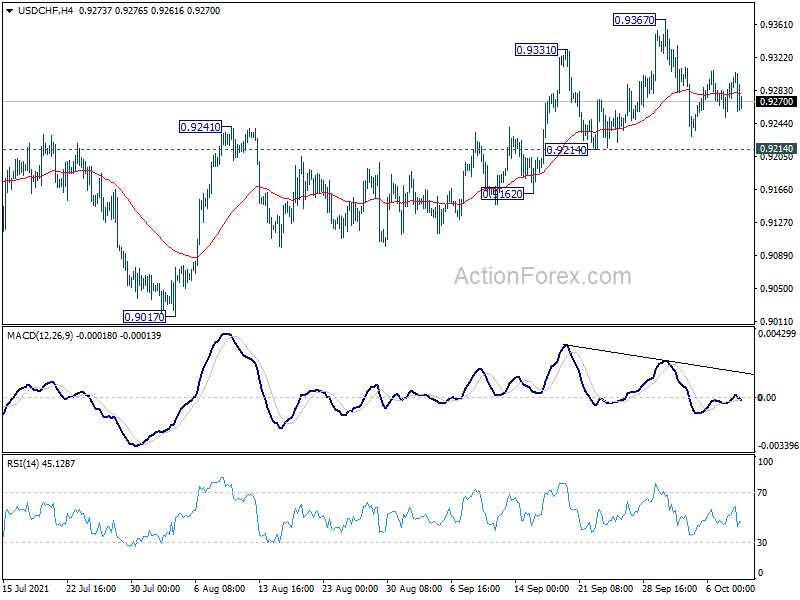
USD/CHF stayed in range below 0.9367 last week and outlook is unchanged. Initial bias remains neutral this week first. On the upside, break of 0.9367 will resume the rise from 0.8925 to 0.9471 key resistance next. On the downside, however, break of 0.9214 will turn bias back to the downside for 0.9017 support again.
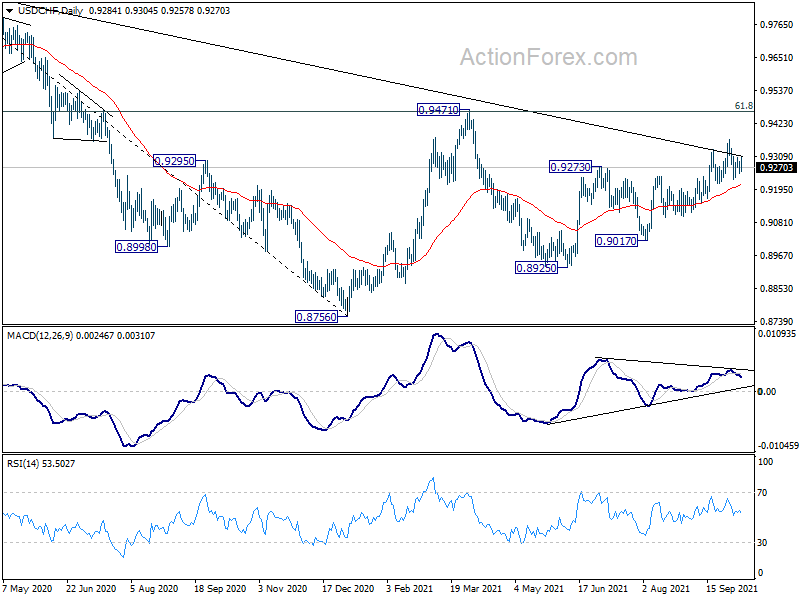
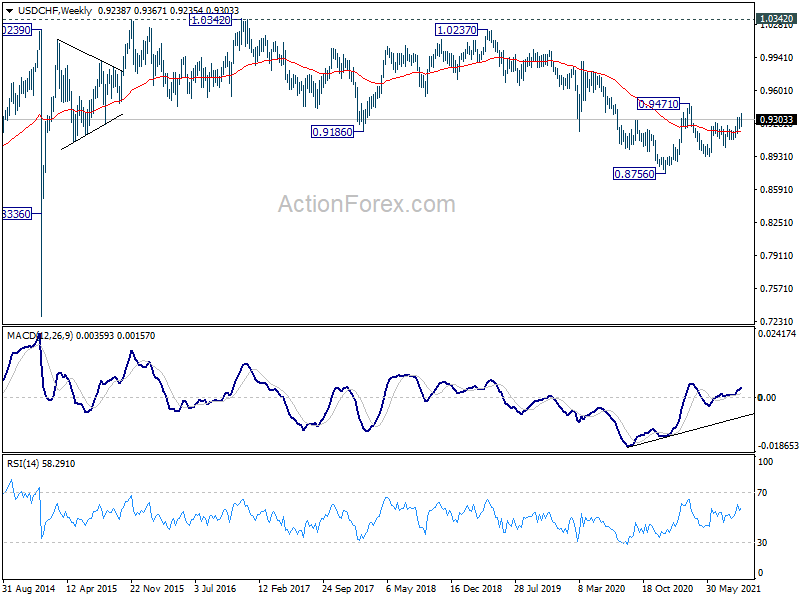
In the bigger picture, the strong rally above 55 week EMA (now at 0.9188) now tilts favor to the case of bullish trend reversal. That is, decline from 1.3042 (2016 high) is probably completed at 0.8756 already. Sustained break of 0.9471 resistance should confirm this case and pave the way to retest 1.0342 ahead. However, rejection by 0.9471 will mix up the outlook again and retain some medium term bearishness.
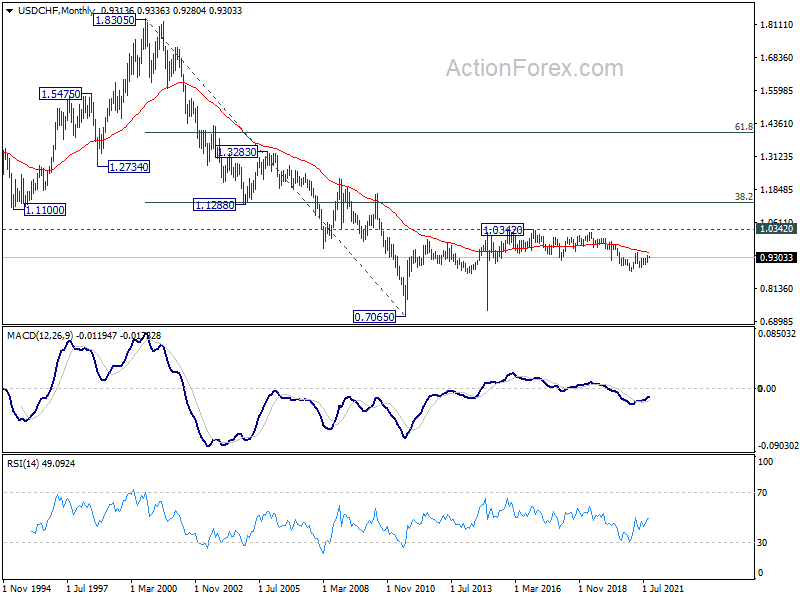
In the long term picture, price actions from 0.7065 (2011 low) are currently seen as developing into a long term corrective pattern, at least until a firm break of 1.0342 resistance.
AUD/USD Weekly Outlook
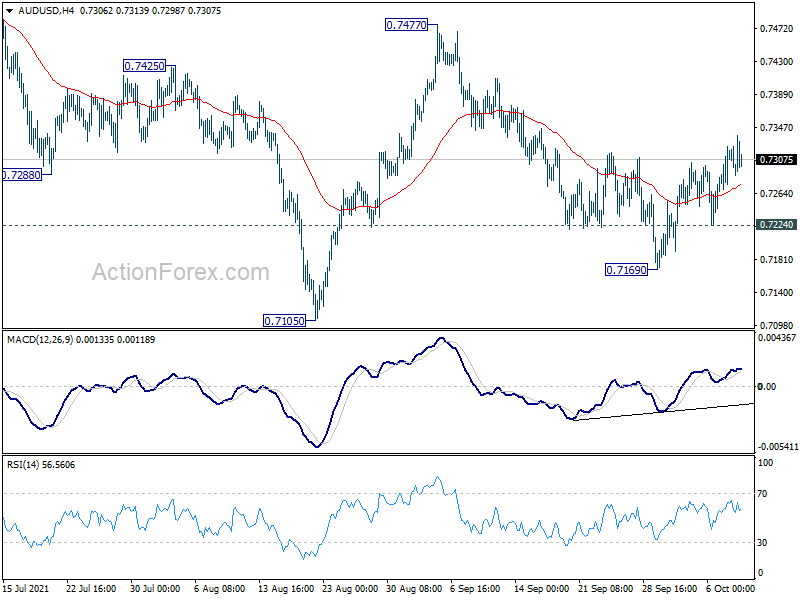
AUD/USD's rebound and break of 0.7315 resistance last week suggests that pull back from 0.7477 has completed at 0.7169 already. Initial bias is mildly on the upside this week for 0.7477 resistance first. Sustained break there will argue that larger decline from 0.8006 has completed and turn near term outlook bullish. On the downside, below 0.7224 minor support should resume the fall from 0.7477 through 0.7169 to retest 0.7105 low.
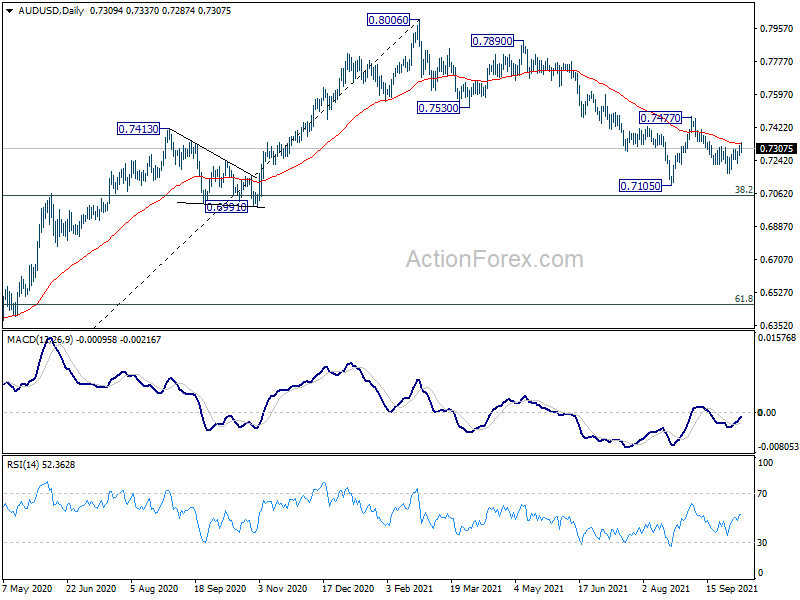
In the bigger picture, with 0.6991 cluster support (38.2% retracement of 0.5506 to 0.8006 at 0.7051) intact, we're seeing price action from 0.8006 as a correction only. That is, up trend from 0.5506 low would resume after the correction completes. In that case, main focus will be 0.8135 key resistance (2018 high). Sustained break there will carry larger bullish implications. However, sustained break of 0.6991 will argue that the whole medium term trend has indeed reversed.
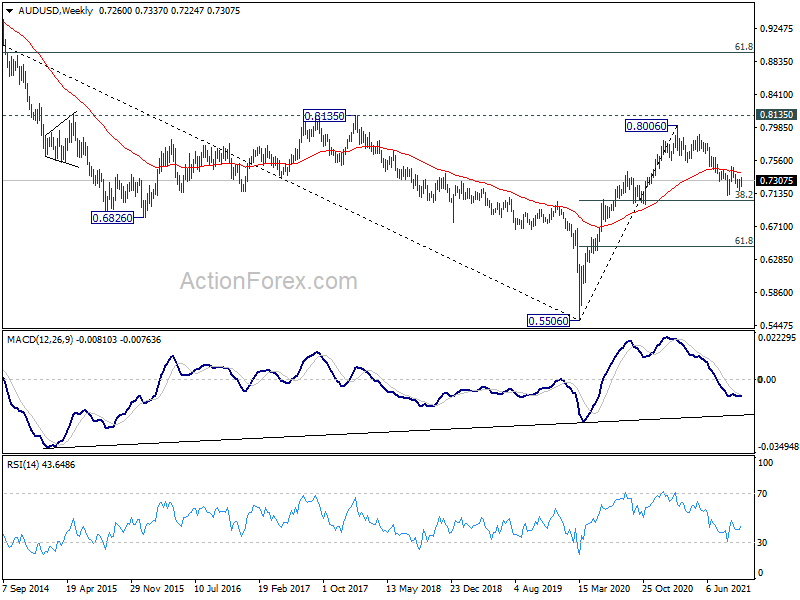
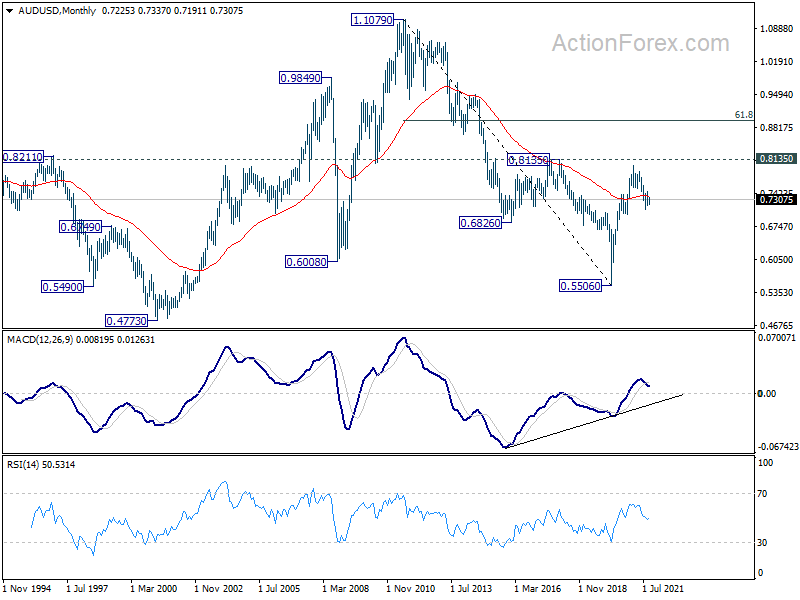
In the longer term picture, focus remains on 0.8135 structural resistance. Decisive break there will argue that rise from 0.5506 is developing into a long term up trend that reverses whole down trend from 1.1079 (2011 high). In that case, further rally would be seen to 61.8% retracement of 1.1079 to 0.5506 at 0.8950 and possibly above. Rejection by 0.8135 will keep long term outlook neutral at best.
USD/CAD Weekly Outlook
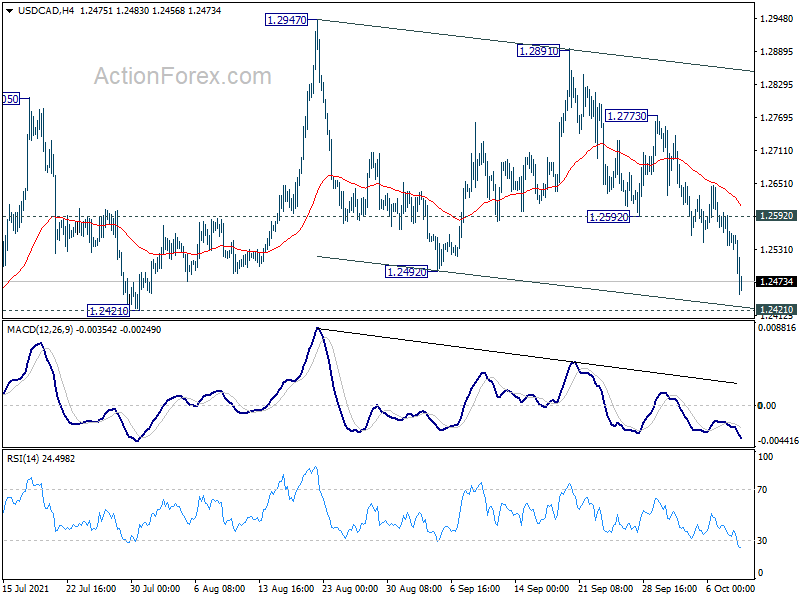
USD/CAD dropped sharply to as low as 1.2450 last week and there is no sign of bottoming yet. Initial bias stays on the downside this week for 1.2421 key structural support. Sustained break there will argue that whole choppy rise from 1.2005 has completed. Deeper fall could then be seen back to retest 1.2005 low. On the upside, though, break of 1.2592 support turned resistance will turn bias back to the upside for 1.2773 resistance first.
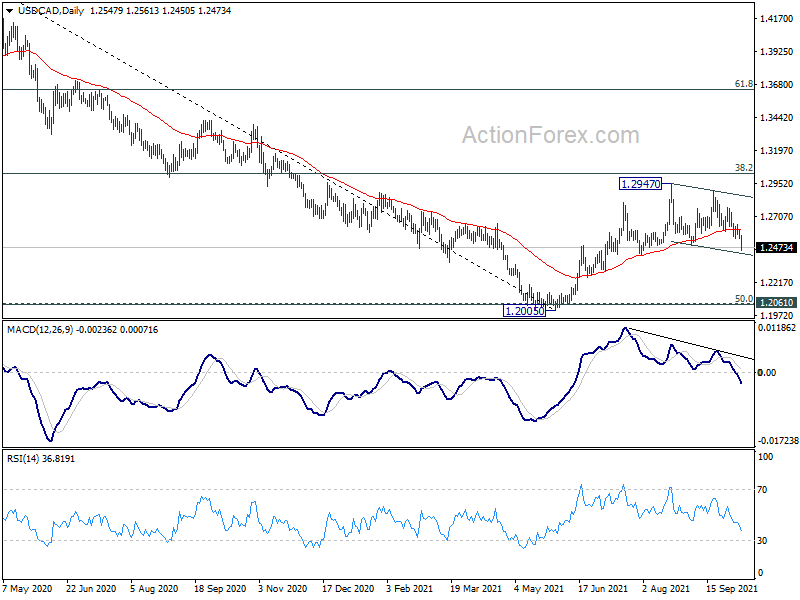
In the bigger picture, the failure to sustain above 55 week EMA (now at 1.2684) revives some medium term bearishness in USD/CAD. Still as long as 1.2005 support holds, we'd expect another rise ahead, to 38.2% retracement of 1.4667 to 1.2005 at 1.3022. Sustained break there will indicate larger bullish reversal. However, firm break of 1.2005 will resume the down trend from 1.4667 (2020 high) .
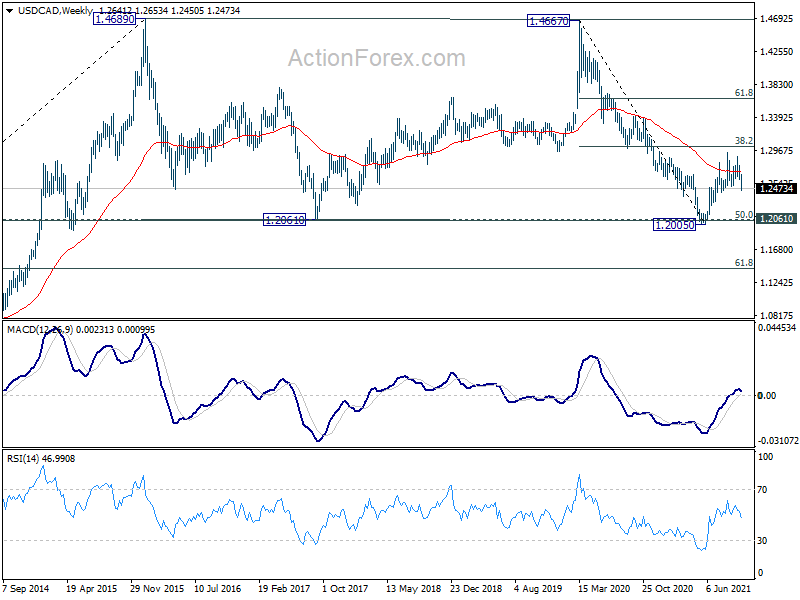
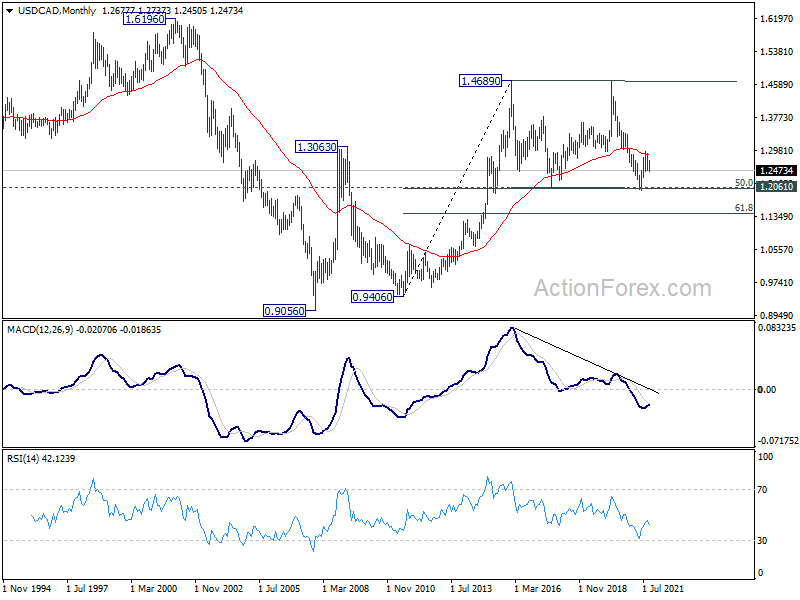
In the longer term picture, we're viewing price actions from 1.4689 as a consolidation pattern. Thus, up trend from 0.9506 (2007 low) is still expected to resume at a later stage. This will remain the favored case as long as 1.2061 support holds, which is close to 50% retracement of 0.9406 to 1.4689 at 1.2048. However, rejection by 55 month EMA, follow by firm break of 1.2061 support, will argue that USD/CAD has already started a long term down trend.
GBP/JPY Weekly Outlook
GBP/JPY's strong rally and break of 152.54 resistance last week argues that corrective pattern from 156.05 has completed already. Initial bias is mildly on the upside this week first. Further rally would be seen back to retest 156.05. On the downside, below 152.01 minor support will dampen the bullish case and turn intraday bias neutral again.
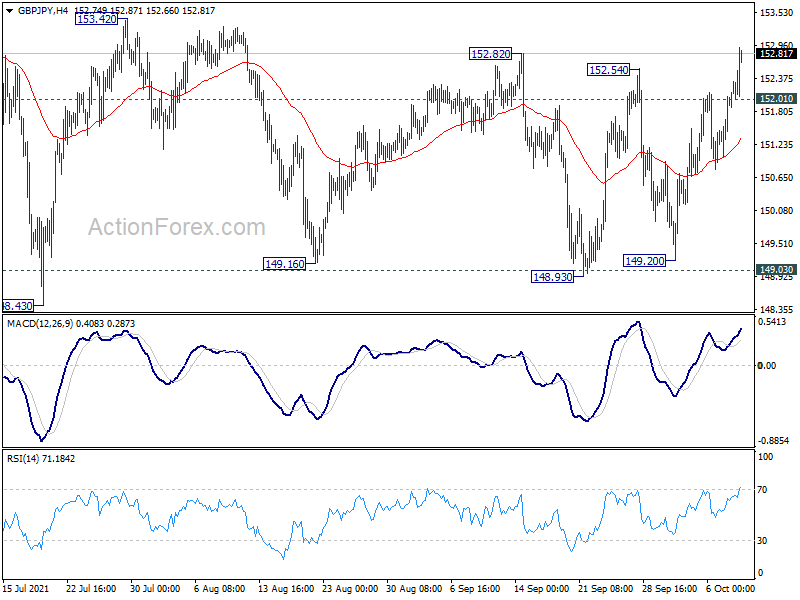
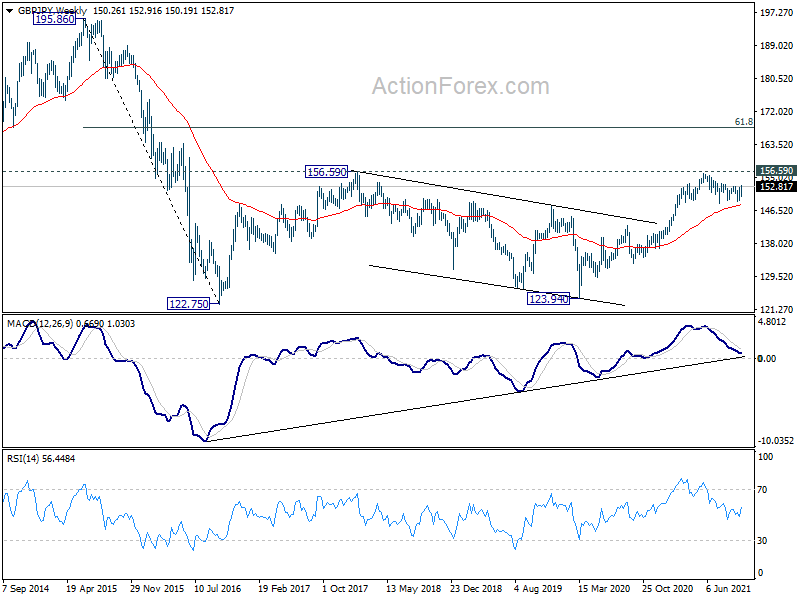
In the bigger picture, rise from 123.94 is seen as the third leg of the pattern from 122.75 (2016 low). As long as 149.03 support holds, such rise would still resume at a later stage. However, sustained break of 149.03 support will indicate rejection by 156.59 (2018 high). Fall from 156.05 would at least be correcting the whole rise from 123.94 (2020 low). Deeper fall would be seen back 38.2% retracement of 123.94 to 156.05 at 143.78 first.
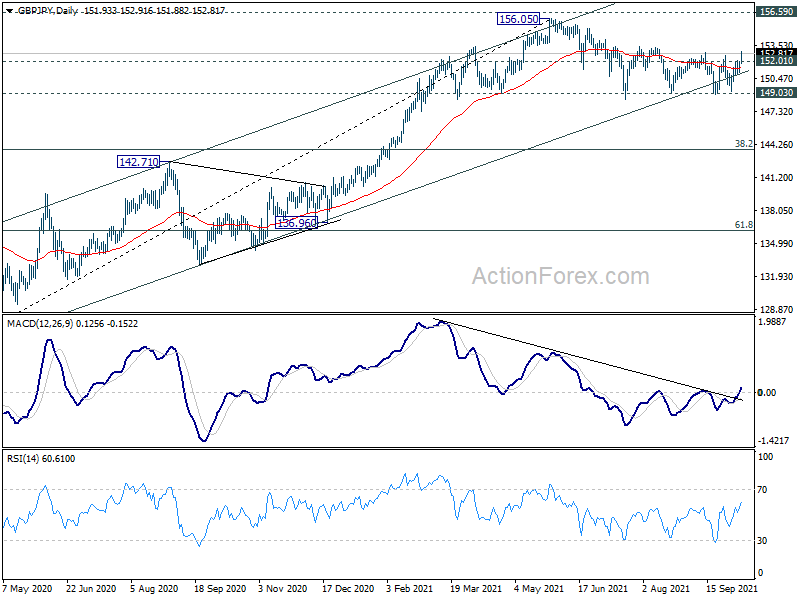
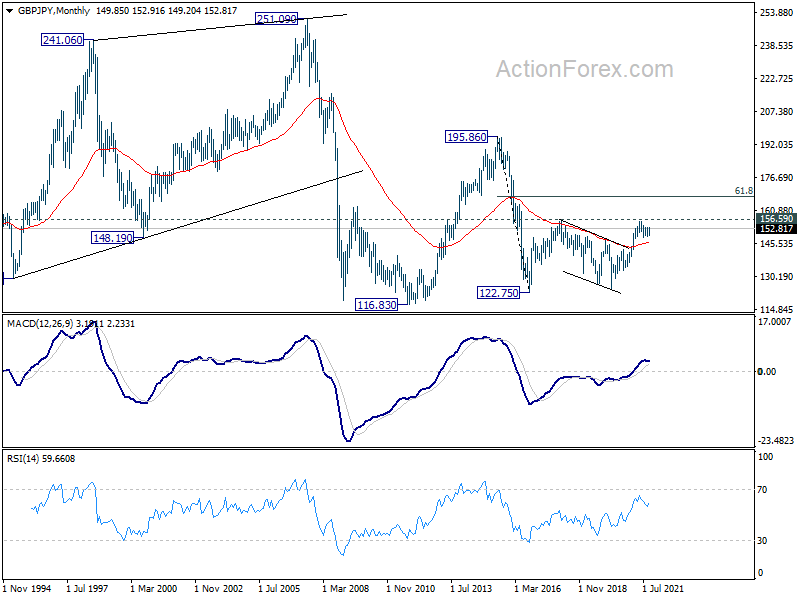
In the longer term picture, the strong break of 55 months EMA was an early sign of long term bullish reversal. Firm break of 156.69 resistance should now confirm the start of an up trend for 195.86 (2015 high). However, rejection by 156.69 will invalidate the bullish signal and keep long term outlook neutral first.
EUR/JPY Weekly Outlook
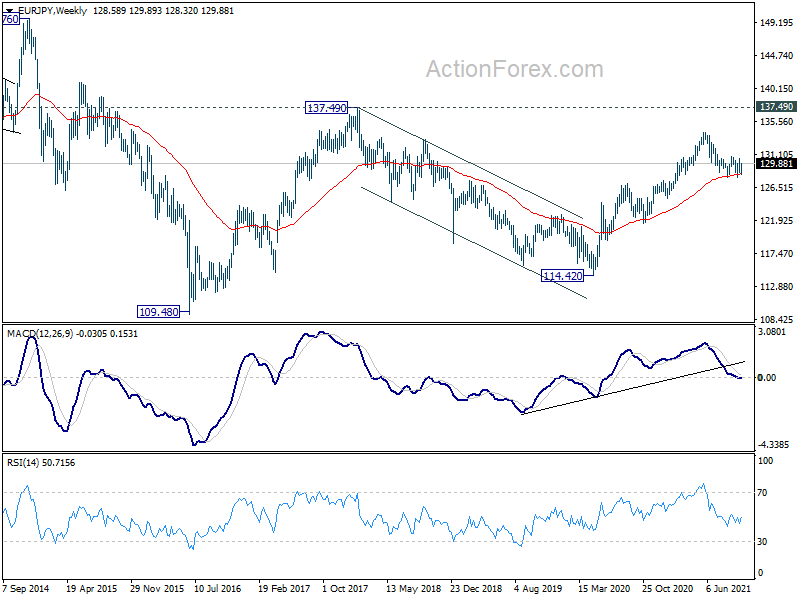
EUR/JPY stayed in range of 127.91/130.45 last week and outlook is unchanged. Initial bias remains neutral this week first. On the upside, decisive break of 130.45 resistance should indicate that the fall from 134.11 has completed. Further rise should be seen to 130.73 resistance first. Sustained break there will pave the way for retesting 134.11 high. On the downside, however, break of 127.91 should resume the fall from 134.11, through 127.91 support, to 137.07 resistance turned support next.
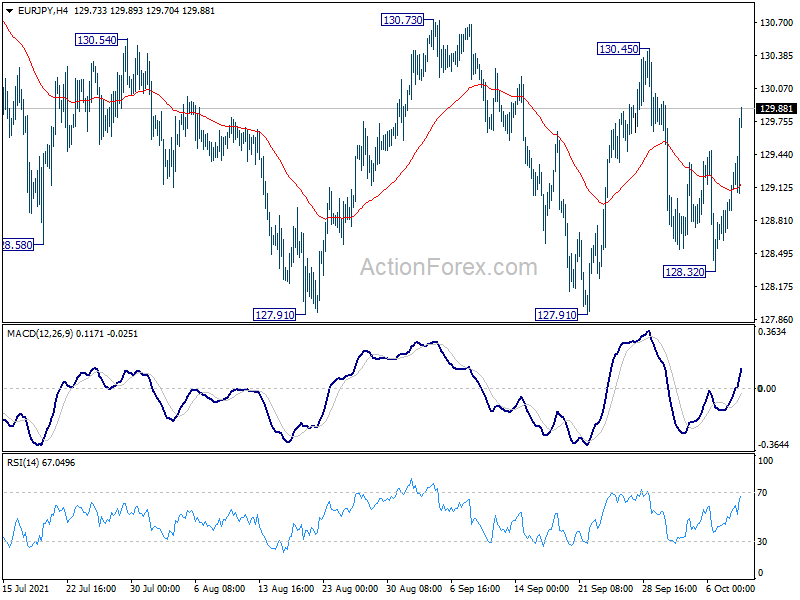
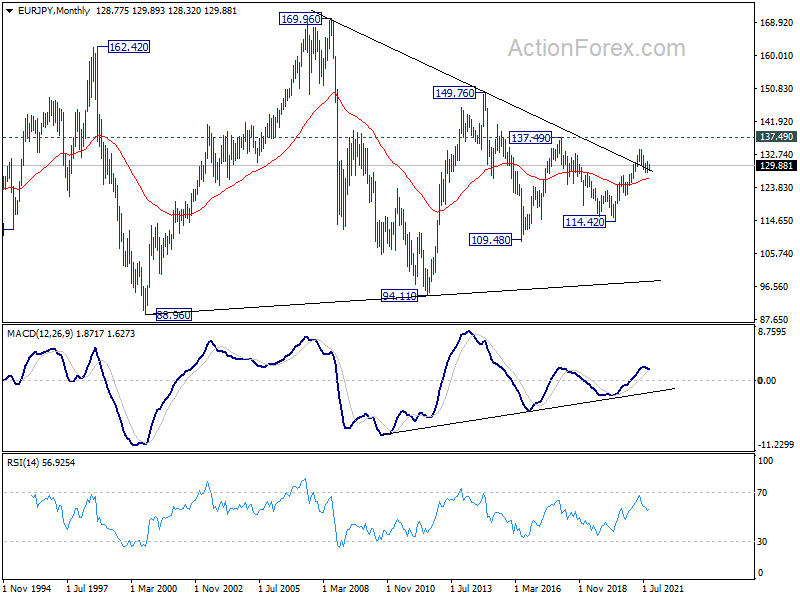
In the bigger picture, rise from 114.42 is seen as a medium term rising leg inside a long term sideway pattern. As long as 127.07 resistance turned support holds, further rise is still expected to retest 137.49 (2018 high). However, firm break of 127.07 will argue that the medium term trend has reversed, deeper fall would be seen to 61.8% retracement of 114.42 to 134.11 at 121.94.
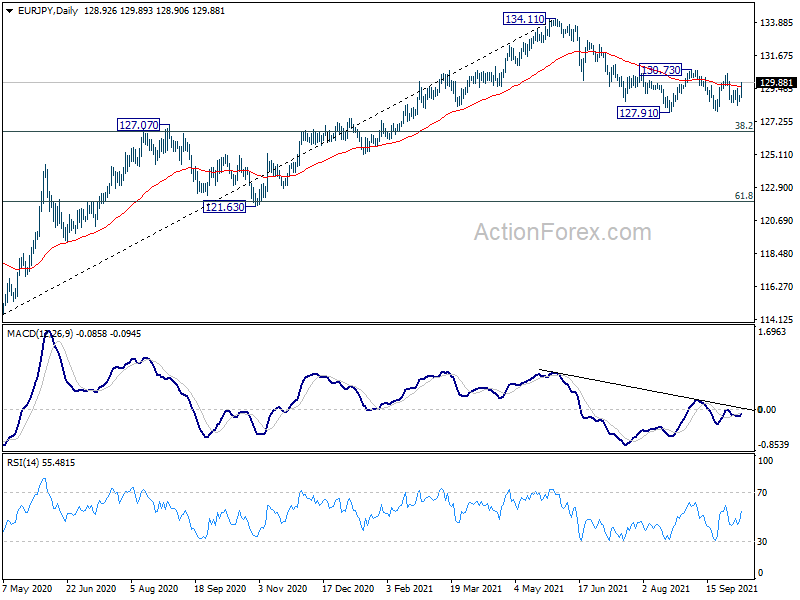
In the long term picture, EUR/JPY is staying in long term sideway pattern, established since 2000. Another rising leg in progress for 137.49 resistance and above.