
Sample Category Title
US Nonfarm Payrolls Back With a Double Release
In focus this week
In the US, the delayed October nonfarm payrolls (NFP) and full November jobs report are both due for release at 14:30 CET. We expect that delayed seasonal hiring will weigh on October NFP and forecast job growth at only 20k. Reversal of this effect likely supported November NFP growth to +50k. Both estimates are below the September pace, which is driven by a further slowdown in labour supply growth. We forecast November unemployment rate steady at 4.4%. October retail sales data and December flash PMIs are also due for release.
In the euro area, the flash PMI report for December is released. Activity in the final quarter of the year has been decent according to the latest two PMI reports that surpassed expectations. We expect the manufacturing PMI to rise slightly to 49.9 from 49.6 while we expect services to fall marginally to 53.3 from 53.6, thereby showing broadly the same picture of decent activity as in November and supporting the ECB's "good place" assessment of the euro area economy.
UK labour market data is released ahead of the Bank of England meeting on Thursday. Recent data has been soft with accelerating job loss and unemployment edging higher. This report will be key in combination with tomorrow's CPI data for the Bank of England to weigh the pros and cons for cutting the Bank Rate on Thursday.
Economic and market news
What happened overnight
In Japan, the manufacturing PMI remained in contractionary territory despite the increase to 49.7 from 48.7 in November. However, the increase was above market consensus of 48.8 and was the highest reading in three months. Demand conditions improved, however new export orders declined.
What happened over the weekend
In the Ukraine war, Ukrainian President Zelenskyy offered to drop demands of NATO membership and cede territory to Russia during talks in Berlin. US officials offered security guarantees as Zelenskyy said he would require "Article 5-like guarantees" from the US, Europe and other countries. A draft peace agreement was said to be close by US officials, although territorial issues remain. Over the weekend Russia appeared ready to reject all proposals from Ukraine and Europe throwing doubt on whether a ceasefire is reachable within the foreseeable future.
In France, the Senate approved a reworked 2026 budget bill. The bill is expected by the French government to push the public deficit to 5.3% of GDP and above the government's 4.7-5.0% target. The National Assembly overwhelmingly rejected the bill last month and a joint committee of seven lawmakers and seven senators will meet on Friday to attempt a compromise. If they fail to reach an agreement, the National Assembly will have the final say on the 2026 budget.
In the US, New York Fed President Williams said he sees interest rates as modestly restrictive, downside risks to employment and expects inflation to return to 2% by 2027. Fed Governor Miran held a speech offering insight into his diverging view on Fed policy rates. Miran argued that current empirical Fed models overvalue the neutral interest rate and due to rapid changes in immigration, tariffs and tax law, the real neutral rate is at 0%.
Equities: Global equity markets appeared broadly unchanged on the surface yesterday, but beneath the headline performance a clear rotation continued to unfold. The healthcare versus technology rotation persisted, with tech acting as the key drag: the sector ended the day around 1% lower, while healthcare outperformed, rising 1.3%. Overall, the S&P 500 closed down -0.2%, while the NASDAQ underperformed, ending the session -0.6%. In contrast, European equities delivered a positive performance, with the STOXX 600 finishing the day +0.7%. Overnight, most Asian equity indices are trading weaker.
FI and FX: There was modest movement in both US and European bond yields/interest rates ahead of the US labour market data today and the ECB, BoE and BoJ meetings on Thursday. We are still looking forward to the German funding requirement on Thursday and more details on France during the week.
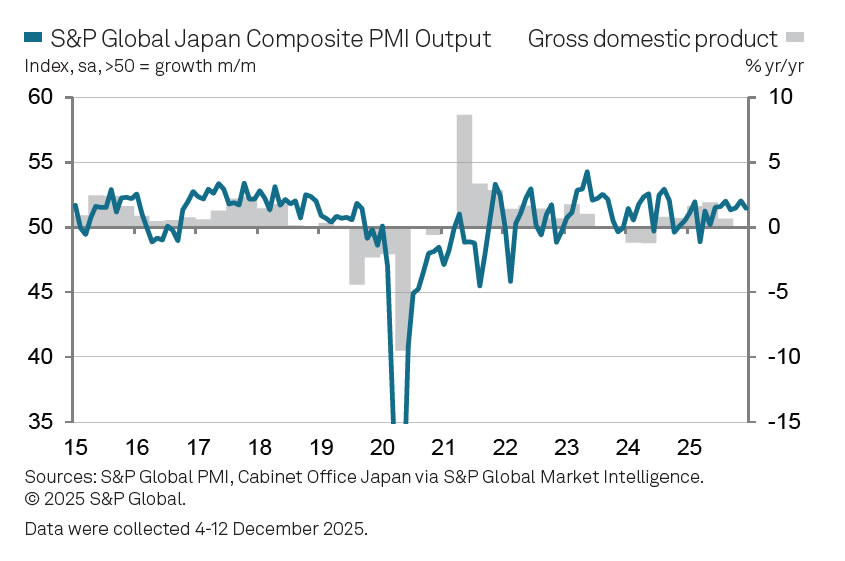
Japan’s PMI composite falls to 51.5, slowing momentum but manufacturing nears expansion
Japan’s December PMI data pointed to a modest cooling in overall momentum, while offering tentative signs of stabilization in manufacturing. PMI Manufacturing rose from 48.7 to 49.7. PMI Services eased from 53.2 to 52.5, while PMI Composite slipped from 52.0 to 51.5, indicating slower but still positive private-sector growth.
According to S&P Global, Japan’s private sector ended the year on a relatively strong footing, with output continuing to expand and new business rising further. Firms responded by stepping up hiring, with employment growth accelerating to its fastest pace in more than a year and a half. Growth remained concentrated in services, though the decline in manufacturing output and sales softened noticeable.
Forward-looking signals were more cautious. Business confidence weakened, particularly among manufacturers, reflecting subdued foreign demand and concerns about the outlook for 2026. At the same time, cost pressures intensified, with input prices rising at the fastest pace since April. Firms responded by raising output charges "at a solid pace".
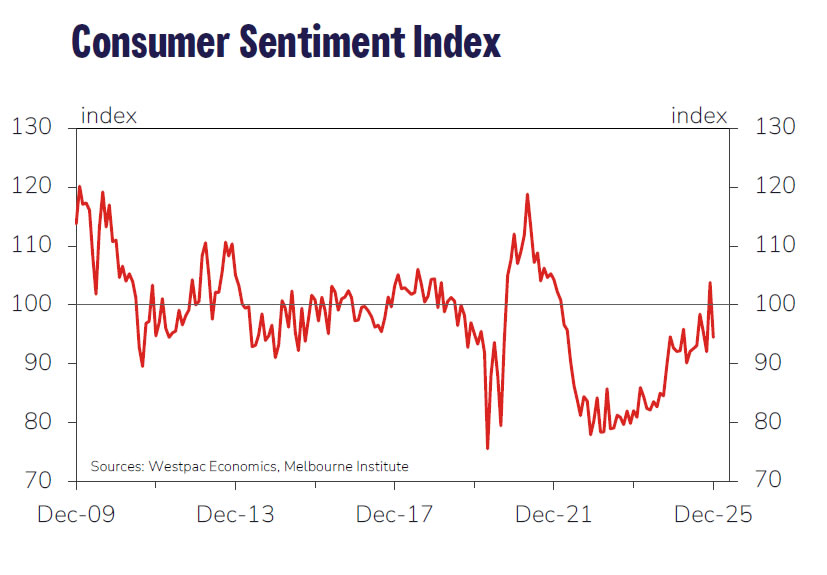
Australia Westpac consumer sentiment falls back to 94.5, bounce proves short-lived
Australian consumer confidence fell sharply in December, reversing November’s brief improvement. The Westpac Consumer Sentiment Index dropped -9.0% mom to 94.5, slipping back toward levels seen prior to last month’s surprise bounce. The pullback leaves sentiment only in “cautiously pessimistic” territory as the year comes to a close.
Westpac noted that while confidence has improved meaningfully from the deep and prolonged pessimism that dominated much of 2024, households remain reluctant to shift into outright optimism. The November rebound marked the first net positive reading since the economy reopened after the pandemic, but the latest data suggests that underlying confidence remains fragile and easily unsettled.
The survey reinforces a cautious backdrop for the RBA ahead of its February 2–3 meeting. While inflation has picked up recently, there are few signs that tight labor markets or strong consumer demand are driving the move. Instead, administered prices outside the reach of monetary policy have been a key factor. As those pressures fade, inflation is expected to resume its path toward the midpoint of the target range, though policymakers have warned that if normalization proves slow, rates may need to stay on hold for longer, with hikes still a live contingency.
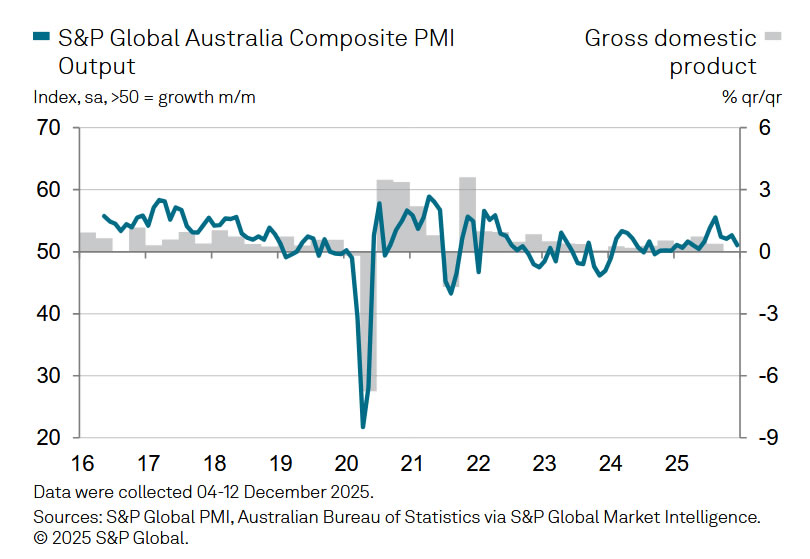
Australia PM composite falls to 51.1, growth cooling but persistent price pressures
Australia’s PMI readings for December pointed to moderating growth momentum toward year-end. PMI Manufacturing rose from 51.6 to 52.2, signaling a stronger expansion in factory activity. PMI Services slipped from 52.8 to 51.0. As a result, PMI Composite eased from 52.6 to 51.1, the lowest level in seven months.
The slowdown in overall activity was accompanied by more encouraging details beneath the surface. According to S&P Global, new orders continued to rise at a solid pace, while business confidence improved in December. Employment growth also remained robust, with job creation sustained at faster rates across both manufacturing and services, suggesting firms remain confident enough in demand to continue hiring.
Inflation signals, however, firmed again. Cost pressures intensified for Australian businesses, prompting companies to raise output prices more quickly in an effort to "defend their margins". As a result, output price inflation returned to its long-run average after two months of subdued increases.
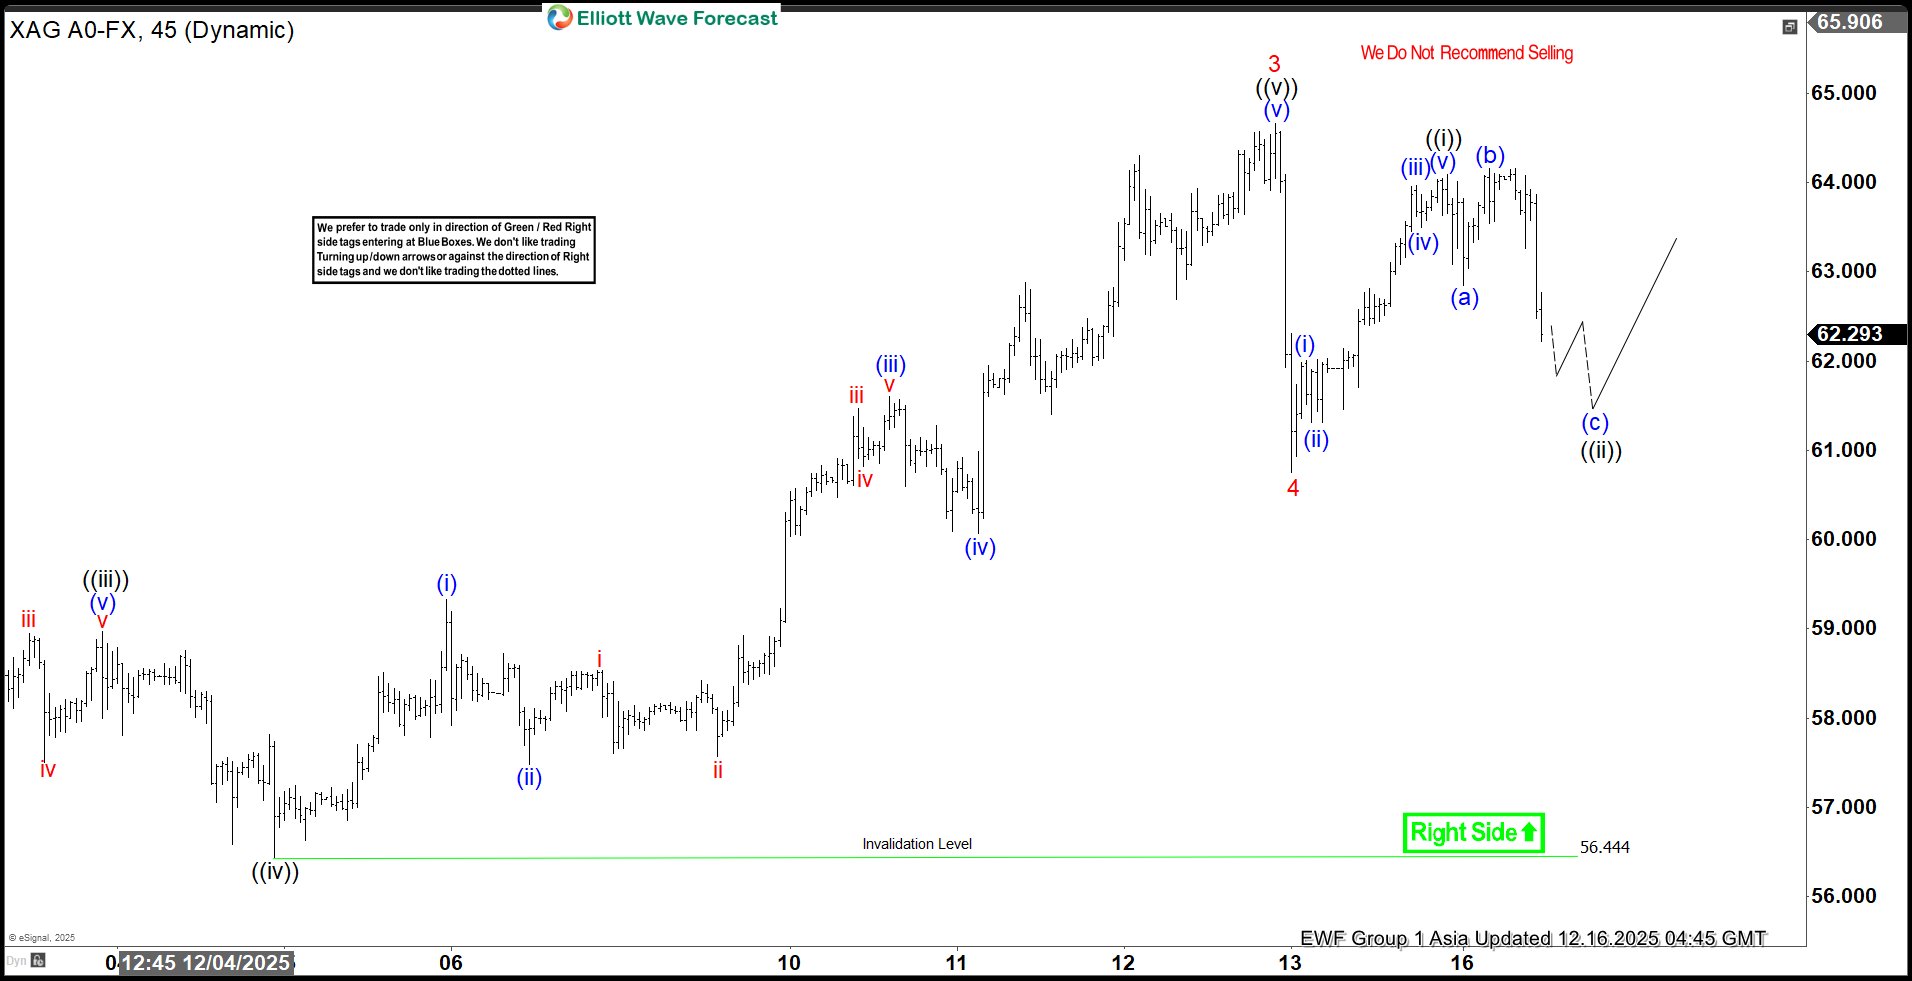
Silver (XAGUSD) Pullback Seen as Buying Opportunity Amid Record Breaking Rally
The cycle in Silver (XAGUSD) from the October 28, 2025 low remains in progress as a clear five‑wave impulse Elliott Wave sequence. From that low, wave 1 advanced to $49.36 before a corrective decline in wave 2 concluded at $46.88. This initial correction set the stage for a stronger rally. The metal then entered wave 3, which unfolded with internal subdivision into five smaller waves, reflecting the classic structure of an impulsive advance.
From the wave 2 low, wave ((i)) reached $54.39, followed by a pullback in wave ((ii)) that ended at $48.60. Momentum resumed in wave ((iii)), which carried prices to $58.94, as confirmed by the 45‑minute chart. A modest retracement in wave ((iv)) found support at $56.44, and the subsequent rise in wave ((v)) extended sharply to $64.65. This completed wave 3 at a higher degree, reinforcing the bullish sequence.
Afterward, the market experienced a corrective phase in wave 4, which is proposed to have ended at $60.74. This decline appears orderly and consistent with the broader impulsive framework. In the near term, as long as the pivot at $56.44 remains intact, the expectation is for Silver to continue its upward trajectory. The structure suggests further extension higher, with buyers likely to re‑emerge on any pullback.
Silver (XAGUSD) 60-Minute Elliott Wave Chart From 12.16.2025
XAGUSD Elliott Wave Video:
https://www.youtube.com/watch?v=jKh8qsyi10Y
Gold Jumps and Holds—Are Bulls Targeting Fresh Highs?
Key Highlights
- Gold started a fresh surge above the $4,200 resistance.
- The bulls could now aim for a move above $4,365.
- WTI Crude Oil prices remained in the red zone and declined below $58.00.
- EUR/USD is holding gains and might climb above 1.1800.
Gold Price Technical Analysis
Gold prices started a fresh surge above $4,200 and $4,220 against the US Dollar. It settled above $4,300 to enter a bullish zone.
The 4-hour chart of XAU/USD indicates that the price cleared a key contracting triangle with resistance at $4,230 to enter a positive zone. The bulls even pumped the price above $4,320. The price tested $4,350 before there was a consolidation phase.
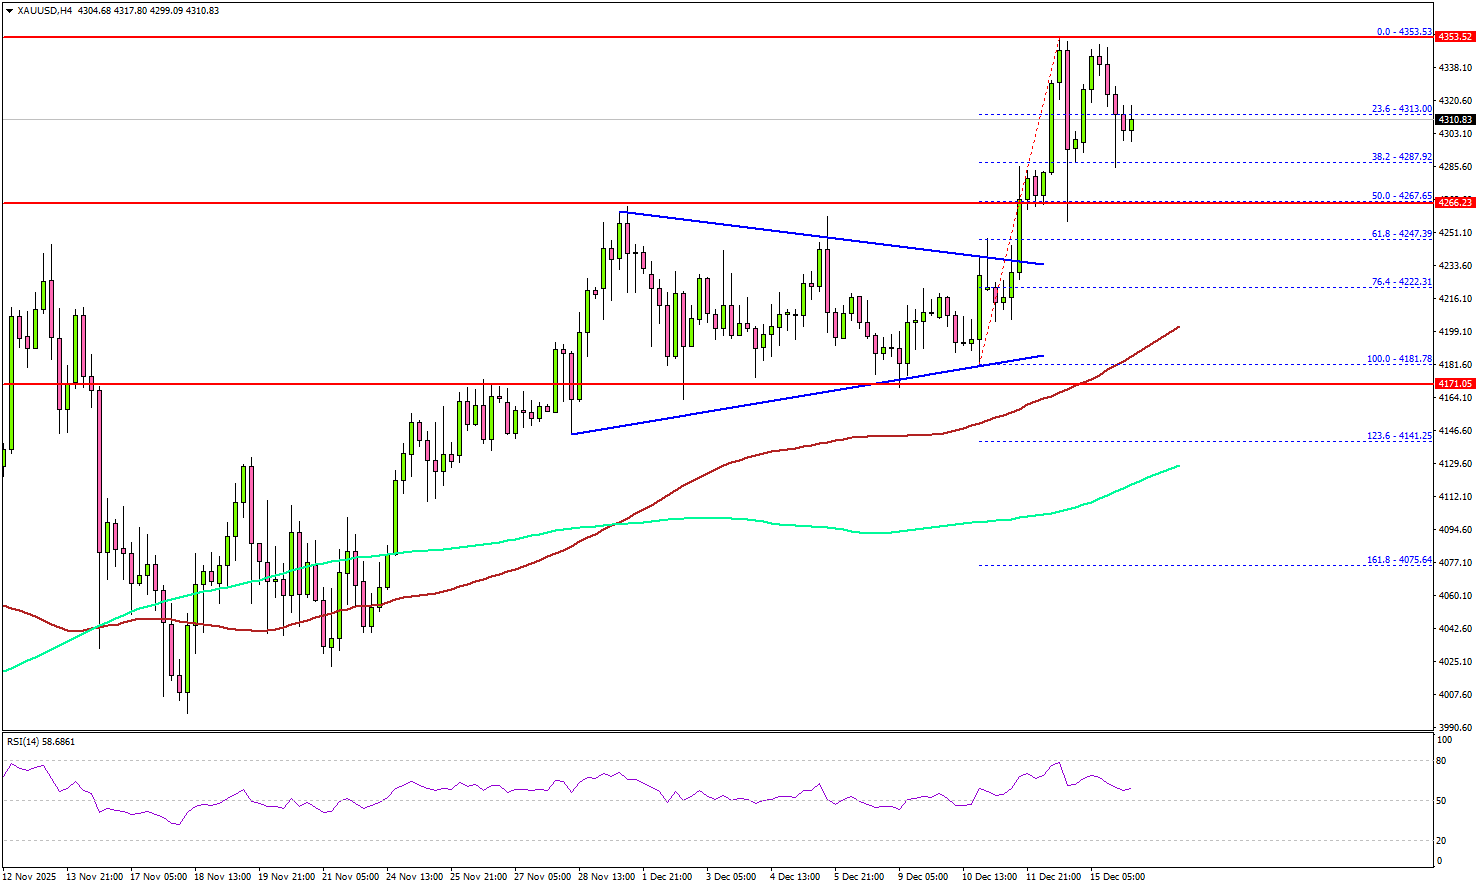
On the upside, immediate resistance is near the $4,350 level. The next major resistance sits near the $4,365 level. A clear move above $4,365 could open the doors for more upside. In the stated case, the bulls could aim for a move toward $4,400.
If there is a pullback, Gold might find bids near the $4,300 level. The first major support sits at $4,285, below which the price might slide to $4,265.
The main support sits at $4,250. Any more losses might call for a test of the 100 Simple Moving Average (red, 4 hours) or even the 200 Simple Moving Average (green, 4 hours).
Looking at WTI Crude Oil, the price attempted a decent recovery wave, but the bears remained active below the $60.00 level.
Economic Releases to Watch Today
- US nonfarm payrolls for Nov 2025 – Forecast 40K, versus 119K previous.
- US Unemployment Rate for Nov 2025 - Forecast 4.4%, versus 4.4% previous.
- US Retail Sales for Oct 2025 (MoM) – Forecast +0.2%, versus +0.2% previous.
NFP Preview: Rate Path Divergence & Implications for the DXY, Gold (XAU/USD)
The Non-Farm Payrolls (NFP) report, which comes out on December 16, 2025, is the first full look at the US job market since September, and it will be a crucial factor in determining the Federal Reserve's (Fed) strategy for interest rates throughout 2026.
This jobs data will either prove that the Fed was right to implement the controversial rate cuts of 75 basis points since September, or it will suggest that the central bank was too aggressive in cutting rates.
The report is complicated because it includes both October and November job numbers and is slightly skewed by issues like the recent government shutdown and delayed resignations of federal workers.
For this reason, experts suggest ignoring the main unemployment rate and focusing instead on the number of new jobs added in November and the changes in Average Hourly Earnings (AHE), which track how much wages are rising.
Significant market swings are expected because market participants are betting on much deeper rate cuts in 2026 than the Fed has officially planned. This creates a unique situation where Gold could rise strongly regardless of the outcome, while the currently low US Dollar has a greater potential to suddenly jump in value.
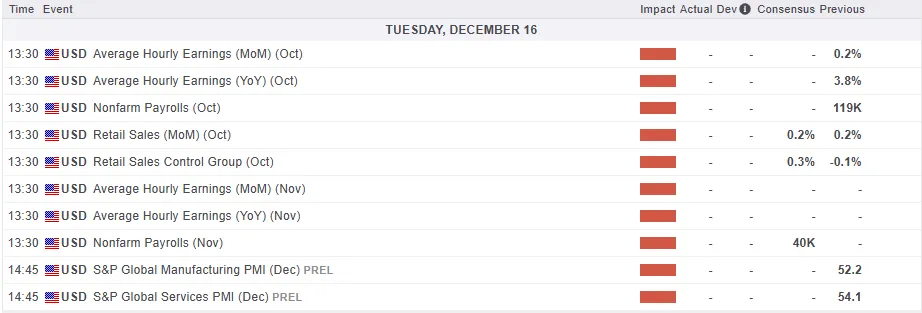
For all market-moving economic releases and events, see the MarketPulse Economic Calendar. (click to enlarge)
Complex Expectations: Analyzing the Dual-Month Release and Distortion
The upcoming NFP report will release two months of jobs data simultaneously, though the most important figure is for November. The jobs number for October is expected to be a loss of about 10,000 jobs, but this is largely ignored because it's due to a technical issue: many federal workers who resigned had their departure dates delayed, resulting in a temporary, one-time drop in the count.
The crucial expectation for November NFP is a modest recovery, adding about 50,000 jobs, which is a major slowdown from the 119,000 jobs gained in September. This expected number is uncertain, with forecasts ranging widely, and the risk is tilted toward a lower number, especially after a separate report (the ADP) unexpectedly showed a loss of 32,000 private sector jobs.
A key concern for the Fed is inflation, which they measure through Average Hourly Earnings (AHE), or wage growth. This is expected to rise by 0.3% from the previous month, translating to an annual growth of 3.7%. Since the main unemployment rate is unreliable right now, AHE is the clearest signal the Fed has to judge how tight the job market is and how high the risk of inflation is.
Finally, the official Unemployment Rate for October will not be released at all because the government shutdown prevented the necessary data from being collected. The rate for November is expected to suddenly spike to around 4.5% to 4.7%.
However, this sharp increase is not considered a true sign of economic weakness but rather a temporary glitch: federal employees who were temporarily sent home (furloughed) during the reference week of the government shutdown will be mistakenly counted as unemployed. Because of this issue, the market is expected to largely ignore the high unemployment rate and focus primarily on the raw payrolls number and the wage inflation figures.
Policy Crossroads: The Federal Reserve’s 2026 Rate Path Divergence
The market currently has a very different view from the Fed on interest rates for 2026, which is expected to create high market volatility. Traders are betting that the Fed will cut rates two more times by September 2026. However, the Fed's own latest forecast (Dot Plot) suggests they only expect one cut for the entire year of 2026.
If the November jobs report is stronger than expected, the market will be forced to quickly reduce its bets on those extra rate cuts and move closer to the Fed's more cautious projection. This would strengthen the argument from some Fed members who believed the central bank was in a "comfortable position to wait" before cutting rates.
This risk of the market having to "reprice" its expectations is why the NFP report is considered the single most important event for setting the tone of monetary policy in the first part of 2026.
Potential implications for the US Dollar Index (DXY) & Gold
The market's reaction to the NFP report will not be uniform, but rather dependent on the deviation from consensus forecasts. These are the potential reactions we could see depending on how the data comes out and is received.

Source: Table Created by Zain Vawda
US Dollar (DXY) Strategy: Asymmetric Upside Risk
The US Dollar Index (DXY) is currently in a near-term downtrend and is technically oversold due to aggressive market pricing of future rate cuts. This technical positioning creates an asymmetric risk profile:
- Weak Data Scenario: A weak NFP print (e.g., net job losses) validates the dovish market stance. Downside momentum would accelerate, targeting the "measured move" objective near prior support at 97.60.
- Strong Data Scenario: A stronger-than-expected November payrolls report (e.g., above 75k) would trigger a rapid unwinding of dovish expectations. This necessitates a violent short-covering bounce for the USD, potentially driving DXY back toward the 200-day Simple Moving Average (SMA) at 99.30.
US Dollar Index (DXY) Daily Chart, December 15, 2025
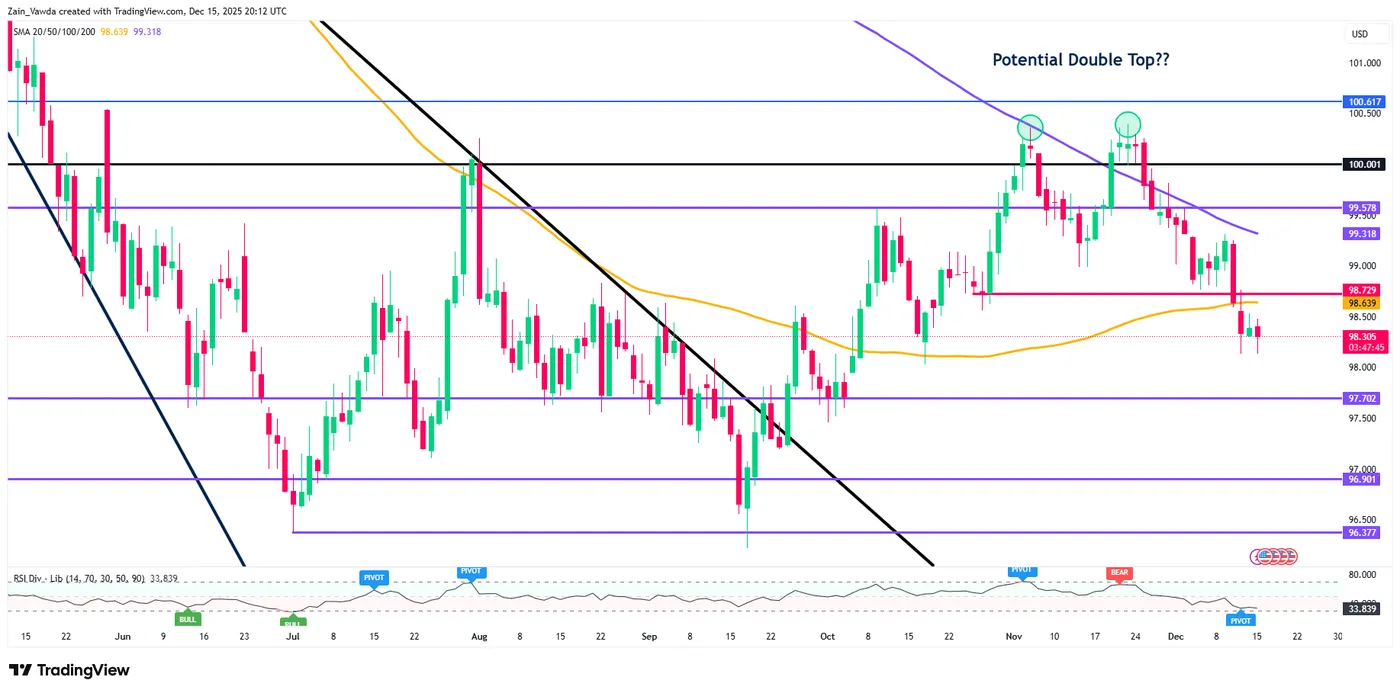
Source: TradingView (click to enlarge)
Gold (XAU/USD) Strategy: The Dual Bullish Catalyst
Gold exhibits the potential for a rally regardless of the NFP outcome due to the unique policy environment. A strong Dollar traditionally controls Gold prices, while a weaker Dollar pushes them up. However, the current political and policy uncertainty provides two avenues for gains:
- Dovish Catalyst (Weak NFP): Weak employment figures lead to lower interest rates and a weaker dollar, diminishing the opportunity cost of holding the non-yielding metal.
- Policy Error Catalyst (Strong NFP): If the data is surprisingly strong, it suggests the Fed may have cut rates "too far too fast". This shift in narrative from a controlled slowdown to policy error ignites fears of future inflationary acceleration. Gold then trades as an inflation hedge and an asset favored when confidence in financial assets or prudent policymaking declines, which could boost prices toward October’s record high. This structural bid under Gold suggests continuation toward resistance zones (e.g., 4380)
Gold Four-Hour Chart, December 15, 2025
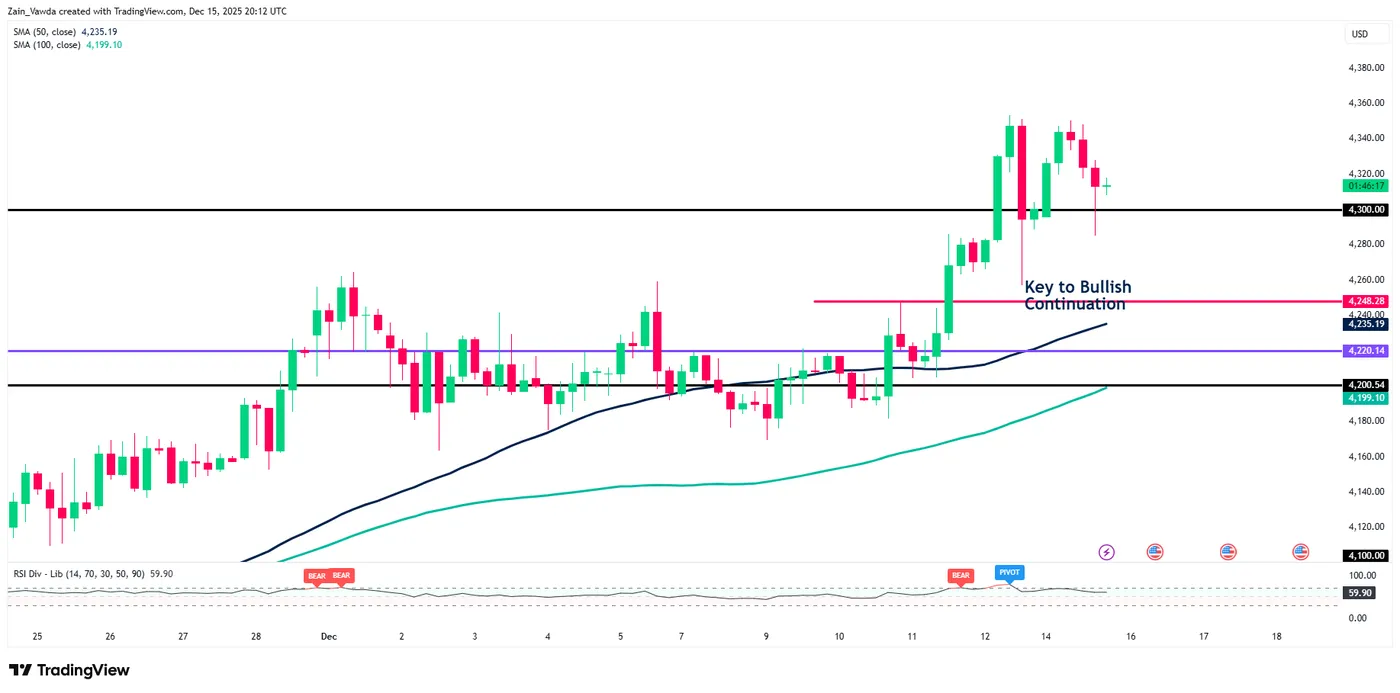
Source: TradingView (click to enlarge)
Fed’s Collins explicitly endorses pause bias in FOMC guidance
Boston Fed President Susan Collins said she supported last week’s FOMC decision to lower the federal funds rate by 25 basis points, but emphasized that the decision was"a close call". Incoming information suggests the balance of risks has shifted modestly, with scenarios involving a notable further rise in inflation "seem somewhat less likely".
Nevertheless, Collins emphasized "it's important to me" that the updated language now echoes the December 2024 statement, which "preceded a pause in cutting rates".
Looking ahead, she said that with policy now at the lower end of a mildly restrictive range, she would want "greater clarity" on the inflation outlook before supporting further adjustments.
US Stock Index Outlook: Weak sentiment ahead of NFP
Friday provided a sharp shift in post-FOMC flows. The strong rallies in Equities—particularly in defensive sectors—turned sour as Fed members began to voice concerns regarding their recent decision.
The bounce in the Debasement Trade following the Fed meeting came as a surprise, especially given that the cut and projections were more defensive than aggressive. Indeed, making a dovish case for 2026 is proving difficult, with the recent Dot Plot indicating only 1 to 2 cuts for the coming year.
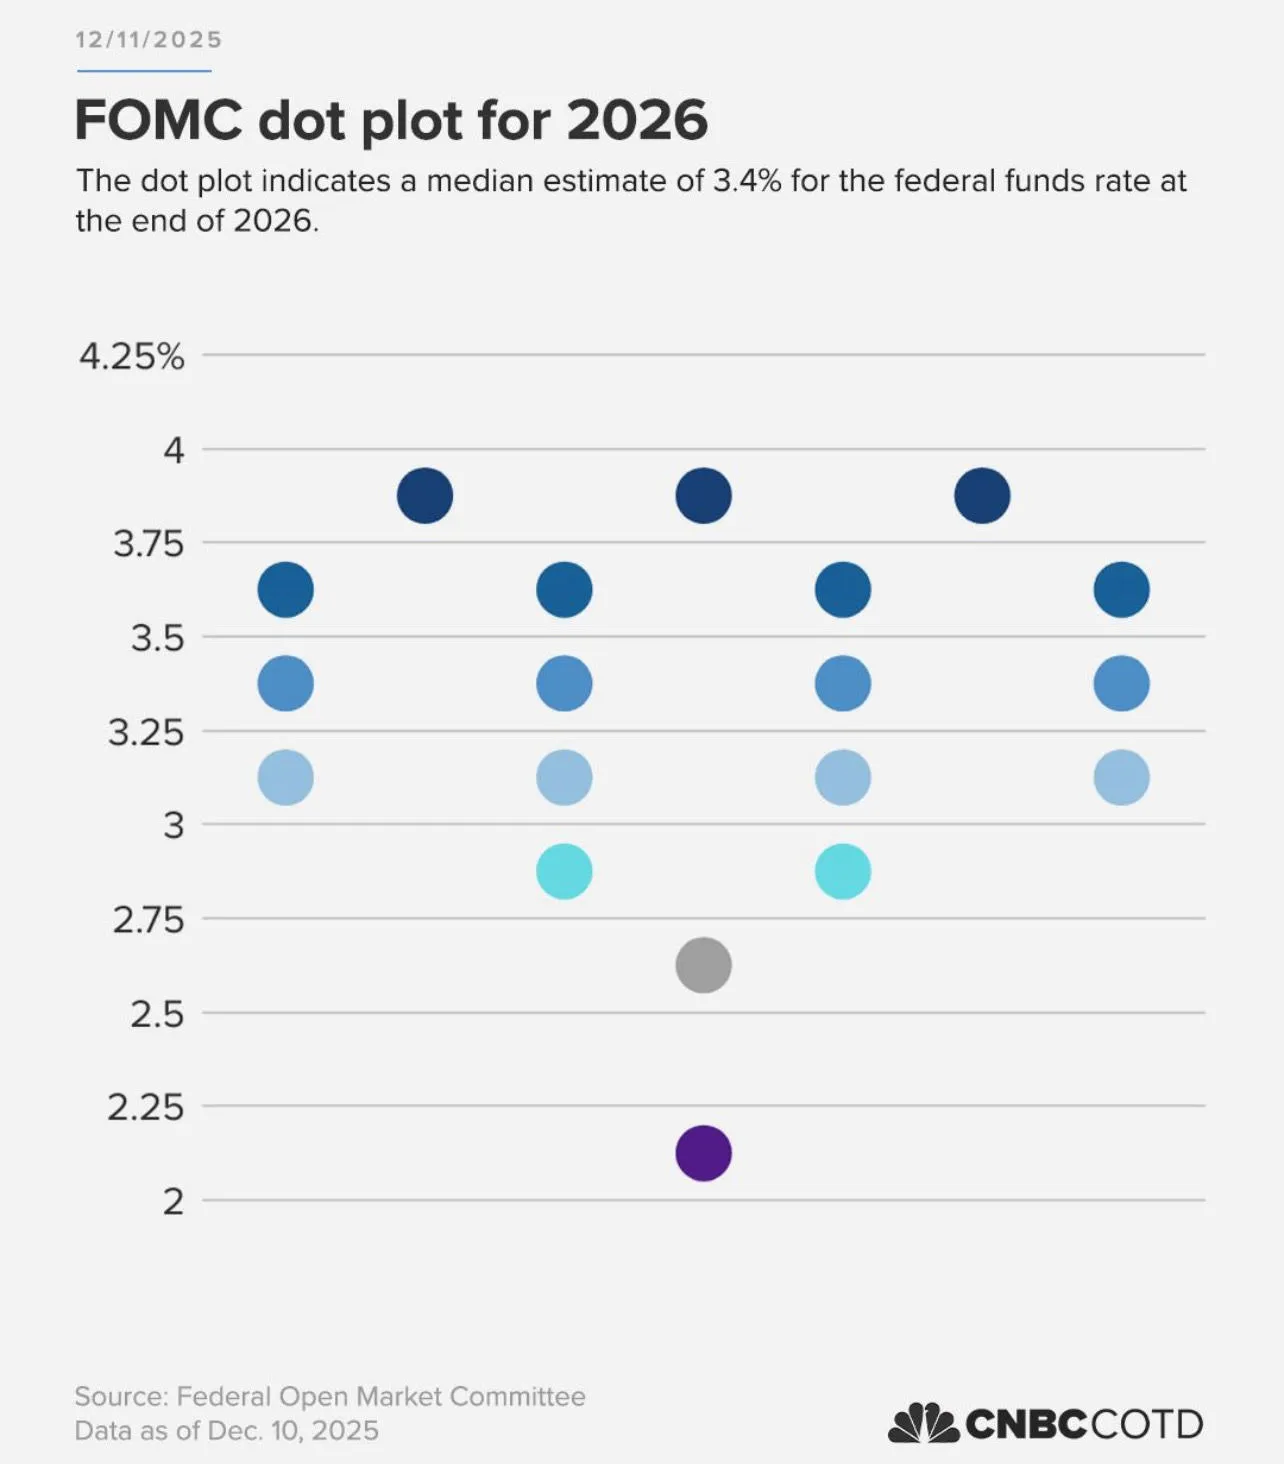
Dot Plot for 2026 – Source: CNBC
Fed's Goolsbee, a dissenter of the recent cut (alongside Kansas Fed's Schmid), gave markets and risk assets a fresh reality check through multiple rounds of interviews. His stance is clear:
- The Fed was and still is in a "comfortable position to wait."
- The central bank is still blind on the inflation picture.
- Frontloading cuts now could carry significant risks.
Consequently, stocks printed a local top and have struggled to rebound since.
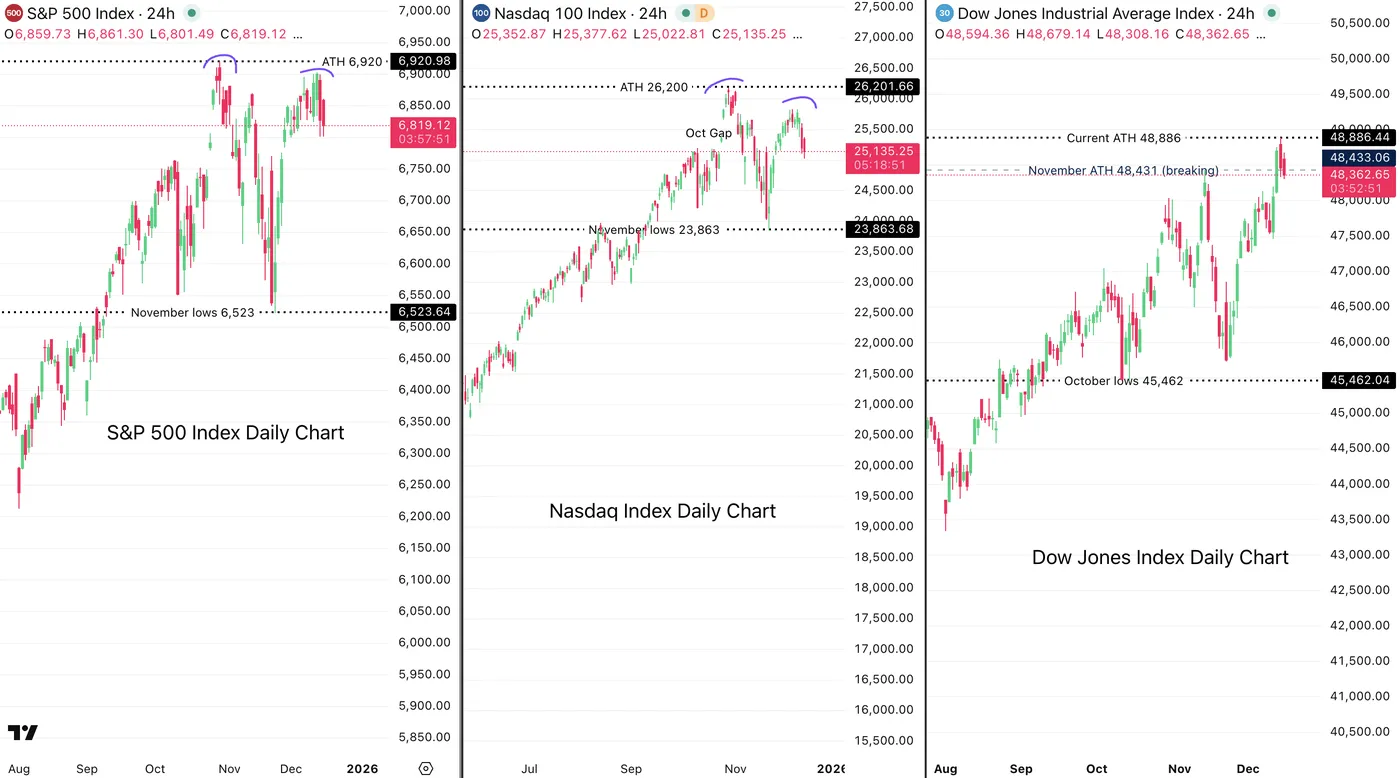
US Main Indexes Daily Outlook – Double tops in S&P 500 and Nasdaq? December 15, 2025 – Source: TradingView
NY Fed President John Williams just issued a counter-narrative, warning that the labor market poses new risks while noting that inflation has eased—effectively mirroring Goolsbee's comments but from a different angle of concern.
But dip-buyers haven't showed as much conviction this time around.
As markets wiggle around in this conflicting narrative, all eyes are on tomorrow's NFP report (preview coming up soon).
Let's dive into the intraday timeframe charts for all major US stock indexes to see where we stand.
A mixed picture across sectors – Typical pre-NFP trading
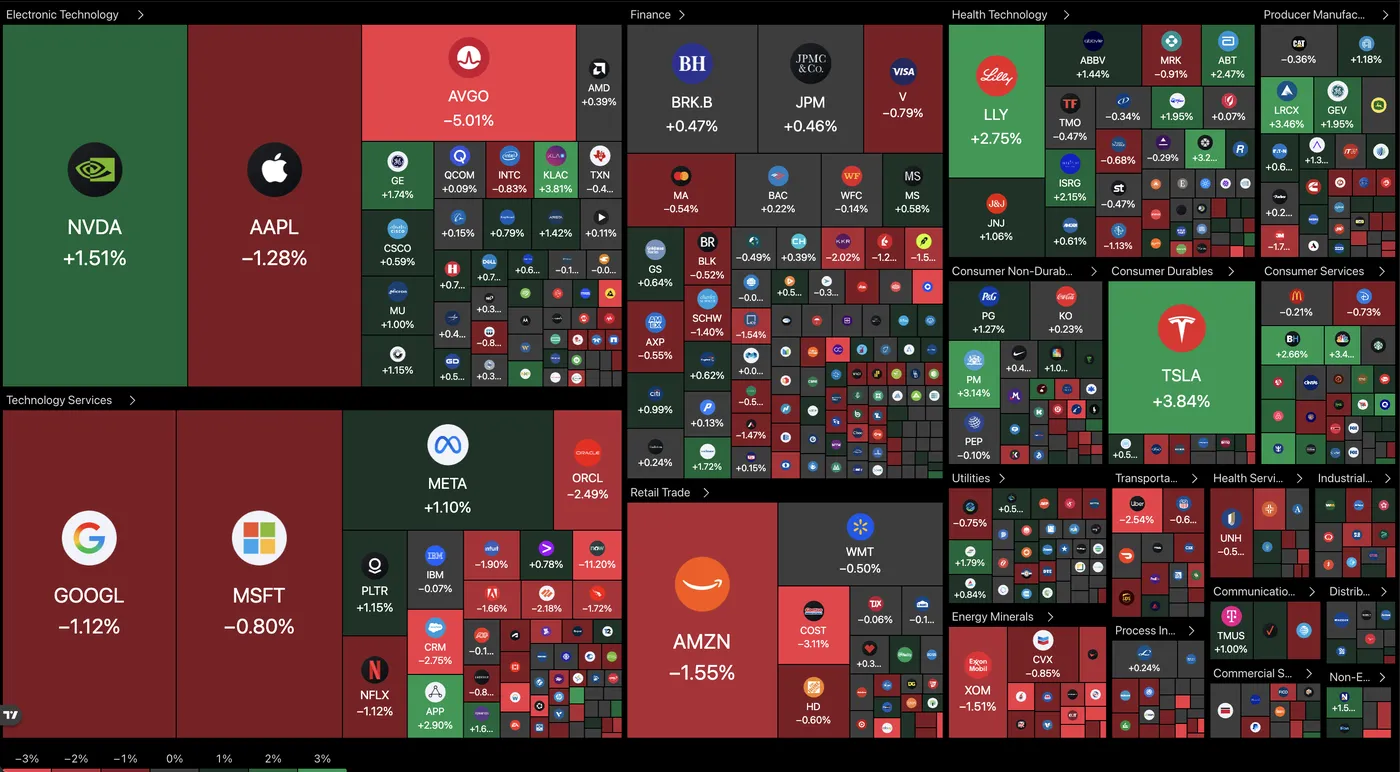
Current picture for the Stock Market (12:50 A.M. ET) – Source: TradingView – December 15, 2025
Dow Jones – Buyers are not following through
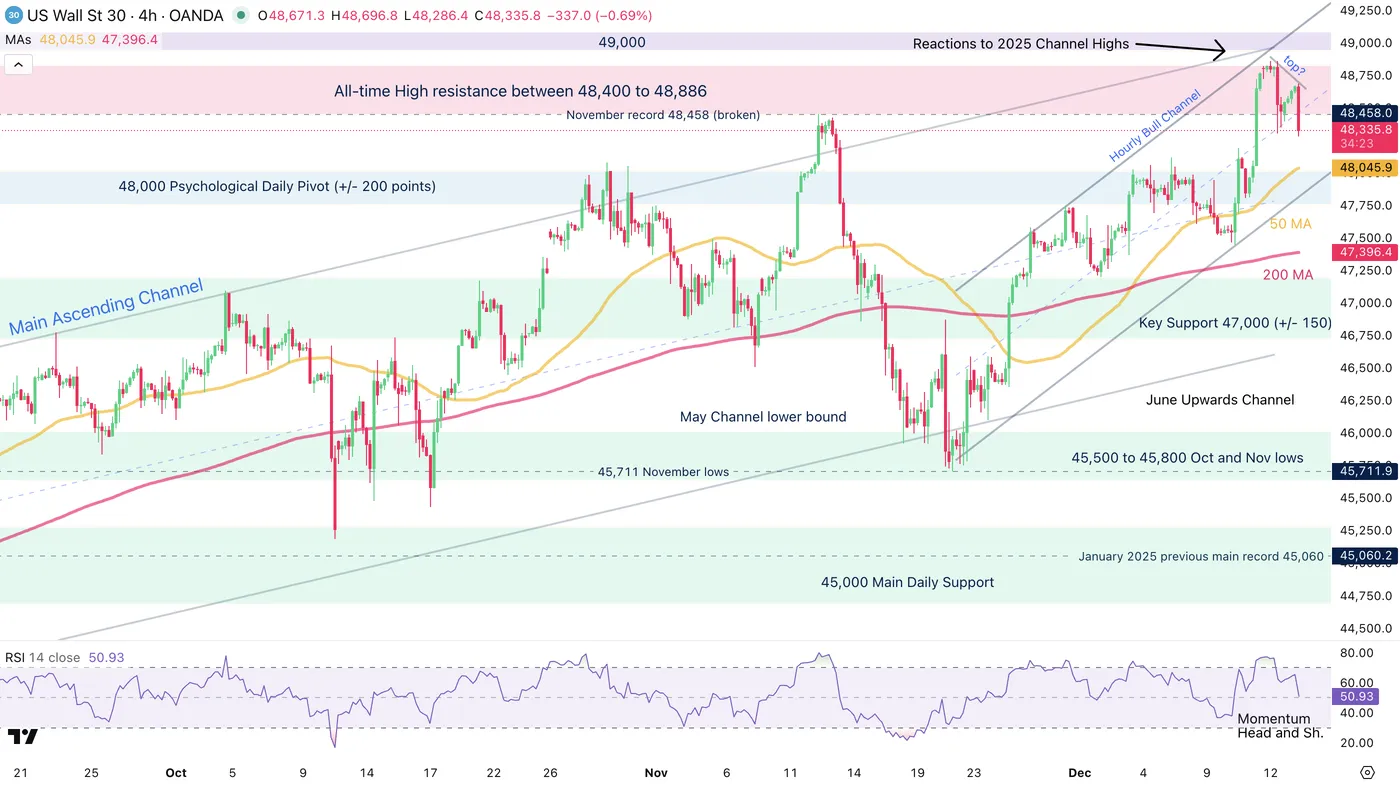
Dow Jones (CFD) 4H Chart – December 15, 2025 – Source: TradingView
The Dow Jones, bellwether of the post-FOMC bullish sentiment, has just rejected to its higher timeframe upward channel (formed since May 2025).
Still evolving within the uptrend, the indication is more one of a slowdown in buyers' strength, for now, but things are still subject to change after tomorrow's release.
Having formed a Head and Shoulders on its 4H RSI, momentum is facing a wall.
Sellers have held prices at the past week lows throughout the entire morning session, so look at whether buyers manage to rebound from here.
Failing to do so opens the door for sellers to take the short-term control.
The hourly bull channel has its lower bound at around 47,850. Watch the reactions when and if prices get there.
Dow Jones technical levels of interest:
Resistance Levels
- All-time High resistance between 48,400 to 48,886 (rejecting)
- 48,700 session highs
- Potential Fib Target 2 49,526
- 50,000 Psychological Level and Potential Fib Target 3 (50,159)
Support Levels
- 50-period MA at 48,000
- Short-term Channel lows 47,850
- Key Support 47,000 (+/- 150) and MA 200
- August highs and November Lows 45,715
- 45,000 psychological level (next support and main for higher timeframe)
Nasdaq – Higher timeframe warning
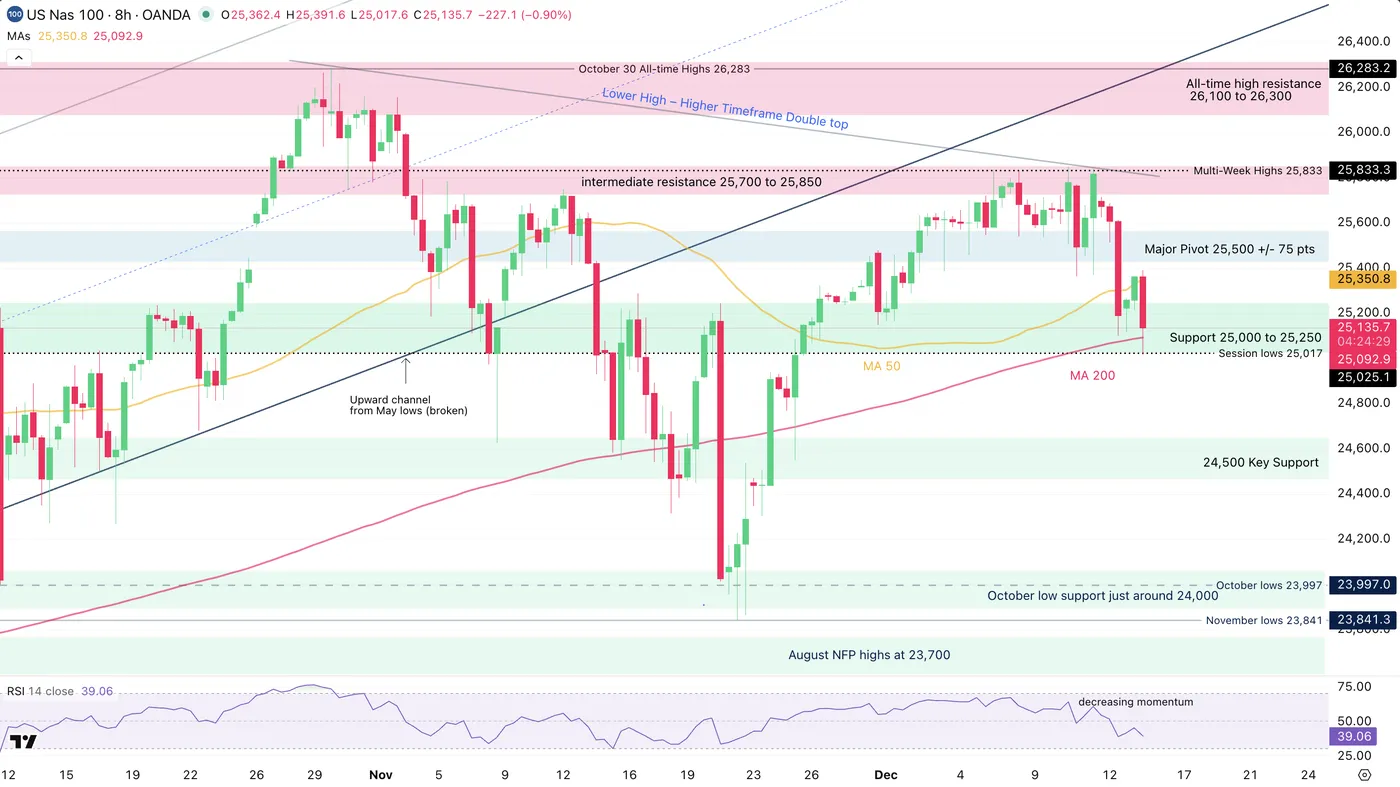
Nasdaq (CFD) 4H Chart – December 15, 2025 – Source: TradingView
Nasdaq is sending scary signs for tech and AI bulls.
After a solid rebound ahead of the FOMC, the index hasn't been able to show any form of strength since the cut, even forming a double-top/lower high with the past week's bullish impulse.
The 25,000 level, acting as immediate support, will be one of its decisive support, supported by the 4H MA 200 for the bulls to maintain the mid-term bullish outlook.
Nasdaq technical levels of interest:
Resistance Levels
- Major Pivot 25,500 +/- 75 pts
- intermediate resistance 25,700 to 25,850 (recent highs)
- All-time high resistance zone 26,100 to 26,300
- Current ATH 26,283 (CFD)
Support Levels
- Support 25,000 to 25,250 (current lows, testing)
- 24,500 Main support and Pivot (recent rebound)
- October and November lows just below 24,000
- Early 2025 ATH at 22,000 to 22,229 Support
S&P 500 – A fragile range
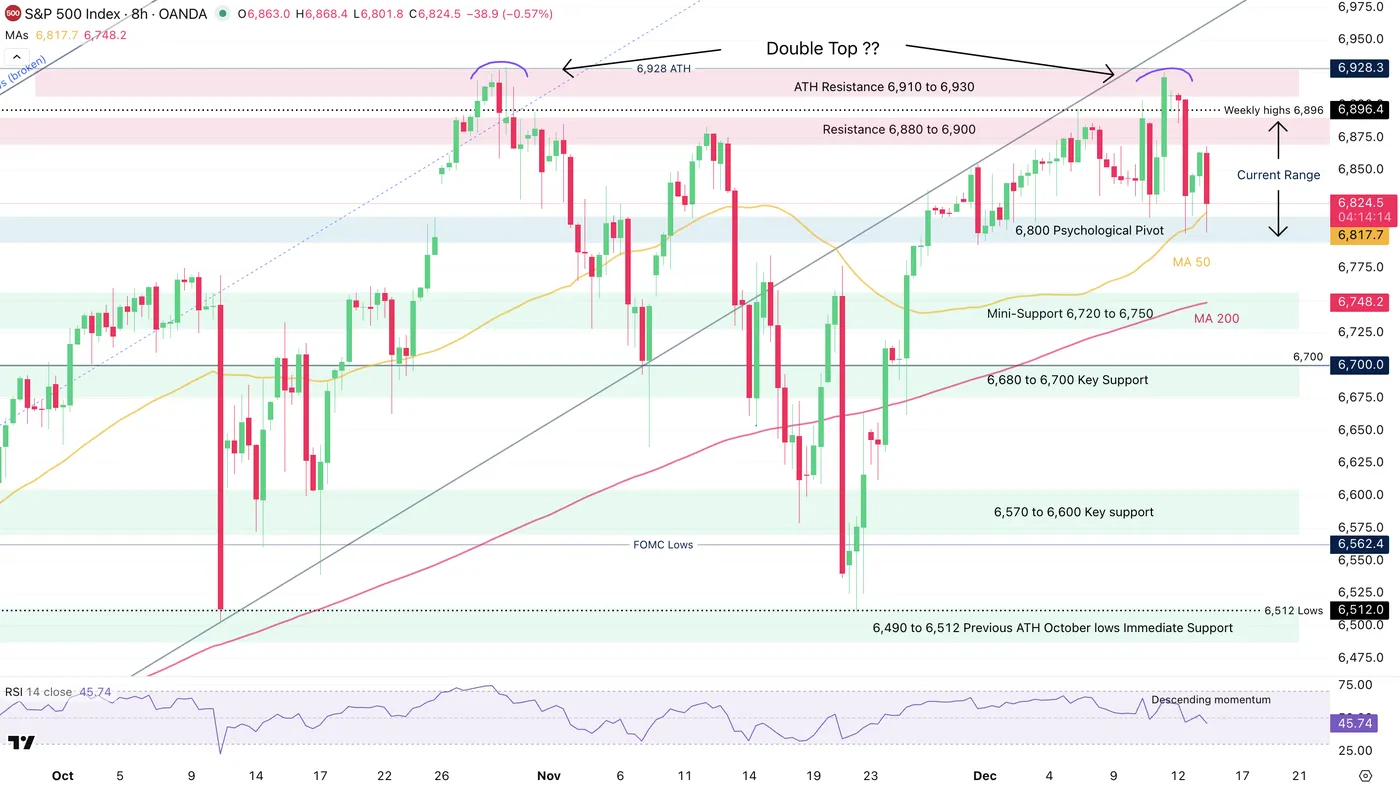
S&P 500 (CFD) 4H Chart – December 15, 2025 – Source: TradingView
The S&P is still holding the 6,800 to 6,900 range indicated in our latest Index analysis but is now testing its support.
Holding 6,800 will be key for bulls to withhold their current strength, particularly as the higher timeframe is also sending signs of a double top – however not as scary as the one in Nasdaq.
Keep a close eye on the psychological support.
- Closing above would maintain the rangebound/bullish picture.
- Closing below opens the door to some downside all the way to November lows around 6,600.
S&P 500 technical levels of interest:
Resistance Levels
- 6,930 (current All Time-Highs)
- Weekly highs 6,896
- Resistance 6,850 to 6,880 (testing)
- ATH Resistance 6,900 to 6,930
Support Levels
- 6,800 Psychological Pivot
- Support 6,720 to 6,750 and 8H MA 50
- 6,490 to 6,512 Previous ATH October lows (recent lows)
- 6,400 psychological support
Safe Trades!