
Sample Category Title
Fed’s Williams sees cooling jobs market, tariff risks contained
New York Fed President John Williams said monetary policy is “well positioned” heading into 2026, as the Fed has moved from a modestly restrictive stance toward neutral. He emphasized the need to return inflation to the 2% target without creating "undue risks" to the labor market, framing current policy as appropriately balanced after recent cuts.
Williams noted a shift in the risk profile. "the downside risks to employment have increased as the labor market has cooled, while the upside risks to inflation have lessened somewhat," he noted.
On tariffs, Williams said their impact on prices has been smaller than initially expected. Import levies appear to have caused one-off price increases rather than persistent inflation pressures. He expects tariff-related effects to be fully realized in 2026, with inflation moderating to around 2.5% next year before easing back to 2% in 2027.
Turning to the labor outlook, Williams sees the unemployment rate ticking up to 4.5% this year, but expects it to gradually decline over the following years alongside forecast growth of 2.25% in 2026. He stressed that the cooling in the labor market has been gradual, "without signs of a sharp rise in layoffs or other indications of rapid deterioration".
Fed’s Miran presses case for faster easing, shelter disinflation will offset sticky goods prices
Fed Governor Stephen Miran, who dissented at the last FOMC meeting in favor of a larger 50bps cut, reinforced his dovish stance in a speech today, arguing that inflation risks are being overstated.
Miran acknowledged that the lack of a clear downward trend in core goods prices could argue for keeping rates elevated, but said he expects disinflation in housing services to "counterbalance that possibility". The key risk, in his view, would be a renewed pickup in shelter inflation or a sustained overshoot in core goods prices. He judged both outcomes as unlikely, adding that if shelter inflation slows as expected while tariff effects disappoint, inflation could "undershoot our inflation target".
He also pushed back against reliance on backward-looking inflation measures. Shelter inflation, Miran argued, reflects supply-demand imbalances from "two to four years ago" rather than current conditions. Given long and variable policy lags, he said monetary policy should be calibrated for 2027, not anchored to inflation dynamics from 2022.
On the employment side of the mandate, Miran warned that labor market deterioration can occur quickly and nonlinearly, and can be difficult to reverse. Keeping policy unnecessarily restrictive risks avoidable job losses, particularly when prices have stabilized, even if at higher levels. He reiterated that a quicker pace of easing would better move policy toward a neutral stance and reflect the current balance of risks.
EURUSD: Bulls Hold Grip and Extend Gains Above Thick Daily Cloud
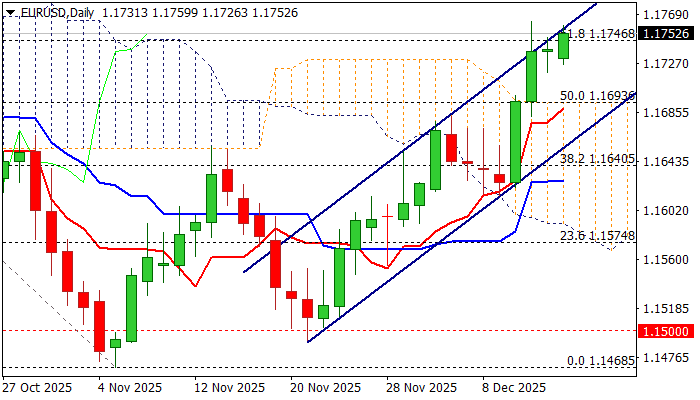
The Euro maintains firm tone at the start of the week and holds near new multi-week high, posted last Thursday (1.1762).
Bulls hold grip and probe again through cracked Fibo barrier at 1.1746 (61.8% of 1.1918/1.1468), also being on track for the third consecutive daily close above broken top of thick daily Ichimoku cloud (1.1693).
However, the near-term action continues to face headwinds from the upper boundary of bull-channel (bull-leg from 1.1490), with overbought daily studies adding to signals that the price may hold in a sideways mode and wait for fresh signals.
A batch of delayed economic data from the US will be released on Tuesday (NFP is the top event) and expected to provide more information to the Fed in shaping their monetary policy outlook, which would generate stronger direction signals.
Daily close above cracked Fibo level at 1.1746 to confirm fresh positive signals for probe through channel upper trendline and open way for acceleration above 1.18 mark.
Friday’s low (1.1750) offers immediate support, with near-term action to remain biased higher while holding above daily cloud.
Res: 1.1760; 1.1778; 1.1812; 1.1848
Sup: 1.1750; 1.1693; 1.1673; 1.1640
Sunset Market Commentary
Markets
Yields in core markets mostly were driven by technical considerations today. Investors were cautious to engage in outright positions as they await a huge batch of key economic data that will be released both in the US and EMU, starting tomorrow. Especially US payrolls and PMI’s published tomorrow might help markets to make up their mind on the amount and/or the pace of further Fed rate cuts in 2026. The European PMI’s will be read against recent indications from ECB policymakers that growth has been more resilient than expected, rekindling the debate on timing of a future ECB rate hike, potentially at the turn of 2026/27. The only relevant US data release today, the NY Fed Empire manufacturing survey showed an unexpected sharp drop from +18.7 to -3.9, but the negative reading on the current situation was counterbalanced by a substantial improvement in the forward-looking 6 months ahead index, improving to a solid 37.5 (best level since January). The market reaction to this (mixed) release was limited. US yields are ceding between 3.5 bps (5-y) and 2.5 bps (30-y). German Bund yields are easing -0.8 bps (2-y) to -2.8 bps (30-y). Equity markets try to find their composure after mainly US tech stocks again felt some shivers from headlines questioning the amount and the efficacy of AI spending by some tech bellwethers last week. The EuroStoxx 50 adds 0.7%. The all-time record high is less than 1.5% away. US equities try to recoup part of Friday’s setback (S&P +0.3%), but the move lacks conviction. For now, moves like the one end last week remain corrections including some rotation into less AI-related sectors. Key support levels stay out of reach, for now. The price of crude oil remains under pressure, amongst others driven by headlines that global cure oil stocks and stocks of oil products remain above seasonal averages.
On FX markets, the dollar struggles to avoid further losses. The narrative from this week’s data and CB meetings might favor the likes of the euro (better growth prospects) or the yen (BoJ rate hike, further policy normalization). DXY trades near 98.2 nearing a first support area at 98.13/03 (last week post-Fed low/mid-October low). EUR/USD at 1.1755 is holding near last week’s post-Fed top (1.1763). The yen this morning ‘rallied’ as a solid quarterly BoJ Tankan report gave a nihil obstat for the central bank to take a next step in its (admittedly very gradual) process of policy normalization. USD/JPY eases from 155.8 to 155.14. That said, the picture for the Japanese currency still looks unconvincing. A break below USD/JPY 154.35 could signal the yen gaining some traction. EUR/JPY also eases slightly (182.2) but stays withing reach of its all-time record since the introduction of the euro. EUR/GBP is holding stable (0.8775 area) with tomorrow’s labour market report and December PMI’s next data references for GBP trading.
News & Views
The Swiss State Secretariat for Economic Affairs has slightly revised upwards its forecast for economic growth in 2025 (adjusted for sporting events: 1.4% from 1.3%) and 2026 (1.1% from 0.9% in October) as the reduction in US tariffs have improved prospects for the sectors concerned. In 2027, Swiss growth is expected to normalize at 1.7% as the global economy gradually recovers. The KOF Swiss Economic Institute in its Winter forecast, also released today, plots a similar growth path. Domestic demand remains the main driver of growth with low inflation supporting real incomes: inflation is forecast to average 0.2% in both 2025 and 2026 (October forecast: 0.2% in 2025, 0.5% in 2026) before rising slightly to 0.5% in 2027. The outlook remains surrounded by a lot of mainly downside risks including lingering trade uncertainty, lofty valuations, debt-related problems (sovereign, balance sheet risks at FI’s, real estate markets) and geopolitics. Should any of these risks materialize, further upward pressure on the Swiss franc would be expected.
Reserve Bank of New Zealand governor Breman this morning observed that financial markets conditions have tightened since the November decision, beyond what is implied by the central projection for the OCR. It were her first public comments since taking the helm at the RBNZ earlier this month. With the remark, she pushed back against NZ money market expectations that the central bank in H2 of this year will turn back to hiking its policy rate. It was the natural reflex after the RBNZ suggested last month that it was likely done easing. The kiwi dollar initially lost ground, with NZD/USD dipping from 0.5810 to 0.5770, but most of the move was erased later on.
EUR/USD Mid-Day Outlook
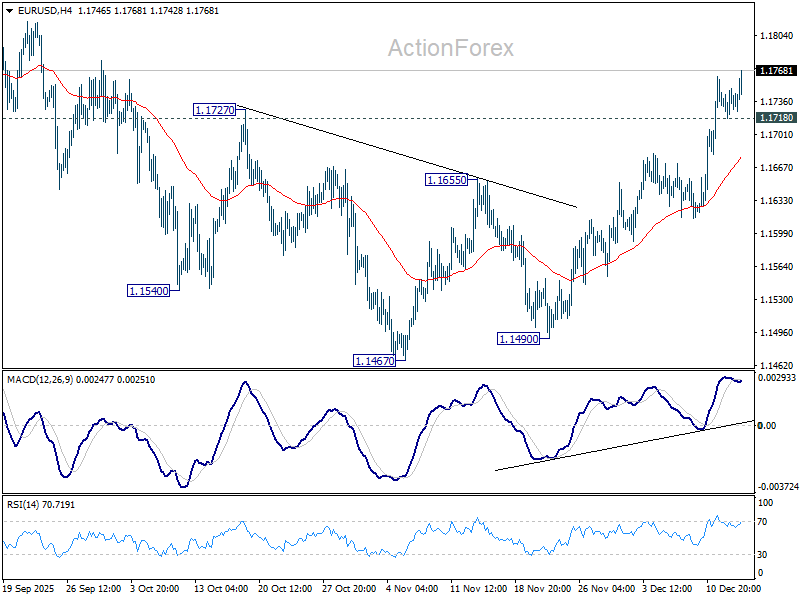
Daily Pivots: (S1) 1.1723; (P) 1.1737; (R1) 1.1753; More….
EUR/USD's rise from 1.1467 continues today despite some loss of momentum as seen in 4H MACD. Intraday bias stays on the upside for retesting 1.1917 high. On the downside, though, below 1.1718 minor support will turn bias neutral and bring some consolidations first.
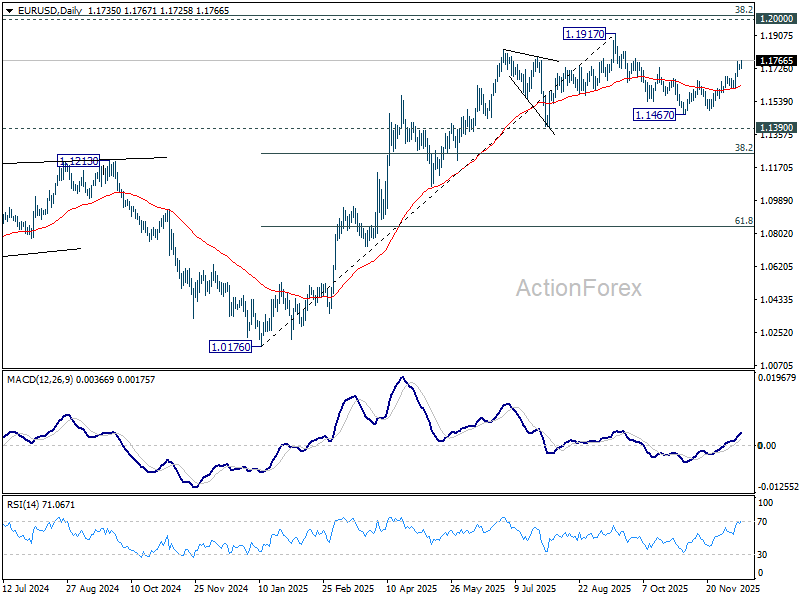
In the bigger picture, as long as 55 W EMA (now at 1.1373) holds, up trend from 0.9534 (2022 low) is still in favor to continue. Decisive break of 1.2 key psychological level will carry larger bullish implication. However, sustained trading below 55 W EMA will argue that rise from 0.9534 has completed as a three wave corrective bounce, and keep long term outlook bearish.
GBP/USD Mid-Day Outlook
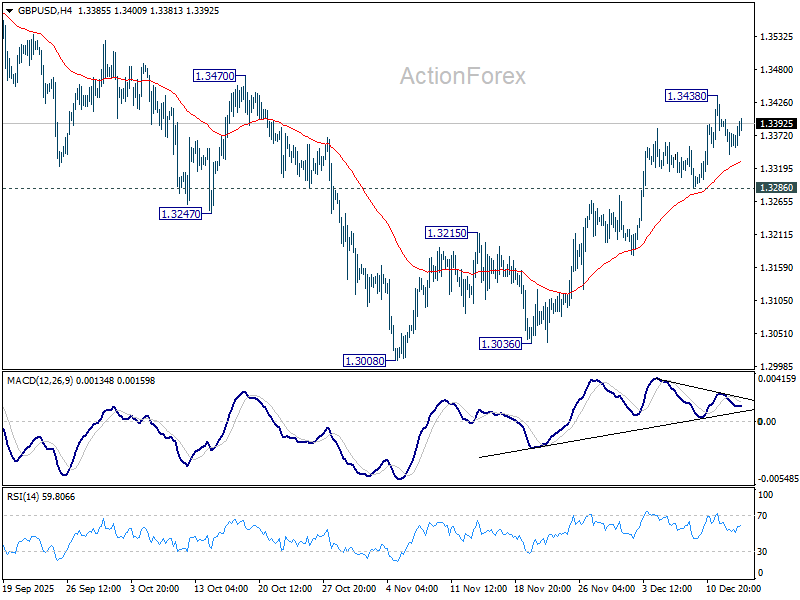
Daily Pivots: (S1) 1.3342; (P) 1.3371; (R1) 1.3400; More...
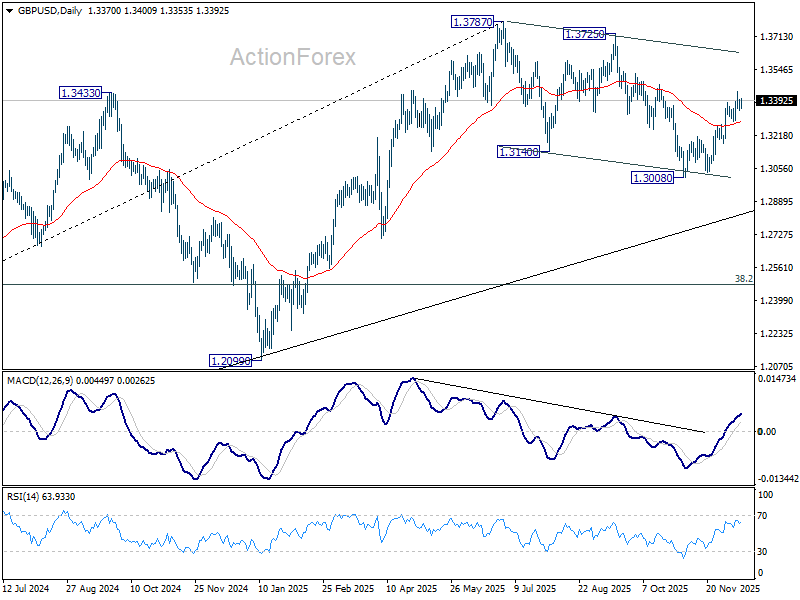
GBP/USD is extending consolidations below 1.3438 and intraday bias stays neutral. With 1.3286 support intact, further rally is expected. As noted before, fall from 1.3787 should have completed as a three-wave correction to 1.3008. Above 1.3428 and firm break of 1.3470 resistance will pave the way back to retest 1.3787 high. However, sustained break of 1.3286 support will mix up the near term outlook.
In the bigger picture, current development suggests that fall from 1.3787 is merely a corrective move, and larger rise from 1.0351 (2022 low) is still in progress. Firm break of 1.3787 will target 1.4248 (2021 high) key structural resistance. This will remain the favored case as long as target 38.2% retracement of 1.0351 to 1.3787 at 1.2474 holds, in case of another fall.
USD/CHF Mid-Day Outlook
Daily Pivots: (S1) 0.7946; (P) 0.7955; (R1) 0.7970; More…
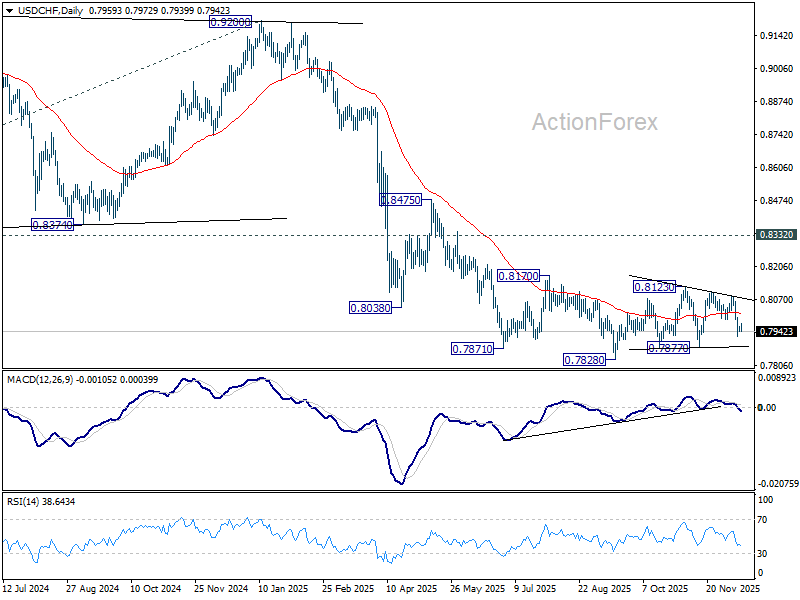
No change in USD/CHF's outlook and intraday bias stays neutral. Corrective pattern from 0.7828 is still extending. On the downside, below 0.7923 will target 0.7877 support. On the upside, though, break of 0.7990 support turned resistance will bring stronger rebound towards 0.8084.
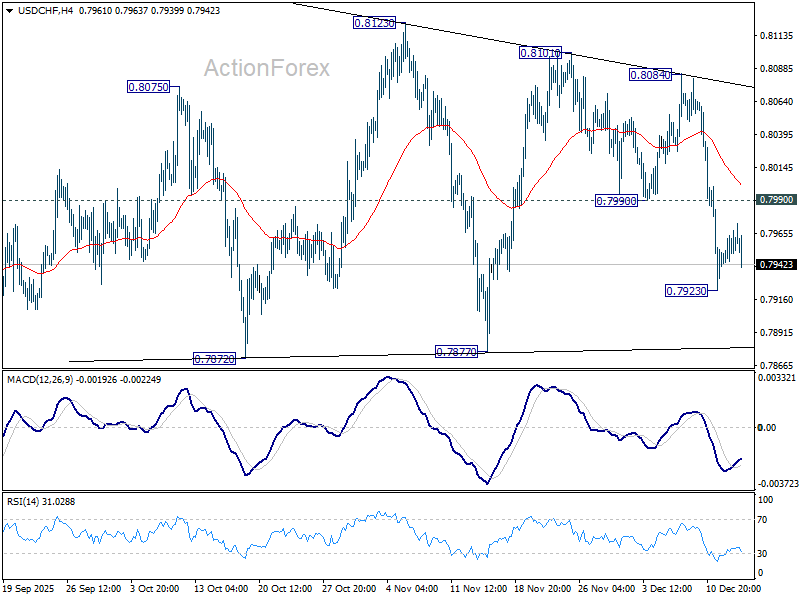
In the bigger picture, outlook will stay bearish as long as 0.8332 support turned resistance holds (2023 low). Long term down trend from 1.0342 (2017 high) is still in progress. Next target is 100% projection of 1.0146 (2022 high) to 0.8332 from 0.9200 at 0.7382.
USD/JPY Mid-Day Outlook
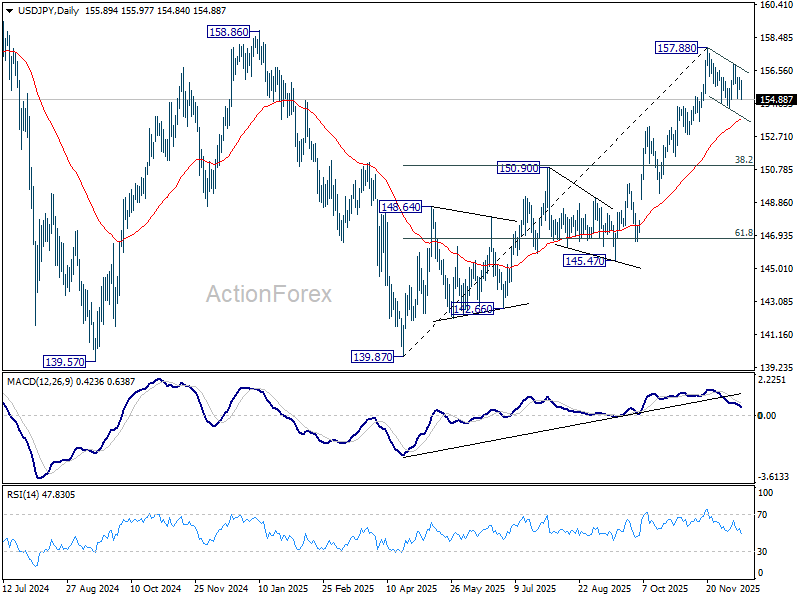
Daily Pivots: (S1) 155.47; (P) 155.80; (R1) 156.15; More...
USD/JPY is extending the corrective pattern from 157.88 and intraday bias remains neutral. On the downside, break of 154.33 will target 55 D EMA (now at 153.66) and possibly below. On the upside, above 156.94 will bring retest of 157.88. Firm break there will resume whole rally from 139.87 to 158.85 key structural resistance.
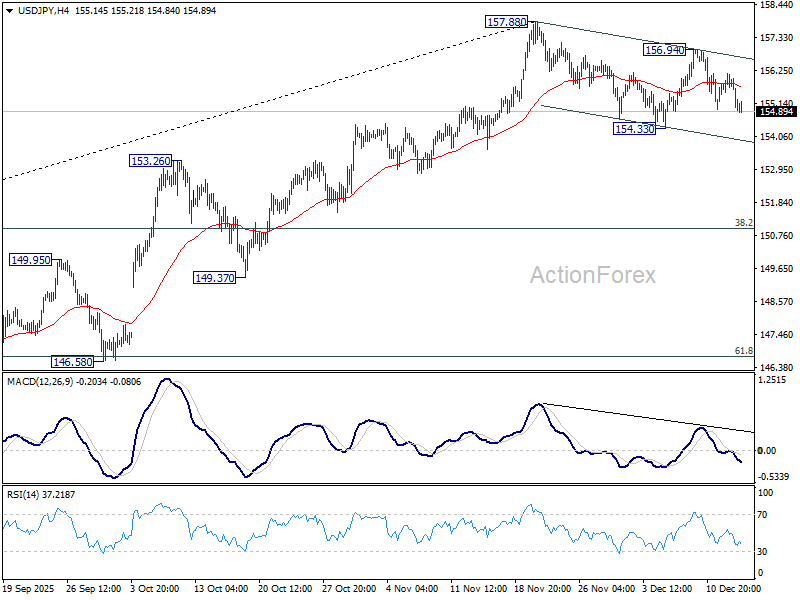
In the bigger picture, corrective pattern from 161.94 (2024 high) could have completed with three waves at 139.87. Larger up trend from 102.58 (2021 low) could be ready to resume through 161.94 high. Decisive break of 158.85 structural resistance will solidify this bullish case and target 161.94 for confirmation. On the downside, break of 150.90 resistance turned support will dampen this bullish view and extend the corrective range pattern with another falling leg.
USD/CAD Mid-Day Outlook
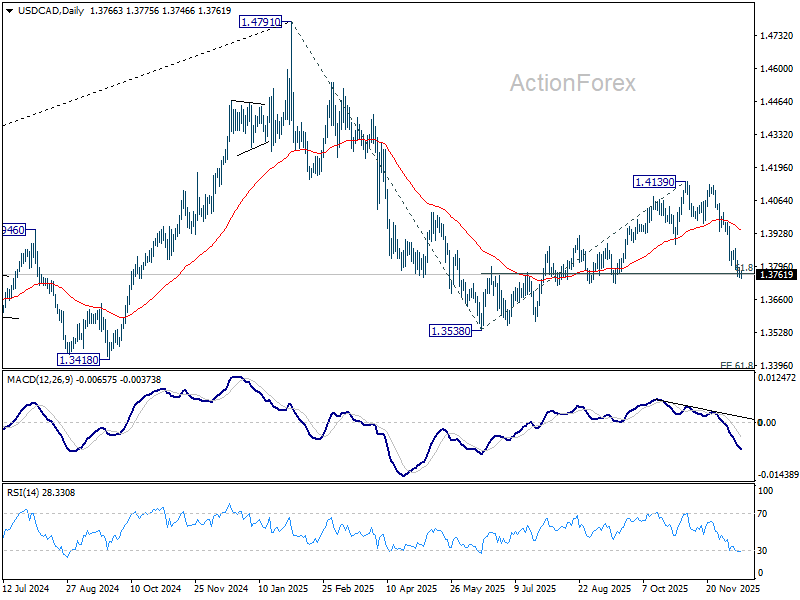
Daily Pivots: (S1) 1.3752; (P) 1.3773; (R1) 1.3793; More...
USD/CAD continues to lose downside momentum as seen in 4H MACD, but there is no clear sign of bottoming yet. Further decline remains in favor, and sustained trading below 61.8% retracement of 1.3538 to 1.4139 at 1.3768 will argue that whole fall form 1.4791 might be ready to resume. Retest of 1.3538 low should be seen next. On the upside, however, break of 1.3870 resistance will indicate short term bottoming, and turn bias back to the upside for stronger rebound.
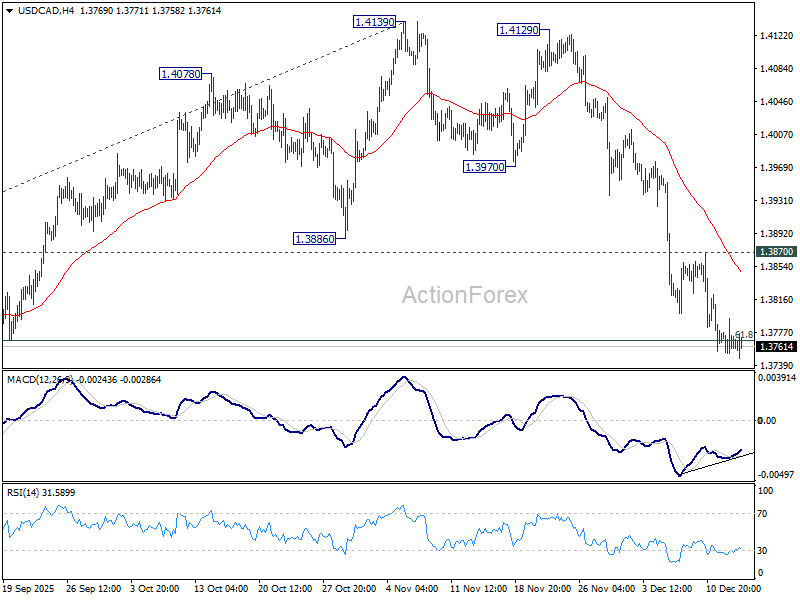
In the bigger picture, current development suggests that price actions from 1.4791 is developing into a deeper, larger scale correction. In the less bearish case, it's just correcting the rise from 1.2005 (2021 low). But even so, break of 1.3538 will pave the way to 61.8% projection of 1.4791 to 1.3538 from 1.4139 at 1.3365. This will remain the favored case as long as 1.4139 resistance holds, in case of rebound.
Loonie Steady as Inflation Confirms BoC Comfort, Risk Mood Mixed
Canadian Dollar is little changed in early US trade, reflecting a broadly balanced market backdrop. The latest inflation figures offered reassurance rather than surprise, keeping the Loonie anchored as investors focus on broader risk and geopolitical developments.
Canada’s CPI remained steady at 2.2% close to BoC's 2% target. The absence of renewed price acceleration is welcome, strengthening the case that policy easing is essentially complete and that rates are appropriately calibrated.
While core inflation measures remain elevated, their gradual cooling trend supports expectations that underlying pressures are easing. If tariff impacts continue to settle and inflation softens further, the environment could allow growth to firm modestly in early 2026 without forcing the BoC back into action.
Meanwhile, Risk sentiment firmed slightly in Europe after Asian markets were rattled by weak China data. Markets reacted to a major diplomatic shift after Ukrainian President Volodymyr Zelenskyy signaled willingness to abandon Ukraine’s NATO ambitions in exchange for alternative security guarantees, a development that weighed heavily on European defense stocks.
Beyond defense, however, equity markets proved resilient. European indexes are posting mild gains. US stocks also opened higher, led by recovery in technology shares. Still, with US non-farm payrolls due tomorrow, investors appear reluctant to extend positions aggressively.
Across FX, Yen continues to lead despite giving back part of its earlier rally, followed by Sterling and Euro. Kiwi underperforms, with Aussie and Swiss Franc also lagging. Dollar and Loonie sit near the center of the board, consistent with a mixed risk tone rather than a clear directional move.
In Europe, at the time of writing, FTSE is up 0.95%. DAX is up 0.34%. CAC is up 0.97%. UK 10-year yield is down -0.036 at 4.499. Germany 10-year yield is down -0.017 at 2.845. Earlier in Asia, Nikkei fell -1.31%. Hong Kong HSI fell -1.34%. China Shanghai SSE fell -0.55%. Singapore Strait Times rose 0.06%. Japan 10-year JGB yield rose 0.004 to 1.959.
Canada CPI unchanged at 2.2% in November, services inflation cools
Canada’s inflation data came in softer than expected in November. Headline CPI was unchanged at 2.2% yoy, undershooting expectations for an uptick to 2.4% and suggesting inflation remains comfortably contained near target.
The moderation was led by services inflation, which slowed to 2.8% yoy from 3.2% in October. That deceleration more than offset firmer goods prices, where grocery inflation accelerated sharply to 4.7% from 3.4%, the strongest pace since December 2023.
Gasoline prices also fell at a slower annual pace, declining -7.8% yoy compared with a -9.4% drop previously. Stripping out gasoline, CPI rose 2.6% year over year for a third consecutive month, pointing to stability rather than renewed inflation momentum.
Core measures reinforced that message. CPI Median slowed to 2.8% from 3.0%, while CPI Trim eased to 2.8% from 2.9%, both coming in below expectations. CPI Common edged up slightly to 2.8%, matching forecasts.
Eurozone industrial production rises 0.8% mom in October, beats expectations on broad-based gains
Eurozone industrial production delivered a modest upside surprise in October, rising 0.8% mom and beating expectations for a 0.7% increase.
The gains in the Eurozone were broad-based across sectors. Output of energy rose 1.1% mom, capital goods increased 0.5%, and intermediate goods edged up 0.3%. Consumer-related categories were firmer, with durable consumer goods jumping 2.0% and non-durable goods rising 1.2%, suggesting some resilience in downstream demand.
Across the wider EU, industrial production increased 0.3% mom, masking sharp country-level divergences. Ireland (4.0%), Luxembourg (3.6%), and Croatia (3.1%)posted the strongest gains, while Sweden (-6.5%), Belgium (-3.4%), and Denmark (-3.2%) recorded steep declines.
SECO upgrades 2026 GDP forecast, downgrades inflation
Swiss economic prospects have improved modestly, with the Federal Government Expert Group on Business Cycles revising up its 2026 growth forecast. GDP adjusted for sporting events is now seen expanding 1.1%, up from 0.9% projected in October, bringing the outlook broadly back in line with June forecasts when US tariffs stood at 10%. The reduction in US tariffs has improved conditions for exposed sectors and eased pressure on foreign trade.
Foreign demand is expected to provide a positive, though still "moderate", contribution next year. Domestic demand, however, remains the "main driver of growth", supported by resilient consumption and a gradual pickup in investment as capacity utilization improves. SECO expects investment activity to strengthen slightly as firms respond to firmer underlying demand.
Low inflation remains a key support. Consumer prices are forecast to rise just 0.2% in both 2025 and 2026 (down from 0.5%0, helping preserve real incomes and underpin solid private consumption.
Looking further ahead, growth is expected to normalize at 1.7% in 2027 as global conditions improve, though the outlook assumes tariffs remain at current levels and uncertainty around trade policy remains elevated.
Japan Tankan: Manufacturing sentiment improves as firms absorb tariff impact
Japan’s Q4 Tankan survey delivered a broadly supportive signal for the economy, reinforcing expectations that the BoJ will proceed with rate normalization. The large manufacturing index rose from 14 to 15, in line with expectations, marking a third consecutive quarterly improvement and the strongest reading since December 2021. The result suggests manufacturers have so far weathered the impact from higher U.S. tariffs better than feared.
Sentiment among non-manufacturers was less impressive, with the index unchanged at 34, falling short of expectations for a modest uptick. Even so, the divergence does not point to a meaningful deterioration in overall conditions, as services confidence remains elevated relative to historical norms.
Capital spending intentions added to the constructive tone. Large firms now plan to increase investment by 12.6% in the current fiscal year ending March 2026, slightly above market expectations of 12.0%.
The survey also indicated firms expect inflation to average 2.4% across one-, three-, and five-year horizons, suggesting expectations are stabilizing around the BoJ’s 2% target.
With tariff uncertainty easing and manufacturing sentiment holding firm, the survey supports the dominant market view that BoJ is positioned to raise rates in December, even as the pace of tightening beyond that remains gradual.
China data disappoints as consumption and investment weaken further
China’s November activity data delivered a broadly weaker-than-expected picture. Industrial production rose 4.8% yoy, missing expectations for 5.0% growth and marking the weakest pace since August 2024.
The sharper disappointment came from consumption. Retail sales rose just 1.3% yoy, far below expectations of 2.9% and slowing markedly from October’s 2.9% pace. It was also the weakest reading since December 2022.
Investment conditions also deteriorated. Year-to-date fixed asset investment fell -2.6%, deeper than expected -2.3% and the sharpest contraction since the pandemic in 2020. The drag from property intensified, with real estate investment down -15.9% in the first eleven months of the year, extending the slump seen earlier and reinforcing the view that the property sector remains a central constraint on China’s recovery.
RBNZ's Breman sees OCR holding at 2.25% if outlook unfolds as expected
RBNZ Governor Anna Breman signaled in media interviews today that the bar for further near-term easing remains high. While the forward path published in the November Monetary Policy Statement allows for a small probability of another rate cut, Breman stressed "if economic conditions evolve as expected the OCR is likely to remain at its current level of 2.25 per cent for some time."
Looking ahead to the next OCR decision in February, Breman said the central bank will continue to assess incoming data, financial conditions, and global developments, with a particular focus on implications for New Zealand’s economic outlook and its medium-term inflation objective.
Breman also reiterated that monetary policy is not on a preset course, highlighting the MPC’s regular meeting schedule as a reflection of that flexibility.
NZ BNZ service falls to 46.9, recovery hopes dented
New Zealand’s services sector slipped deeper into contraction in November, reinforcing signs that domestic demand remains fragile. BusinessNZ Performance of Services Index fell from 48.4 to 46.9, marking the lowest level of activity since May and sitting well below the survey’s long-run average of 52.8. All five sub-indices remained in contraction territory, underlining the broad-based nature of the slowdown.
Activity and sales saw the sharpest deterioration, dropping from 48.4 to 45.8, while employment also weakened from 48.6 to 46.4. New orders edged marginally higher from 49.2 to 49.3, offering little evidence of an imminent turnaround in demand.
BusinessNZ Chief Executive Katherine Rich said the November reading "put to bed" any immediate hope that the sector was moving toward expansion. While the proportion of negative comments eased slightly from recent months, businesses continued to cite a weak economic backdrop, low consumer confidence, high living costs, inflation, interest rates, and reduced spending as the dominant constraints on activity.
USD/CAD Mid-Day Outlook
Daily Pivots: (S1) 1.3752; (P) 1.3773; (R1) 1.3793; More...
USD/CAD continues to lose downside momentum as seen in 4H MACD, but there is no clear sign of bottoming yet. Further decline remains in favor, and sustained trading below 61.8% retracement of 1.3538 to 1.4139 at 1.3768 will argue that whole fall form 1.4791 might be ready to resume. Retest of 1.3538 low should be seen next. On the upside, however, break of 1.3870 resistance will indicate short term bottoming, and turn bias back to the upside for stronger rebound.
In the bigger picture, current development suggests that price actions from 1.4791 is developing into a deeper, larger scale correction. In the less bearish case, it's just correcting the rise from 1.2005 (2021 low). But even so, break of 1.3538 will pave the way to 61.8% projection of 1.4791 to 1.3538 from 1.4139 at 1.3365. This will remain the favored case as long as 1.4139 resistance holds, in case of rebound.