Sample Category Title
Key Central Bank Meetings Take the Spotlight
In focus this week
Today is expected to be somewhat quiet on the data front, although we highlight speeches from New York Fed President John Williams and Fed Governor Stephen Miran in the evening. Markets will be looking for comments on US monetary policy.
The rest of the week will offer many interesting figures ahead of key central bank meetings on Thursday. Important for the euro area, flash PMIs will be released on Tuesday, the final inflation print for November on Wednesday and the ECB growth forecast on Thursday.
Across the Atlantic, the delayed US nonfarm payrolls and full November Jobs Report are set for release on Tuesday along with October retail sales data and December flash PMIs. On Thursday, the November CPI is due for release in the afternoon.
All eyes will be on the Thursday central bank meetings from the ECB, Riksbank, Norges Bank and Bank of England (BoE). Market consensus expects the ECB to leave the deposit rate unchanged on the back of data coming in stronger than expected by the ECB staff. We also expect the Riksbank and Norges bank to keep interest rates steady in line with market pricing. The BoE is expected to cut the bank rate, but the labour market report on Tuesday and November CPI figures on Wednesday may play a role in the final outcome.
Rounding off the week, the Bank of Japan (BoJ) will hold its meeting. Markets have increasingly expected the BoJ to hike the interest rate in recent weeks as Governor Ueda said he will "consider pros and cons".
Economic and market news
What happened overnight
In China, the monthly batch of data showed retail sales growth declining to 1.3% in November from 2.9% in October. Industrial output growth slowed marginally to 4.8% y/y in November from 4.9% y/y in October. The figures were below expectations of 2.8% and 5.0% respectively. The housing market continued to weaken, with home prices declining 0.4% m/m and 2.4% y/y in November. As expected, China continues to be a two-speed economy with strong exports and tech development but weak domestic demand.
In Japan, the quarterly Tankan business survey showed manufacturing sentiment rising to +17 in December from the already high level of +15 in September. Sentiment improved in manufacturing to +11 from +7, while the non-manufacturing sentiment stayed at +21. The overall sentiment was +24, +21 and +11 for Large-, Medium- and Small Enterprises respectively. The business sentiment remained fairly strong, however the forecast for next quarter expects sentiment to take a smaller decline as businesses eye a BoJ hike this week.
What happened over the weekend
In the US, we had the first comments following the FOMC December meeting, however they did not provide any clear new signals. Goolsbee was not "hawkish" on interest rates next year, but felt optimistic that they could fall this year, although he felt uncomfortable front loading looser monetary policy. Hammock commented on the labour market gradually cooling but also pointed at inflation remaining above target.
In Sweden, the labour force survey (LFS) for November showed encouraging employment growth of 0.6% m/m. The unemployment rate remained at high levels but edged down to 9.1% SA from 9.3%. The Riksbank will likely continue to express concerns about the labour market during their meeting on Thursday. SPES unemployment declined for the fourth consecutive month in November to 6.7%.
In Germany, the final inflation data for November confirmed the flash estimates. CPI held steady at 2.3% y/y with electricity prices declining 1.5% y/y and food inflation remaining at low levels of 1.2% y/y. The large upside surprise in the HICP index was also confirmed, which rose to 2.6% y/y. HICP services inflation was the culprit behind the surprise as it rose to 4.2% y/y from 3.6% y/y.
Equities: Global equities had a rough end to the week, as renewed concerns around lofty tech valuations weighed on risk sentiment and pushed major indices lower. The S&P 500 ended Friday down 1.1%, resulting in a negative week overall. Friday's session showed a clear defensive tilt, with cyclicals underperforming by almost 1 percentage point. The Nasdaq ended the day 1.7% lower, while the Russell 2000 declined by around the same magnitude. Over the week as a whole, the MSCI World index ended the week down only around 0.2%.
FI and FX: We have a busy week ahead of us with plenty of central bank meetings and with very different outcomes. We have Norges Bank and the Riksbank meeting on Thursday together with the ECB and Bank of England and finally, Bank of Japan on Friday. The Bank of England is expected to cut rates, while BoJ is expected to hike rates - both by 25bp. ECB, Norges Bank and the Riksbank are all on hold, although Norges Bank is expected to signal a cut in March and the ECB is expected to signal they are on hold and possibly reverse some of the repricing we have seen lately.
EUR/JPY Daily Outlook
Daily Pivots: (S1) 182.60; (P) 182.88; (R1) 183.23; More...
Intraday bias in EUR/JPY is turned neutral with current steep retreat and some consolidations would be seen below 187.14. Further rally remains in favor. But considering bearish divergence condition in both 4H and D MACD, upside should be limited 100% projection of 161.06 to 173.87 from 171.09 at 183.90, at least on first attempt. Meanwhile, firm break of 180.07 will confirm short term topping, and bring deeper correction to 55 D EMA (now at 178.59).
In the bigger picture, up trend from 114.42 (2020 low) is in progress and should target 61.8% projection of 124.37 to 175.41 from 154.77 at 186.31. However, considering bearish divergence condition in D MACD, upside should be capped by 186.31 on first attempt. Outlook will continue to stay bullish as long as 55 W EMA (now at 170.73) holds, even in case of deep pullback.
Yen Jumps on China Data Shock as BoJ Hike Bets Firm Up
Yen rallied broadly during the Asian session as weaker-than-expected Chinese data undermined regional risk sentiment. Retail sales disappointed sharply, reinforcing doubts about the strength of China’s domestic recovery and prompting a defensive tilt across FX markets.
Hopes that poor data would trigger fresh stimulus from Beijing failed to gain traction. Instead, markets appear increasingly focused on the limits of short-term policy support in the absence of deeper structural reform. The concern is that quick fixes can no longer offset entrenched weaknesses in confidence and balance sheets.
That view was echoed by the International Monetary Fund last week, which urged China to accelerate structural reforms and address the prolonged property slump. With around 70% of household wealth tied to real estate, the housing downturn continues to weigh heavily on consumption and broader economic momentum.
The IMF also cautioned that China’s size limits its ability to drive growth through exports alone. Continued reliance on export-led expansion risks exacerbating global trade tensions, particularly as tariff pressures remain in place. These warnings have reinforced investor skepticism toward cyclical and China-sensitive assets.
Yen has also drawn support from Japan’s domestic backdrop. Tankan survey data showed improving manufacturing sentiment, resilient capital expenditure plans, and inflation expectations stabilizing slightly above the BoJ’s 2% target, strengthening expectations for a rate hike later this week.
Although Japan’s economy contracted in the third quarter as exports faltered under U.S. tariffs, momentum appears to be turning. Exports and factory output have shown signs of recovery, supporting expectations that growth will rebound in the current quarter and allowing the BoJ to continue normalization cautiously.
For now, Yen leads FX gains, followed by Loonie and Dollar. Kiwi underperforms after weak services data, with Aussie and Sterling also lagging. Euro and Swiss Franc sit mid-pack.
Looking ahead, markets face a packed calendar with BoE, ECB, and BoJ decisions, but US CPI and labor data are likely to be the decisive drivers as markets approach year-end.
In Asia, Nikkei fell -1.18%. Hong Kong HSI is down -1.17%. China Shanghai SSE is down -0.35%. Singapore Strait Times is down -0.11%. Japan 10-year JGB yield rose 0.002 to 1.957.
Japan Tankan: Manufacturing sentiment improves as firms absorb tariff impact
Japan’s Q4 Tankan survey delivered a broadly supportive signal for the economy, reinforcing expectations that the BoJ will proceed with rate normalization. The large manufacturing index rose from 14 to 15, in line with expectations, marking a third consecutive quarterly improvement and the strongest reading since December 2021. The result suggests manufacturers have so far weathered the impact from higher U.S. tariffs better than feared.
Sentiment among non-manufacturers was less impressive, with the index unchanged at 34, falling short of expectations for a modest uptick. Even so, the divergence does not point to a meaningful deterioration in overall conditions, as services confidence remains elevated relative to historical norms.
Capital spending intentions added to the constructive tone. Large firms now plan to increase investment by 12.6% in the current fiscal year ending March 2026, slightly above market expectations of 12.0%.
The survey also indicated firms expect inflation to average 2.4% across one-, three-, and five-year horizons, suggesting expectations are stabilizing around the BoJ’s 2% target.
With tariff uncertainty easing and manufacturing sentiment holding firm, the survey supports the dominant market view that BoJ is positioned to raise rates in December, even as the pace of tightening beyond that remains gradual.
China data disappoints as consumption and investment weaken further
China’s November activity data delivered a broadly weaker-than-expected picture. Industrial production rose 4.8% yoy, missing expectations for 5.0% growth and marking the weakest pace since August 2024.
The sharper disappointment came from consumption. Retail sales rose just 1.3% yoy, far below expectations of 2.9% and slowing markedly from October’s 2.9% pace. It was also the weakest reading since December 2022.
Investment conditions also deteriorated. Year-to-date fixed asset investment fell -2.6%, deeper than expected -2.3% and the sharpest contraction since the pandemic in 2020. The drag from property intensified, with real estate investment down -15.9% in the first eleven months of the year, extending the slump seen earlier and reinforcing the view that the property sector remains a central constraint on China’s recovery.
RBNZ's Breman sees OCR holding at 2.25% if outlook unfolds as expected
RBNZ Governor Anna Breman signaled in media interviews today that the bar for further near-term easing remains high. While the forward path published in the November Monetary Policy Statement allows for a small probability of another rate cut, Breman stressed "if economic conditions evolve as expected the OCR is likely to remain at its current level of 2.25 per cent for some time."
Looking ahead to the next OCR decision in February, Breman said the central bank will continue to assess incoming data, financial conditions, and global developments, with a particular focus on implications for New Zealand’s economic outlook and its medium-term inflation objective.
Breman also reiterated that monetary policy is not on a preset course, highlighting the MPC’s regular meeting schedule as a reflection of that flexibility.
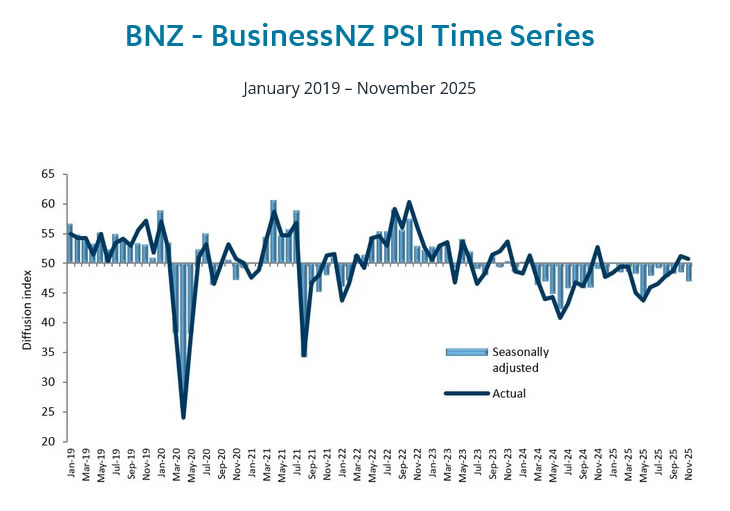
NZ BNZ service falls to 46.9, recovery hopes dented
New Zealand’s services sector slipped deeper into contraction in November, reinforcing signs that domestic demand remains fragile. BusinessNZ Performance of Services Index fell from 48.4 to 46.9, marking the lowest level of activity since May and sitting well below the survey’s long-run average of 52.8. All five sub-indices remained in contraction territory, underlining the broad-based nature of the slowdown.
Activity and sales saw the sharpest deterioration, dropping from 48.4 to 45.8, while employment also weakened from 48.6 to 46.4. New orders edged marginally higher from 49.2 to 49.3, offering little evidence of an imminent turnaround in demand.
BusinessNZ Chief Executive Katherine Rich said the November reading "put to bed" any immediate hope that the sector was moving toward expansion. While the proportion of negative comments eased slightly from recent months, businesses continued to cite a weak economic backdrop, low consumer confidence, high living costs, inflation, interest rates, and reduced spending as the dominant constraints on activity.
Final busy week before holidays puts NFP, CPI, BoE and BoJ in Focus
It is another event-packed week ahead before year-end holidays thin liquidity and mute follow-through. Three major central banks—BoE, ECB, and BoJ—will deliver policy decisions. But heavy-weight US data releases are expected to dominate price action and determine whether recent Dollar weakness turns from hesitation into conviction.
November US CPI and non-farm payrolls will be crucial in shaping expectations for the length of the Fed’s pause into early 2026. After last week’s risk-management cut, markets are largely priced for a January hold, while odds of a March move remain near 50%.
Fed Chair Jerome Powell has made it clear that policy focus has shifted toward employment rather than inflation. Tariff-related price pressures are increasingly viewed as transitory, reducing urgency to respond to short-term inflation noise. As a result, labor market data is likely to carry more weight than CPI in determining near-term Dollar direction, especially if hiring c shows further renewed deterioration.
In the UK, BoE is widely expected to deliver a 25bps rate cut to 3.75% on Thursday. Market concerns around the Autumn Budget have faded without disruption, while recent data suggests inflation has peaked lower than previously feared. The policy decision itself is well priced, leaving attention firmly on what comes next.
That BoE outlook remains uncertain. A recent Reuters poll shows no clear consensus on the 2026 rate path. Around two-thirds of economists expect a follow-up cut to 3.50% by end-March, while median forecasts see rates bottoming at 3.25% in Q3, implying two additional cuts next year. Voting patterns and Governor Andrew Bailey’s press conference will be scrutinized, though both are likely to highlight internal MPC splits rather than provide firm guidance.
ECB policy looks far more settled. Officials have been explicit that they are comfortable with the Deposit rate at 2.00%, with the bar for any move set high for the foreseeable future. According to Reuters polling, roughly 80% of economists expect rates to remain unchanged through mid-2026, with nearly three-quarters holding that view through year-end.
Speculation that the ECB’s next move could be a hike continues to circulate, but it remains premature. Markets and President Christine Lagarde are unlikely to entertain such discussions seriously . Instead, attention will fall on updated economic projections and sentiment indicators such as German ZEW and Ifo surveys.
In Japan, BoJ is now expected to raise rates by 25bps to 0.75%, following increasingly explicit signals from officials that normalization should resume. Governor Kazuo Ueda’s recent meeting with Prime Minister Sanae Takaichi is seen as political clearance for the move, reducing uncertainty around timing.
Even so, tightening beyond this week is expected to be slow and conditional. Future hikes will depend heavily on the outcome of next year’s Shunto wage negotiations, which appear constructive but not yet decisive. A Reuters poll shows just over two-thirds of economists expect rates to reach at least 1.00% by next September, while only a minority see 1.25% by end-2026. Japan’s Tankan survey and national CPI will help frame expectations.
Elsewhere, Canada CPI and retail sales will be watched for any challenge to BoC’s extended pause narrative, while New Zealand GDP will help gauge whether recent stabilization is evolving into a firmer recovery. PMI readings from major economies will provide timely growth signals, but unless they deliver clear surprises, they are likely to reinforce rather than redefine the week’s dominant US-driven themes.
Here are some highlights for the week:
- Monday: New Zealand BNZ services; Japan Tankan survey; China industrial production, retail sales, fixed asset investment; Swiss PPI, SECO economic forecasts; Eurozone industrial production; Canada CPI, manufacturing sales; US Empire state manufacturing.
- Tuesday: Australia PMIs, Westpac consumer confidence; UK employment PMIs; Eurozone PMIs, trade balance, Germany ZEW economic sentiment; US non-farm payrolls, retail sales, PMIs.
- Wednesday: Japan trade balance; UK CPI, PPI; Germany Ifo business climate; Eurozone CPI final.
- Thursday: New Zealand GDP; Swiss trade balance; BoE rate decision; ECB rate decision; US CPI, jobless claims, Philly Fed survey.
- Friday: New Zealand trade balance, ANZ business confidence; Japan CPI, BoJ rate decision; Germany Gfk consumer sentiment, PPI; UK retail sales; Canada retail sales; US existing home sales.
EUR/JPY Daily Outlook
Daily Pivots: (S1) 182.60; (P) 182.88; (R1) 183.23; More...
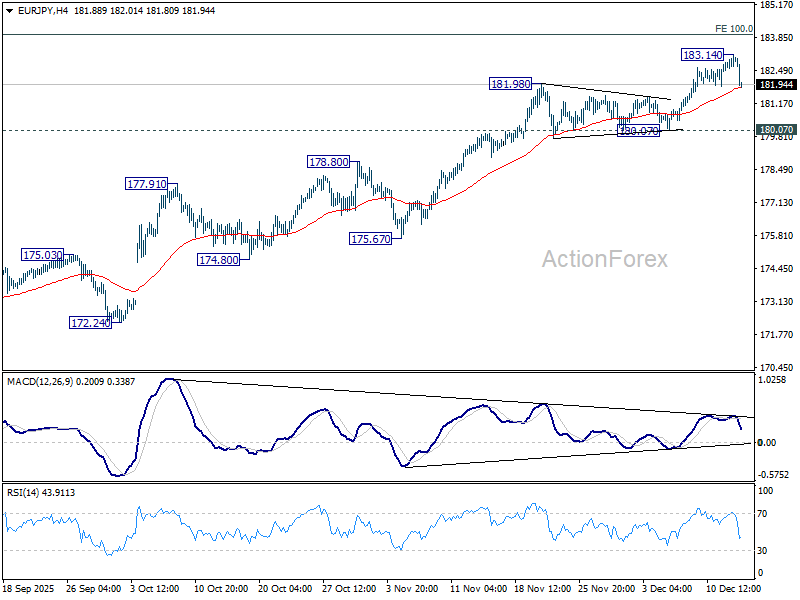
Intraday bias in EUR/JPY is turned neutral with current steep retreat and some consolidations would be seen below 187.14. Further rally remains in favor. But considering bearish divergence condition in both 4H and D MACD, upside should be limited 100% projection of 161.06 to 173.87 from 171.09 at 183.90, at least on first attempt. Meanwhile, firm break of 180.07 will confirm short term topping, and bring deeper correction to 55 D EMA (now at 178.59).
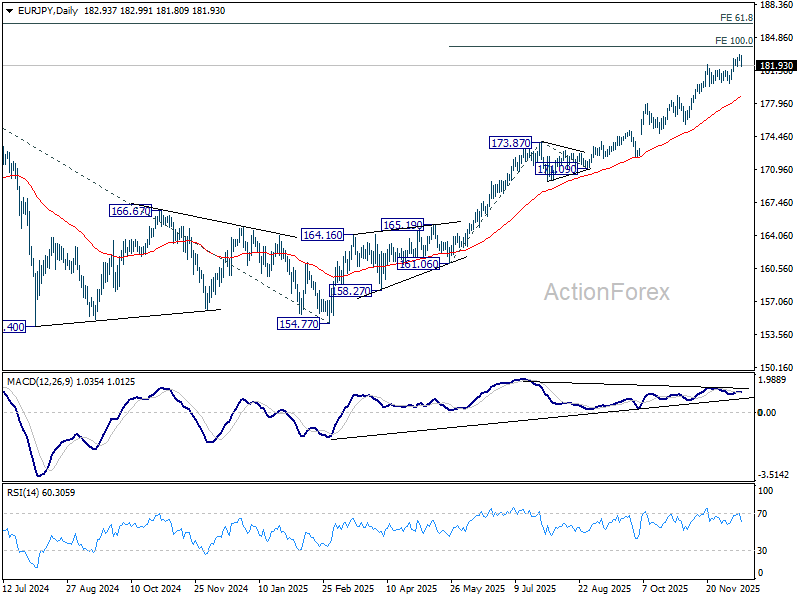
In the bigger picture, up trend from 114.42 (2020 low) is in progress and should target 61.8% projection of 124.37 to 175.41 from 154.77 at 186.31. However, considering bearish divergence condition in D MACD, upside should be capped by 186.31 on first attempt. Outlook will continue to stay bullish as long as 55 W EMA (now at 170.73) holds, even in case of deep pullback.
China data disappoints as consumption and investment weaken further
China’s November activity data delivered a broadly weaker-than-expected picture. Industrial production rose 4.8% yoy, missing expectations for 5.0% growth and marking the weakest pace since August 2024.
The sharper disappointment came from consumption. Retail sales rose just 1.3% yoy, far below expectations of 2.9% and slowing markedly from October’s 2.9% pace. It was also the weakest reading since December 2022.
Investment conditions also deteriorated. Year-to-date fixed asset investment fell -2.6%, deeper than expected -2.3% and the sharpest contraction since the pandemic in 2020. The drag from property intensified, with real estate investment down -15.9% in the first eleven months of the year, extending the slump seen earlier and reinforcing the view that the property sector remains a central constraint on China’s recovery.
Japan Tankan: Manufacturing sentiment improves as firms absorb tariff impact
Japan’s Q4 Tankan survey delivered a broadly supportive signal for the economy, reinforcing expectations that the BoJ will proceed with rate normalization. The large manufacturing index rose from 14 to 15, in line with expectations, marking a third consecutive quarterly improvement and the strongest reading since December 2021. The result suggests manufacturers have so far weathered the impact from higher U.S. tariffs better than feared.
Sentiment among non-manufacturers was less impressive, with the index unchanged at 34, falling short of expectations for a modest uptick. Even so, the divergence does not point to a meaningful deterioration in overall conditions, as services confidence remains elevated relative to historical norms.
Capital spending intentions added to the constructive tone. Large firms now plan to increase investment by 12.6% in the current fiscal year ending March 2026, slightly above market expectations of 12.0%.
The survey also indicated firms expect inflation to average 2.4% across one-, three-, and five-year horizons, suggesting expectations are stabilizing around the BoJ’s 2% target.
With tariff uncertainty easing and manufacturing sentiment holding firm, the survey supports the dominant market view that BoJ is positioned to raise rates in December, even as the pace of tightening beyond that remains gradual.
RBNZ’s Breman sees OCR holding at 2.25% if outlook unfolds as expected
RBNZ Governor Anna Breman signaled in media interviews today that the bar for further near-term easing remains high. While the forward path published in the November Monetary Policy Statement allows for a small probability of another rate cut, Breman stressed "if economic conditions evolve as expected the OCR is likely to remain at its current level of 2.25 per cent for some time."
Looking ahead to the next OCR decision in February, Breman said the central bank will continue to assess incoming data, financial conditions, and global developments, with a particular focus on implications for New Zealand’s economic outlook and its medium-term inflation objective.
Breman also reiterated that monetary policy is not on a preset course, highlighting the MPC’s regular meeting schedule as a reflection of that flexibility.
NZ BNZ service falls to 46.9, recovery hopes dented
New Zealand’s services sector slipped deeper into contraction in November, reinforcing signs that domestic demand remains fragile. BusinessNZ Performance of Services Index fell from 48.4 to 46.9, marking the lowest level of activity since May and sitting well below the survey’s long-run average of 52.8. All five sub-indices remained in contraction territory, underlining the broad-based nature of the slowdown.
Activity and sales saw the sharpest deterioration, dropping from 48.4 to 45.8, while employment also weakened from 48.6 to 46.4. New orders edged marginally higher from 49.2 to 49.3, offering little evidence of an imminent turnaround in demand.
BusinessNZ Chief Executive Katherine Rich said the November reading "put to bed" any immediate hope that the sector was moving toward expansion. While the proportion of negative comments eased slightly from recent months, businesses continued to cite a weak economic backdrop, low consumer confidence, high living costs, inflation, interest rates, and reduced spending as the dominant constraints on activity.
EUR/USD Reclaims Positive Ground—Is This More Than a Bounce?
Key Highlights
- EUR/USD started a steady increase above 1.1650 and 1.1700.
- It could struggle to clear the 1.1800 resistance on the 4-hour chart.
- GBP/USD climbed toward 1.3450 before it saw a minor pullback.
- Gold started a fresh surge above $4,250 and $4,300.
EUR/USD Technical Analysis
The Euro formed a base above 1.1620 and started a fresh increase against the US Dollar. EUR/USD surpassed 1.1680 to enter a positive zone.
Looking at the 4-hour chart, the pair cleared many hurdles near 1.1700. It settled above the 100 simple moving average (red, 4-hour) and the 200 simple moving average (green, 4-hour). A new multi-week high was formed at 1.1762 before the pair started a consolidation phase.
There was a minor decline to the 23.6% Fib retracement level of the upward move from the 1.1615 swing low to the 1.1762 high. On the downside, there is key support at 1.1705.
The first major support is near the 50% Fib retracement level at 1.1688. The next support could be 1.1670, below which the bears might aim for a move toward the 100 simple moving average (red, 4-hour) at 1.1615.
Immediate resistance sits near 1.1765. The first key hurdle is seen near 1.1800. A close above 1.1800 could open the doors for a move toward 1.1850. Any more gains could set the pace for a steady increase toward 1.1880.
Looking at GBP/USD, the pair gained pace for a strong increase and was able to clear the 1.3400 resistance zone.
Upcoming Key Economic Events:
- NY Empire State Manufacturing Index for Dec 2025 – Forecast 10.6, versus 18.7 previous.
- Fed's Miran speech.
- Fed's Williams speech.
Key U.S. Data and Central Banks Drive the Last Full Trading Week of the Year
The focus of the week was the FOMC meeting. The U.S. Federal Reserve cut interest rates for the third meeting in a row, lowering the policy rate to 3.50%–3.75%. After the decision, Fed Chair Powell sounded more open to further rate cuts than markets expected. This supported U.S. stocks and gold and led to continued selling of the U.S. dollar.
In Japan, GDP data came in weaker than expected, highlighting slowing growth. However, comments from Bank of Japan Governor Ueda shifted market expectations. He said inflation is moving closer to the BOJ’s target, increasing expectations of an interest rate hike at this week’s BOJ meeting. At the same time, the 10-year Japanese government bond yield rose to around 1.95%, an important level for markets.
Toward the end of the week, technology stocks came under pressure, as concerns returned about high valuations in AI-related companies. While overall market sentiment remains positive, these worries could continue to create volatility in the tech sector.
Markets This Week
U.S. Stocks
The Dow dipped early in the week but rebounded strongly after the FOMC statement signaled a more accommodative stance toward further interest rate cuts in 2026. This pushed the index to new record highs. While technology stocks remain under pressure, the Dow continues to show strength, with the 10-day moving average trending higher and acting as support. As long as this uptrend remains intact, buying pullbacks remains the preferred strategy. Resistance is seen at 48,500 and 49,000, while support is located at 48,000, 47,500, 47,000, 46,500, and 46,000.
Japanese Stocks
The Nikkei 225 traded sideways last week as weak domestic economic data and rising expectations for an interest rate hike offset the positive impact of higher U.S. stock prices. The upcoming rate hike is largely priced in and is unlikely to trigger a sharp sell-off as seen in the past. However, with domestic growth under pressure and long-term Japanese interest rates continuing to rise, the risk of a move lower appears higher in the near term. Resistance is at 51,000円, 51,500円, and 52,000円, while support is at 49,000円, 48,000円, and 47,000円.
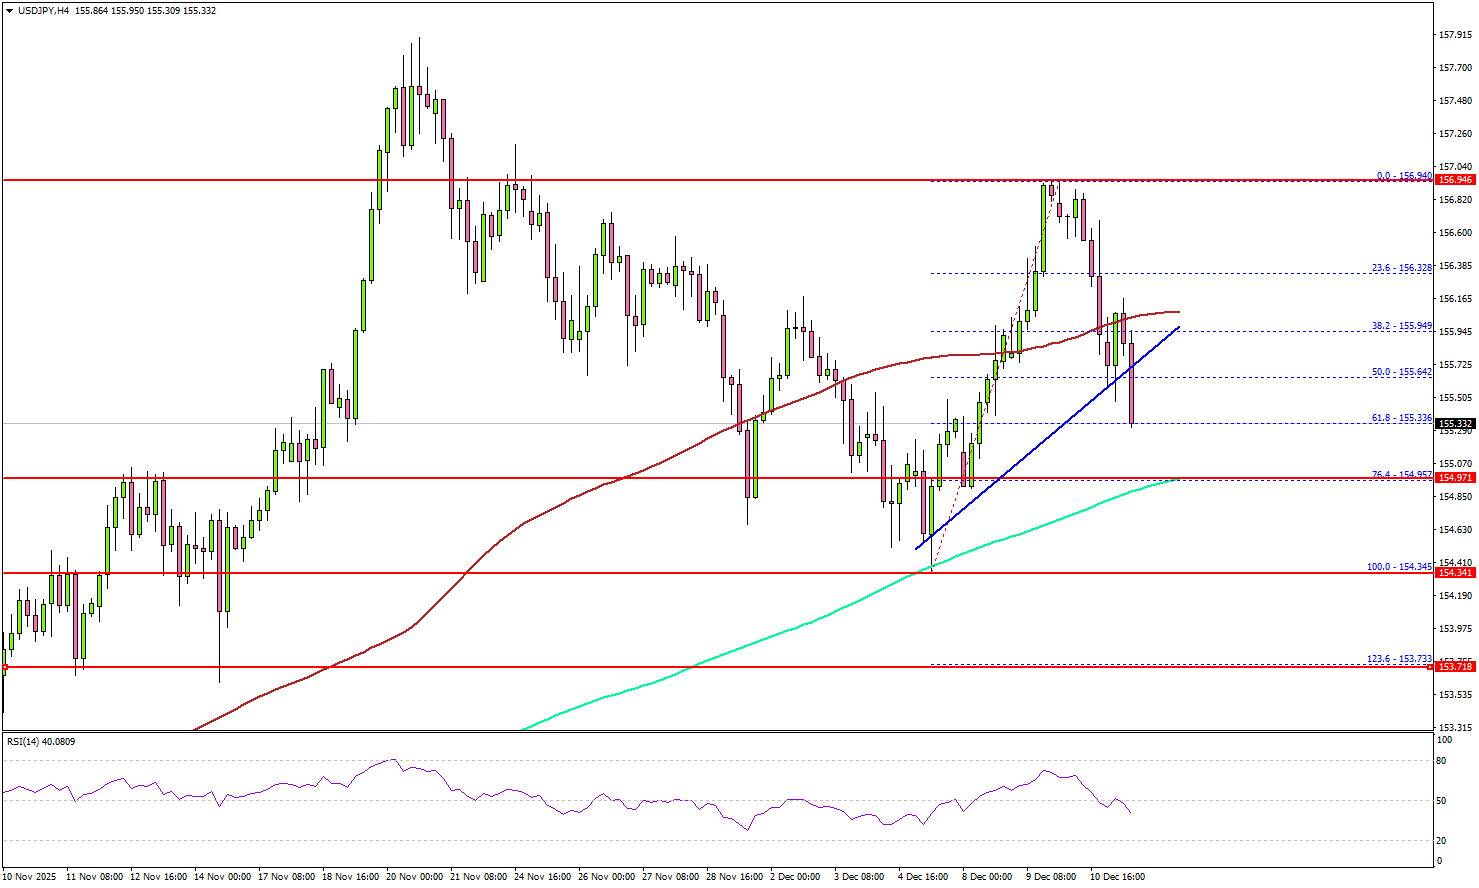
USD/JPY
USD/JPY briefly moved higher on weak Japanese economic data ahead of the FOMC meeting, but finished the week close to unchanged. Fed Chair Powell’s comments increased expectations for further interest rate cuts, putting pressure on the U.S. dollar. Range trading is likely ahead of the BOJ meeting, which is the main focus of the week, offering near-term trading opportunities. Resistance is at 156, 157, and 158, while support is at 154, 153, and 152.
Gold
Gold remained well supported after Fed Chair Powell’s statement weakened the U.S. dollar and reinforced expectations for further U.S. interest rate cuts. Prices paused just below record highs from October as the market became slightly overbought in the short term. Despite this, the broader uptrend remains strong, and buying pullbacks toward the 10-day moving average continues to be the preferred strategy as gold targets new highs. Resistance is at $4,300, $4,350, $4,380, and $4,400, while support is seen at $4,200, $4,150, and $4,100.
Crude Oil
WTI struggled to hold above $60 last week as concerns over U.S. demand and rising inventories encouraged selling, despite the Federal Reserve’s interest rate cut. With these supply-demand pressures still in place, the market is likely to remain under pressure into 2025, and a retest of the yearly lows appears increasingly likely. Resistance is seen at $60, $65, $66.50, $70, and $75, while support remains at $55 and $50.
Bitcoin
Bitcoin tested resistance near $95,000, supported by expectations of lower U.S. interest rates. However, selling in technology stocks late in the week put pressure on prices, leaving Bitcoin to close near the middle of its recent range. With buyers cautious, range trading between $85,000 and $95,000 remains the preferred short-term strategy. Resistance is at $95,000 and $100,000, while support is at $85,000, $80,000, and $75,000.
This Weeks Focus Image
This Week’s Focus
- Monday: Japan Tanaka Index, China Industrial Production, E.U. Industrial Production, NY Empire State Manufacturing Index
- Tuesday: Japan au Jibun Bank Services PMI, U.K. Unemployment Rate, E.U. HCOB Eurozone Manufacturing PMI, U.K. S&P Global Manufacturing PMI, U.S. Non Farm Payroll, Retail Sales and S&P Global Manufacturing PMI
- Wednesday: Japan Trade Balance, U.K. CPI, E.U. CPI
- Thursday: U.K. BoE Interest Rate Decision, E.U. ECB Interest Rate Decision, U.S. CPI and Philadelphia Fed Manufacturing Index
- Friday: Japan National CPI and BoJ Interest Rate Decision, U.K. Retail Sales, U.S. Existing Home Sales and Michigan Consumer Sentiment
The final full trading week before the holiday season is set to be busy, with several major central bank meetings. The European Central Bank is expected to leave interest rates unchanged, while the Bank of England is expected to cut rates, and the Bank of Japan is widely expected to raise rates. In the U.S., delayed employment data will be released midweek, alongside retail sales and inflation data, which could influence near-term market sentiment. Inflation data from Europe and the UK will also be closely watched, as markets look for signals on interest rate expectations into 2026.
Gold Wave Analysis
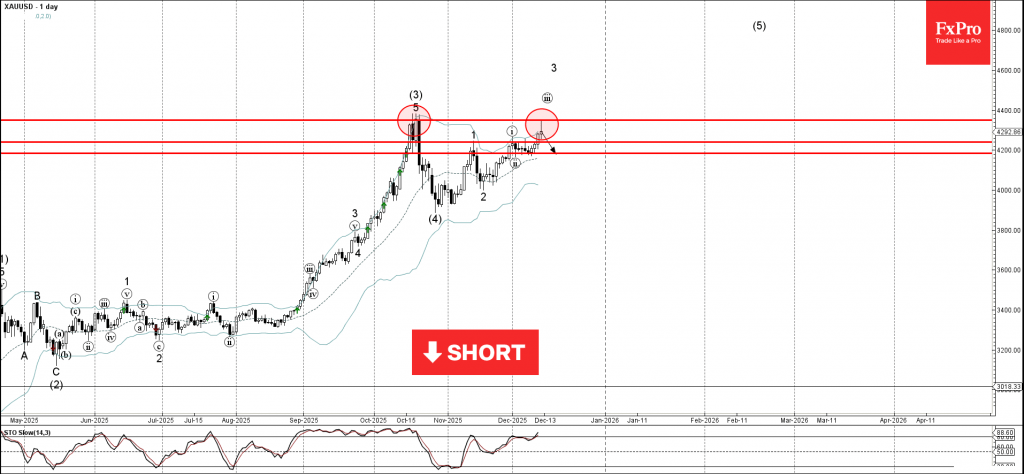
Gold: ⬇️ Sell
- Gold reversed from strong resistance level 4350.00
- Likely to fall to support level 4200.00
Gold recently reversed from the resistance area between the strong resistance level 4350.00 (which stopped sharp wave (3) in October) and the upper daily Bollinger Band.
The downward reversal from this resistance area stopped the previous impulse waves iii and 3 of the intermediate impulse wave (5).
Given the strength of the resistance level 4350.00 and the overbought daily Stochastic, Gold can be expected to fall to the next support level 4200.00.