
Sample Category Title
USD/CAD Daily Outlook
Daily Pivots: (S1) 1.3748; (P) 1.3768; (R1) 1.3789; More...
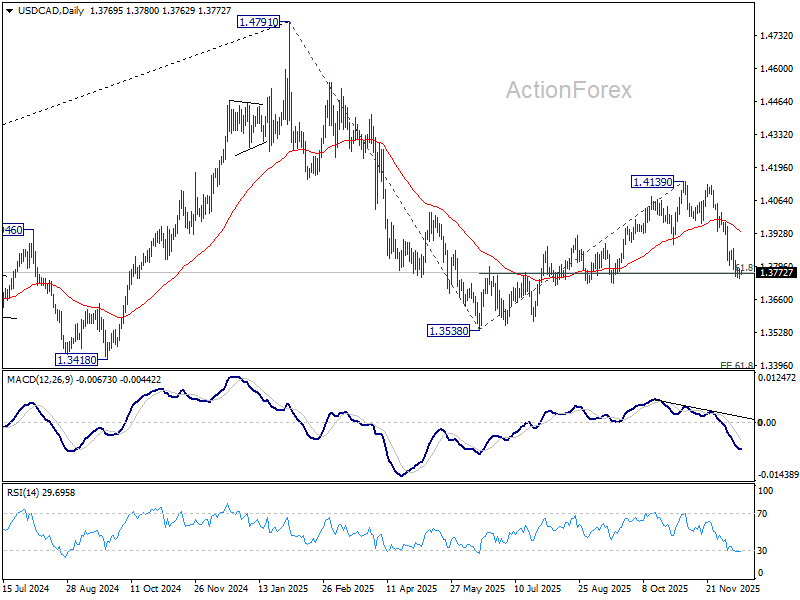
A temporary low should be in place at 1.3746 and intraday bias is turned neutral in USD/CAD. With 1.3870 resistance intact, further decline remains in favor. Sustained trading below 61.8% retracement of 1.3538 to 1.4139 at 1.3768 will argue that whole fall form 1.4791 might be ready to resume. Retest of 1.3538 low should be seen next. On the upside, however, break of 1.3870 resistance will indicate short term bottoming, and turn bias back to the upside for stronger rebound.
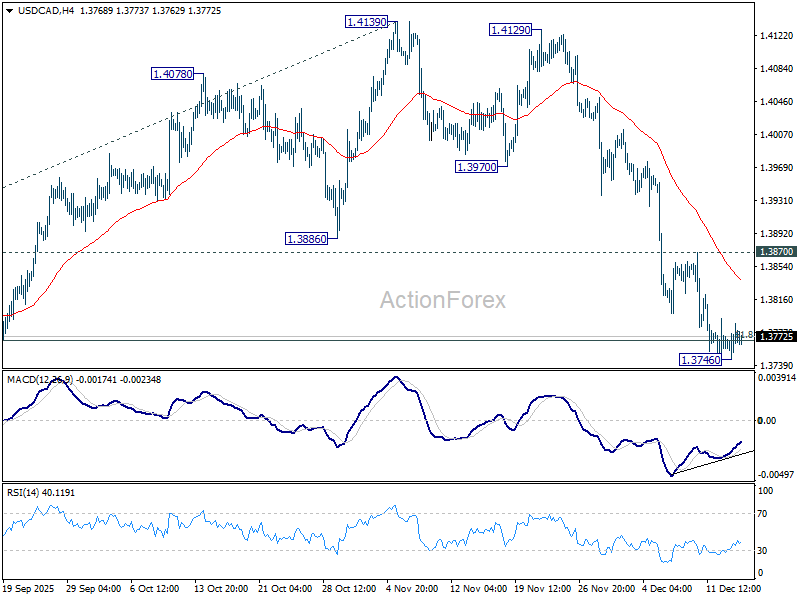
In the bigger picture, current development suggests that price actions from 1.4791 is developing into a deeper, larger scale correction. In the less bearish case, it's just correcting the rise from 1.2005 (2021 low). But even so, break of 1.3538 will pave the way to 61.8% projection of 1.4791 to 1.3538 from 1.4139 at 1.3365. This will remain the favored case as long as 1.4139 resistance holds, in case of rebound.
AUD/USD Daily Report
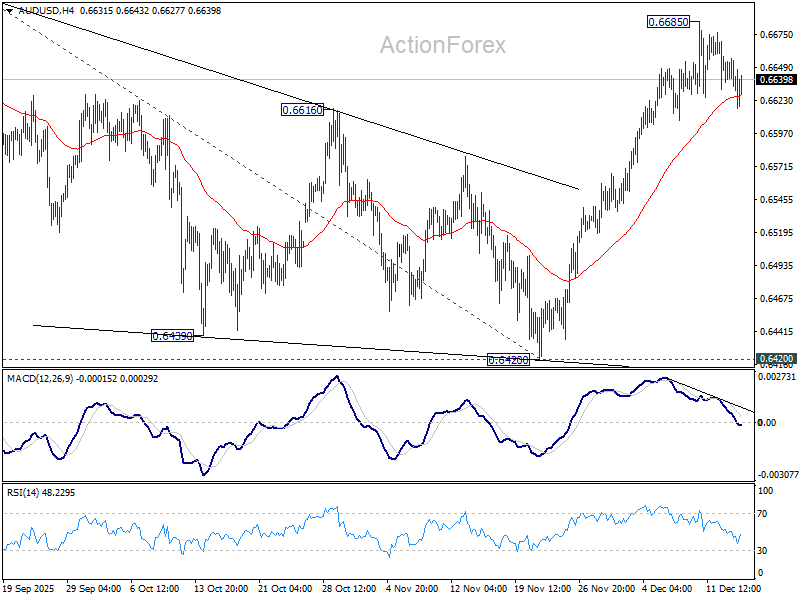
Daily Pivots: (S1) 0.6630; (P) 0.6643; (R1) 0.6655; More...
AUD/USD is staying in consolidations below 0.6685 and intraday bias remains neutral. On the upside, firm break of 0.6706 will confirm resumption of whole rise from 0.5913. Next target is 61.8% projection of 0.5913 to 0.6706 from 0.6420 at 0.6910. However, break of 55 D EMA (now at 0.6555) will extend the corrective pattern from 0.6706 with another falling leg.
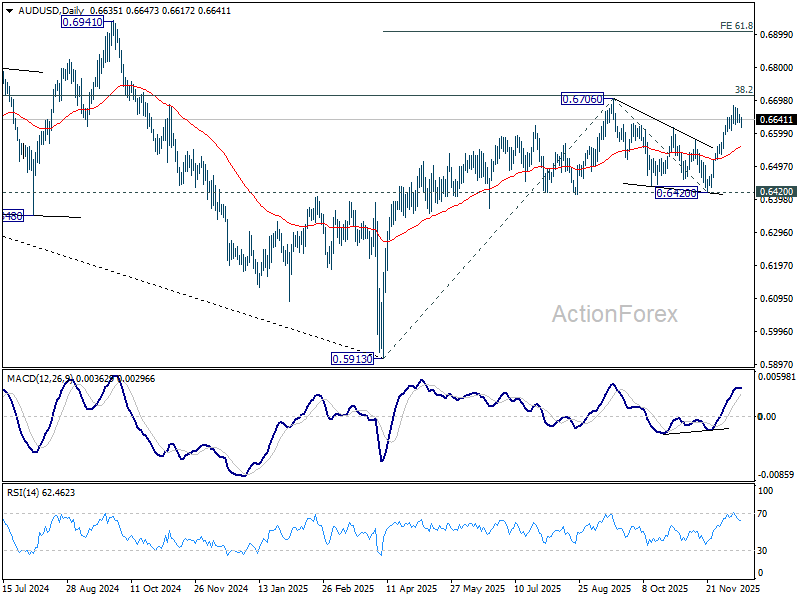
In the bigger picture, the break of multi-year falling trend line resistance suggests that rise from 0.5913 is possibly reversing whole down trend from 08006 (2021 high). Decisive break of 38.2% retracement of 0.8006 to 0.5913 at 0.6713 will solidify this case, and bring further rally to 61.8% retracement at 0.7206. On the downside, however, firm break of 0.6420 support will suggest rejection by 0.6713 and retain medium term bearishness.
USD/JPY Daily Outlook
Daily Pivots: (S1) 154.70; (P) 155.35; (R1) 155.85; More...
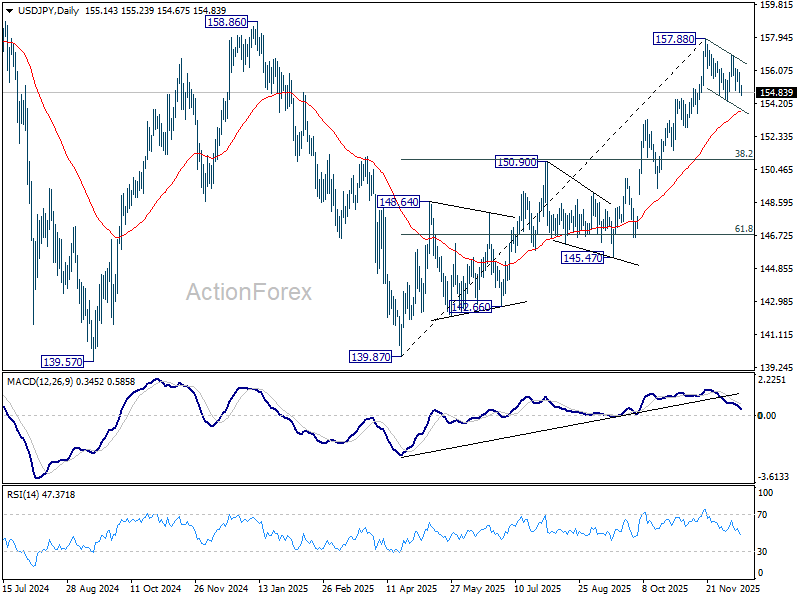
Intraday bias in USD/JPY remains neutral as corrective pattern from 157.88 is extending. On the downside, break of 154.33 will target 55 D EMA (now at 153.66) and possibly below. On the upside, above 156.94 will bring retest of 157.88. Firm break there will resume whole rally from 139.87 to 158.85 key structural resistance.
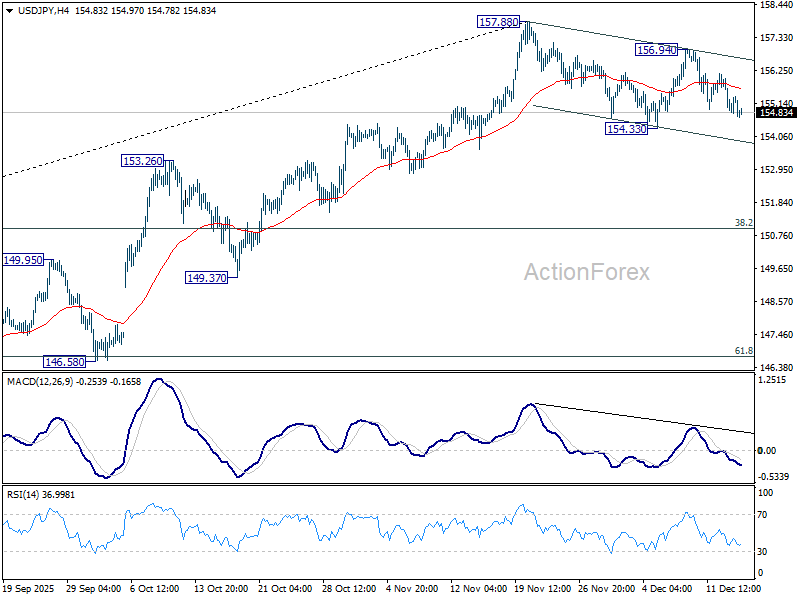
In the bigger picture, corrective pattern from 161.94 (2024 high) could have completed with three waves at 139.87. Larger up trend from 102.58 (2021 low) could be ready to resume through 161.94 high. Decisive break of 158.85 structural resistance will solidify this bullish case and target 161.94 for confirmation. On the downside, break of 150.90 resistance turned support will dampen this bullish view and extend the corrective range pattern with another falling leg.
USD/CHF Daily Outlook
Daily Pivots: (S1) 0.7942; (P) 0.7958; (R1) 0.7978; More…
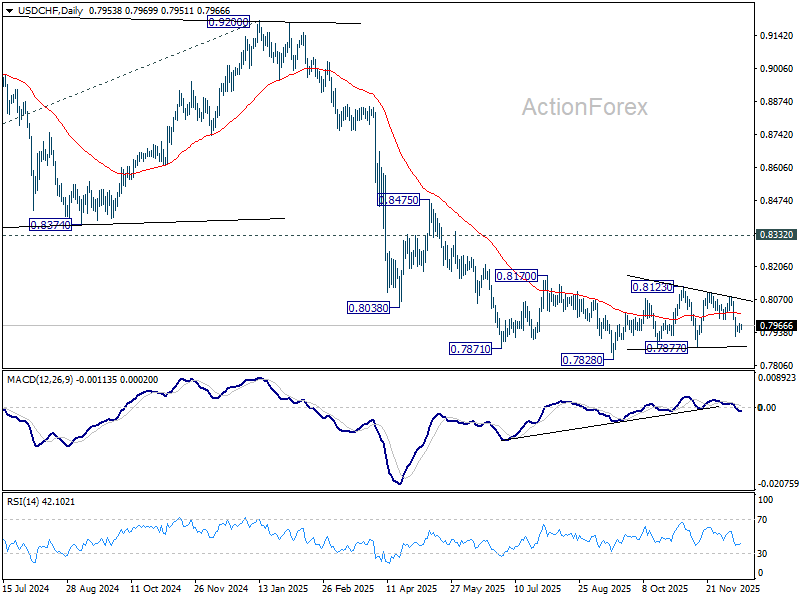
Intraday bias in USD/CHF remains neutral for the moment. Corrective pattern from 0.7828 is still extending. On the downside, below 0.7923 will target 0.7877 support. On the upside, though, break of 0.7990 support turned resistance will bring stronger rebound towards 0.8084.
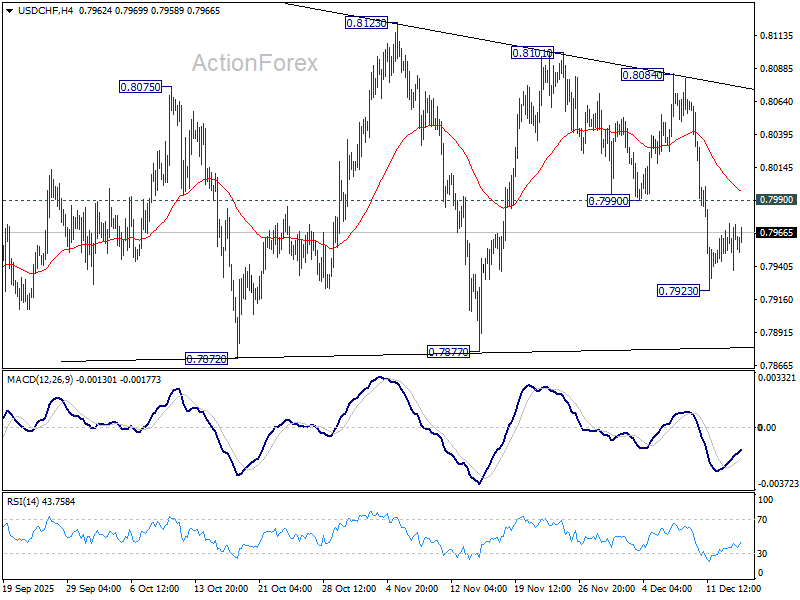
In the bigger picture, outlook will stay bearish as long as 0.8332 support turned resistance holds (2023 low). Long term down trend from 1.0342 (2017 high) is still in progress. Next target is 100% projection of 1.0146 (2022 high) to 0.8332 from 0.9200 at 0.7382.
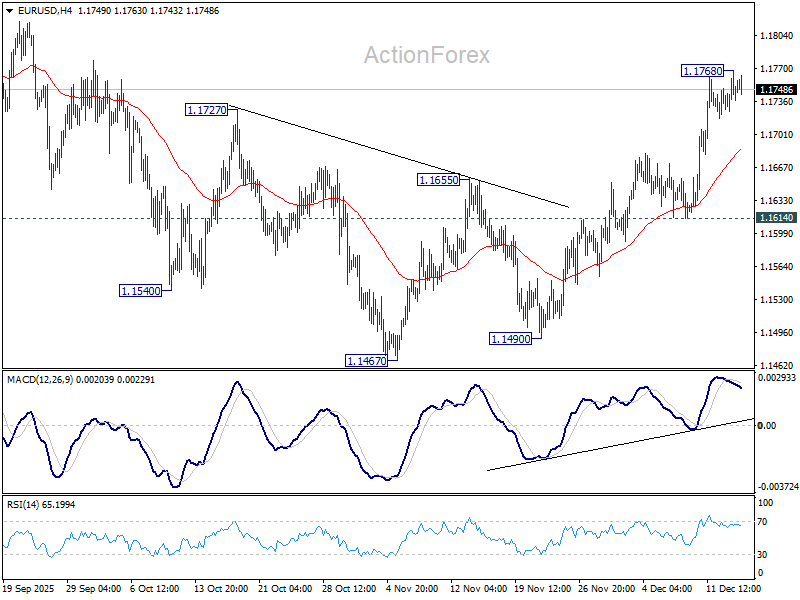
EUR/USD Daily Outlook
Daily Pivots: (S1) 1.1723; (P) 1.1737; (R1) 1.1753; More….
A temporary top should be in place at 1.1768 in EUR/USD and intraday bias is turned neutral first. Some consolidations would be seen but further rally is expected as long as 1.1614 support holds. Above 1.1768 will resume the rebound from 1.1467 and target a retest on 1.1917 high.
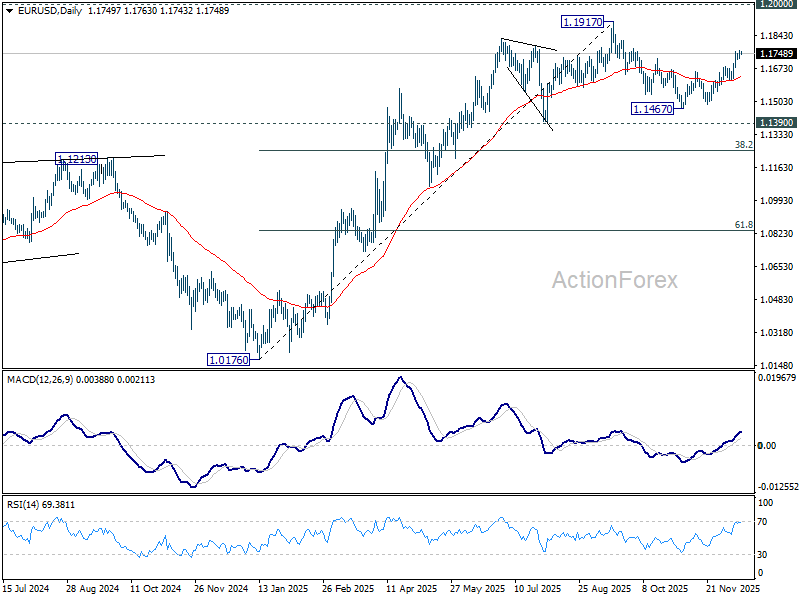
In the bigger picture, as long as 55 W EMA (now at 1.1373) holds, up trend from 0.9534 (2022 low) is still in favor to continue. Decisive break of 1.2 key psychological level will carry larger bullish implication. However, sustained trading below 55 W EMA will argue that rise from 0.9534 has completed as a three wave corrective bounce, and keep long term outlook bearish.
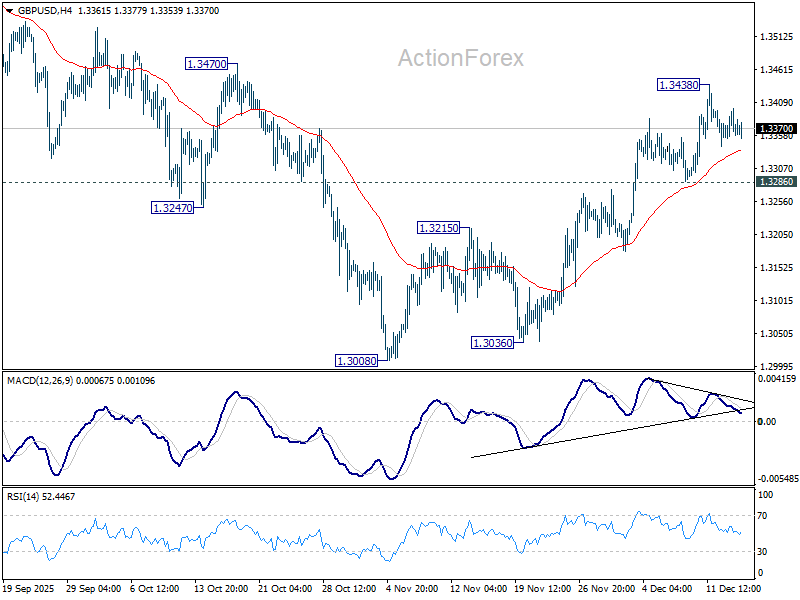
GBP/USD Daily Outlook
Daily Pivots: (S1) 1.3354; (P) 1.3378; (R1) 1.3401; More...
Intraday bias in GBP/USD remains neutral as consolidations continue below 1.3438. With 1.3286 support intact, further rally is expected. As noted before, fall from 1.3787 should have completed as a three-wave correction to 1.3008. Above 1.3428 and firm break of 1.3470 resistance will pave the way back to retest 1.3787 high. However, sustained break of 1.3286 support will mix up the near term outlook.
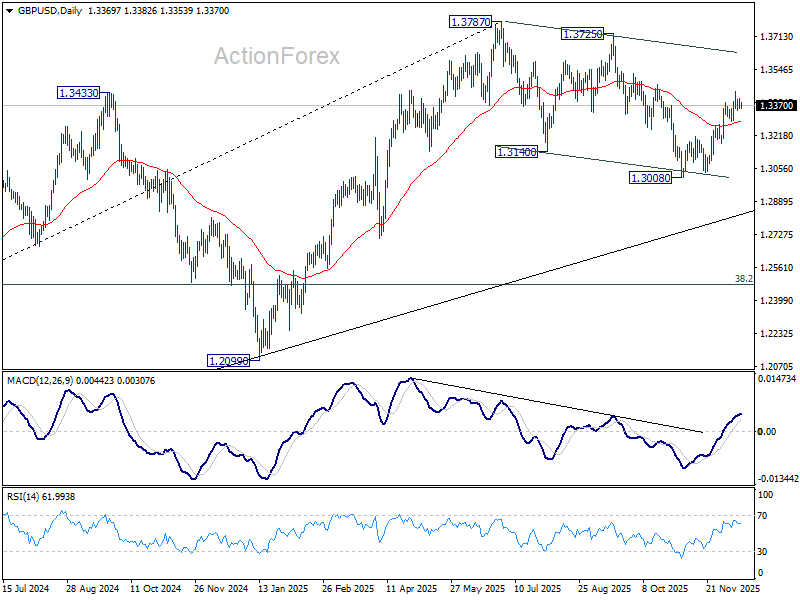
In the bigger picture, current development suggests that fall from 1.3787 is merely a corrective move, and larger rise from 1.0351 (2022 low) is still in progress. Firm break of 1.3787 will target 1.4248 (2021 high) key structural resistance. This will remain the favored case as long as target 38.2% retracement of 1.0351 to 1.3787 at 1.2474 holds, in case of another fall.
UK Data Mixed, Dollar Awaits Delayed NFP for Direction
Sterling is steady in early European trading after UK labor data reinforced a familiar theme of softening employment alongside stubborn wage pressures. Job losses continued, while pay growth remained elevated. The data is unlikely to derail the BoE’s widely expected 25bps rate cut to 3.75% later this week.
While markets remain comfortable with the view that policy easing will continue into 2026, it's highly uncertain on how much further the BoE can realistically go. Inflation has peaked lower than previously feared, but at 3.6% in October it remains well above target. With estimates of the UK neutral rate clustered around 3.25–3.75%, the scope for aggressive easing appears limited.
Even if the neutral rate proves slightly lower, there may only be room for one or two additional cuts unless inflation falls materially. That constraint is helping anchor Sterling and temper expectations for an extended easing cycle.
Attention now shifts decisively to the US, where markets await the delayed November employment report. The Bureau of Labor Statistics is due to publish the data on Tuesday following the 43-day government shutdown, alongside a partial update for October that will exclude the unemployment rate and several household-based measures.
Nonfarm payrolls are expected to have risen by around 50k in November, while October lacks a formal consensus estimate. One key wildcard is whether September’s 119k gain is revised lower, which would reopen concerns about a sharper deterioration in labor conditions after a weak summer.
With tariff-related inflation pressures proving far milder than worst-case scenarios, Fed officials have increasingly shifted their focus toward labor market health. A January FOMC hold remains the base case and is unlikely to be challenged barring an extreme surprise, but March remains finely balanced and could be swayed by today’s data.
On trade, US Customs and Border Protection reported that more than USD 200bn in tariffs have been collected this year under new duties imposed via over 40 executive orders. That comes as the Supreme Court weighs arguments over the legality of those tariffs, with potential refunds at stake.
In FX markets this week, Yen leads, followed by Euro and Dollar. Kiwi lags, trailed by Aussie and Sterling. Swiss Franc and Loonie sit mid-pack, reflecting a mild risk-off tone, but that could shift quickly on US jobs data.
In Asia, Nikkei fell -1.56%. Hong Kong HSI is down -1.58%. China Shanghai SSE fell -1.11%. Singapore Strait Times is down -0.10%. Japan 10-year JGB yield fell -0.002 to 1.957. Overnight, DOW fell -0.09%. S&P 500 fell -0.16%. NASDAQ fell -0.59%. 10-year yield fell -0.012 to 4.182.
UK payrolls decline deepens even as earnings stay elevated
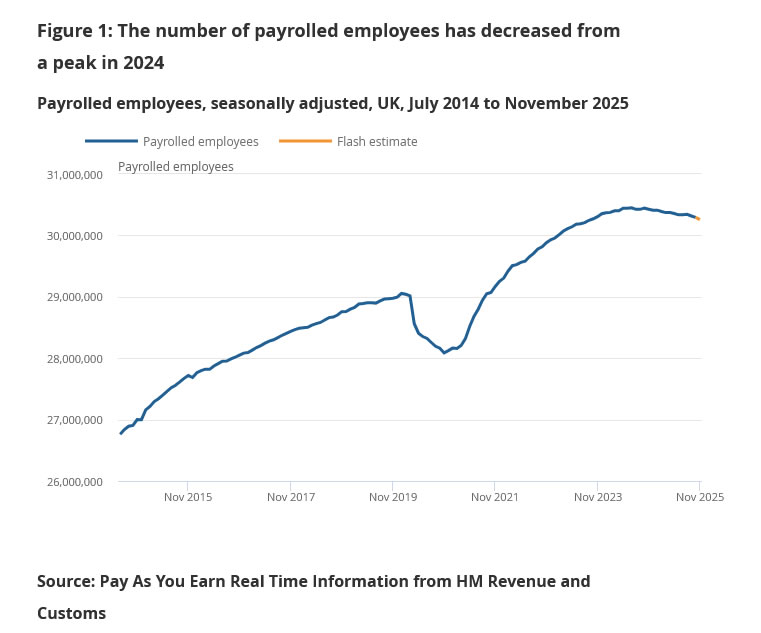
UK labor market data for November pointed to further cooling in employment conditions. Payrolled employment fell by -38k on the month, a -0.1% mom. Annual drop widened to -171k, or 0.6% yoy. Annual payroll growth has now been negative every month since March.
Wage indicators showed clearer signs of easing at the margin. Median monthly pay growth slowed sharply to 2.7% yoy, down from 3.7% previously and less than half the pace seen in August. At the same time, the claimant count rose by 20.1k.
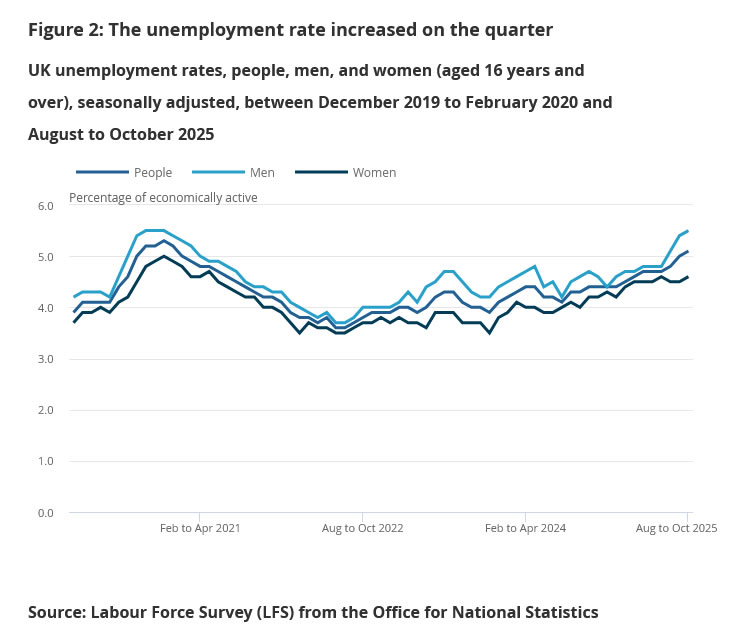
That said, broader earnings data remains elevated. In the three months to October, unemployment rate edged up from 5.0% to 5.1%. Average earnings growth surprised to the upside, rising 4.7% yoy including bonuses and 4.6% yoy excluding bonuses.
Japan's PMI composite falls to 51.5, slowing momentum but manufacturing nears expansion
Japan’s December PMI data pointed to a modest cooling in overall momentum, while offering tentative signs of stabilization in manufacturing. PMI Manufacturing rose from 48.7 to 49.7. PMI Services eased from 53.2 to 52.5, while PMI Composite slipped from 52.0 to 51.5, indicating slower but still positive private-sector growth.
According to S&P Global, Japan’s private sector ended the year on a relatively strong footing, with output continuing to expand and new business rising further. Firms responded by stepping up hiring, with employment growth accelerating to its fastest pace in more than a year and a half. Growth remained concentrated in services, though the decline in manufacturing output and sales softened noticeable.
Forward-looking signals were more cautious. Business confidence weakened, particularly among manufacturers, reflecting subdued foreign demand and concerns about the outlook for 2026. At the same time, cost pressures intensified, with input prices rising at the fastest pace since April. Firms responded by raising output charges "at a solid pace".
Australia PM composite falls to 51.1, growth cooling but persistent price pressures
Australia’s PMI readings for December pointed to moderating growth momentum toward year-end. PMI Manufacturing rose from 51.6 to 52.2, signaling a stronger expansion in factory activity. PMI Services slipped from 52.8 to 51.0. As a result, PMI Composite eased from 52.6 to 51.1, the lowest level in seven months.
The slowdown in overall activity was accompanied by more encouraging details beneath the surface. According to S&P Global, new orders continued to rise at a solid pace, while business confidence improved in December. Employment growth also remained robust, with job creation sustained at faster rates across both manufacturing and services, suggesting firms remain confident enough in demand to continue hiring.
Inflation signals, however, firmed again. Cost pressures intensified for Australian businesses, prompting companies to raise output prices more quickly in an effort to "defend their margins". As a result, output price inflation returned to its long-run average after two months of subdued increases.
Australia Westpac consumer sentiment falls back to 94.5, bounce proves short-lived
Australian consumer confidence fell sharply in December, reversing November’s brief improvement. The Westpac Consumer Sentiment Index dropped -9.0% mom to 94.5, slipping back toward levels seen prior to last month’s surprise bounce. The pullback leaves sentiment only in “cautiously pessimistic” territory as the year comes to a close.
Westpac noted that while confidence has improved meaningfully from the deep and prolonged pessimism that dominated much of 2024, households remain reluctant to shift into outright optimism. The November rebound marked the first net positive reading since the economy reopened after the pandemic, but the latest data suggests that underlying confidence remains fragile and easily unsettled.
The survey reinforces a cautious backdrop for the RBA ahead of its February 2–3 meeting. While inflation has picked up recently, there are few signs that tight labor markets or strong consumer demand are driving the move. Instead, administered prices outside the reach of monetary policy have been a key factor. As those pressures fade, inflation is expected to resume its path toward the midpoint of the target range, though policymakers have warned that if normalization proves slow, rates may need to stay on hold for longer, with hikes still a live contingency.
GBP/USD Daily Outlook
Daily Pivots: (S1) 1.3354; (P) 1.3378; (R1) 1.3401; More...
Intraday bias in GBP/USD remains neutral as consolidations continue below 1.3438. With 1.3286 support intact, further rally is expected. As noted before, fall from 1.3787 should have completed as a three-wave correction to 1.3008. Above 1.3428 and firm break of 1.3470 resistance will pave the way back to retest 1.3787 high. However, sustained break of 1.3286 support will mix up the near term outlook.
In the bigger picture, current development suggests that fall from 1.3787 is merely a corrective move, and larger rise from 1.0351 (2022 low) is still in progress. Firm break of 1.3787 will target 1.4248 (2021 high) key structural resistance. This will remain the favored case as long as target 38.2% retracement of 1.0351 to 1.3787 at 1.2474 holds, in case of another fall.
UK payrolls decline deepens even as earnings stay elevated
UK labor market data for November pointed to further cooling in employment conditions. Payrolled employment fell by -38k on the month, a -0.1% mom. Annual drop widened to -171k, or 0.6% yoy. Annual payroll growth has now been negative every month since March.
Wage indicators showed clearer signs of easing at the margin. Median monthly pay growth slowed sharply to 2.7% yoy, down from 3.7% previously and less than half the pace seen in August. At the same time, the claimant count rose by 20.1k.
That said, broader earnings data remains elevated. In the three months to October, unemployment rate edged up from 5.0% to 5.1%. Average earnings growth surprised to the upside, rising 4.7% yoy including bonuses and 4.6% yoy excluding bonuses.
US Payrolls Look a Little Different Today
Markets
Yesterday was your typical waiting game in the run-up to today much anticipated US payrolls report. Rotation forces remained at play on stock markets with the tech-heavy Nasdaq (-0.5%) underperforming against the industrial Dow Jones index (-0.1%), but also European equities (EuroStoxx50 +0.55%). Advanced peace talks in Germany resulted in cautious optimism both from the European (Merz) and the US (Trump) side: “a really far-reaching, substantive agreement that we have not had so far”. After Ukraine dropped its Nato membership demand over the weekend, yesterday saw progress in terms of European security guarantees, backed by the US. There’s still no breakthrough on the most thorniest issue though, territory concession. Moves on fixed income markets were small with a slight outperformance at the front end of the US yield curve. EUR/USD closed at 1.1769 from a start at 1.1735.
US payrolls look a little different today. In addition to the full November report, the Bureau of Labour Statistics will also release October payrolls data. The monthly survey of households, from which for example the unemployment rate is derived, will be released for November thanks to an extension of the collection period after the shutdown (which also cause today’s later-than-normal release) but such statistics couldn’t be retroactively collected for October so will be missing today. Consensus expects a combined job growth number of 50k for Oct-Nov today. Fed Chair Powell last week downplayed the number since he fears big downward revisions to numbers since April (average job losses of -20k instead of +40k; related to BLS’ companies birth-death model; final benchmark revisions come with Jan2026 payrolls report). Markets reacted to those dovish comments and suggest a preference to react on a weaker outcome, lifting odds of a continuation of the Fed’s normalization cycle in Q1 2026. The dollar is vulnerable for more losses (EUR/USD 1.1919 resistance) in case of an outperformance by short-term US Treasuries. For US equity markets, it could give some short term relief if the focus switches from potential data weakness to the prospect of a more accommodative Fed stance. We keep a close eye on the unemployment rate as well. It has been steadily rising from 4.1% in June to 4.4% in September. A new uptick to 4.5% or even 4.6% won’t go unnoticed and implies that the SAHM recession indicator (3-month moving average of unemployment rate more than 0.5 ppt above low-point of the past 12 months) could be triggered soon. Apart from Oct-Nov payrolls, today’s agenda also features October retail sales and global December PMI surveys. The impact of EMU (& UK) numbers will be overshadowed by the US agenda from a market perspective. After today, November US CPI numbers (Thursday) and Q3 GDP data (Dec 23) are the ones to watch from a US perspective.
News & Views
December Indian PMI surveys showed growth easing to a 10-month low even as output level continued to rise sharply. The composite out index slowed to 58.9 from 59.7, with both activity in the services sector (59.1 from 59.8) and the manufacturing output index (58.4 from 59.6) easing. Growth of new orders slowed at the end of the year, but remained noticeable. Growth in new export orders improved. At the same time, companies kept their staffing levels broadly unchanged amid a further easing of business confidence. Inflationary pressures were again muted. Input costs increased modestly, and at a pace that was only slightly faster than the near five-and-a-half-year low posted in November. Output prices also increased modestly, and at the second-slowest pace in the past nine months. The rate of inflation seen in December was weaker than the average across 2025 as a whole. The India rupee this morning continues to set record lows levels with the USD/INR cross rate surpassing the 91 big figure.
National Bank of Poland policy maker Henryk Wnorowski gave a rather mild assessment yesterday on NBP policy going forward. He indicated that it was unlikely that anything will change in monetary policy before March. However, for the rest of 2026 it didn’t rule out anything, but suggested the possibility of further rate cuts, perhaps even several steps. He deemed it very unlikely that the policy rate will decline below 3%. Other NBP members, including governor Glapinski, recently suggested a higher level for the bottom of the NBP easing cycle (3.5% area). The National Bank of Poland since May reduced the policy rate from 5.75% to 4%. The zloty remains well bid with EUR/PLN testing the bottom of the 4.22/4.31 trading range.
All Eyes on US Data
Stocks in Europe and the UK benefited from rotation flows yesterday, while tech-heavy US peers remained under pressure, with the Nasdaq 100 leading losses among the major indices. This morning, futures on both sides of the Atlantic are pointing lower.
In Asia, the Nikkei is down more than 1.2%, slipping below its 50-day moving average. The move comes after a recent spike in Japanese long-term yields — which look more stable today — and a stronger yen ahead of Thursday’s Bank of Japan (BoJ) decision, where the BoJ is expected to announce a rate hike.
What’s interesting is that this hawkish divergence from the BoJ has not translated into a stronger yen against majors since the start of the year. On the contrary, the currency has remained under pressure, weighed down by still significantly lower yields compared to other major economies.
The recent move of the Japanese 10-year yield above the 1.70% mark — often cited as the level at which foreign investments become less attractive for Japanese investors once hedging costs are considered — has created some stress among global risk investors. However, some market participants point out that Fed liquidity conditions remain ample, and may even become more supportive under the Reserve Management Purchases (RMP) programme, which is expected to inject around $40bn per month into the system. For context, that is roughly half the monthly pace of QE following the global financial crisis. In that sense, the Fed’s liquidity stance may help temper concerns linked to rising Japanese yields and the behaviour of large Treasury buyers.
That said, overall market sentiment is not particularly strong at the start of the week. Investors are focused on upcoming US jobs, retail sales and inflation data. Jobs and retail sales are due today and are expected to confirm a softer labour market alongside resilient consumer spending.
There are lingering questions around data quality following recent shutdown-related disruptions to data collection, with some arguing that December figures may offer a clearer picture of labour-market conditions. Still, today’s data should provide an early indication of how markets react.
For jobs and sales, the familiar dynamic applies: “good news is bad news, bad news is good news.” Strong data reduce the case for Federal Reserve (Fed) rate cuts — bearish for stocks and bonds, supportive for the US dollar. Softer data increase the likelihood of cuts, supporting bonds and equities while weighing on the dollar. But data that are too weak would also hurt earnings expectations, making the market reaction a delicate balancing act.
There is an additional nuance. The prevailing narrative matters — and sentiment in tech, which has driven markets since early 2023, has deteriorated. Investors increasingly focus on the risks — heavy investment, rising debt and uncertain paths to monetisation — rather than the growth and productivity upside. As a result, even a data mix supportive of Fed easing may fail to lift tech sentiment and instead reinforce the rotation trade. If so, gains in the tech-heavy S&P 500 and Nasdaq 100 may continue to lag those of the Dow Jones Industrial Average and small- and mid-cap indices.
In FX markets, the US dollar remains broadly under pressure — slightly steadier this morning, partly offset by yen strength — but the broader outlook for the dollar remains negative. That said, one chart stands out: markets are pricing roughly two Fed cuts next year versus one implied by the Fed’s latest dot plot. Given the wide divergence of views within the Fed, the median forecast may not offer reliable guidance. Still, with positioning heavily skewed against the dollar, it raises the question of whether the greenback is due for a short-term rebound.
Dollar weakness continues to support gold, silver and copper, and the outlook for metals remains constructive as confidence in fiat currencies erodes amid rising developed-market debt levels.
Oil prices continue to fall despite a softer US dollar and last week’s tensions around the seizure of a sanctioned Venezuelan vessel. The prevailing view is that sanctions-related events primarily affect sanctioned barrels themselves, with limited spill-over to WTI and Brent unless they materially alter long-term global supply. With non-sanctioned supply currently ample, geopolitical headlines are having little impact on benchmark crude prices.
By contrast, a potential peace agreement involving Russia — which could bring Russian oil back into the non-sanctioned market — would add to global supply and weigh on prices. It is possible that markets are increasingly pricing such a scenario, which could help explain why US crude is testing the lower end of this year’s range despite last week’s Fed cut and a cheaper US dollar. WTI is trading near $56 per barrel this morning. I would expect solid support around $55 and a potential rebound from that area.