Sample Category Title
EUR/USD Daily Outlook
Daily Pivots: (S1) 1.1684; (P) 1.1734; (R1) 1.1760; More...
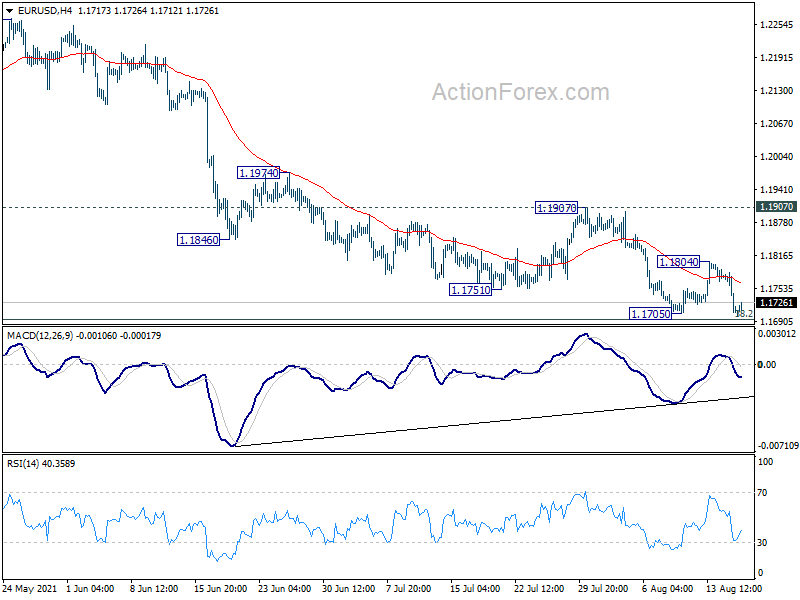
Intraday bias in EUR/USD remains neutral at this point. On the downside, break of 1.1705 will resume larger fall to 1.1602/1703 key support zone again. We'd look for strong support from there to rebound. But sustained break will carry larger bearish implication and target 1.1289 fibonacci support. On the upside, above 1.1804 will target 1.1907 resistance first.
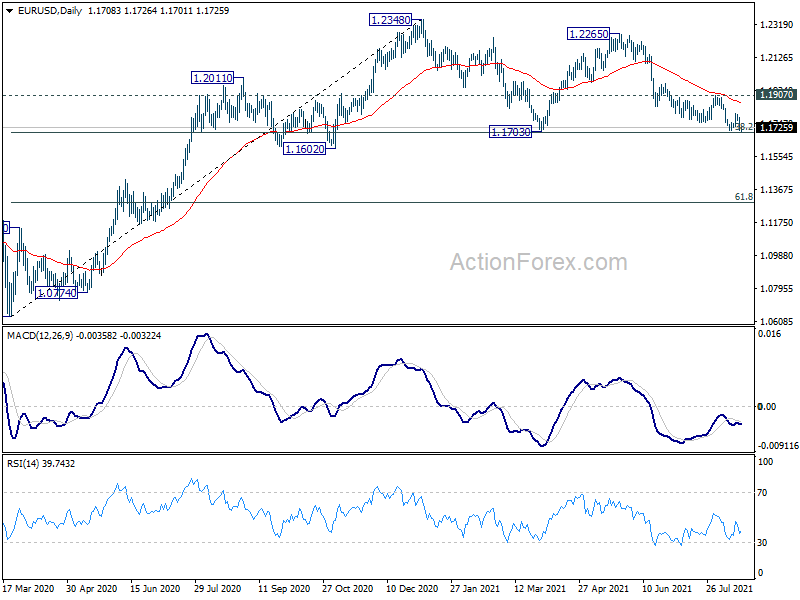
In the bigger picture, rise from 1.0635 is seen as the third leg of the pattern from 1.0339 (2017 low). Further rally remains in favors long as 1.1602 support holds, to cluster resistance at 1.2555 next, (38.2% retracement of 1.6039 to 1.0339 at 1.2516). Reaction from 1.2555 should reveal underlying long term momentum in the pair. However sustained break of 1.1602 will argue that the rise from 1.0635 is over, and turn medium term outlook bearish again. Deeper fall would be seen to 61.8% retracement of 1.0635 to 1.2348 at 1.1289 and below.
USD/JPY Rebounds From Tuesday’s Low
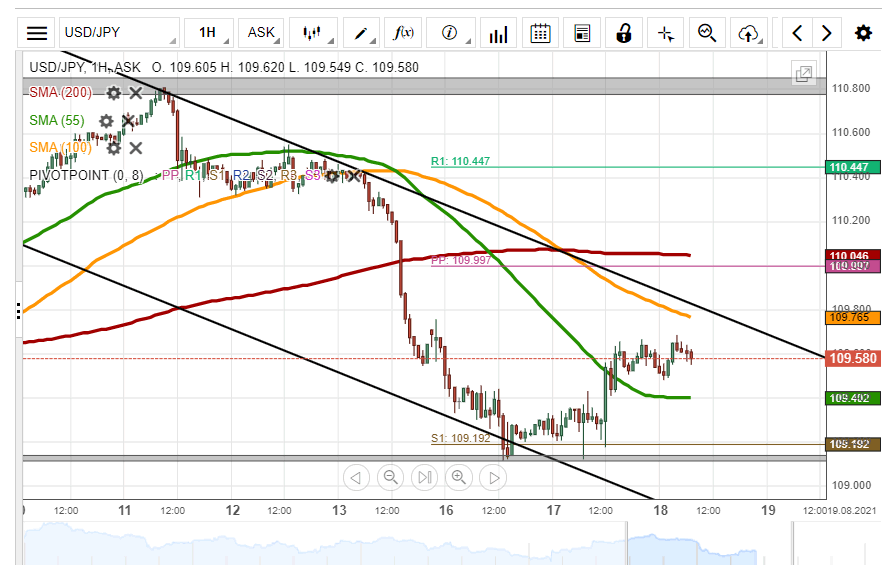
The USD/JPY currency pair bounced off the lower line of a descending channel pattern at 109.18 on Tuesday. As a result, the US Dollar surged by 50 pips or 0.46% against the Japanese Yen during yesterday's trading session.
The exchange rate could continue to edge higher during the following trading session. The possible target for bullish traders will be near a resistance cluster at 110.05.
However, the 100– hour simple moving average at 109.80 could provide resistance for the currency exchange rate in this session.
XAU/USD Two Scenarios Likely
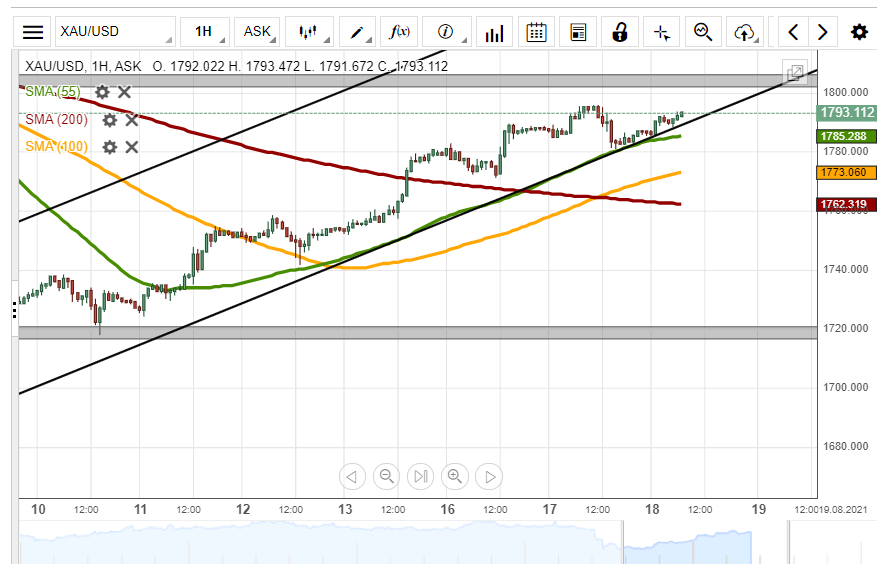
The yellow metal's price decreased by 134 pips or 0.75% on Tuesday. The decline was stopped by the 55– hour simple moving average at 1784.1 during Tuesday's trading session.
Currently, the commodity is trading near the lower boundary of an ascending channel pattern and could be set for a breakout.
If the breakout occurs, a decline towards the 1765.00 area could be expected within this session.
However, if the channel pattern holds, buyers might pressure the XAU/USD exchange rate higher today.
GBP/USD Daily Outlook
Daily Pivots: (S1) 1.3695; (P) 1.3770; (R1) 1.3815; More...
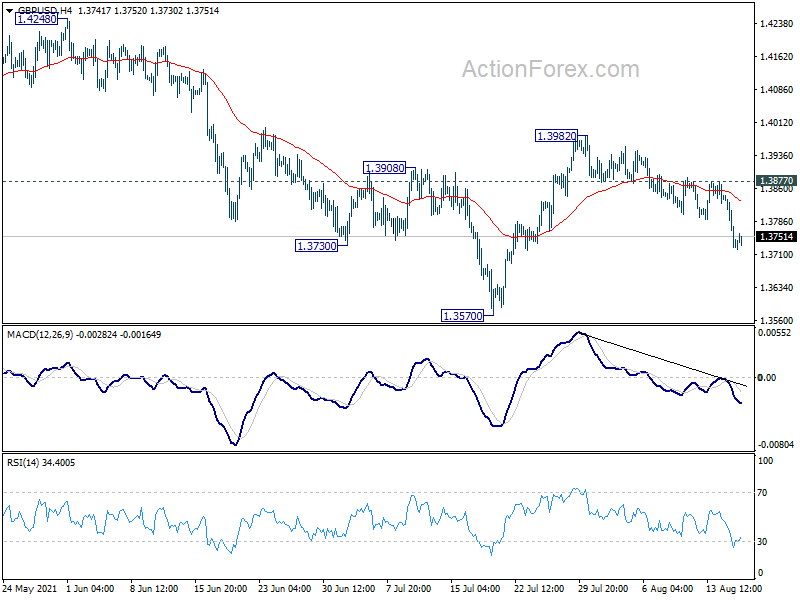
Intraday bias in GBP/USD remains mildly on the downside for the momentum. Rebound from 1.3570 should have completed at 1.3982, after the rejection by 55 day EMA. Deeper fall would be seen to retest 1.3570 first. Break will 1.3482 resistance turned support. On the upside, above 1.3877 minor resistance will turn bias back to the upside for 1.3982.
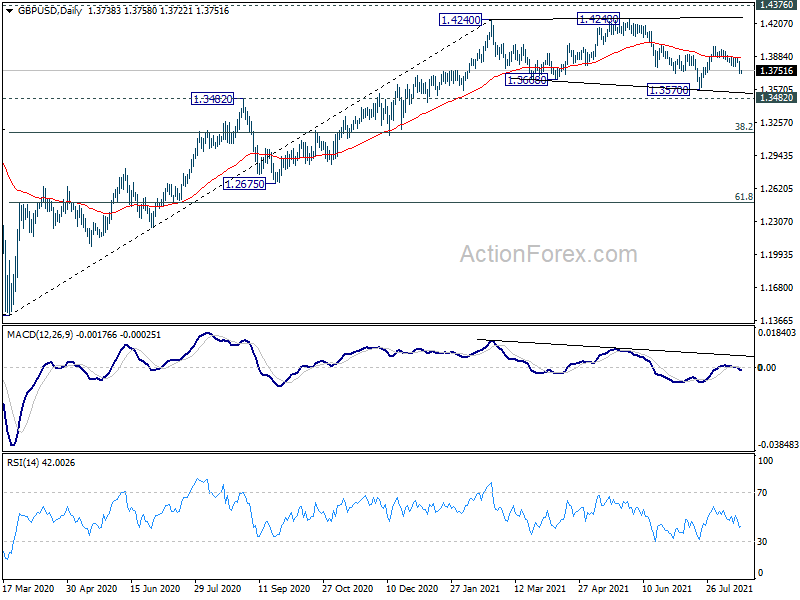
In the bigger picture, as long as 1.3482 resistance turned support holds, up trend from 1.1409 should still continue. Decisive break of 1.4376 resistance will carry larger bullish implications. However, firm break of 1.3482 support will argue that the rise from 1.1409 has completed. GBP/USD would then be seen as in another leg of long term range pattern between 1.1409 and 1.4376. Deeper fall could then be seen to 61.8% retracement of 1.1409 to 1.4248 at 1.2493, and even below.
USD/CHF Daily Outlook
Daily Pivots: (S1) 0.9115; (P) 0.9134; (R1) 0.9167; More....
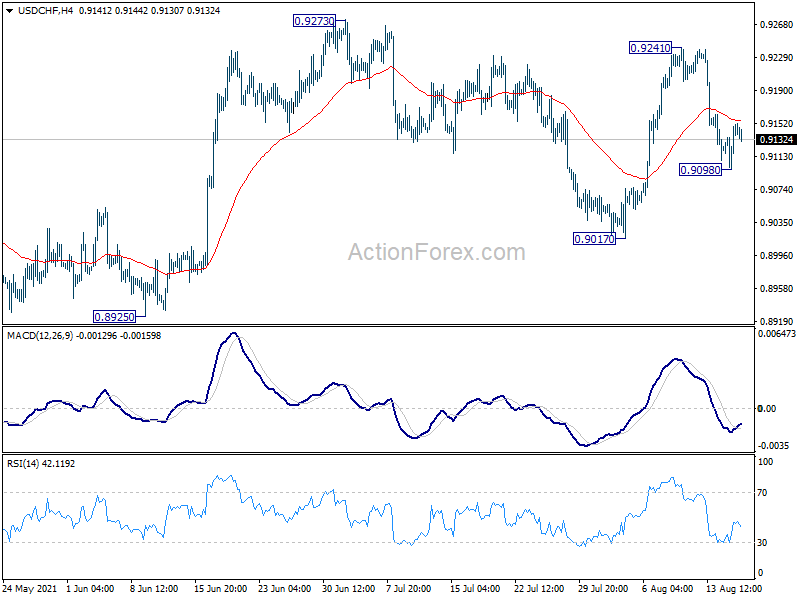
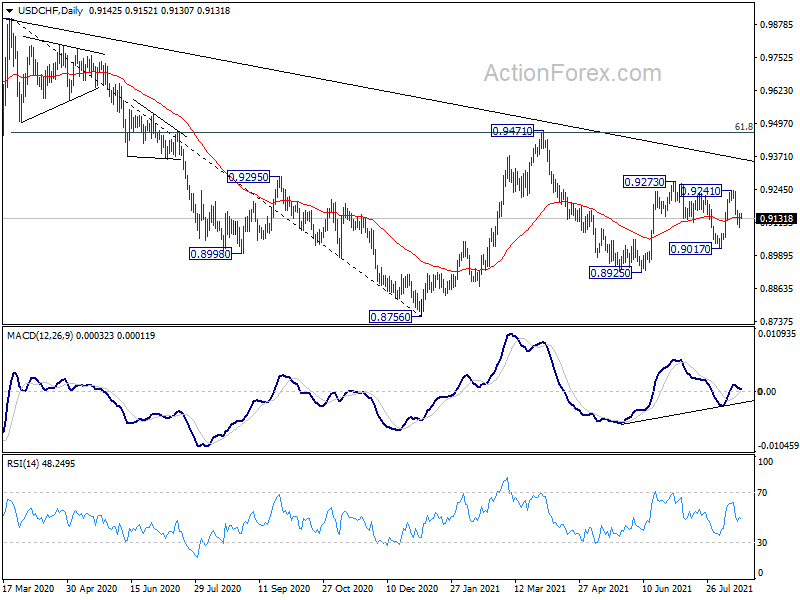
Intraday bias in USD/CHF is turned neutral with current recovered, and near term is mixed. On the downside, below 0.9098 will target 0.9017 support first. Further break there will likely resume the decline from 0.9471 through 0.8925 low. On the upside, through, break of 0.9241 should resume the rise from 0.8925 through 0.9273 resistance.
In the bigger picture, the failure to sustain above 55 week EMA (now at 0.9184) retains medium term bearish in USD/CHF. Break of 0.8925 support should resume the whole decline form 1.0342 (2016 high) through 0.8756 low. However, break of 0.9273 resistance and sustained trading above 55 week EMA will be an early sign of bullish trend reversal. Focus will then turn to 0.9471 resistance for confirmation.
Daily Tecnical Analysis
EUR/USD
Current level - 1.1707
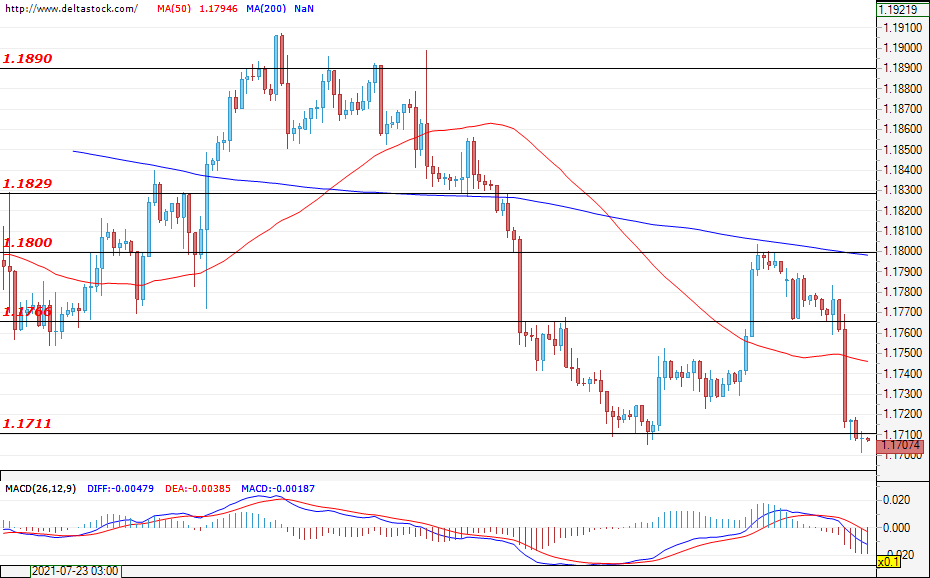
The bears prevailed and the euro lost quite a bit of ground against the dollar. During the early hours of today`s trading, the currency pair tested the support level at 1.1711 and the price consolidated around the mentioned level. If the bearish attack continues, a successful breach would lead to new losses for the EUR/USD and could easily help lead the pair towards the lows from November 2020 at 1.1610. The first target for the bulls can be found at the level of 1.1766, but only breach of the next resistance zone of 1.1800 could lead to a change in the current expectations of the market participants.
| Resistance | Support | ||
| intraday | intraweek | intraday | intraweek |
| 1.1766 | 1.1830 | 1.1711 | 1.1650 |
| 1.1800 | 1.1900 | 1.1650 | 1.1600 |
USD/JPY
Current level - 109.48
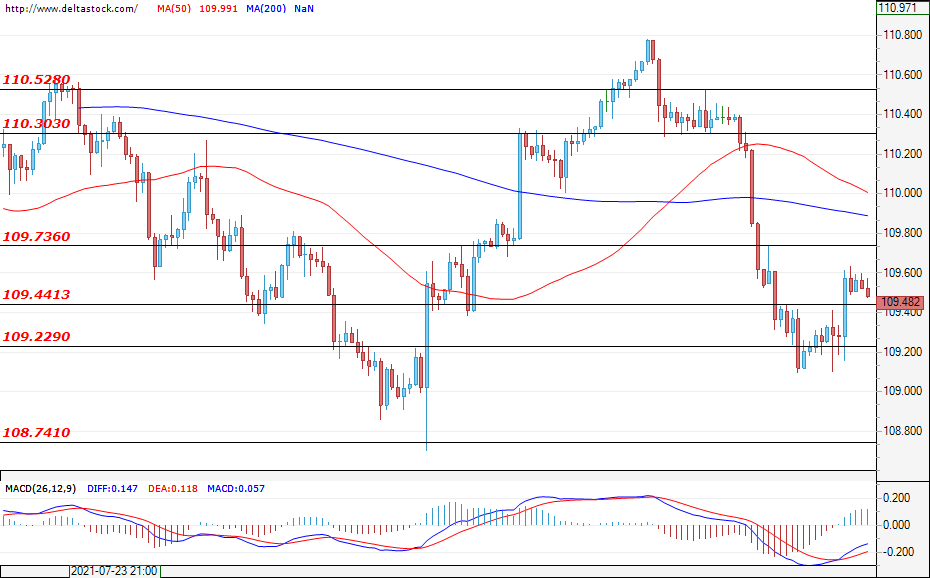
The sell-off was limited to the support level at 109.22 and the dollar regained some of its lost positions against the yen. At the time of writing the analysis, the pair holds above the violated close resistance at 109.44, but only a breach towards the next target at 109.73 could lead to a continuation of the recovery and a rally towards the upper level at 110.30. If the bears re-enter, a new successful attack of the zone at 109.22 would put an end to the positive correction for the USD/JPY and would easily pave the way towards a test of the lower support at 108.74.
| Resistance | Support | ||
| intraday | intraweek | intraday | intraweek |
| 109.73 | 110.30 | 109.44 | 108.74 |
| 110.30 | 110.52 | 109.22 | 107.46 |
GBP/USD
Current level - 1.3746
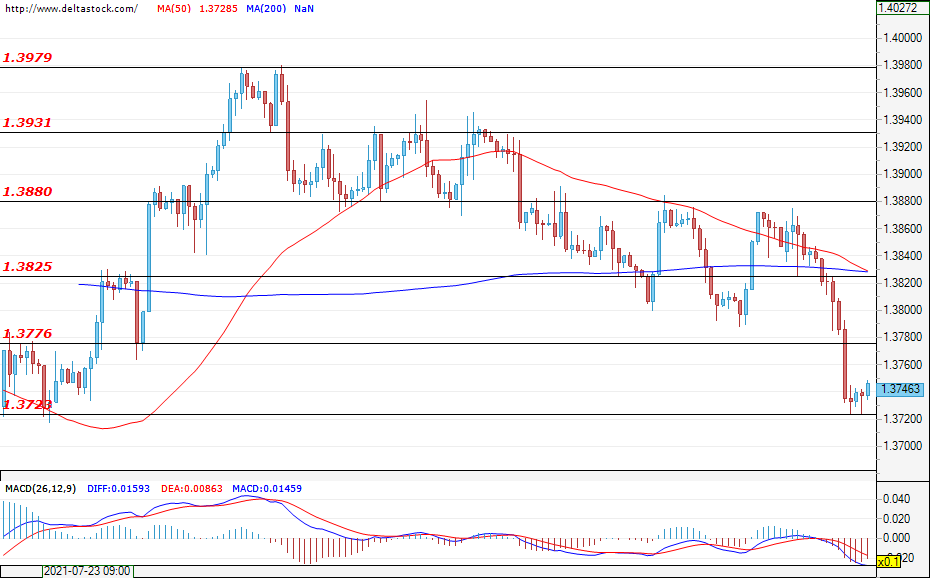
The support zone of 1.3776 could not hold the bearish attack and the pound lost ground against the dollar. The decline was limited to the support zone of 1.3730 and, at the time of writing this analysis, the price is hovering around the current level of 1.3746. Negative sentiment remains intact and a new test for the bears could be the most probable scenario. A successful breach here would lead to future losses for the GBP/USD and head the price towards the levels of around 1.3700. The first resistance for the buyers can be found at the zone of 1.3776, followed by the upper target of 1.3825.
| Resistance | Support | ||
| intraday | intraweek | intraday | intraweek |
| 1.3776 | 1.3880 | 1.3723 | 1.3632 |
| 1.3825 | 1.3931 | 1.3632 | 1.3570 |
USD/JPY Daily Outlook
Daily Pivots: (S1) 109.25; (P) 109.46; (R1) 109.79; More...
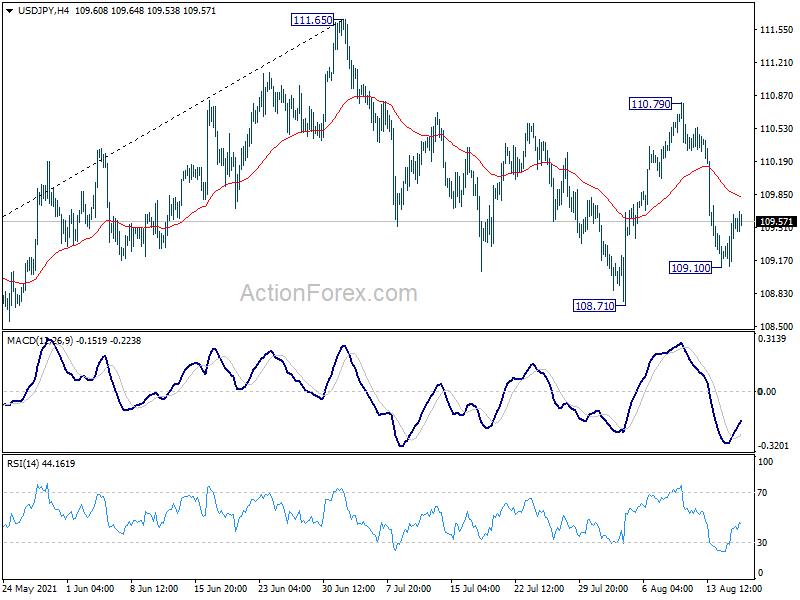
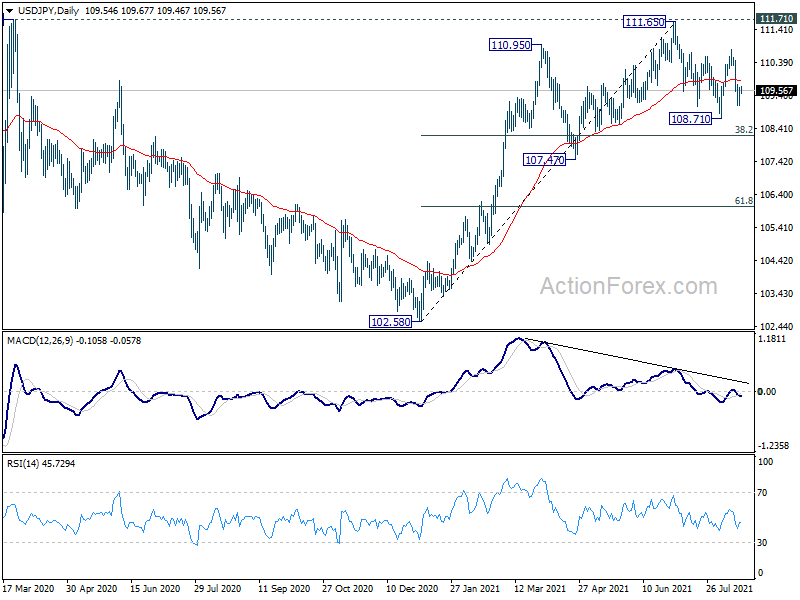
Intraday bias in USD/JPY remains neutral first but risk stays on the downside with 110.79 resistance intact. On the downside, below 109.10 will target 108.71 support first. Firm break there will resume the decline from 111.65 and target 38.2% retracement of 102.58 to 111.65 at 108.18 next.
In the bigger picture, medium term outlook is staying neutral with 111.71 resistance intact. The pattern from 101.18 could still extend with another falling leg. Sustained trading below 55 day EMA will bring deeper fall to 107.47 support and below. Nevertheless, strong break of 111.71 resistance will confirm completion of the corrective decline from 118.65 (2016 high). Further rise should then be seen to 114.54 and then 118.65 resistance.
XAUUSD Is Possibly Bullish
Technical analysis
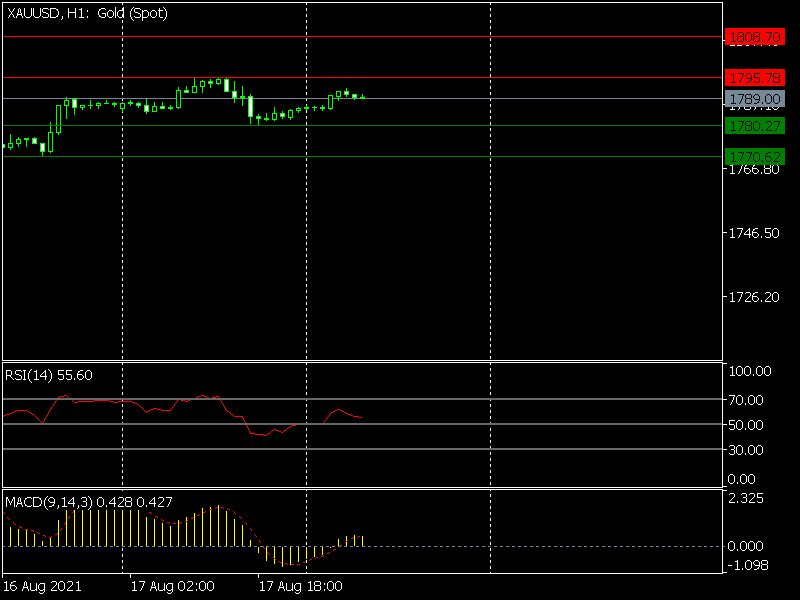
The MACD indicator line is above 0, pointing up
The RSI is above 50.
What the possible outcomes are
XAUUSD trades in a narrow range. The pair rebounded from yesterday's decline and may extend its uprise before today's FOMC Minutes release.
If the price passes the initial resistance level of 1,795.78, it could test the next higher at 1,808.70.
Alternatively, if the price reverses, then it could reach the first support level of 1,780.27.
A pass below the first level can move the price up lower toward 1,770.62.
Key levels
Support 1,780.27 1,770.62
Resistance 1,795.78 1,808.70
AUD/USD Daily Report
Daily Pivots: (S1) 0.7312; (P) 0.7343; (R1) 0.7365; More...
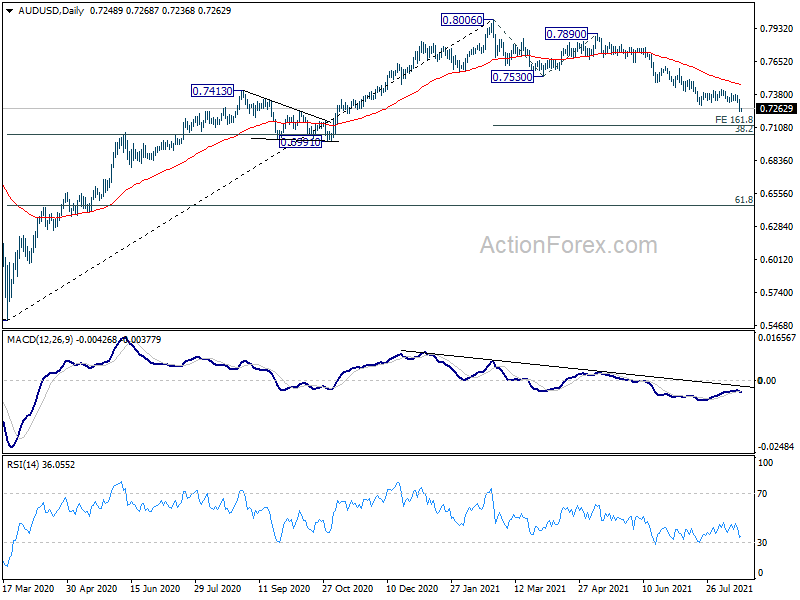
Intraday bias in AUD/USD remains on the downside at this point. Fall from 0.8006 is in progress for 161.8% projection of 0.8006 to 0.7530 from 0.7890 at 0.7120. On the upside, above 0.7315 minor support will turn intraday bias neutral first. But outlook will stay bearish as long as 0.7425 resistance holds, in case of recovery.
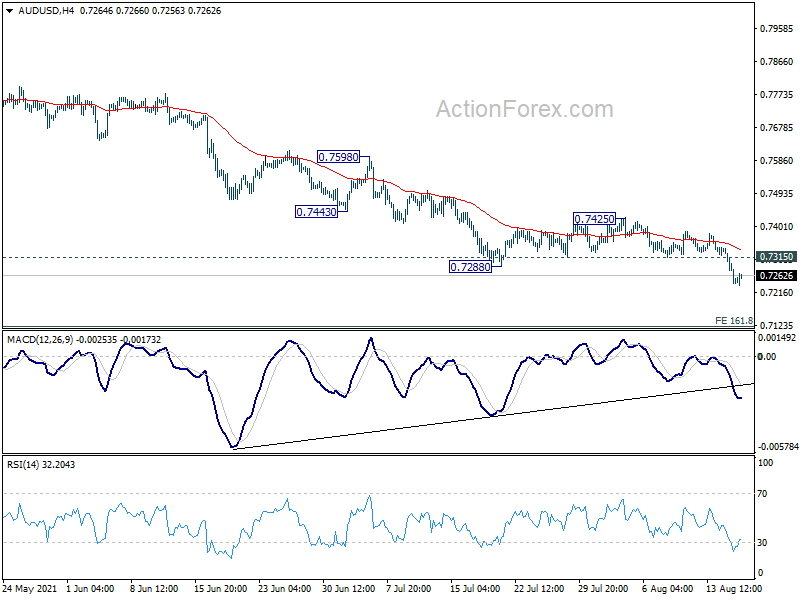
In the bigger picture, rise from 0.5506 medium term bottom could have completed at 0.8006, after failing 0.8135 key resistance. Correction from there could target 0.6991 cluster support (38.2% retracement of 0.5506 to 0.8006 at 0.7051). We'd look for strong support from there to bring rebound. However, sustained break of this level would argue that the whole medium term trend has indeed reversed.
USD/CAD Daily Outlook
Daily Pivots: (S1) 1.2579; (P) 1.2614; (R1) 1.2660; More...
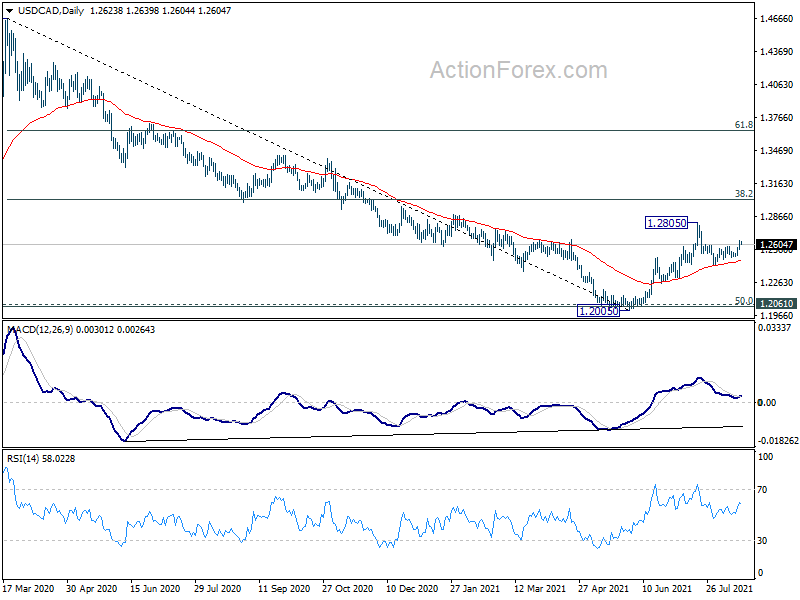
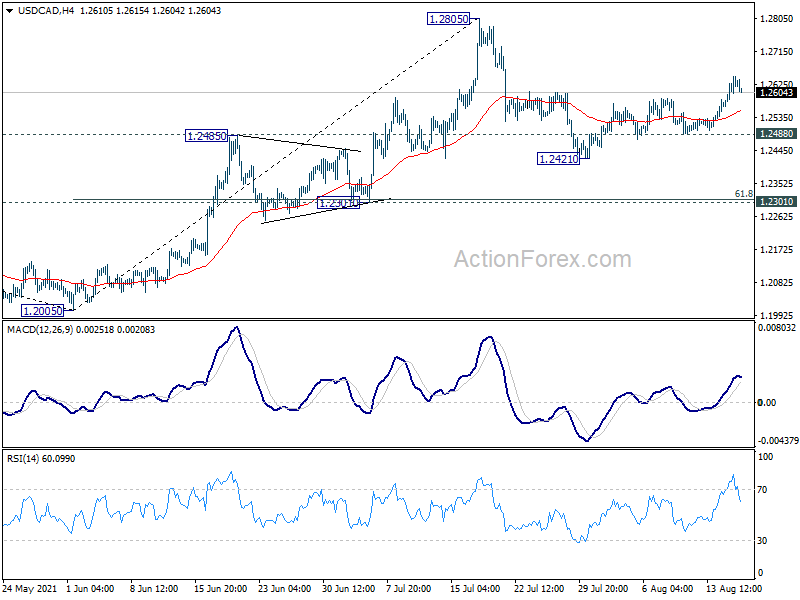
Intraday bias in USD/CAD remains on the upside for the moment. Rebound from 1.2421 should target a test on 1.2805 resistance first. Break there will resume whole rise from 1.2005 for 1.3022 fibonacci level next. On the downside, break of 1.2488 minor support will turn bias back to the downside for 1.2421 support and below.
In the bigger picture, fall from 1.4667 is seen as the third leg of the corrective pattern from 1.4689 (2016 high). It should have completed after hitting 1.2061 (2017 low) and 50% retracement of 0.9406 to 1.4689 at 1.2048. Sustained break of 38.2% retracement of 1.4667 to 1.2005 at 1.3022 will pave the way to 61.8% retracement at 1.3650 and above. Overall, medium term outlook remains neutral at worst with 1.2048/61 support zone intact.