Sample Category Title
USD/JPY Tests Critical Support
The US dollar drifts lower as traders await the Fed minutes.
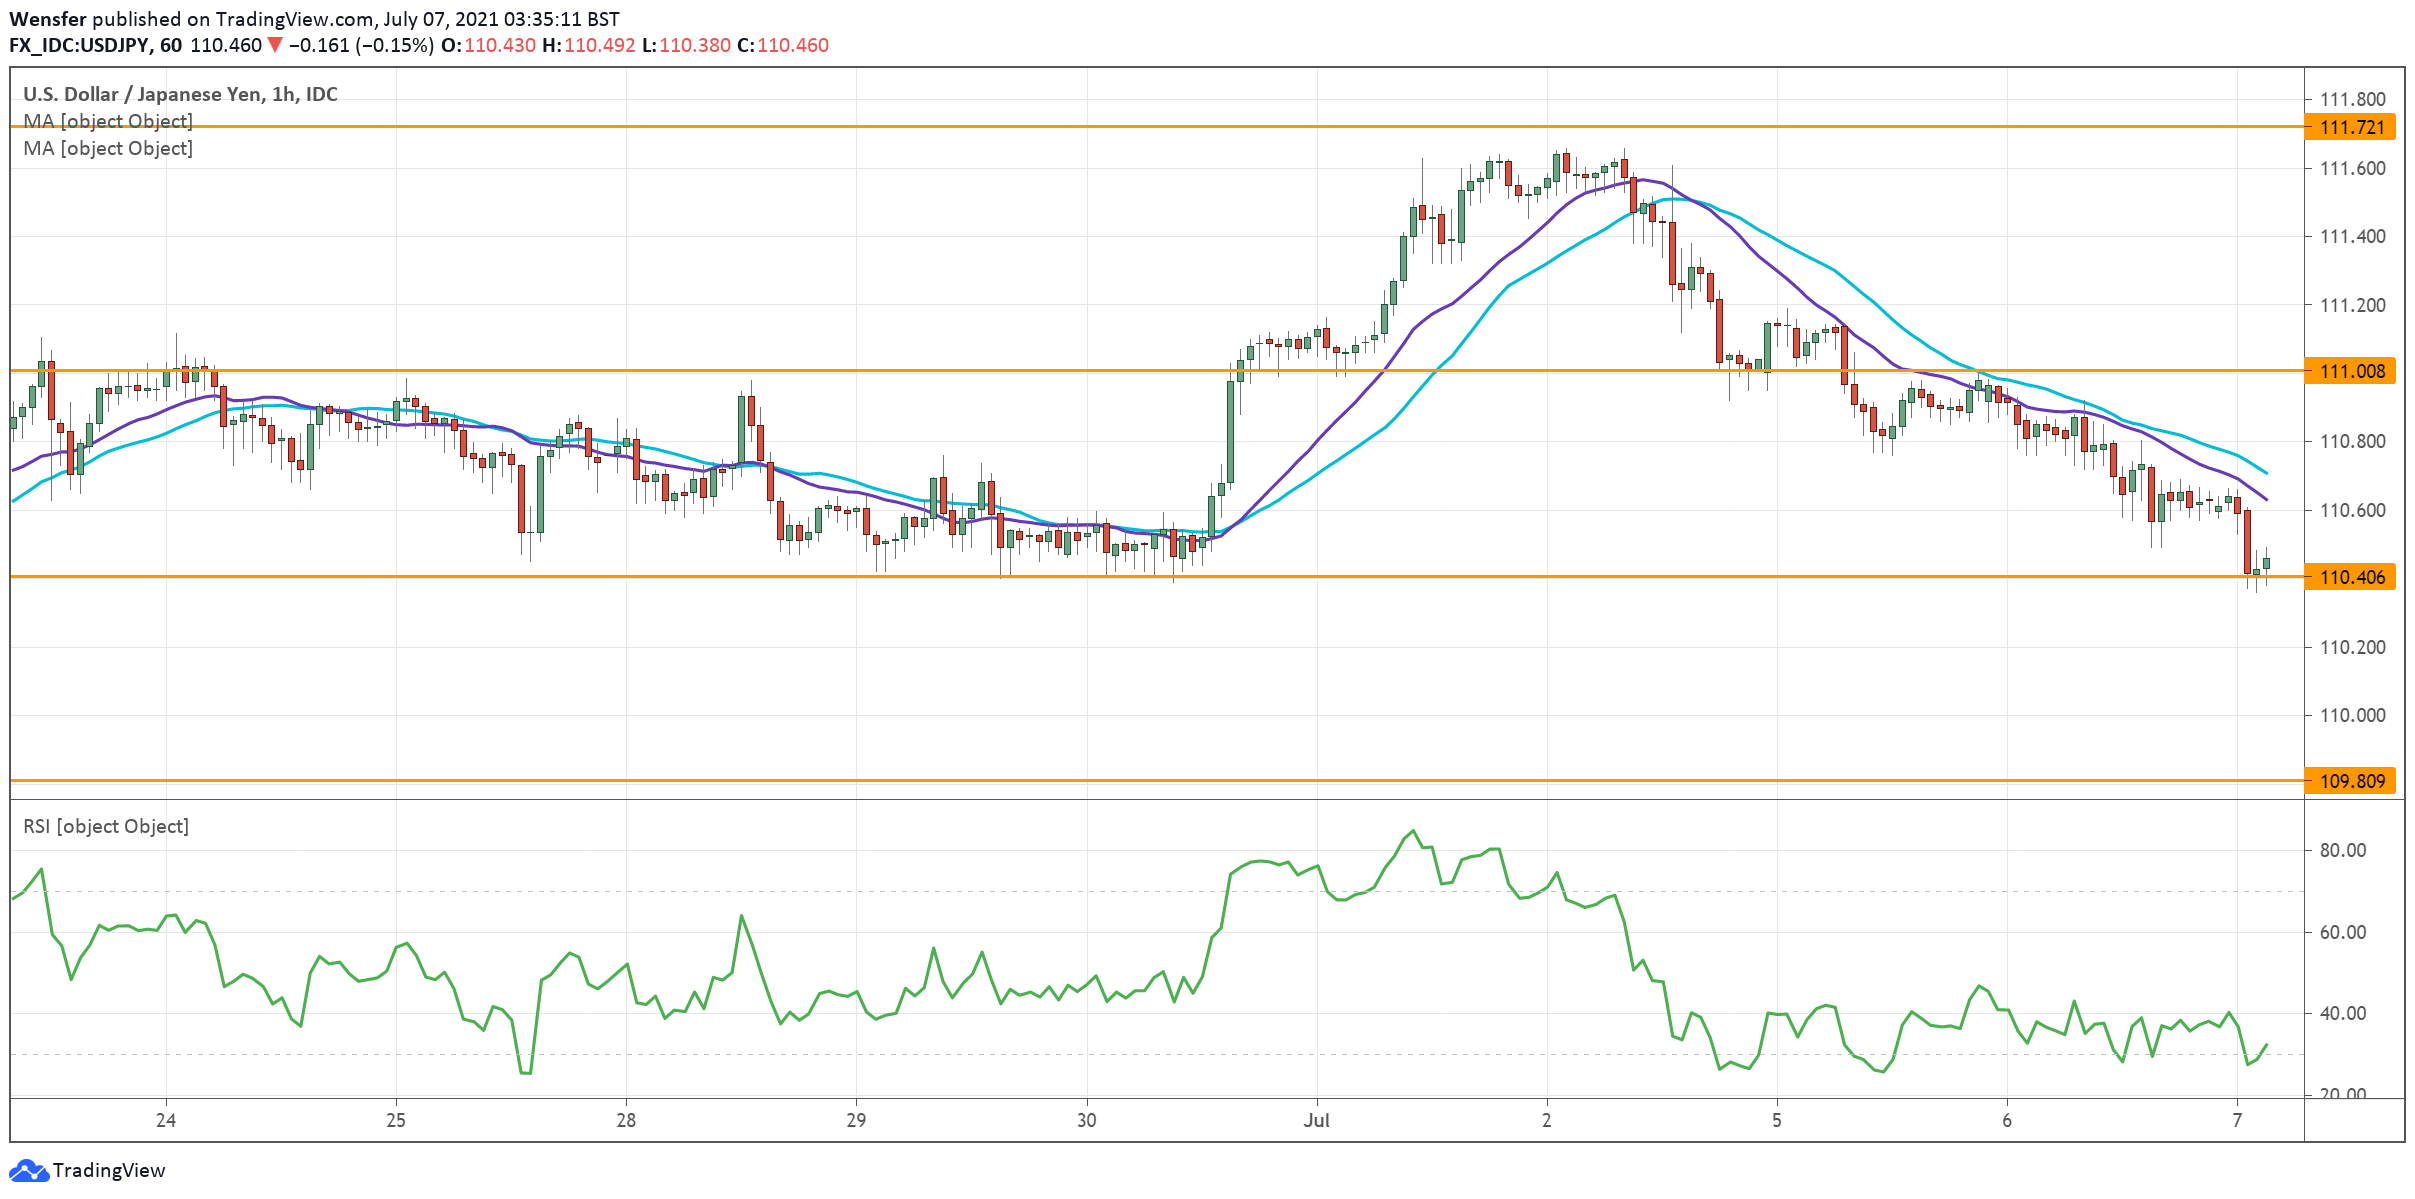
The greenback has met stiff selling pressure at March 2020’s high, at 111.70. A combination of profit-taking and fresh selling has pushed the pair down to the base of the latest rally (110.40).
Price is now at a crossroad as a bearish breakout may trigger a correction towards 109.80.
However, a near-oversold RSI may attract buyers in the demand zone. A rebound will need to clear the psychological level of 111.00 first before it could retest the previous high.
AUD/USD Retreats From Major Resistance
The Australian dollar surged after the RBA announced it would trim its QE by $1 billion.
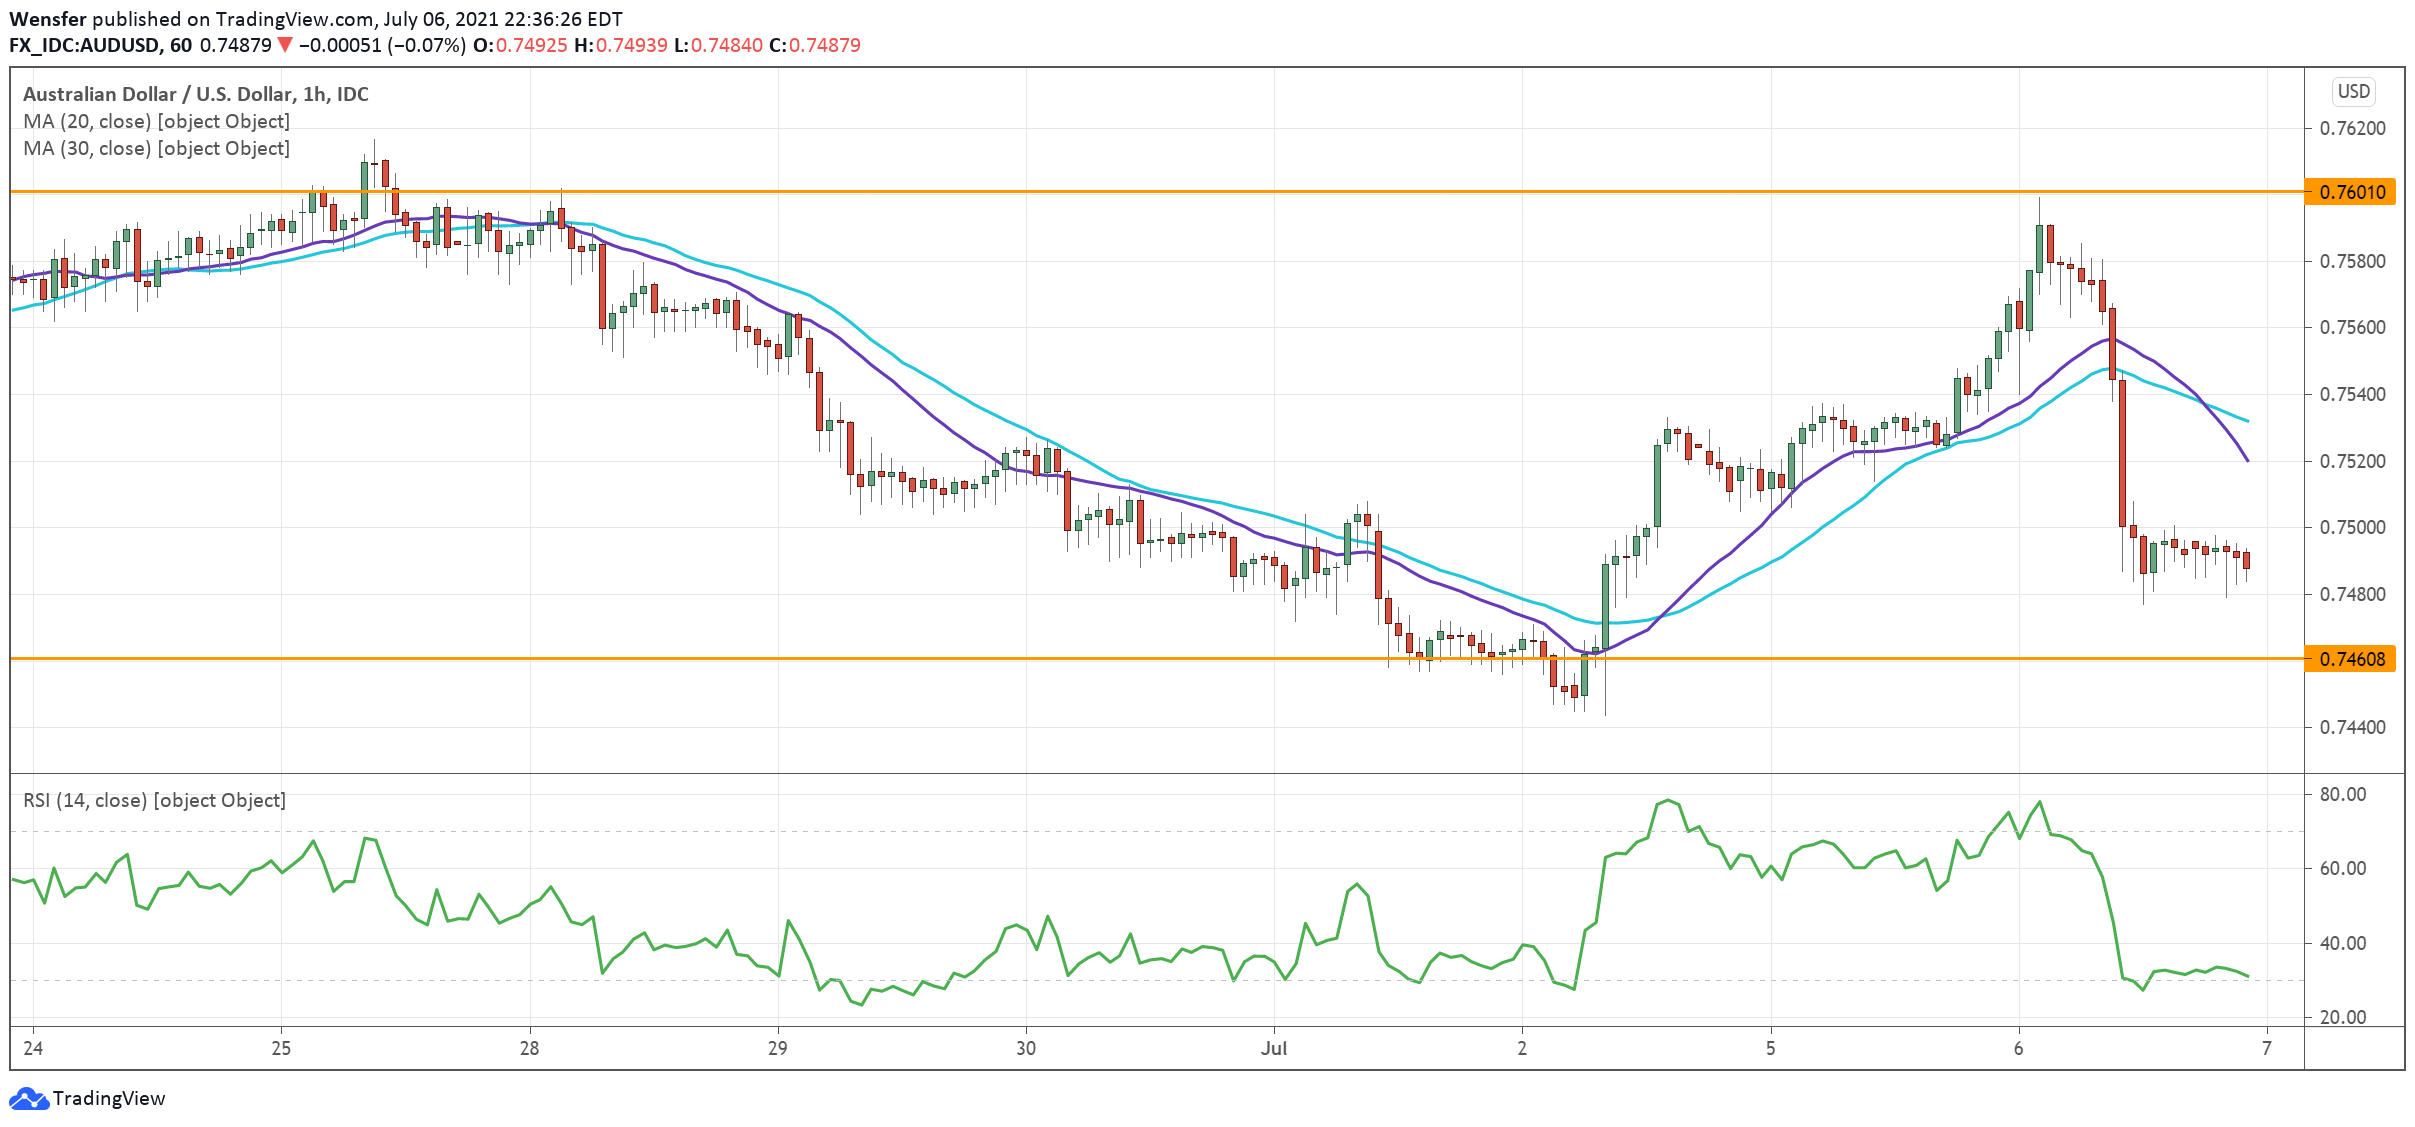
The initial rally above 0.7525 has put the bears under pressure. A bullish MA cross suggests strong buying interest in reversing the correction.
Price action has retracted from the major supply area around 0.7600. The RSI’s double-dip into the overbought zone may have hindered its advance.
A bullish breakout would trigger an extended rally to 0.7700. 0.7460 is a critical floor as the Aussie seeks to support.
GBP/JPY Daily Outlook
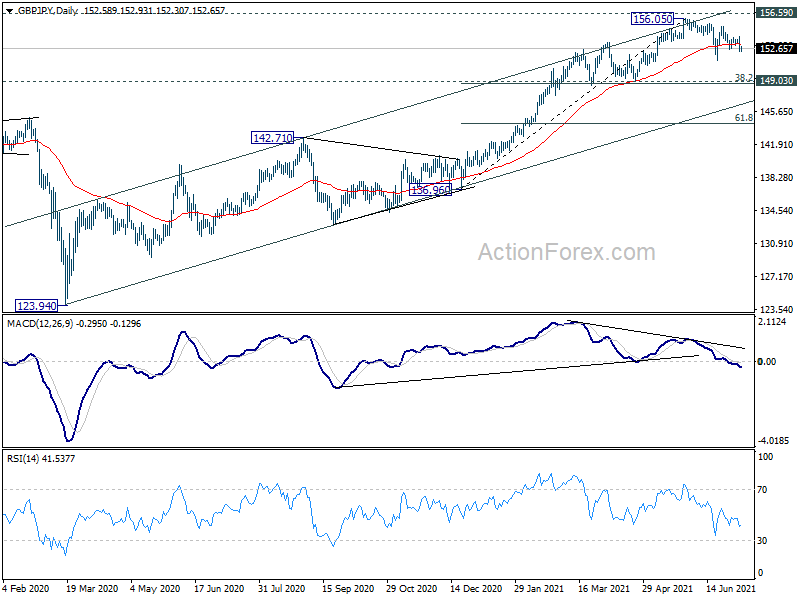
Daily Pivots: (S1) 151.99; (P) 153.03; (R1) 153.70; More...
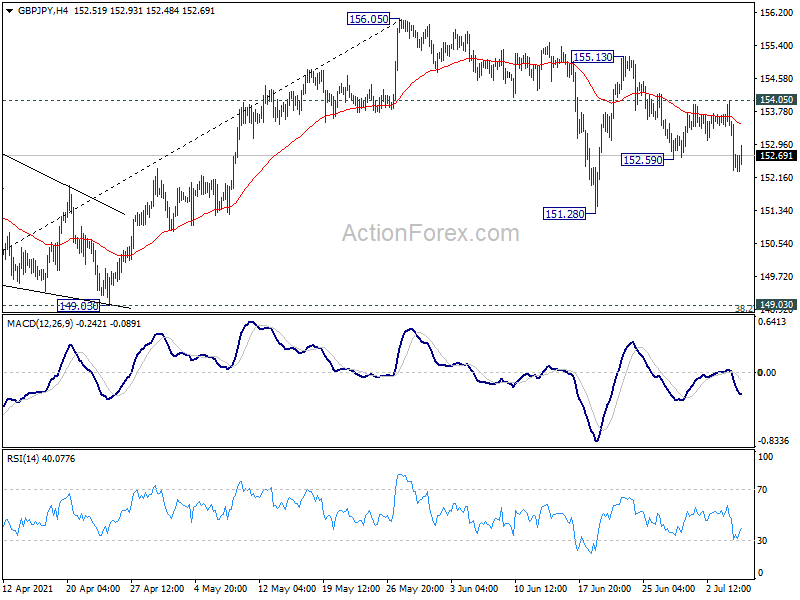
With 152.59 support broken, intraday bias in GBP/JPY is turned to the downside for 151.28 support. Break will resume the corrective fall from 156.05 towards 149.03 support. We'd expect strong support from 38.2% retracement of 136.96 to 156.05 at 148.75 to bring rebound. On the upside, above 154.05 minor resistance will turn bias back to the upside for 156.05 high instead.
In the bigger picture, rise from 123.94 is seen as the third leg of the pattern from 122.75 (2016 low). Focus is now on 156.59 resistance (2018 high). Sustained break there should confirm long term bullish trend reversal. Next target is 61.8% retracement of 195.86 (2015 high) to 122.75 at 167.93. On the downside, break of 149.03 support is needed to be the first sign of completion of the rise from 123.94. Otherwise, outlook will remain bullish even in case of deep pull back.
EUR/JPY Daily Outlook
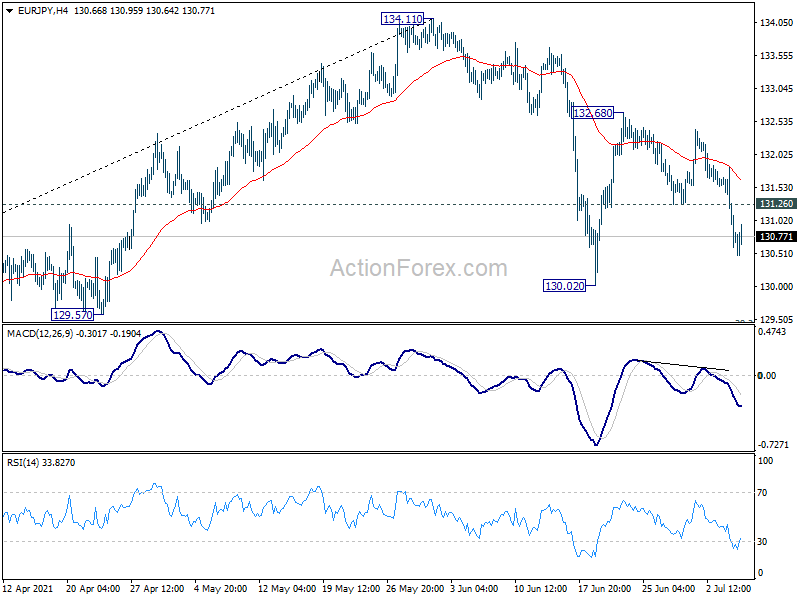
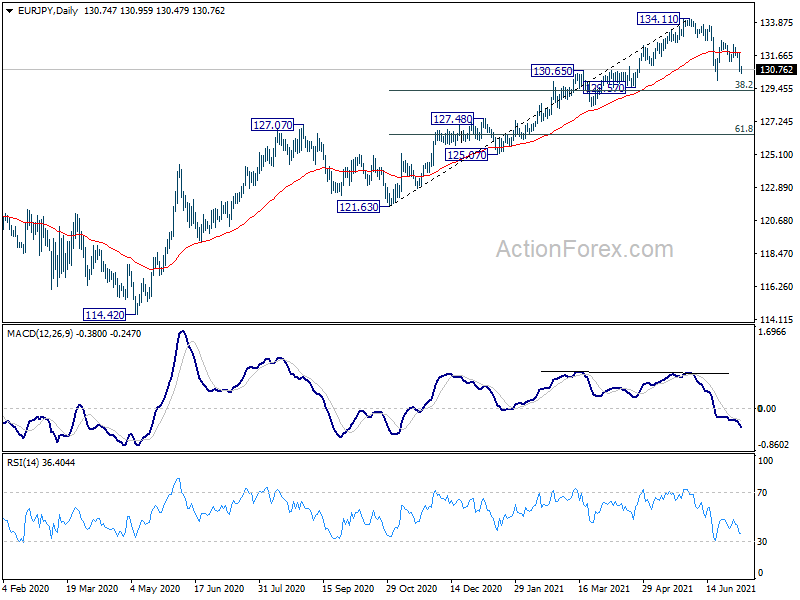
Daily Pivots: (S1) 130.31; (P) 131.09; (R1) 131.55; More....
Intraday bias in EUR/JPY remains on the downside for 130.02 support. Break there will resume the whole correction from 121.63 towards 38.2% retracement of 121.63 to 134.11 at 129.34. Strong support should be seen there to bring rebound. On the upside, above 131.26 support turned resistance will turn intraday bias neutral first.
In the bigger picture, rise from 114.42 is seen as a medium term rising leg inside a long term sideway pattern. Next target is 137.49 (2018 high). Decisive break there will open up the possibility that it's indeed resuming the up trend from 94.11 (2012 low). For now, outlook will stay bullish as long as 127.07 resistance turned support holds, in case of pull back.
EUR/GBP Daily Outlook
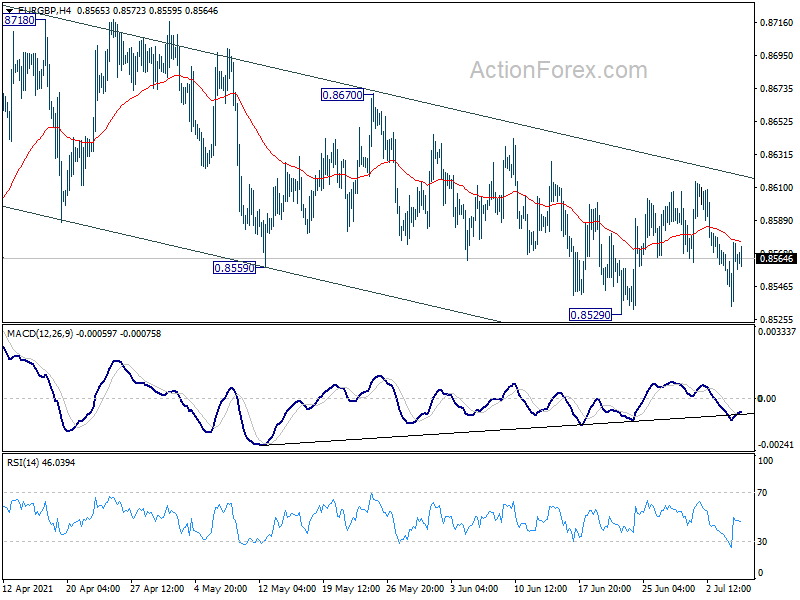
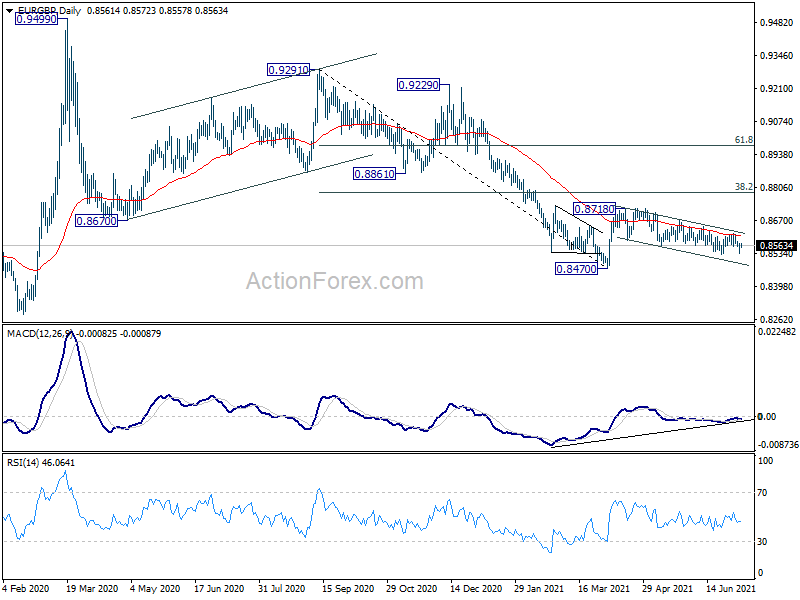
Daily Pivots: (S1) 0.8543; (P) 0.8560; (R1) 0.8584; More...
Intraday bias in EUR/GBP remains neutral at this point. On the downside, break of of 0.8529 will resume the choppy decline towards retesting 0.8470 low. On the upside, decisive break of 0.8670 will confirm that corrective fall from 0.8718 has completed. Further rise would be seen to resume the rebound from 0.8470.
In the bigger picture, price actions from 0.9499 are still seen as developing into a corrective pattern. That is, up trend from 0.6935 (2015 low) would resume at a later stage. This will remain the favored case as long as 0.8276 support holds. However, firm break of 0.8276 support will suggest that rise from 0.6935 has completed and turn medium term outlook bearish.
EUR/AUD Daily Outlook
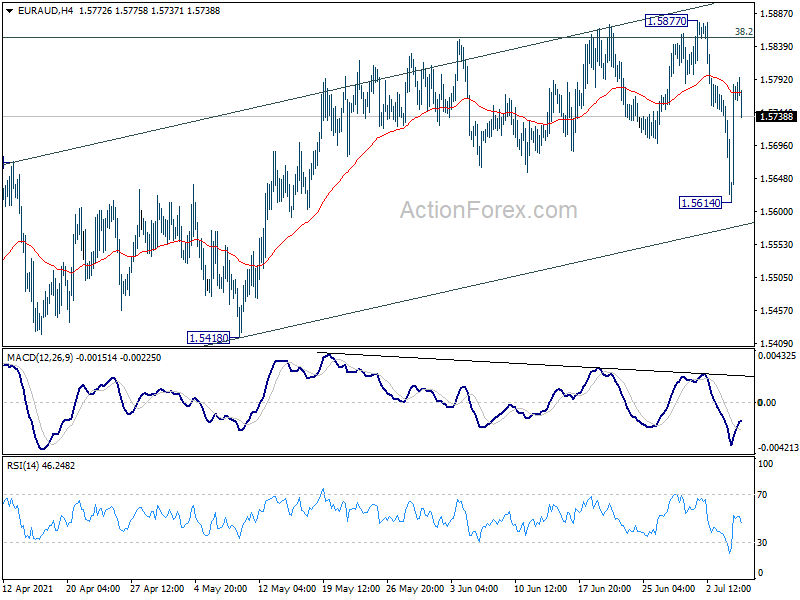
Daily Pivots: (S1) 1.5667; (P) 1.5727; (R1) 1.5838; More...
EUR/AUD rebounded strongly after hitting 1.5614 and intraday bias is turned neutral first. On the downside, break of 1.5614 will revive the case of rejection by 38.2% retracement of 1.6827 to 1.5250 at 1.5852. Deeper fall would be seen back to 1.5418 support first. Break there should confirm completion of consolidation pattern from 1.5250, and bring retest of this low.
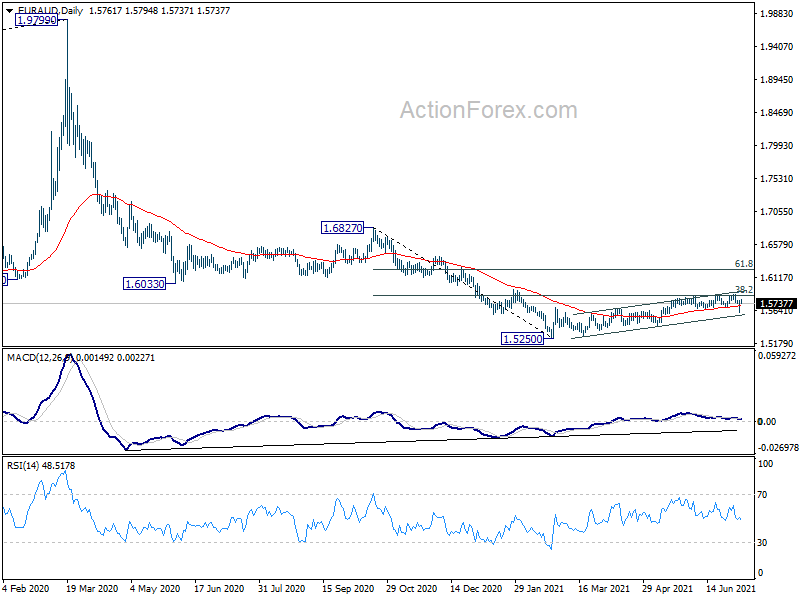
In the bigger picture, price actions from 1.9799 are developing into a deep correction, to long term up trend from 1.1602 (2012 low). Deeper fall would be seen to 61.8% retracement of 1.1602 to 1.9799 at 1.4733. Medium term outlook will remain bearish as long as 1.6033 support turned resistance holds, even in case of strong rebound. However, firm break of 1.6033 will argue that such decline has completed, and turn focus to 1.6827 structural resistance for confirmation.
USDJPY In Clear Bullish Uptrend But Caution Required
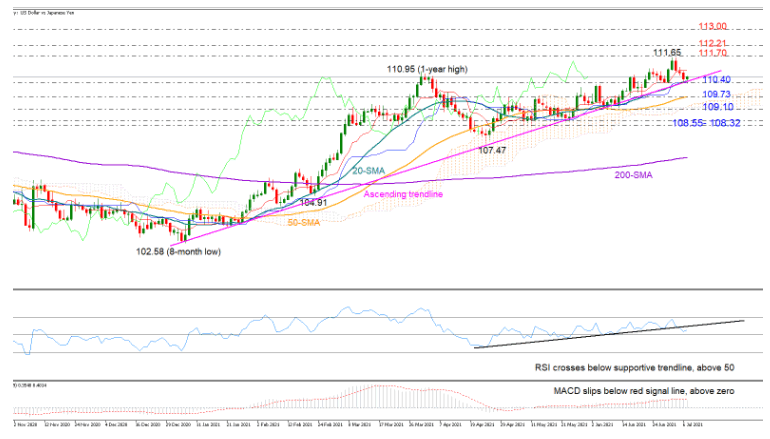
USDJPY has further nourished its well-established zig zag course along the key ascending trendline, with the price finally surpassing the tough 110.95 peak to unlock an almost 1½-year high of 111.65 before sliding lower again.
Another upside reversal could develop in the near term as the blue Kijun-sen line and the 20-day simple moving average (SMA) are currently cementing the floor around the trendline and the 110.40 level. Still, with the MACD decelerating below its red signal line and the RSI having snapped its previous upward pattern, some caution is warranted.
A close below the trendline is expected to trigger the next bearish round, bringing the 50-day SMA at 109.73 first into view. The bottom of the Ichomoku cloud could follow on the downside at 109.10 but should it fail to act, the sell-off could get extra legs towards the protective 108.55 – 108.32 area.
If the trendline holds robust once again, sending the price above the 110.95 peak, the bulls may attempt to overcome the 2020 limitations within the 111.70 – 112.21 region. A step above the latter could open the door for the 113.00 number for the first time since 2018.
In brief, USDJPY is still in a clear bullish trend, keeping sentiment positive, though given the deterioration in technical oscillators, downside pressures could become more challenging in the short term.
EUR/USD Decline Likely To Continue
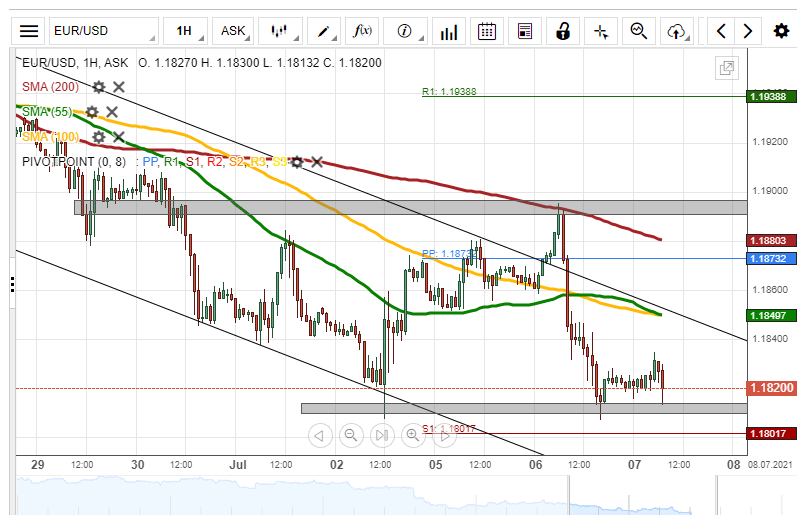
On Tuesday, the common European currency fell by 82 pips or 0.69% against the US Dollar. The currency pair was pressured lower by the 200– hour simple moving average during yesterday's trading session.
All things being equal, the exchange rate could continue to edge lower in a descending channel pattern during the following trading session. The potential target sellers will be near the 1.1780 area.
However, the weekly support level at 1.1801 could provide support for the EUR/USD currency exchange rate in the shorter term.
EUR/CHF Daily Outlook
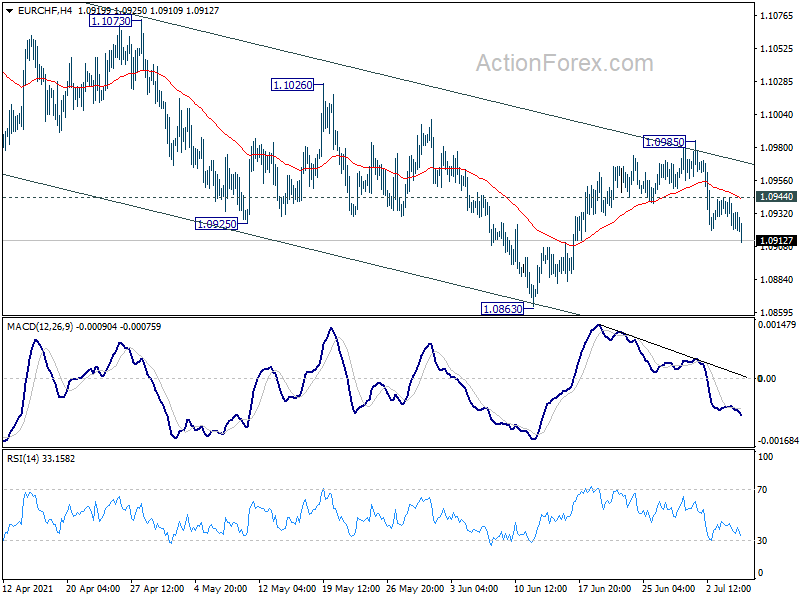
Daily Pivots: (S1) 1.0920; (P) 1.0933; (R1) 1.0944; More....
Intraday bias in EUR/CHF remains on the downside at this point, and outlook is unchanged. Rebound from 1.0863 could have completed at 1.0985, after rejection by medium term channel resistance. Deeper fall would be seen to 1.0863 support first. Break there will resume whole decline from 1.1149 to 1.0737 cluster support zone. On the upside, above 1.0944 minor resistance will turn bias back to the upside for 1.0985 resistance instead.
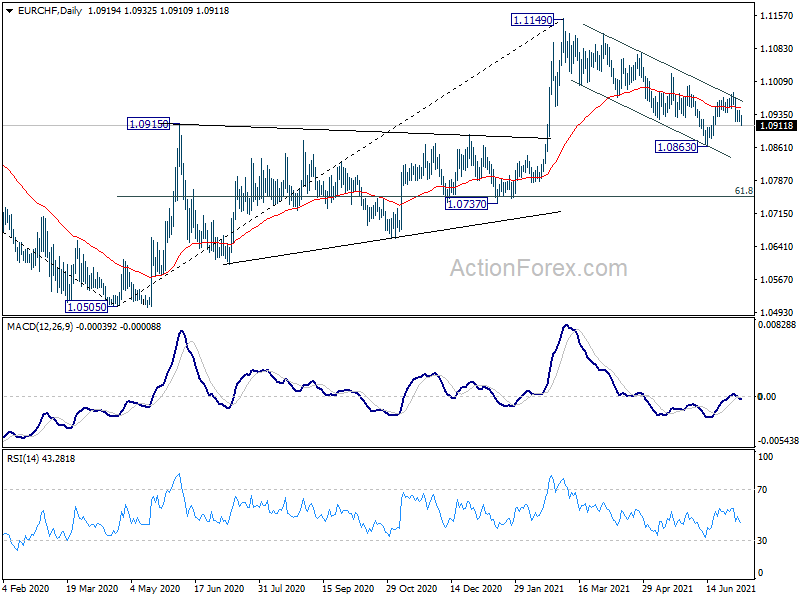
In the bigger picture, current development argues that rebound from 1.0505 (2020 low) might be completed at 1.1149 already. Rejection by 55 month EMA (now at 1.1074) at least keeps medium term bearishness open. Sustained break of 1.0737 cluster support (61.8% retracement of 1.0505 to 1.1149 at 1.0751) will argue that the down trend from 2004 (2018 high) is ready to resume through 1.0505 low. Sustained trading below 55 week EMA (now at 1.0885) will affirm this bearish case. Nevertheless, strong support from 55 week EMA will revive the case for resuming the rise from 1.0505 at a later stage.
GBP/USD Could Find Support At 1.3733
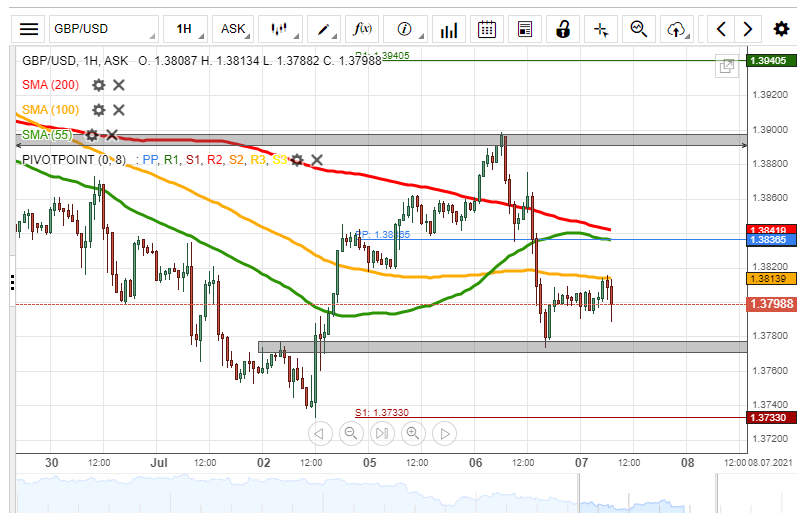
On Tuesday, the British Pound declined by 116 pips or 0.84% against the US Dollar. The exchange rate breached the 55-, 100 and 200– hour SMAs during Tuesday's trading session.
Everything being equal, the currency pair could continue to decline within the following trading session. The possible target for the GBP/USD pair will be near the 1.3733 area.
However, bearish traders might find support at 1.3780 during the following trading session.