Sample Category Title
USD/JPY Two Scenarios Likely
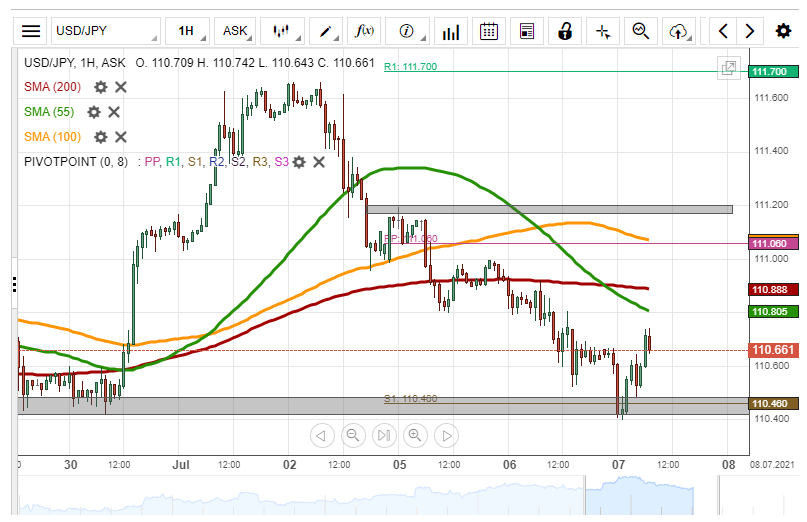
On Tuesday, the US Dollar fell by 41 pips or 0.37% against the Japanese Yen. The 200– hour simple moving average pressured the currency pair lower during yesterday's trading session.
Currently, the USD/JPY exchange rate is trading near a support level at the 110.44 area.
If the support line holds, buyers could drive the price higher within the following session.
However, if the currency exchange rate breaks the weekly support line, the next target for short traders will be near the 110.00 area.
XAU/USD Bounces Off Support
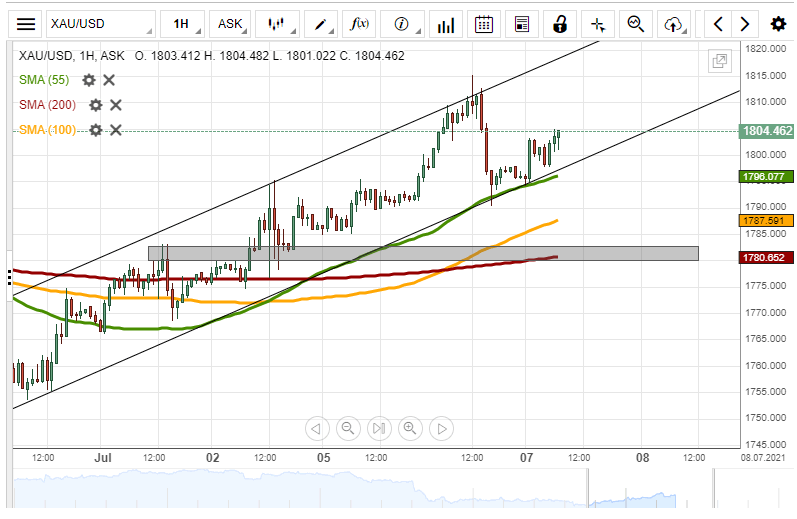
On Tuesday, the yellow metal edged lower by 196 points or 1.08% against the US Dollar. The decline was topped by the 55– hour simple moving average during Tuesday's trading session.
Given that the exchange rate has bounced off the support line formed by the 50– hour SMA at 1794.57, the commodity is likely to continue to surge in an ascending channel pattern within this session.
On the other hand, the XAU/USD exchange rate might reverse from the current price level at 1802.4 and target the 1780.11 area during the following trading session.
USD/CAD Daily Outlook
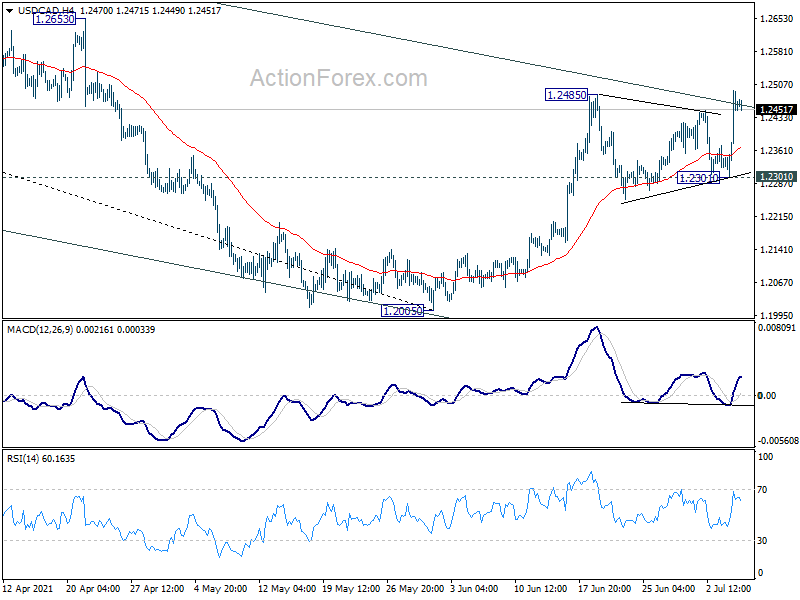
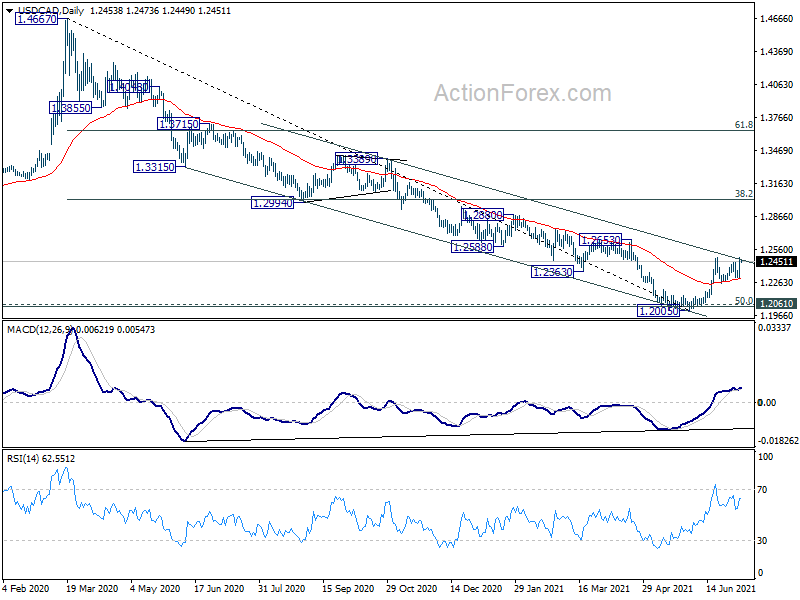
Daily Pivots: (S1) 1.2345; (P) 1.2420; (R1) 1.2537; More...
Breach of 1.2485 resistance suggests resumption of whole rebound from 1.2005. Intraday bias is now on the upside for 1.2653 key structural resistance next. Support from 55 day EMA is a sign of near term bullishness for USD/CAD. Hence, for now, break of 1.2301 support is needed to indicate short term topping. Otherwise, further rally will remain in favor in case of retreat.
In the bigger picture, fall from 1.4667 is seen as the third leg of the corrective pattern from 1.4689 (2016 high). It might have completed after hitting 1.2061 (2017 low) and 50% retracement of 0.9406 to 1.4689 at 1.2048. Sustained break of 38.2% retracement of 1.4667 to 1.2005 at 1.3022 will pave the way to 61.8% retracement at 1.3650. Overall, medium term outlook remains neutral at worst with 1.2048/61 support zone intact.
Daily Tecnical Analysis
EUR/USD
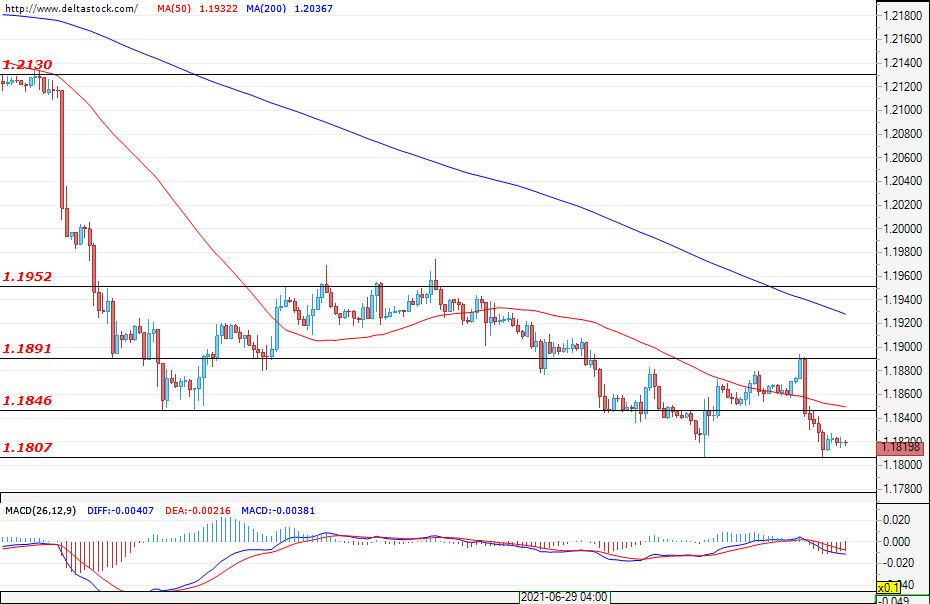
Current level - 1.1819
The resistance at 1.1846 was probed last Friday and, after the weak data from Europe, the bears managed to breach it yesterday. However, their momentum was enough only to reach the support at 1.1807. It is possible for the market to form a double-bottom at the mentioned level, which is also today's daily support. In order to complete the formation, it is desirable for the bulls to push the pair above the resistance at 1.1891. Limited bearish pressure around this area and the formation of a small range would confirm the reliability of the formation. In an alternative scenario, the bearish pressure from today may continue and 1.1807 may get breached. A potential next target for the bears could be the bottom from the end of March this year at 1.1700. Today, the most anticipated event on the economic calendar are the FOMC meeting minutes, where investors will seek guidance on interest rates.
| Resistance | Support | ||
| intraday | intraweek | intraday | intraweek |
| 1.1890 | 1.2130 | 1.1846 | 1.1760 |
| 1.1955 | 1.2237 | 1.1760 | 1.1690 |
USD/JPY
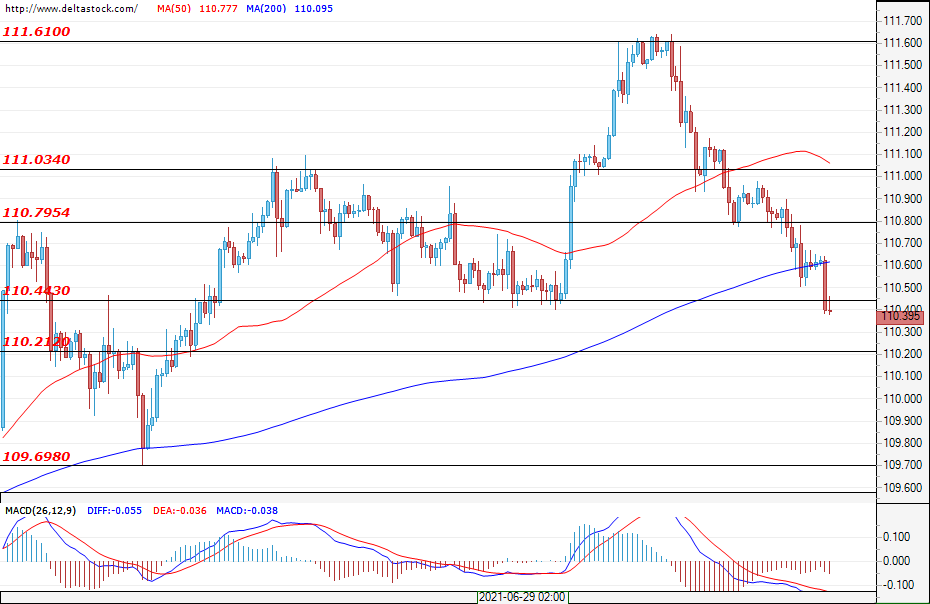
Current level - 110.39
The declines in the pair continued yesterday and, at the time of writing, the USD/JPY is gravitating around the support of 110.44. It is likely that this support will not be breached from the first attempt and that the market will enter a consolidation phase. However, if the pressure continues and the support is breached, the next target for the bears is the support around 110.21 and the next one at 109.69. From the perspective of the higher time frames, the pair is found in the lower band of an upward channel and the possibility to see strong interference from the bulls remains on the table.
| Resistance | Support | ||
| intraday | intraweek | intraday | intraweek |
| 110.79 | 111.61 | 110.44 | 109.69 |
| 111.03 | 112.60 | 110.21 | 109.69 |
GBP/USD
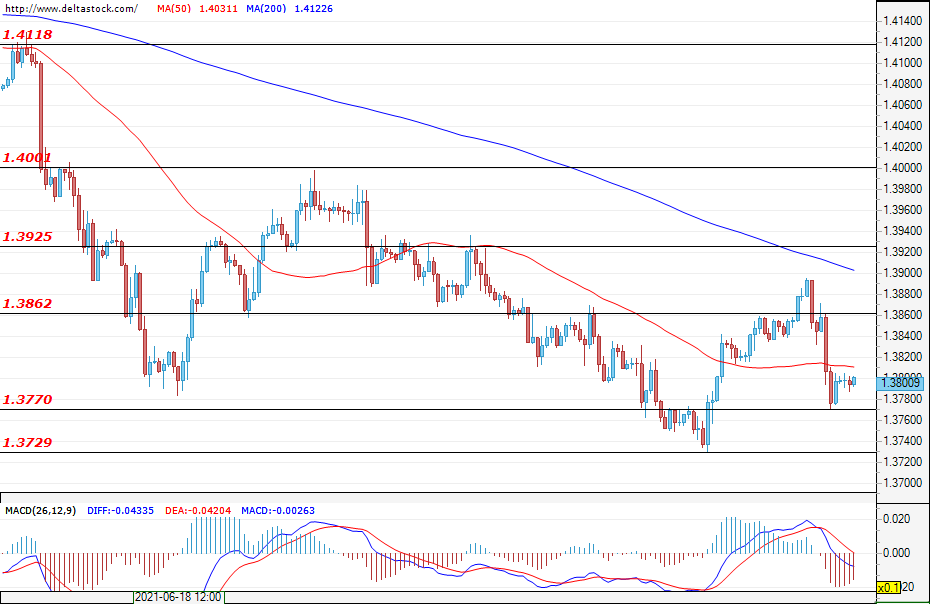
Current level - 1.3800
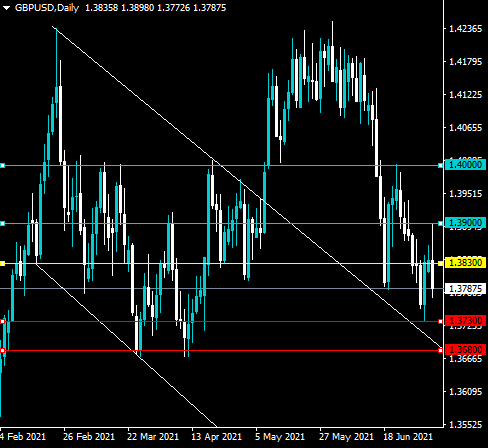
The sterling also lost value over the past day, but the bulls failed to score a new lower bottom. The price channel from the resistance at 1.3925 to the bottom at 1.3729 is an early indicator of bear exhaustion. Demand in the support zone between 1.3730-1.3770 turned out to be strong and this will be the first support for the day. If the market is truly already in the reversal phase, it is desirable to see a rally for the bulls targeting 1.3900. The bears still hold a lot of ground and a potential reversal would take time. In such a scenario, the trading area could be 1.3770-1.3925.
| Resistance | Support | ||
| intraday | intraweek | intraday | intraweek |
| 1.3862 | 1.4000 | 1.3770 | 1.3660 |
| 1.3925 | 1.4118 | 1.3730 | 1.3610 |
AUD/USD Daily Report
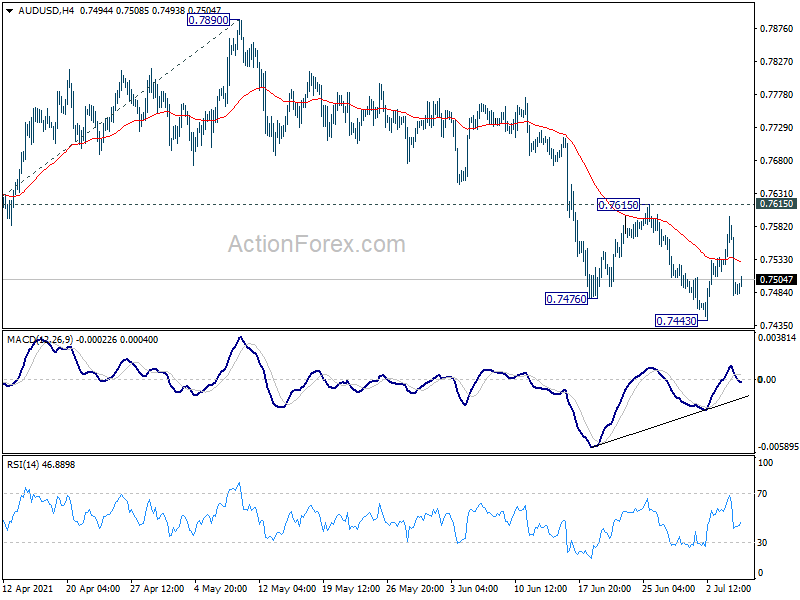
Daily Pivots: (S1) 0.7450; (P) 0.7524; (R1) 0.7568; More...
Intraday bias in AUD/USD remains neutral for the moment. On the upside, break of 0.7615 will argue that corrective pattern from 0.8006 has completed already. Further rise should then be seen back to 0.7890/8006 resistance zone. On the downside, break of 0.7443 will resume the whole corrective pattern from 0.8006. But we'd expect strong support from 100% projection of 0.8006 to 0.7530 from 0.7890 at 0.7414 to bring rebound.
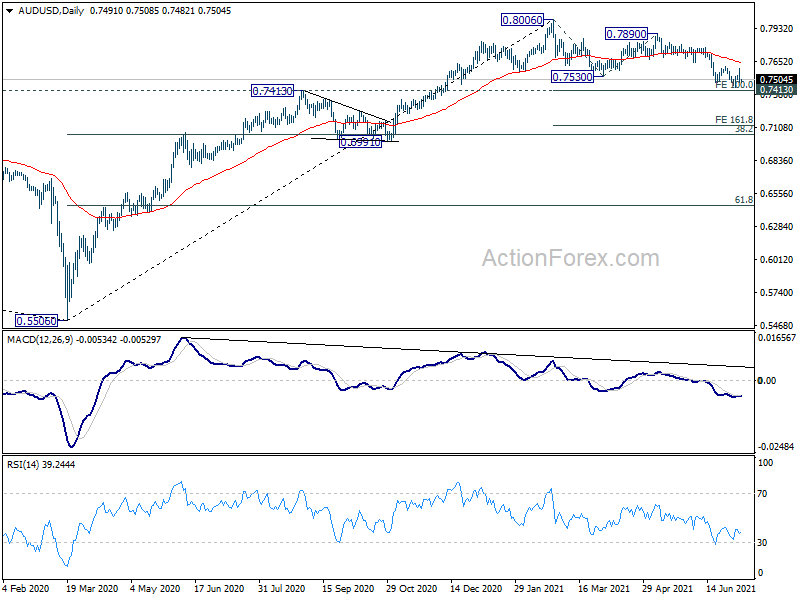
In the bigger picture, rise from 0.5506 medium term bottom could either be the start of a long term up trend, or a corrective rise. Reactions to 0.8135 key resistance will reveal which case it is. Rejection by 0.8135 key resistance, followed by firm break of 0.7413 resistance turned support, will favors the latter case. Deeper decline would be seen to 38.2% retracement of 0.5506 to 0.8006 at 0.7051 first.
BTCUSD $35,000 Pivot
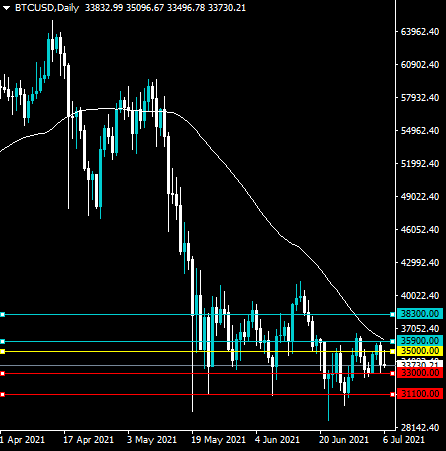
Bitcoin is under pressure in the short-term, following more bearish news from the People’s Bank of China surorunding cryptocurrencies. BTCUSD bulls need to anchor the pair above the $35,000 level to encourage a test towards the top cryptos 50-day moving average. To the downisde, a break under the $33,000 level exposes further losses towards the $31,000 support area.
The BTCUSD pair is only bullish while trading above the $35,000 level, key resistance is found at the $35,900 and the $38,300 levels.
If the BTCUSD pair trades below the $35,000 level, sellers may test the $33,000 and $31,000 levels.
EUR/USD Daily Outlook
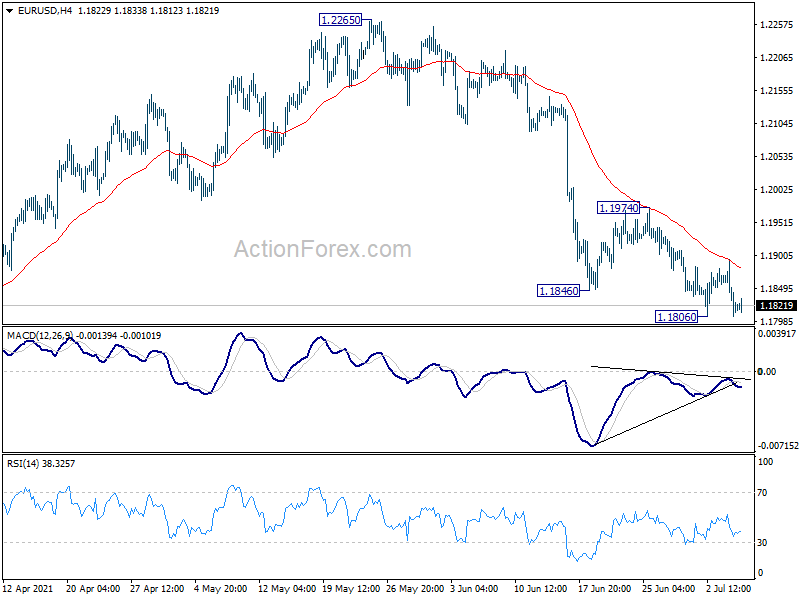
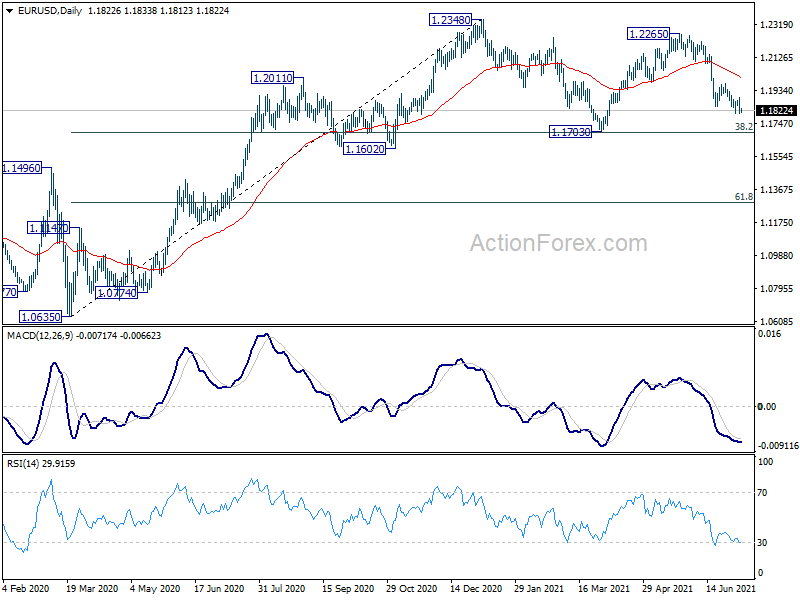
Daily Pivots: (S1) 1.1788; (P) 1.1841; (R1) 1.1876; More...
Intraday bias in EUR/USD stays neutral for the moment. Further fall is still in favor as long as 1.1974 resistance holds. Break of 1.1806 will resume the decline from 1.2265, as the third leg of the consolidation pattern from 1.2348, to 1.1703 support. On the upside, break of 1.1974 resistance will turn bias back to the upside for 1.2265 resistance.
In the bigger picture, rise from 1.0635 is seen as the third leg of the pattern from 1.0339 (2017 low). Further rally could be seen to cluster resistance at 1.2555 next, (38.2% retracement of 1.6039 to 1.0339 at 1.2516). This will remain the favored case as long as 1.1602 support holds. Reaction from 1.2555 should reveal underlying long term momentum in the pair. However sustained break of 1.1602 will argue that the rise from 1.0635 is over, and turn medium term outlook bearish again.
XRPUSD Correction Over
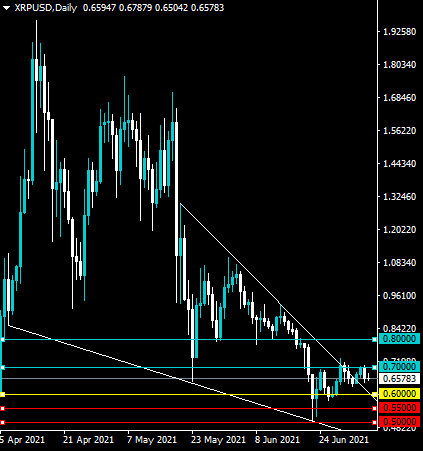
Ripple is struggling to gain upside traction despite staging an important technical breakout above an extremely large falling wedge pattern. XRPUSD is at risk of falling back towards the top of the falling price channel, now around the $0.6250 area, if it fails to rally. Sustained gains above the $0.7000 level will be a signal that the XRPUSD pair is headed towards the $0.8000 resistance level.
The XRPUSD pair is only bullish while trading above the 0.6500 level, key resistance is found at the 0.7000 and the 0.8000 levels.
If the XRPUSD pair trades below the 0.6500 level, sellers may test the 0.6250 and 0.6100 levels.
USD/JPY Daily Outlook
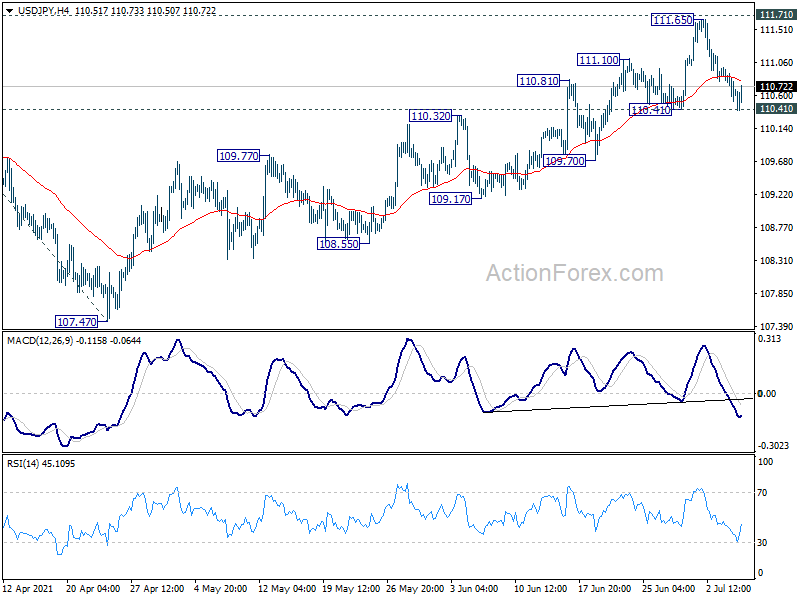
Daily Pivots: (S1) 110.43; (P) 110.71; (R1) 110.89; More...
Intraday bias in USD/JPY stays neutral for the moment. On the downside, firm break 110.41 support will indicate short term topping. Intraday bias will be turned back to the downside for 55 day EMA (now at 109.77). On the upside, sustained break of 111.71 will carry larger implication. Next target is 61.8% projection of 102.58 to 110.95 from 107.47 at 112.64.
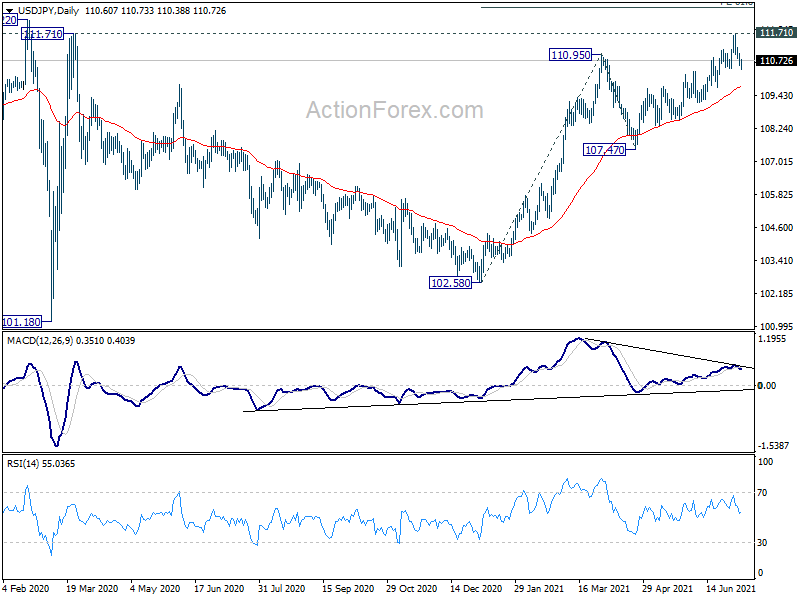
In the bigger picture, medium term outlook is staying neutral with 111.71 resistance intact. Though, as notable support was seen from 55 day EMA, rise from 102.58 is mildly in favor to extend higher. Decisive break of 111.71/112.22 resistance will suggest medium term bullish reversal. Rise from 101.18 could then target 118.65 resistance (Dec 2016) and above. However, sustained break of 55 day EMA would revive some medium term bearishness, and open up deep fall to 61.8% retracement of 102.58 to 110.95 at 105.77 and below.
GBPUSD Bearish Under 1.3800
The British pound currency has fallen sharply against the US dollar after as the greenback strengthens broadly on the foreign exchange market. The GBPUSD pair could test towards the top of a large falling price channel, around the 1.3660 level, if the 1.3730 support zone is broken. Overall, the GBPUSD pair has a heavily negative short-term bias while trading under the 1.3830 level.
The GBPUSD pair is only bullish while trading above the 1.3830 level, key resistance is found at the 1.3900 and the 1.4000 levels.
If the GBPUSD pair trades below the 1.3830 level, sellers may test the 1.3730 and 1.3680 support levels.