Sample Category Title
US 10-year yield dropped to lowest since Feb, more downside first
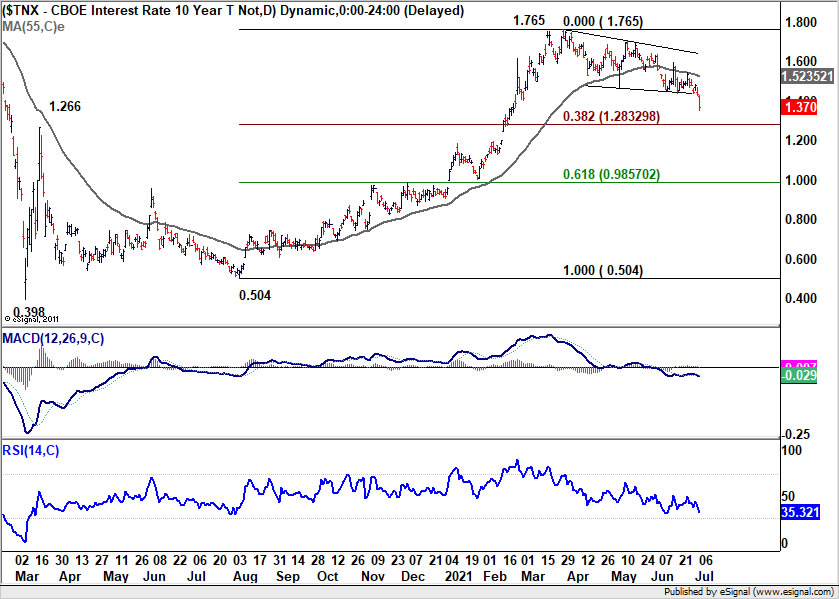
US 10-year yield dropped sharply overnight, by -0.061 to close at 1.370, hitting the lowest level since February. Some analysts noted that the move reflected believes that inflation in the US, and even the strong growth, were transitory only. The move also came in tandem with notable pull back in major stock indexes. Focuses will now turn to FOMC minutes for more guidance.
The speed of the fall in TNX was a surprise, even though the direction isn't. Prior rejection by 55 day EMA already hinted that corrective pattern from 1.765 would more likely extend lower than not. For the moment, we'd expect strong support 38.2% retracement of 0.504 to 1.765 at 1.283 to contain downside and bring rebound. In other words, there is room for further decline in the near term, but downside is relatively limited.
Australia AiG services dropped to 57.8, question on filling positions to fill orders
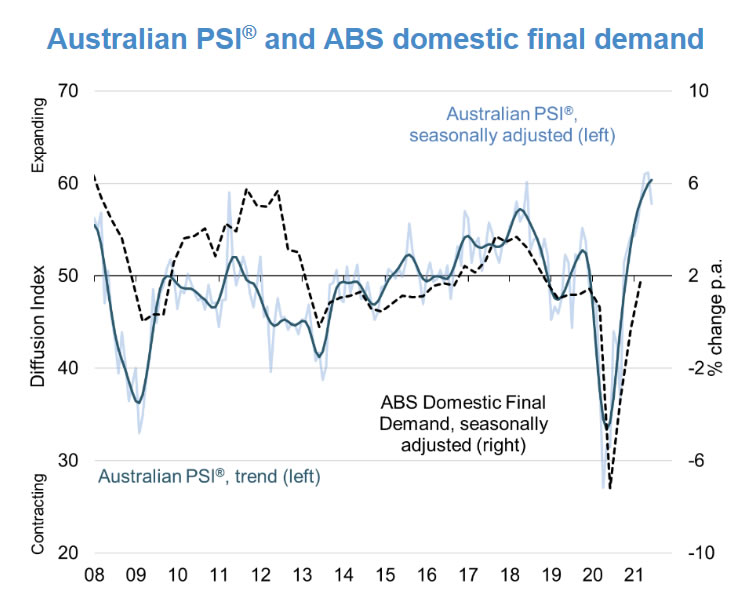
Australia AiG Performance of Services index dropped to 57.8 in June, down from 61.2. Sales dropped -2.5 pts to 66.1. Employment dropped -2.4 pts to 54.2. New orders dropped sharply by -11.7 to 56.6. Input prices dropped -2.7 to 65.4. Selling prices dropped -9.9 to 53.5. Average wages rose 2.9 to 66.0.
Ai Group Chief Executive, Innes Willox, said: "Some adverse impacts on demand and supply chains were associated with the COVID lockdowns and restrictions imposed by other states and territories. Businesses were also constrained by an inability to fill positions required either to maintain existing levels of activity or to expand to meet higher demand. Wages growth accelerated in June and input prices continued to rise although at a more moderate rate than in the previous month. The healthy rise in new orders came on top of the sharp rise in the previous month and points to strong demand over coming months. A key question for many businesses will be whether they can fill positions required to fill these orders."
On The Hop – Preview Of RBNZ Monetary Policy Review, July 2021
- We now expect the Reserve Bank to start raising the OCR from November this year.
- The cost pressures resulting from Covid-19 disruptions are well known.
- The more significant development for the RBNZ is the growing evidence that demand is running hot.
- Strong demand increases the risk that supply- related price shocks can become more enduring.
- Next week's Monetary Policy Review is likely to start setting the scene for a normalisation of monetary policy, without committing to a particular timing at this stage.
The May Monetary Policy Statement left the impression that the Reserve Bank was quite comfortable with how the economy was tracking. Activity was continuing to recover from the effects of the Covid-19 pandemic, albeit unevenly, and while inflation was expected to lift in the near term, this was viewed as temporary.
It's unlikely that next Wednesday's Monetary Policy Review will be anywhere near as sanguine. In the intervening weeks, we've seen a string of strong activity indicators, the housing market has remained perky even in the face of new restraining measures, and reports of rising prices and labour shortages have escalated dramatically.
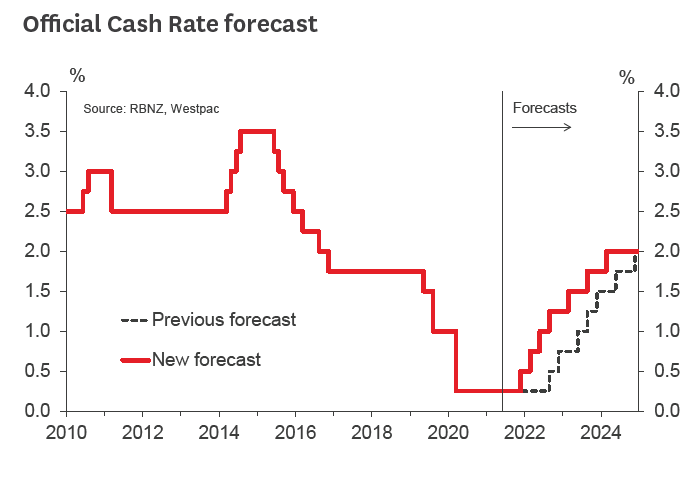
Admittedly we've been caught on the hop too. Having just recently brought forward our forecast of the first OCR hike to August 2022, we're now questioning whether the RBNZ has even that much time on its side. We now expect the first OCR hike to occur in November this year, with follow-ups in February and May next year, and a further gradual tightening over the following years
It's been apparent for some time that Covid-19 has largely manifested as a supply-side shock in New Zealand's case, with disruptions to supply chains, soaring shipping costs, and a loss of access to overseas workers. The key question for us has been whether the demand conditions were in place for that initial price spike to translate into an ongoing series of price increases.
In that respect, yesterday's Quarterly Survey of Business Opinion was a big deal for us. There was evidence of strong demand throughout the survey – measures of activity, hiring and investment were all up substantially compared to three months ago, and profitability was seen as improving even in the face of mounting cost pressures. That strength wasn't universal – the building industry is clearly running red-hot, while retailers are still struggling to improve their profitability – but it was widespread enough for us to take notice.
The questions on labour market conditions were also notable. Not surprisingly, firms said that workers are becoming extremely difficult to find. But the key measure for us was a sharp rise in reported labour turnover – heavily concentrated in the building sector, but not limited to that. That provides, at least, circumstantial evidence that employers have been willing to bid up in order to lure workers away from other firms. And the fact that they can afford to do so – an element that's been missing in times past – is another marker of strong demand.
Putting this all together leaves us with a picture of an economy that is already running close to its potential, even with the ongoing closure of the border. And with firm demand and mounting supply pressures, inflation is set to rise much higher than the RBNZ expected over the coming quarters.
There's still a good case to be made that some of the current inflation pressures will be temporary, or at least non-repeating. As the global economy reopens, we'd expect that supply chain disruptions will be ironed out, demand for physical goods relative to services will normalise, shipping costs will come off their peak, and employers that are bidding up now to deal with their current labour shortages will look for ways to claw back those higher pay rates. That could set the scene for a period of stubbornly low wage and price growth a few years down the track.
But the issue is whether the RBNZ can hold out for that long. With demand running hot, there's a greater risk that recent price hikes feed into people's expectations of inflation, and once that becomes embedded it's hard to dislodge again.
We expect that when OCR hikes begin, the pace will be gradual – at three-month intervals initially, then stretching out to six-month intervals. As others have noted, households have taken on significantly more debt since the last time that interest rates rose, so a little could go a long way in terms of squeezing household budgets and dampening demand
What to expect from the RBNZ statement.
Next week's policy announcement is a Monetary Policy Review, which means a shortened process and no new published forecasts. The RBNZ may want to hold off some of the more difficult judgements until the August Monetary Policy Statement, but the July statement is likely to set the scene for an eventual policy tightening.
The RBNZ will acknowledge that domestic activity is showing some strong momentum. The single biggest surprise for the RBNZ was the 1.6% rise in March quarter GDP, against their forecast of a 0.6% drop. That result will probably also prompt the RBNZ to revise up its assumption about the economy's potential, but the net effect will still be a significant positive surprise.
The RBNZ will also acknowledge the extent of current price pressures, and the increased risk that some of these price rises could become persistent rather than temporary. Unusually, the RBNZ review comes a couple of days before the June quarter CPI release.
The May statement concluded in a similar fashion to previous statements:
“The Committee agreed to maintain its current stimulatory monetary settings until it is confident that consumer price inflation will be sustained near the 2 percent per annum target midpoint, and that employment is at its maximum sustainable level. Meeting these requirements will necessitate considerable time and patience.”
That language will undoubtedly have to change. While sustained inflation and maximum sustainable employment aren't a certainty, it's clear that they are no longer a “considerable time” away. And given that monetary policy settings are already so stimulatory, starting the normalisation process early will reduce the risk of having to tighten rapidly later.
As for the RBNZ's unconventional easing measures, we suspect that any formal statement on their future will wait until August. But for the record:
- The Large Scale Asset Purchase programme has already been substantially wound down, with the current pace of purchases ($200m per week) falling well below the Treasury's rate of issuance ($500m per week).
- The Funding for Lending Programme for banks will largely take care of itself. The lending rate is tied to the OCR, so the prospect of a series of OCR hikes means that it won't be seen as a cheap source of funding for much longer
Elliott Wave View: Bitcoin (BTC) Looking For Further Downside
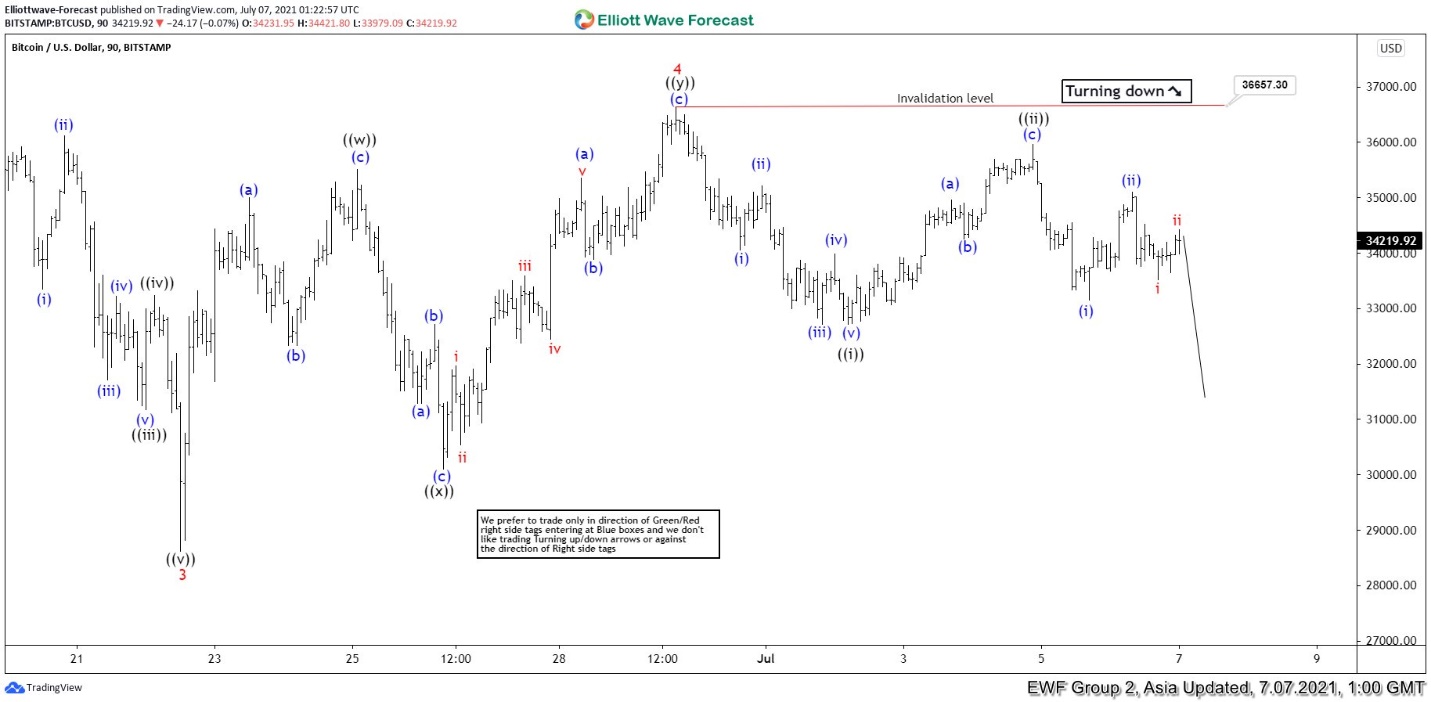
Short term Elliott Wave suggests the decline from May 20, 2021 high is unfolding as a diagonal. Down from May 20 high, wave 1 ended at 31107.46 and rally in wave 2 ended at 41341.57. The crypto currency declined again in wave 3 towards 28600 and bounce in wave 4 is proposed complete at 36687.78. Internal subdivision of wave 4 unfolded as a double three Elliott Wave structure. Up from wave 3, wave ((w)) ended at 35517.22, pullback in wave ((x)) ended at 30082.79, and the last leg wave ((y)) of 4 ended at 36687.78.
Wave 5 is currently in progress with internal subdivision as a 5 waves impulse. Down from wave 4, wave (i) ended at 34049.36, and rally in wave (ii) ended at 35212.12. Wave (iii) ended at 32700.88, rally in wave (iv) ended at 33981.51, and final leg wave (v) of ((i)) ended at 32700.05. The crypto currency then rallied in wave ((ii) which ended at 35960 with internal subdivision as a zigzag. Down from there, wave (i) ended at 33143, and bounce in wave (ii) ended at 35100.49. Near term, while rally fails below 36687.78, expect Bitcoin to extend lower.
Bitcoin 90 Minutes Elliott Wave Chart
Market Morning Briefing: EURJPY Has Fallen Below 131
STOCKS
Equities seem to lack momentum to break their immediate resistances and see a fresh rally. Dow has come-off failing to sustain above 34700 and can fall to 34000-33000 on a break below 34500. DAX continues to remain mixed within its 15400-15800 range. Nikkei is coming down towards its crucial long-term support level of 28000 and needs a closed watch. Shanghai is holding above 3500 and is retaining its 3500-3625 range. Sensex and Nifty have come-off from their resistances at 53000 and 15900 respectively. This could keep the 52000-53000 (Sensex) and 15600-15900 (Nifty) range intact for some more time before an upside breakout of this range happens.
Dow (34577.37, −208.98, -0.60%) has failed to sustain above 34700 and has declined sharply. A further fall/close below 34500 can drag it down to 34000-33500 again. It will then negate the chances of seeing a break above 35100 immediately and could delay the same.
DAX (15511.38, −150.59, -0.96%) has dipped below 15600 and continues to look mixed within its 15400-15800. As mentioned yesterday we will have to wait for a breakout of this range to get a clear cue on whether the DAX can move up to 16000-16200 or fall to 15200-15000 going forward.
Nikkei (28341.56, −301.65, -1.05%) has declined sharply and is coming closer to the crucial support level of 28000. As we have been mentioning for some time, 28000 is a strong long-term support which is expected to hold and produce a bounce to keep the broader uptrend intact. In case if Nikkei breaks below 28000, a deeper fall to 27000-26000 is possible. The price action at 28000 will need a close watch.
Shanghai (3531.75, +1.49, +0.04%) has bounced after testing 3500. This keeps the 3500-3625 range intact and a rise to 3550-3600 can be seen while above 3500. As mentioned yesterday, a break below 3500, if seen, can trigger a deeper fall to 3450-3400 which in turn will delay our preferred medium term rise to 3700-3800. While above 3400, the long-term trend is up.
Sensex (52861.18, −18.82, -0.04%) broke above 53000 but failed to sustain. While below 53000, a fall back to 52000 and the range of 52000-53000 can remain intact for some more time. In case if Sensex breaks below 52000, the downside can extend up to 51000. Overall 52000-53000 (narrow) or 51000-53000 (broad) are the possible range that could be seen for sometime before we see a break above 53000 and a rise to 54000 and higher eventually.
Nifty (15818.25, −16.10, -0.10%) had come-off after testing 15900 yesterday. This could keep the 15600-15900 range intact for some more time. As such the expected break above 15900 and the rise to 16000-16200 could get delayed further.
COMMODITIES
Commodities have come down after rising sharply yesterday. Brent and WTI have come down significantly but we need to see if they rise back to test $80 (Brent) and $78/79 (WTI) on the upside before we see a medium term reversal. Gold and silver have also come down after rising yesterday. Copper went up to test the upper side of the range of 4.10-4.40/50 and has come down today. Copper can consolidate between 4.1-4.5 for some more time before we see a decisive break on either side.
Brent (74.47) and WTI (73.42) have dipped today after a sharp rise seen yesterday. $78 on Brent and $77 on WTI has held well for now and while the resistances hold, a short dip towards $72-71 looks likely on both. Watch price action in the near term to see if the prices reverse higher again for Brent to test $80 and WTI to test $78/79 levels before a sharper decline is seen.
Gold (1800.60) made an intra-day high of 1809 yesterday but has dipped slightly from there. Immediate rise to 1820 is on the cards followed by a further rise towards 1840/60 in the longer run. View is bullish while above 1800.
Silver (26.25) too tested 26.84 yesterday before coming off from there. But overall view is bullish for a slow and steady rise towards 27-28 in the medium term.
Copper (4.2755) tested 4.4025 yesterday before falling from there. The movement has been in line with pur expectation and a range of 4.40/45-4.10 can hold for a few more sessions before a break on either side is seen.
FOREX
Currencies look mixed. Dollar Index has risen a bit and could be ranged within 92-93 for the near term. Euro has scope to test 1.18 before rising from there. Aussie looks bearish for the near term while Pound can rise from current levels. EURJPY has fallen sharply and need to see if it can hold above 130 to rise back else could be vulnerable to a sharp fall going ahead. USDCNY look stable while USDINR can rise towards 74.80-75 before falling from there.
Dollar Index (92.55) has risen from levels seen yesterday and while above 92, we may expect trade within 92-93 for some more time.
Euro (1.1818) has dipped further and could test 1.18 before rising higher towards 1.19 in the medium term. While Dollar Index heads higher within the 92-93 range, Euro may attempt to test 1.18 before rising.
EURJPY (130.64) has fallen below 131 and could test immediate support near 130 before bouncing back. Any break below 130 would negate out bullish view and open up chances of a fall towards 129-128 in the longer run. Watch price action near 130 for a bounce back.
Dollar-Yen (110.52) continues to dip and could head to test 110-109.50 on the downside before bouncing back from there.
Aussie (0.7486) continues to fall and has broken below 0.75. View is bearish to test 0.74 before a rise is expected towards 0.75 or higher. Immediate view looks bearish.
Pound (1.3792) can rise towards 1.39-1.3950 n the near term while above 1.3730. View is bullish for the near term.
USDCNY (6.4734) looks stable between 6.45/44-6.48 for the near term.
USDINR (74.5475) bounced back from 74.24 yesterday negating a fall to 74 mentioned yesterday and if the rise continues, we may have to allow for a re-test of 74.80 or even 75 before a sharper decline is seen. On the downside, immediate support is seen at 74.20.
INTEREST RATES
The US Treasury yields have declined sharply across tenors. The 30Yr has room to test 1.9% which in turn can drag the 10Yr also more lower breaking below its immediate support at 1.35%. The German yields have also declined sharply and are turning bearish. A further fall is likely in the coming days and the earlier bullish view is getting negated now. The 10Yr GoI has surged above 6.1% and now has high chances of seeing 6.2% and even 6.3% in the coming days before reversing lower again.
The US 2Yr (0.22%) Treasury yield has dipped slightly while the 5Yr (0.80%), 10Yr (1.35%) and 30Yr (1.98%) have declined sharply. As mentioned earlier, the 30Yr has room to test 1.9% from where we can expect a reversal. This leaves the chances high of the 10Yr breaking below its immediate support level of 1.35% and extend the fall to 1.25%-1.2% in the coming days and then reverse higher.
The German 2Yr (-0.69%), 5Yr (-0.62%), 10Yr (-0.27%), 30Yr (0.22%) yields have declined sharply especially at the far-end. The 30Yr has broken below the key support level of 0.25% and can now fall to 0.10% while it sustains lower. The 10Yr on the other hand looks vulnerable to break -0.30% and fall to -0.45% in the coming days. Our earlier bullish view of seeing a rise to 0% (10Yr) and 0.55% (30Yr) is getting negated now.
The 10Yr GoI (6.1752%)has surged breaking above the key level of 6.10% and has closed on a strong note. While this break sustains, the chances are high for the 10Yr GoI to break 6.2% from here and extend the rise to 6.3%-6.32% in the coming days. Thereafter a turn-around can happen.
USD/CAD Starts Fresh Rally, FOMC Minutes Next
Key Highlights
- USD/CAD started a fresh rally from the 1.2300 support zone.
- It broke many hurdles near 1.2400 and 1.2420 on the 4-hours chart.
- EUR/USD struggled to recover above 1.1900, GBP/USD failed to clear 1.3900.
- The US ISM Services PMI declined from 64.0 to 60.1 in June 2021.
USD/CAD Technical Analysis
The US Dollar formed a strong base above the 1.2300 level against the Canadian Dollar. As a result, USD/CAD started a strong rally and it cleared many hurdles near 1.2400.
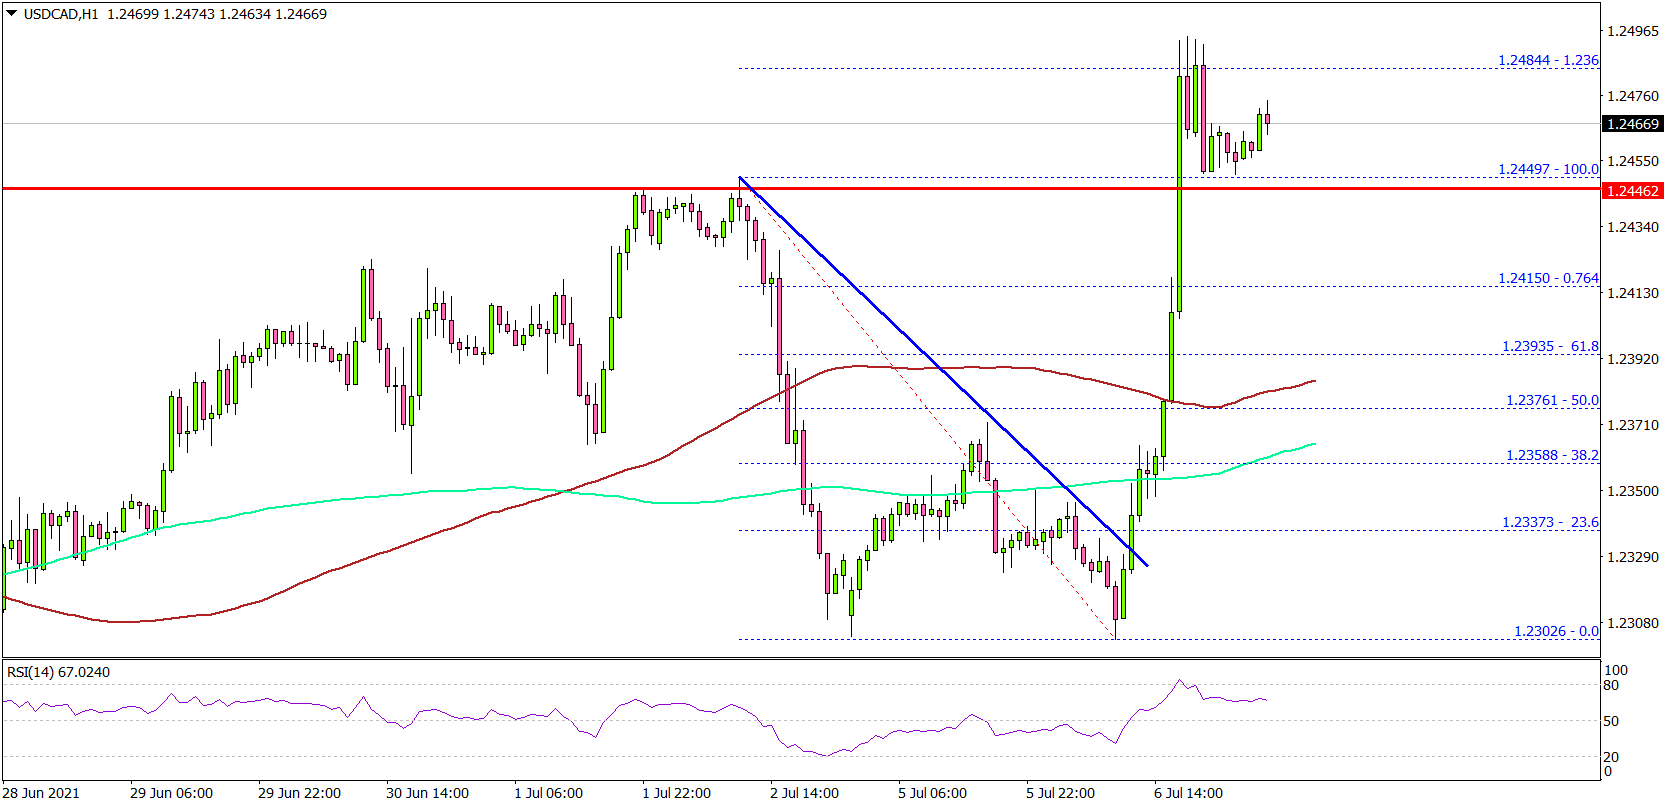
Looking at the 4-hours chart, the pair formed a double bottom pattern near the 1.2300 zone. It cleared a key bearish trend line with resistance near 1.2330 to move into a positive zone.
There was a strong upward move above the 1.2400 level. The pair even cleared the 1.2440 resistance and the last swing high at 1.2449. It tested the 1.236 Fib extension level of the last key decline from the 1.2449 high to 1.2302 low.
If there are more gains, the pair could test the 1.2500 resistance. The next major resistance is near the 1.2540 level. Conversely, the pair could correct lower towards 1.2400.
The next major support is near 1.2375 and the 100 simple moving average (red, 4-hours). Any more losses may possibly call for a drop towards the 1.2340 level.
Looking at EUR/USD, the pair failed to correct above 1.1900 and it remains at a risk of more losses. Similarly, GBP/USD failed to surpass the 1.3900 resistance zone.
Economic Releases
- Canada’s Ivey PMI for June 2021 - Forecast 58.8, versus 59.8 previous.
- FOMC Meeting Minutes.
Eco Data 7/7/21
[php_everywhere instance="1"]
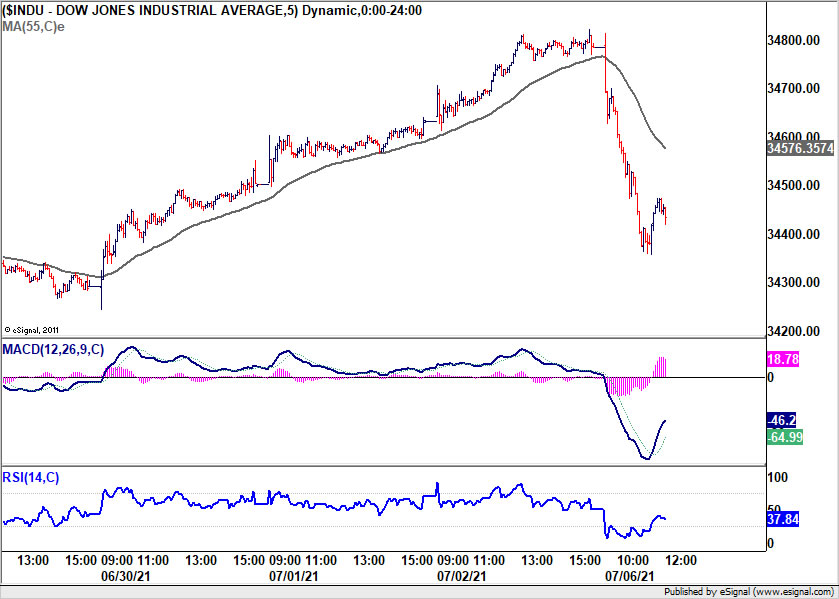
DOW down sharply in early trading, Dollar and Yen rebound
Yen and Dollar staged a strong rebound in early US session after stocks unexpectedly tumbled deeply. DOW was once down as much as -431 pts and it's down nearly -1% at the time of writing. Slightly weaker than expected ISM services shouldn't be that big an impact. However, both ISM manufacturing and services employment were back in contraction in June.
There might also be speculations that Fed would be forced to tightening the tap a bit, as global central banks are starting to do so. Speculation might have intensified after RBA's tapering and speculation of RBNZ rate hike, given that BoC has already cut down bond purchases.
China's way of crackdown on technology companies is also a source of concern. Ride-hailing giant Didi has just had a massive IPO lost week, but the Chinese government was quick to launch a so-called cyber security investigation, forcing the app down the shelves. Two smaller recent listings, Full Truck Alliance and Kanzhun are also believed to be under review.
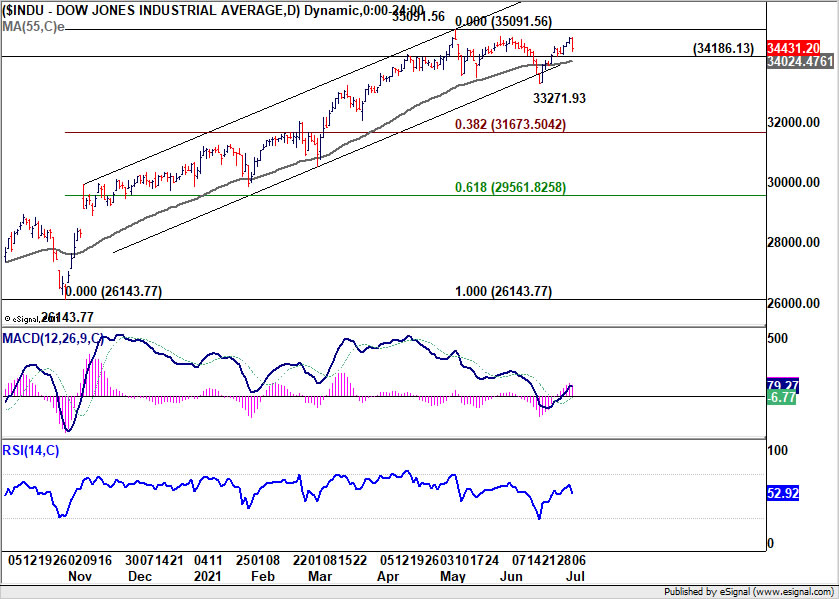
Technically, DOW's steep pull back today doesn't alter the near term bullish path yet. As long as 34186.13 support holds, it will still more likely to break through 35091.56 high to resume larger up trend. However, break of 34186.13 will likely extend the consolidation pattern with another falling leg towards 33271.93 support, in the less bearish case.
Power of the Apes, ISM Slips, China’s big-Tech Crackdown, Oil Hits 6-Year High, Gold Rallies
Like my vacation, all good things must come to an end, and so must the S&P 500 index winning streak. Risk appetite is fleeing as investors return from the long holiday weekend with some jittery headlines on more crackdowns from Beijing, nervousness about the goldilocks period for stocks, and expected further hawkish notes from FOMC minutes that are due on Wednesday.
Softer ISM Services data with a decrease in prices paid supported the inflation is transitory argument and helped send Treasury yields lower. The 10-year Treasury in early trade was 6.9 basis points lower at 1.355%.
AMC
The power of the apes is nothing to mess with. AMC CEO Aron tweeted "It’s no secret I think shareholders should authorize 25 million more AMC shares. But what YOU think is important to us. Many yes, many no. AMC does not want to proceed with such a split. So, we’re cancelling the July vote on more shares. And no more such requests in 2021."
AMC is mostly held by retail traders and this reversal in issuing more shares should keep his diehard followers happy for now. AMC may decide to issue shares next year, but for now the CEO is closely listening to his retail shareholders.
Services Data
Today’s services PMI data showed a slight deceleration in June. The ISM services index posted a noticeable drop from the record set in May. The headline index fell from 64.0 to 60.1, while all the components except for backlog of orders and imports had declines. The ISM employment component fell into contraction territory which supports the struggle employers are having filling vacancies.
The final reading of Markit Services PMI was also revised lower from 64.8 to 64.6.
The US service sector is still strong and while pricing pressures remain, this report does not provide any new signals that support the argument that tapering should happen sooner than early next year.
China
China’s cybersecurity crackdown is dragging down Didi and a few more firms (Kanzhun Ltd.,and Full Truck Alliance Co) , along with most Chinese tech stocks. Regulators imposed their will against the ride-hailing giant which led to the halting of the heavily anticipated IPO. The late Friday restrictions meant traders could not act on the July 5th holiday.
China has provided a strong backdrop for risk appetite over the years but lately it seems things are heading in the wrong way. This latest round of crackdowns are putting some US IPOs in jeopardy.
Another big risk for the world’s second largest economy is the struggle in reaching the agreed upon purchases with the phase-one trade deal with the US. A conciliary tone was expected from President Biden and that is not what has happened so far. It seems the US is mounting a case against China that will likely lead to tense moments over the coming months. US-China relations have a plethora of risk themes that include Taiwan, global security challenges, human rights issues, back-and-forth sanctions, and trade.
Oil
OPEC+ drama is the icing on the cake for the rally in crude prices that is widely supported on an improving global economic recovery. Everyone knows that the OPEC+ experiment wouldn’t last forever, but this somewhat surprise move by the UAE is just a smart posturing on their behalf. It doesn’t make sense just yet for the UAE to leave the cartel, but they sure are getting ready for the eventual battle for market share.
Now that everyone expects crude prices to rise, the question is will Brent crude find resistance at $85 or even the $90 level. An agreement could still happen in a week or two, but that uncertainty might be enough to support another surge in oil prices. While the decision to keep output unchanged is what the current agreement says, no one should believe that OPEC+ members won’t start increasing output.
The oil market is heading toward a deeper supply deficit and that is supporting the kingdom’s decision to raise prices strongly. Saudi Aramco lifted the official selling price for Arab Light crude by 80 cents a barrel to $2.70 above the Oman/Dubai average for Asia, the largest monthly increase since January.
Crude prices turned negative as bullish bets became overcrowded and as optimism remains that OPEC+ will work this out and not allow the market get too tight.
Gold
Gold prices are valiantly fighting off a potential death cross as stubbornly low Treasury yields shows steady flows boost sentiment for the precious metal. For gold prices to continue rebounding, it needs to survive the upcoming Fed Minutes that will most likely confirm their hawkish tilt. Taper discussions are intensifying and that should drive a stronger dollar that could be a drag on gold prices.
After a disastrous June, gold is stabilizing but the downside short-term risks remain as the oil price spike is driving inflation concerns. The long-term outlook for gold is still bullish as the low interest rate environment will likely remain in place over the next couple of years. The 10-year Treasury yield has probably peaked for the remainder of the year and that should provide a friendly environment for gold to eventually recapture the $1,900 level.
Bitcoin
Bitcoin’s overly optimistic calls have quickly faded away as investors anticipate a boring period. The mining activity is exiting China and that period of adjustment supports an extended trading range. The longer-term bullish case for Bitcoin embraces the departure from China as it supports the decentralization of mining activity.
Bitcoin is in a difficult period after Wall Street has turned slightly bearish for the remainder of the year. The world’s largest cryptocurrency is once again trading near the lower boundaries of its $30,000 to $41,000 trading range that has been in place since mid-May.
Bitcoin quickly gave up earlier gains after reports that the PBOC and Beijing’s local financial regulator ordered a software maker to shutdown over suspected crypto trading. China’s crackdown is intensifying and that is why Bitcoin’s hash rate, how hard it is to mine, has recently plunged the most on record.
EUR/USD: Bears Regain Control after Limited Consolidation
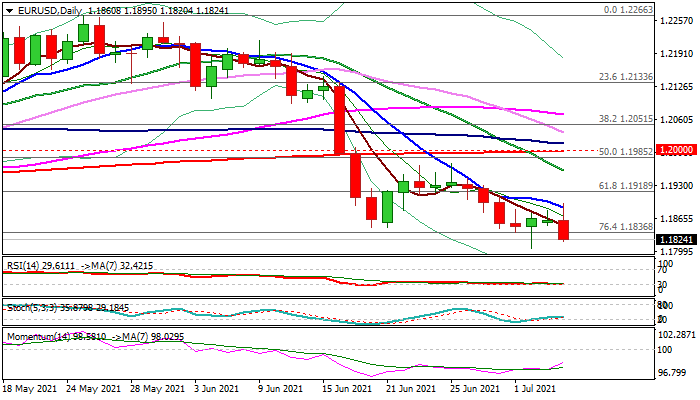
Bears regained control after brief consolidation was capped by falling 10DMA and fresh weakness is on track for eventual close below cracked pivot at 1.1836 (Fibo 76.4% of 1.1704/1.2266 upleg).
Disappointing German data added to euro’s weak sentiment, as investor morale fell much below expectations in July, suggesting that investors expect the ECB to maintain its accommodative policy.
Close below 1.1836 would generate initial bearish signal, with extension below 1.1800 zone to trigger stops parked below and risk test of next key levels at 1.1700 zone (Mar 31 low / Fibo 38.2% of 1.0635/1.2349 ascend).
Near-term action is expected to remain biased lower while capped by 10DMA.
Res: 1.1887; 1.1918; 1.1975; 1.2000
Sup: 1.1795; 1.1737; 1.1704; 1.1694