
Sample Category Title
(ECB) Monetary policy accounts
Account of the monetary policy meeting of the Governing Council of the European Central Bank held in Florence on Wednesday and Thursday, 29-30 October 2025
27 November 2025
1. Review of financial, economic and monetary developments and policy options
Financial market developments
Ms Schnabel started her presentation by noting that since the Governing Council’s previous monetary policy meeting on 10-11 September 2025, financial markets had once again shown resilience to shocks. The risk appetite of investors in the euro area stood close to its highest level since the onset of the global financial crisis, amid persistently low volatility across asset classes.
The prevailing positive risk sentiment had been underpinned by the macroeconomic outlook in both the euro area and the United States, with both economies continuing to show greater than expected resilience to the ongoing trade conflict and geopolitical headwinds. Market indicators of expectations for euro area growth continued to suggest a robust economic expansion. Growth expectations for 2025 had been revised up and stood well above their level prior to the initial announcement of higher US tariffs. Growth expectations for 2026 and 2027 were close to pre-tariff expectations and were near to the level of potential growth. Market indicators of medium-term inflation expectations were close to 2%. The one-year inflation-linked swap (ILS) rate two years ahead in the euro area had hovered around 1.85% since August, corresponding to around 1.95% when including tobacco, despite a decline in crude oil prices. US inflation compensation, as measured by the one-year ILS rate two years ahead, had fallen below 2.4%, down from 2.5% in late August. This had reinforced investor confidence that the US Federal Reserve System would continue to lower interest rates, which had been another key factor supporting global risk appetite.
The resilient macroeconomic outlook had strengthened the market view that the key ECB interest rates continued to be in a good place. According to the latest overnight index swap (OIS) forward curve, investors had almost fully priced out any further rate cut in 2025, but left the door open for another rate cut in 2026, assigning a 40% chance to one additional rate cut by the end of 2026. By contrast, the median participant in the October Survey of Monetary Analysts anticipated no further cuts in 2025 and saw the rate-cutting cycle as being concluded, in line with the latest Bloomberg and Reuters surveys. As incoming data had reduced uncertainty about the economic impact of US trade policies, uncertainty around the ECB’s policy rate path had also declined.
Buoyant risk sentiment, supported by the resilient macroeconomic backdrop and by optimism on the impact of artificial intelligence (AI), had been mirrored in equity markets. Euro area and US equity prices had continued to rise since the Governing Council’s previous monetary policy meeting, with only a brief dip in mid-October following renewed US-China trade tensions and concerns about some US regional banks. A decomposition of euro area stock market developments illustrated that the rally since the start of the year had been largely driven by upward revisions in earnings expectations, more than compensating the effect from expectations of somewhat tighter monetary policy. At the same time, the continued strong performance of stock markets had raised increasing concerns about potential overvaluations in financial markets, especially in the United States. Standard earnings-based valuation metrics could even be understating potential overvaluation, as they did not consider the surge in capital expenditure. While AI optimism had driven huge investments and higher expectations of future earnings, cash returns had lagged.
The surge in stock prices had been accompanied by a sharp rise in gold prices, refuting historical correlations. The current gold rally had been initially driven by central banks diversifying their reserves, especially in emerging markets. More recently, institutional and retail investors had joined in, and there had been exceptionally strong inflows into gold-backed exchange-traded funds (ETFs). This shift could reflect investors hedging risks related to a possible correction of stretched equity valuations or a gradual move away from US dollar-denominated assets as the primary safe haven.
Such developments had also been reflected in investors’ hedging against currency risks. Since the April tariff announcements, inflows into US equity ETFs had been accompanied by a marked rise in hedging activity, which had waned recently but remained elevated. At the same time, recent exchange rate developments spoke against a broad-based rebalancing away from US dollar assets. The dollar’s decline in nominal effective terms had come to an end in July, and since then it had moved broadly sideways. Similarly, the euro had stopped appreciating and had also remained broadly stable over the past four months, both in nominal effective terms and against the US dollar. Moreover, option price data indicated that risks to the level of the EUR/USD exchange rate had become more balanced.
With advanced economies expected to increase bond issuance, there had been a steepening of the euro area OIS spot yield curve over 2025 after years of inversion, bringing it closer to its long-term average. However, since the Governing Council’s previous monetary policy meeting, the steepening trend had stalled. Euro area sovereign debt markets had continued to function smoothly, helped by the activities of debt management offices. Within the euro area, country-specific fundamentals continued to explain changes in sovereign yields. At the same time, firm-specific characteristics had been the primary drivers of the variation in corporate bond pricing across countries, suggesting an integration of the euro area corporate bond market.
Overall, strong risk sentiment and, to a lesser extent, a weaker exchange rate had led to an easing of euro area financial conditions. Financial conditions had broadly returned to levels observed three years earlier, shortly after the start of the monetary policy tightening cycle.
Turning to money markets, discussions about a gradual slowdown or phasing-out of quantitative tightening in the United States and the United Kingdom had intensified, as occasional spikes in repo market rates had signalled less abundant reserve levels. However, the euro area had not yet seen any broader impact from less abundant excess liquidity levels. Euro area repo rates had risen gradually, but they remained close to the deposit facility rate. This had also been reflected in limited recourse to the ECB’s standard refinancing operations.
The global environment and economic and monetary developments in the euro area
Mr Lane then went through the latest economic, monetary and financial developments in the global economy and the euro area.
Starting with inflation developments in the euro area, Mr Lane noted that the assessment of the inflation outlook was broadly unchanged. Inflation remained close to the 2% medium-term target and was evolving broadly as expected. Headline inflation had increased to 2.2% in September from 2.0% in August. The increase reflected a reduction in energy price deflation, to -0.4% from -2.0% in August, which was largely driven by a base effect. Non-energy inflation had been constant at 2.5% since May. Food price inflation had moderated to 3.0% in September from 3.2% in August. Core inflation, i.e. excluding energy and food, had edged up to 2.4% from 2.3%, owing to a 0.1 percentage point increase in services inflation to 3.2%. Non-energy industrial goods inflation had been unchanged at 0.8% for the third month in a row.
Indicators of underlying inflation remained consistent with the 2% medium-term target. While company profits were recovering, labour costs were set to moderate further, thanks to an easing in wage growth and rising productivity. Forward-looking indicators, such as the ECB wage tracker and surveys on wage expectations, pointed to slower wage growth over the remainder of 2025 and the first half of 2026, in line with the September ECB staff macroeconomic projections for the euro area.
Most measures of longer-term inflation expectations continued to stand at around 2%. The latest Surveys of Professional Forecasters had shown a medium-term profile similar to that in the staff projections. Market-based indicators of inflation compensation were also broadly in line with the September projections.
Turning to the external environment, the euro exchange rate had moved broadly sideways against the US dollar and in nominal effective terms since the Governing Council’s last monetary policy meeting. Forward curves for oil and gas were broadly unchanged compared with the September projections. Global food prices had declined significantly since the start of the year, but from a very high level.
The latest indicators suggested resilience in global economic activity. The global composite Purchasing Managers’ Index (PMI) excluding the euro area had averaged 53.0 in the third quarter of the year, compared with 51.4 in the second quarter, supported in particular by the services sector. The manufacturing PMI had also increased on average in the third quarter, but manufacturing output had exhibited some volatility, as firms processed inputs that had been stockpiled earlier in the year in anticipation of higher tariffs. Global trade growth was expected to slow in the near term.
The euro area economy had grown by 0.2% in the third quarter of the year, according to Eurostat’s preliminary flash estimate. The composite PMI had averaged 51.0 in the third quarter, compared with 50.4 in the second quarter. For October, the flash composite PMI had increased to 52.2, from 51.2 in September, driven by the services component, which had risen to 52.6 from 51.3 in September. The services sector had continued to grow, boosted by strong tourism and, especially, by a pick-up in digital services. The Corporate Telephone Survey showed that many firms had stepped up their efforts to modernise IT infrastructures and integrate AI into their operations. Meanwhile, manufacturing had been held back by higher tariffs, still-elevated uncertainty and the stronger euro. The headline PMI reading for the manufacturing sector pointed to stagnation, at 50.0 in October, compared with 49.8 in September.
The unemployment rate had stood at 6.3% in September, close to its historical low. The employment PMI had returned to its August level of 50.8 in October, up from 49.7 in September, reflecting an increase in services sector employment. However, the manufacturing employment PMI had contracted further in October. While the trend in the Indeed job postings data indicated a softening in labour demand in recent months, there were signs of some stabilisation in the September reading.
Turning to fiscal policies, the September staff projections had foreseen a slight tightening of the fiscal stance in 2025 and a slight loosening in 2026. National budgetary plans for 2026 had recently been submitted by most euro area countries. A comprehensive assessment by Eurosystem staff would be presented in the December projections.
The economy should benefit from consumers spending more as real incomes rose. Households continued to save an unusually high share of their incomes: in the second quarter the saving rate had stood at 15.5%, well above the average of 13.0% recorded prior to the pandemic. Over recent years, this increase had been driven in particular by rising incomes, the incentive to restore wealth in real terms after the erosion during the high-inflation period, and higher interest rates. Over time, the recovery in the financial position of households, lower interest rates and less uncertainty were expected to give households a greater margin to reduce savings and to increase spending further. Investment should be underpinned by substantial government expenditure on infrastructure and defence, as well as the ECB’s past interest rate cuts.
By contrast, the global environment was likely to remain a drag. Euro area goods exports had reversed the frontloading recorded in the first quarter, contracting by 3.1% in three-month-on-three-month terms in August. The PMI for new export orders in manufacturing continued to signal contraction, at 49.0 in October compared with 48.7 in September, pointing to further declines. The full impact of higher tariffs on euro area exports and manufacturing investment would only become visible over time. The latest surveys pointed to a medium-term growth outlook that was broadly in line with the September staff projections.
Market rates had remained broadly unchanged since the Governing Council’s previous monetary policy meeting. The ECB’s past interest rate cuts had continued to reduce bank lending rates for firms, which had averaged 3.5% in August. Meanwhile, the cost for firms of issuing market-based debt had remained constant in August (also at 3.5%), as the longer-term yields on which such debt was priced had been relatively stable. Similarly, the average interest rate on new mortgages had barely changed since the start of the year and had stood at 3.3% in August.
Growth in broad money – as measured by M3 – had slowed to 2.8% in September from 2.9% in August, 3.3% in July and an average of 3.8% over the first half of the year. The annual growth rate of bank lending to firms had edged down to 2.9% in September from 3.0% in August. Corporate bond issuance had also slowed to 3.3% on a yearly basis, from 3.5%. According to the latest bank lending survey for the euro area, credit standards for business loans had tightened moderately in the third quarter, as banks became more concerned about the risks faced by their customers. Firms’ demand for credit had picked up slightly. The latest Survey on the Access to Finance of Enterprises was broadly consistent with the bank lending survey: firms had reported little change in bank loan availability or financing needs, and they had reported a small net increase in interest rates charged on bank loans as well as a slight net tightening in other loan conditions. In relation to household credit, growth in mortgage lending had ticked up to 2.6% in September, from 2.5% in August, on the back of a further increase in demand and unchanged credit standards in the third quarter.
Monetary policy considerations and policy options
Based on this assessment, Mr Lane proposed that the Governing Council keep the three key ECB interest rates unchanged. The data flow since the September meeting had been broadly in line with the September baseline projections and there had been no decisive shift in the risk distribution. Against this backdrop, there continued to be high option value in waiting for additional data. The comprehensive assessment in December would enable a richer analysis of the appropriate monetary policy stance. In addition to the evolution of the baseline inflation outlook, shifts in the risk distribution would also matter for the Governing Council’s rate decisions: an increase in the likelihood or intensity of downside risk factors would strengthen the case that a slightly lower policy rate might better protect the medium-term inflation target; alternatively, an increase in the likelihood or intensity of upside risk factors would point in the direction of maintaining the current policy rate in the near term.
2. Governing Council’s discussion and monetary policy decisions
Economic, monetary and financial analyses
Regarding the economic analysis, members broadly agreed with the assessment provided by Mr Lane in his introduction. In relation to the external economic environment, the incoming data since the previous monetary policy meeting in September had been broadly in line with the baseline considered at that meeting, albeit with some slightly stronger than expected recent outcomes, especially in the United States. Global trade and economic activity thus continued to be more resilient than had been anticipated earlier in the year, supporting the view that tariffs and lingering trade uncertainty had so far had a smaller dampening effect than feared. In this context, it was noted that the International Monetary Fund had recently raised its forecast for global economic growth. At the same time, this resilience and recent dynamics should not mask the fact that growth in global economic activity was still likely to be noticeably lower in 2025 than in 2024 when fourth-quarter-on-fourth-quarter changes were considered, and that only some of this slowdown was expected to be reversed in the course of 2026. Looking at intra-year developments in 2025, the frontloading that had occurred in the first half of the year, particularly in trade, was being partly reversed in the second half. This would probably result in a decline in global growth rates over the course of 2025, which would have ramifications for euro area trade and economic activity.
The resilience of global economic activity was primarily supported by robust growth in services and, to a lesser extent, by a modest recovery in manufacturing. This suggested that the global economy was adjusting, to some degree, to the prevailing challenges, in particular ongoing trade tensions and lingering geopolitical uncertainties, even if the differential in terms of performance between services and manufacturing was expected to persist. Lower prices for both oil and gas compared with earlier in the year were also providing support for the global economy and should, over time, help the euro area’s terms of trade and exports.
There was some discussion of economic developments in China and their implications for the euro area. It was argued that China still relied on an export-driven growth model, with falling export prices and a weaker renminbi supporting its competitiveness. Most noticeably, export volumes from China to the euro area had increased by more than 10% over the past six months and unit prices had also declined. While some of this could be accounted for by the significant depreciation of the renminbi, there had also been some redirecting of Chinese exports away from the United States, particularly towards ASEAN countries, but towards the euro area as well. Despite the efforts of the Chinese authorities, it was pointed out that China’s rebalancing towards domestic demand remained limited. In this context, concerns were expressed about the country’s real estate market, whose adjustment was not yet over, and also about the level of private debt, especially since much of it was the debt of state-owned enterprises and thereby quasi-public debt.
The US economy appeared to be more resilient than had previously been expected, with Consensus Economics growth forecasts for 2025 and 2026 returning to their levels prior to the first tariff announcements in April. However, concerns were raised over financial stability risks in the United States and the US fiscal position. It was suggested that these factors could prompt a further depreciation of the US dollar against the euro. However, it was also noted that the dollar had been broadly stable over the past four months and that risk reversals suggested that risks to the level of the euro exchange rate were more balanced than at the time of the previous meeting.
A recurring theme throughout the discussion was the persistent uncertainty in the external environment. While the US-China trade negotiations had shown some progress, the risks of broader trade tensions and supply chain disruptions, including from escalating tariffs, export restrictions on critical raw materials and geopolitical tensions, were still seen to be significant. However, it was also pointed out that the Bloomberg Economics Global Trade Policy Uncertainty Index was back to its January 2025 level. Still, recent disputes concerning critical inputs into production processes could lead to supply chain disruptions. Regarding rare earths, it was argued that they were a good example of a Leontief-type factor of production, whereby output could be limited by the most scarce input. This could be of particular relevance and concern to Europe’s automotive industry.
With regard to economic activity in the euro area, members largely concurred with the assessment presented by Mr Lane in his introduction. The incoming data since the previous meeting had largely validated the baseline scenario in the September projections in terms of numbers and narrative. While there were mixed signals – some positive and some negative – there had been little to materially alter the assessment of the economic outlook. The economy was generally seen as showing signs of being more resilient than had previously been expected, even though it was still growing modestly and currently operating below its potential.
The economy had grown by 0.2% in the third quarter of the year, according to the preliminary flash estimate published by Eurostat on the second day of the meeting. This was slightly higher than had been expected and had been anticipated to some extent during the discussion on macroeconomic conditions owing to positive surprises reported for a number of larger euro area economies. There had also been some positive surprises in recent survey data. Notably, recent PMI surveys had shown broad-based improvement, suggesting an uptick in growth momentum. The composite PMI had climbed to 52.2 in October, up by 2.1 points since May, driven by services activity. The latest improvement spanned most euro area economies including the largest one, for which the composite PMI had reached a level of 53.8, its highest since spring 2023. There had also been a recent pick-up in housing investment and some firmer signs of fiscal support, particularly for defence and infrastructure spending in the largest euro area economy.
On the negative side, it was argued that some of the earlier optimism regarding the manufacturing sector had not been confirmed by the August industrial production release, which had shown a decline in capital and durable consumer goods production. This meant that industrial production had in August fallen to its lowest level since January 2025, and it was still about 4% below its June 2023 level. More broadly, it was noted that the euro area economy had persistently fallen short of projections over the past few years. This was illustrated by the cumulative two-year ahead deviations between realised real GDP, private consumption and business investment at the end of the second quarter of 2025 and the corresponding staff projections conducted two years earlier. These deviations were particularly large when considering that interest rates had also fallen faster than had been assumed in those projections.
A general pattern that had been observed recently was that domestic demand was surprising on the upside but developments in the external sector had been worse than expected. Against this backdrop, the services sector had continued to grow, boosted by strong tourism and, especially, by a pick-up in digital services. According to surveys, the pick-up reflected the fact that many firms had stepped up efforts to modernise their IT infrastructures and integrate AI into their operations. Meanwhile, manufacturing activity had remained more subdued and was being held back by higher tariffs, still-heightened uncertainty and a stronger euro, all of which created particular challenges for exporters. In particular, heavy industry and the pharmaceutical sectors in some parts of the euro area were reported to be suffering significantly. It was also observed that Europe was losing competitiveness against China, and while some of this was related to the exchange rate, it was also part of a longer ongoing trend.
The divergence of domestic and external demand was likely to persist in the near term, as the global environment would probably remain a drag owing to challenges from global trade frictions and geopolitical tensions. Goods exports had declined from March to August, reversing the earlier frontloading of international trade ahead of recent tariff increases. New export orders in manufacturing pointed to further declines. Furthermore, although some effects coming from higher tariffs were already visible, particularly with regard to exchange rates (where a fast reaction would usually be expected), the full impact on euro area exports and manufacturing investment, in terms of both volumes and prices, would only become visible over time. The evolution of net trade was therefore likely to remain challenging. At the same time, the euro area economy had a mix of exports. These included services, which were not directly affected by tariffs. For example, there were some very good European companies operating in the AI and information technology sectors, which might already be benefiting from the surge in global activity and international demand in those areas. Euro area exports also included some distinct items, such as Airbus aircraft, which gave Europe a good position in that particular sector. Still, the euro area’s capacity to grow in the coming years was likely to stem primarily from sustained domestic demand.
In particular, the economy was expected to benefit from consumers spending more as real incomes rose. However, aggregate consumption growth had so far remained relatively modest. A key factor in this was the evolution of household savings. Households had continued to save an unusually large proportion of their incomes and the household saving rate was significantly higher than pre-pandemic levels. Despite previous expectations, the saving rate had not yet declined. A number of possible explanations were put forward for this. These included a desire to restore wealth in real terms after its erosion during the high-inflation period, previously higher interest rates, expectations of higher taxes and lower welfare spending to finance additional expenditure on defence, the impact of global uncertainties on consumer confidence and cooling job markets in some countries. While persistently high saving rates were an impediment to stronger consumption, they also gave households greater margin to increase spending further if consumer confidence continued to pick up gradually, as suggested by recent survey data, or other factors behind high saving rates were to fade. Given ongoing labour income growth, it was therefore argued that the conditions were in place for sustained growth in household consumption. However, softening labour demand and slowing wage growth posed some headwinds to the consumption outlook.
While business investment had been relatively weak in recent quarters, an initial reading of the third quarter growth numbers seemed to suggest stronger investment. Looking ahead, investment was likely to be underpinned by past interest rate cuts and substantial government expenditure on infrastructure and defence. It would probably also be supported by digital investment, as companies were investing in new technologies, such as AI. These were also likely to yield some wider macroeconomic and productivity benefits that had the potential to act as a significant positive supply shock in the future, even if this remained very uncertain. In this context, a distinction was made between investment in tangible assets and investment in intangible assets. The recent growth rate of investment in intangibles had been noteworthy, while investment in tangibles had declined over the past two years. However, investment in intangibles still only accounted for a relatively small share of overall business investment and lagged behind equivalent investment in the United States, in terms of both its level and its growth rate. Part of this could be attributed to the greater reliance on bank financing in the euro area and the greater difficulty in securing bank funding for intangibles, which typically had a higher depreciation rate than tangibles and an unclear re-sale value. Therefore, European firms often had to save and use their own capital to be able to invest in intangibles. However, digital investment in Europe was also hampered by inadequate digital infrastructures in many countries, which governments needed to address.
Rising investment in housing, supported by looser financial conditions, was seen to be another factor that should further underpin the recovery. At the same time, while aggregate euro area house price increases remained moderate, they concealed significant and potentially worrisome increases in some countries over the last year. This gave rise to concerns regarding the risk of significant corrections in some local housing markets.
The labour market continued to be resilient. The unemployment rate, at 6.3% in September, remained close to its historical low, even though demand for labour had cooled. At the same time, there had been a decline in labour hoarding and an improvement in productivity. Still, given the persistent dynamics in the labour market, the softening of labour demand was considered potentially worrying and warranted close monitoring to ensure that it did not become entrenched. Developments in AI could also have implications for the labour market and it was noted that some firms had started to announce reductions in headcount in anticipation of AI-driven productivity gains.
Regarding the fiscal outlook, more concrete information on governments’ plans for next year was starting to come in and the December Eurosystem staff projections would have the benefit of national central bank expertise. Given that defence expenditure had to rise from 2% of GDP to 3.5% under the new NATO commitments, it was suggested that, over time, the fiscal stance could be more expansionary than currently reflected in the declining cyclically adjusted primary deficit. In addition, fiscal multipliers might be higher if a greater share of defence spending were directed towards European suppliers. It was argued that another upside risk to growth stemming from fiscal policy was related to the conservative assumptions underlying the baseline fiscal policy outlook for the euro area’s largest economy, as its government might frontload public expenditure more than anticipated in the projections. On the other hand, with the Next Generation EU (NGEU) programme drawing to a close, unspent amounts of NGEU funding might lead to a more contractionary fiscal stance than currently expected. More generally, some concerns were expressed regarding the potential adequacy of fiscal policy in addressing structural weaknesses.
In this context, members stressed that fiscal and structural policies should boost productivity, competitiveness and resilience. It was essential to implement the European Commission’s competitiveness roadmap swiftly. Governments should prioritise growth-enhancing structural reforms and strategic investment, while ensuring sustainable public finances. It was also vital to foster further capital market integration by completing the savings and investments union and the banking union to an ambitious timetable, and to rapidly adopt the regulation on the establishment of a digital euro. Given the urgent need to strengthen the euro area and its economy in the present geopolitical environment, the reaffirmation of this ambition at the Euro Summit in the week preceding the Governing Council meeting was welcome.
Against this background, members assessed that the EU-US trade deal reached over the summer, the recently announced ceasefire in the Middle East and the announcement of progress in the US-China trade negotiations on the second day of the Governing Council meeting had mitigated some of the downside risks to economic growth. At the same time, the still volatile global trade environment could disrupt supply chains, further dampen exports, and weigh on consumption and investment. A deterioration in financial market sentiment could lead to tighter financing conditions, greater risk aversion and weaker growth. Geopolitical tensions, in particular Russia’s unjustified war against Ukraine, remained a major source of uncertainty. By contrast, higher than expected defence and infrastructure spending, together with productivity-enhancing reforms, would add to growth. An improvement in business confidence could stimulate private investment. Sentiment could also be lifted and activity spurred if the remaining geopolitical tensions diminished, or if the remaining trade disputes were resolved faster than expected.
With regard to price developments, members largely concurred with the assessment presented by Mr Lane in his introduction. Inflation remained close to the 2% medium-term target. Headline inflation had increased to 2.2% in September, from 2.0% in August. This was mainly because energy prices had fallen by less than before. Still, it had represented a small upward surprise. Nonetheless, in reviewing the incoming data since the previous meeting, the overall inflation outlook was assessed as continuing to be broadly consistent with the September baseline staff projections, with two-sided risks remaining. There was some discussion about the extent to which weak domestic demand was behind the projected decline in inflation in 2026. However, it was highlighted that external factors, such as exchange rate and energy price developments, as well as trade policies, were the main drivers. It was also observed that the stronger than expected pick-up in property prices, while not captured by the inflation measures provided by Eurostat, had put pressure on inflation measures including owner-occupied housing. In particular, using the net acquisition approach, HICP inflation including owner-occupied housing would have been 0.1 and 0.2 percentage points higher in the first and second quarters of 2025 respectively.
Energy price inflation remained in negative territory but had increased from -2.0% in August to -0.4% in September, which could largely be attributed to base effects. Euro area energy price trends remained sensitive to external shocks, including those emanating from ongoing trade tensions, the uncertain global geopolitical landscape and supply constraints.
There was considerable discussion of food price inflation, which had stood at 3.0% in September, down from 3.2% in August. This discussion stemmed not only from the somewhat elevated rate of food inflation over the past two years, but also from the importance of food in households’ consumption baskets and the resulting salience of food prices for their inflation perceptions and expectations. Some concerns were expressed about the persistently high rate of food price inflation, indications of a pick-up in momentum, and the possibly increasing impact of the climate and nature crisis. At the same time, it was noted that there was a fairly reliable connection between global food prices and food inflation. The former had declined noticeably from the levels seen at the beginning of 2025, despite remaining relatively high. This gave some support to the expectation that declining global food commodity prices would feed through into lower food price inflation, although it was cautioned that this could take time to materialise fully.
Core inflation had risen to 2.4% in September, from 2.3% in August, driven by a marginal increase in services inflation. Non-energy industrial goods inflation had remained at a fairly modest rate of 0.8% in September for the third consecutive month. Still, it was noted that the latest outturn was higher than had previously been expected and there were signs of increasing momentum in some countries. Looking ahead, both upside and downside factors for goods inflation were identified. The appreciation of the euro, together with lower input prices and trade diversion from China, were likely to exert downward pressure. At the same time, recent data had appeared to defuse these concerns. Moreover, it was argued that the largest share of imports from China constituted intermediate rather than consumption goods, with the pass-through to consumer price inflation being uncertain. In the other direction, there could be potential upward pressures from supply chain disruptions, including from possible restrictions on critical raw materials such as rare earths.
Services inflation had ticked up to 3.2% in September, from 3.1% in August, showing some persistence recently. It was noted that wages played a significant role in services inflation and that wage growth had also shown some persistence in the first half of 2025. There was therefore a risk that services inflation might not come down as quickly as expected. However, although services inflation might appear sticky, the current flatlining had been projected and services inflation had already dropped quite substantially from 2024 levels, with a further step down likely in early 2026. Furthermore, the forward-looking ECB wage tracker was signalling a sharp decline in wage growth in the second half of 2025 and productivity was expected to improve.
Looking further into wage developments, the annual rate of growth in compensation per employee had exhibited more persistence in the second quarter of 2025 than had been expected. At the same time, year-on-year growth in negotiated wages had decelerated notably in recent months, and more forward-looking indicators, such as the ECB’s wage tracker and surveys on wage expectations, suggested a further moderation in wage growth over the remainder of 2025 and into the first half of 2026.
Firms’ profits (as measured by gross operating surplus) and profits per unit of output had lately started to grow again. This was considered a good development because it would support companies in financing their investment plans. Moreover, it was argued that the recovery in profits suggested that demand conditions were strong enough to allow firms to rebuild their margins, as also reflected in a stronger rise in selling prices according to both the relevant PMI subcomponent and the Survey on the Access to Finance of Enterprises.
Turning to inflation expectations, most measures of longer-term inflation expectations remained at around 2%. For shorter-term horizons, expectations from professional macroeconomic forecasters and market-based indicators of inflation compensation still pointed to inflation declining and remaining somewhat below target in the near term, but they were in line with the September staff projections. Firms’ inflation expectations had remained constant, with the balance of risks continuing to be tilted to the upside. Indeed, inflation expectations of both households and firms stood above 2% and, when looking at the mean of consumer expectations, which better captured the tail of the distribution, there had been a trend increase for both the three-year and five-year horizons. At the same time, it was argued that the median of consumer inflation expectations could be more informative and that, more generally, it was more meaningful to look at the rate of change in households’ and firms’ inflation expectations rather than their actual level.
Members also discussed the role of food prices in shaping households’ perceptions of past inflation and their expectations for future inflation. Food inflation was referred to as “loud” inflation since it had a greater effect on the less wealthy, was very salient for households and often became a politically pertinent issue. An issue deserving further consideration was the relative importance of food price inflation compared with the level of food prices. While central bankers were generally inflation targeters, who tended to consider price shocks as bygones, it was noted that the psychology of households was more akin to that of price level targeters, who were attentive to the level of current prices relative to recent history. This had some important implications. First, even though cumulative wage increases since the start of 2022 had more or less caught up with the price level increase, consumers might not perceive this. Second, it also mattered for how persistently past food price increases would continue to affect households’ inflation perceptions and expectations. Finally, if the level of food prices had a significant effect on consumers’ inflation expectations, it would be more complicated to gauge the outlook given the difficulty in predicting international agricultural prices. At the same time, household perceptions of high inflation due to high food price inflation mainly mattered for inflation dynamics if they translated into higher wage claims, which did not seem to be the case so far.
Against this background, members assessed that the outlook for inflation continued to be more uncertain than usual on account of the still volatile global trade policy environment. A stronger euro could bring inflation down further than expected. Moreover, inflation could turn out to be lower if higher tariffs led to lower demand for euro area exports and induced countries with overcapacity to further increase their exports to the euro area. An increase in volatility and risk aversion in financial markets could weigh on domestic demand and thereby also lower inflation. By contrast, inflation could turn out to be higher if a fragmentation of global supply chains pushed up import prices, curtailed the supply of critical raw materials and added to capacity constraints in the domestic economy. A boost in defence and infrastructure spending could also raise inflation over the medium term. Extreme weather events, and the unfolding climate and nature crisis more broadly, could drive up food prices by more than expected.
Members also discussed strategic perspectives on how to weigh hard data against projections that were subject to uncertainties. In the current context there were, on one side, uncertainties related to the projected increases in consumption, investment and construction, which were yet to be fully seen in the hard data. On the other side, there were uncertainties relating to projections of declining wage growth and falling services and food price inflation. In this regard, a balance always needed to be struck between relying on projections and waiting for hard data. Finding this balance was not easy, but it was observed that the staff projections for both activity and inflation had been fairly accurate in recent years.
Turning to the monetary and financial analysis, members largely concurred with the assessment provided by Ms Schnabel and Mr Lane in their introductions. Market rates had remained broadly unchanged across the maturity spectrum since the Governing Council’s previous monetary policy meeting. Uncertainty around the future policy path, as reflected in market pricing, had diminished. This could be attributed to the resilience of the economy and stabilisation of inflation in spite of geopolitical shocks. Market pricing attached zero probability to a rate cut at the October monetary policy meeting and assigned only about a 40% chance to one additional cut by the end of 2026. The median expectation of survey participants now implied that the next interest rate move would be a hike rather than a cut.
Long-term euro area government bond yields had remained broadly unchanged since the previous meeting. However, they had trended upwards over the course of 2025 despite policy easing over this period. This could be attributed to global uncertainty and fiscal policy. Large deficits and rising sovereign debt posed a risk over the medium term. It was also suggested that changing sentiment could mean that financial flows might start to find ways back to the United States again, including via stablecoins (which could be one mechanism through which retail financial flows might be directed into the US economy). In this context, it was also argued that there could be tail risks from the very long end of the yield curve, even if concerns for the baseline stemming from the recent rise in these yields were limited. In particular, this part of the market was less liquid and more sensitive to any changes in interest rate expectations, and sharp movements there could lead to a repricing of the whole curve. More broadly, with US public debt increasingly funded by hedge funds, including via repo markets, there was a risk of procyclicality, which could pose threats to the liquidity and orderly functioning of government debt markets and associated repo markets during periods of stress. At the same time, it was observed that the basis trade did not play the same role in the euro area as it did in the United States. Still, the ECB was monitoring the role of hedge funds in the government bond market very carefully.
Risks also emanated from wider financial markets, as discussed extensively in the IMF’s latest Global Financial Stability Report, though these financial stability risks were primarily related to possible spillovers from the United States rather than reflecting a self-generated risk emerging from the euro area. US financial markets continued to rally on the back of the more resilient US and global economy but exhibited signs of exuberance, with asset valuations appearing stretched in certain sectors. US equity valuations remained particularly elevated and prone to a correction. The Buffett Indicator – a measure of the total market capitalisation of the US stock market relative to GDP – stood at around 220%, compared with around 140% at its earlier peak in 2000 and 60% in the aftermath of the global financial crisis. Price/earnings ratios were very high in certain US sectors and had more than doubled over the past couple of years for the “Magnificent Seven” stocks. While high valuations, also when compared with the dotcom boom, could at least be partly backed by strong expected earnings and large potential productivity gains from AI, forward price/earnings ratios of many technology companies stood at between 35 and 40. This could be seen as unsustainable unless the potential growth rate of the US economy increased or AI reduced employment and wage bills. In addition, even if large investments in AI were fully justified from a macroeconomic perspective, this did not necessarily mean that investors would be able to extract sufficient rents and receive the returns that they hoped for, given the high competition among several players in the field. This stood in contrast to past developments in the technology sector, where near-monopolies had quickly emerged in different domains. The material presence of the retail sector in the market was also seen as concerning given the propensity of retail investors to look at monthly net asset valuations and pour more money into the market as valuations increased, pushing stock prices up further. Overall, a significant market correction in the United States could weigh heavily on US consumption and growth, with probable significant global spillovers, including to the euro area.
Growing financial stability risks stemming from US private markets were another concern. Private equity firms were starting to encounter difficulties in disposing of their assets at the prices marked in their portfolios, which signalled overvaluation and potential liquidity problems in the future. There were also important interconnections between private equity firms and insurance companies, and even with banks. Increasing stress had been observed in private loan markets, and US banks were highly exposed to private credit relative to both their total assets and capital, with the opaqueness of these markets meaning that true risks could be understated. In addition, private credit was likely to be financing a significant share of the investment in AI, meaning that there could be spillovers from any reassessment of its economic potential. Private credit had also been growing significantly in the euro area recently, even if overall volumes remained relatively small. At the same time, the firms providing private credit were the same in the United States and the euro area, so any pull-back in the euro area was still ultimately likely to originate as a spillover from a US retrenchment.
Risks from liquidity mismatch and leverage in the wider non-bank financial intermediation (NBFI) sector and its connections with the banking system also persisted and were not fully understood. Concern was expressed that, while the sovereign-bank nexus of a decade ago may have been resolved, it might have been replaced by a sovereign-NBFI nexus. Cyber risks and high crypto-asset prices posed further threats to the global financial system. While a significant correction in crypto-assets would not necessarily affect the banking sector directly, it could affect many of their customers. Compressed corporate bond spreads were also indicative of the very high risk appetite and liquidity in financial markets.
Against this overall backdrop, the current resilience of financial markets could prove fragile. There was a tail risk of a significant correction in financial markets with the associated potential for financial instability, depending on where leverage might reside in the financial system. If there were a deterioration in financial market sentiment, spillovers from the United States could lead to tighter financing conditions and greater risk aversion in the euro area, which could have significant implications for the outlook by weighing on domestic demand, and thereby also lowering growth and inflation. Still, while it was suggested that financial stability risks had risen recently as a result of the emergence of new risks, it was also argued that some perspective was needed given that many risks, including from stretched valuations and high levels of debt, had been building up over a number of years and the situation was less concerning than it had been in April. At that time there had been liquidity problems in some sectors, as well as high volatility and sharp moves in some market prices, which had created the conditions for a potential confidence shock affecting aggregate demand and inflation in the euro area. However, these risks had not materialised, and while they could return and warranted close monitoring, they were not currently present. In addition, it was contended that the overall experience during that period suggested that the global financial system might be more resilient than previously thought, possibly because of all the prudential measures that had been taken both at the international level and in individual jurisdictions following the global financial crisis.
In this context, any financial deregulation or weakening of banking supervision in the United States might amplify risks to financial stability in the euro area, given that, historically, financial tensions originating in the United States had typically had significant spillover effects in Europe. At the same time, the solidity of the banking sector in the euro area, underpinned by strong capital levels and robust liquidity buffers, was a source of strength in the face of potential spillovers. Therefore, notwithstanding the legitimate need for Europe to become more competitive, it was important to safeguard this resilience and avoid a race to the bottom, while also developing macroprudential regulation further.
Turning to financing conditions, the transmission of past interest rate cuts had continued to reduce bank lending rates for firms, which had averaged 3.5% in August. Meanwhile, the cost of issuing market-based debt had remained at 3.5% in August, as the longer-term yields on which such debt was priced had been relatively stable. The annual growth rate of bank lending to firms had edged down to 2.9% in September, from 3.0% in August. At the same time, corporate bond issuance had slowed to 3.3% on a yearly basis. According to the latest bank lending survey for the euro area, firms’ demand for credit had picked up slightly in the third quarter. Meanwhile, credit standards for business loans had tightened moderately, as banks had become more concerned about the risks faced by their customers. However, it was pointed out that this tightening should not be seen as notable, given that 95% of banks had reported that corporate credit standards remained unchanged, and 97% expected them to remain unchanged over the next three months.
The average interest rate on new mortgages had barely changed since the start of the year and had stood at 3.3% in August. Growth in mortgage lending had ticked up to 2.6% in September, from 2.5% in August. It was now expanding at the fastest pace seen in two and a half years. Demand for mortgages had also increased further in the third quarter according to the bank lending survey, while credit standards for mortgage lending had been unchanged.
Monetary policy stance and policy considerations
Turning to the monetary policy stance, members assessed the data that had become available since the last monetary policy meeting in accordance with the three main elements that the Governing Council had communicated in 2023, and updated in July 2025, as shaping its reaction function, namely: (i) the implications of the incoming economic and financial data for the inflation outlook and the risks surrounding it; (ii) the dynamics of underlying inflation; and (iii) the strength of monetary policy transmission.
Starting with the inflation outlook, members welcomed the fact that headline inflation was currently close to the 2% medium-term target and judged that the incoming information was broadly in line with their previous assessment of the inflation outlook. The narrative from the September staff baseline projections had not changed materially, despite the significant level of uncertainty that the economy was facing. Viewed from the time of the current meeting, the December projections would probably paint a picture similar to that seen in the September projections. Overall, while inflation was likely to fall below 2% in 2026, it was then expected to return to around the target, partly on account of the effects of the start of the EU Emissions Trading System 2 in 2027. Inflation expectations remained well anchored, with most measures of longer-term inflation expectations continuing to stand at around 2%, which also supported the stabilisation of inflation around the target.
Against this background, most members viewed the risks surrounding the inflation outlook as two-sided and saw the distribution of risks around the baseline as relatively unchanged since the previous meeting. The outlook for inflation continued to be more uncertain than usual on account of the still volatile global trade policy environment, which could precipitate simultaneous demand and supply shocks. Uncertainty was also likely to persist in view of elevated geopolitical risks, many of which appeared unlikely to be resolved in a lasting manner. In this context, while the risks remained fairly balanced, they had the potential to escalate unexpectedly, with significant adverse consequences.
Some members viewed inflation risks as tilted to the downside over the medium term relative to the September staff projections. From this perspective, inflation could turn out to be lower if higher tariffs led to lower demand for euro area exports and induced countries with overcapacity to further increase their exports to the euro area. In this regard, it was argued that excess capacity in China and initial signs of lower export prices and trade rerouting towards Europe posed a significant downside risk to the medium-term inflation outlook, especially since empirical evidence suggested that trade price shocks were likely to play out gradually over a couple of years. In addition, it was argued that the risk of major, generalised supply chain disruptions could be quite low, given that the European Union had not retaliated in the trade dispute with the United States, while China and the United States had been making progress in their trade negotiations. At a minimum, more information was needed to judge whether there was a material risk of general supply chain disruptions. Moreover, it was contended that risks from some very specific supply disruptions, such as those relating to rare earths, were unlikely to be inflationary. In the case of rare earths, this was because they were a very small input in the overall cost structure, implying that it would be hard for any price shock to mechanically generate much of a direct effect on inflation. At the same time, they were close to being a non-substitutable (Leontief-type) input, meaning that if they were not available, production and labour might have to be scaled back significantly, leading to a large drop in output and rise in uncertainty, which could exert downward pressure on overall inflation. Besides trade factors, an increase in volatility and risk aversion in financial markets, possibly prompted by a sharp correction in some asset prices, could weigh on domestic demand and thereby also lower inflation. A stronger euro could also bring inflation down further than expected, while the large excess supply of oil had the potential to weigh on energy prices. In the context of major threats to external demand that might not be sufficiently counterbalanced by domestic demand, a continuation of weaker than expected growth in the euro area – as had transpired over the past two years despite significant cuts in interest rates – could lead to a more prolonged undershooting of the inflation target. The effects of fiscal expansion on growth and inflation could also be more limited than expected if additional spending were to be delayed or if it led households to maintain a high saving rate in anticipation of potential future tax increases or cuts in welfare spending. In addition, without the expected upward effect of the EU Emissions Trading System 2 on projected inflation in 2027, a sustainable return of inflation to target after the expected undershoot in 2026 would be further delayed.
A few members viewed inflation risks as tilted to the upside over the medium term relative to the September staff projections and noted that external forecasts for medium-term inflation stood above those projections. For example, the median respondent in both the Survey of Monetary Analysts and the Survey of Professional Forecasters expected inflation to be 2.0% in 2027. Recent developments in inflation expectations of both households and firms also pointed to some upside risks. From this perspective, there had already been an upward shift in the inflation outlook since the September meeting, which had diminished the risk of a sustained and material undershooting of the inflation target. In particular, such an undershooting was not seen as consistent with the growing evidence of a cyclical recovery of the economy, with a closing output gap and significant support from fiscal policy. This was likely to result in the economy eventually hitting capacity constraints, which would probably start in specific sectors, such as defence and construction. It was also argued that the distribution of risks around the inflation outlook had shifted to the upside as risks to the exchange rate had become more balanced, while the risk of supply chain disruptions had increased. In particular, it was suggested that export controls that China had placed on some key materials and products, as well as risks relating to rare earths and new retaliatory measures for steel, posed notable upside risks to inflation. More generally, upward price pressures could be reinforced if a fragmentation of global supply chains pushed up import prices and added to capacity constraints in the domestic economy, while it was contended that there was currently little evidence of downward pressures on consumer price inflation from trade diversion by China. Tariffs could also add to inflationary pressures in the United States, and the euro area was unlikely to be immune from inflationary spillovers in such a scenario, especially since a very large proportion of global trade was denominated in US dollars. Extreme weather events, and the unfolding climate and nature crisis more broadly, could drive up food prices by more than expected. Finally, there could be a stronger boost to inflation from fiscal policy than currently expected, and inflation could also be higher if defence and infrastructure spending were greater than anticipated in the baseline projections. Indeed, it was contended that from a structural perspective, a more fragmented world with high fiscal spending was likely to exert inflationary rather than disinflationary pressures, making it unlikely that the economy would return to the environment of structurally low inflation observed before the pandemic. This was also seen as consistent with the risk distribution of inflation expectations across households and firms.
Turning to underlying inflation, members concurred that the measures remained consistent with the 2% medium-term target. At the same time, core inflation had increased by 0.1 percentage points in September. HICP inflation excluding energy – which was seen as a particularly useful measure given that it included food inflation which remained rather high – had been unchanged at 2.5% for the fifth consecutive month. Domestic inflation had also picked up for the first time after recording a long, continuous and substantial decline since early 2023. Despite these developments, core inflation was still expected to decline over the projection horizon, supported by a further moderation in labour costs owing to rising productivity and an easing in wage growth. In this regard, it was observed that wage inflation had already declined sharply, with the developments in negotiated wages being seen as particularly important. Forward-looking indicators also pointed to slower wage growth over the remainder of the year and in the first half of 2026, and there could even be a risk that wage moderation might go too far. At the same time, the hard data showed still elevated wage inflation. Therefore, it was important to carefully monitor the situation to see whether the expected further decline in wage growth of over 1 percentage point materialised, especially in light of the recent upward surprise in the annual growth rate of compensation per employee and the expectations reported by participants in the Survey on the Access to Finance of Enterprises of higher wage growth in the period ahead.
Finally, the transmission of monetary policy continued to be smooth and effective. Past interest rate cuts and the associated looser financial conditions should continue to underpin investment, and thereby support the recovery. At the same time, it was noted that the ongoing shrinking of the Eurosystem balance sheet and the appreciation of the euro relative to earlier in the year added some restrictiveness to financial conditions. It was also observed that if financial risks were to manifest in the United States and lead to a large spillover to the euro area, financial conditions might move materially against current policy rates. However, while the materialisation of such a scenario could be relevant for the monetary policy stance, it was very hard to conclude that this called for pre-emptive action.
Monetary policy decisions and communication
Against this background, all members supported the proposal made by Mr Lane to keep the three key ECB interest rates unchanged. The Governing Council’s assessment of the inflation outlook was broadly unchanged and the incoming data since the September meeting had also broadly confirmed the baseline outlook for activity, with the economy continuing to grow despite the challenging global environment. The robust labour market, solid private sector balance sheets and past interest rate cuts remained important sources of resilience. This broadly unchanged outlook supported keeping monetary policy unchanged. The outlook remained uncertain, owing particularly to ongoing global trade disputes and geopolitical tensions, even though recent developments had mitigated some of the downside risks to growth. Such uncertainty could also justify keeping interest rates unchanged. Maintaining policy rates at their current levels would allow for more information to become available to assess the risk factors that the Governing Council had discussed. It was also argued that the current level of policy rates should be seen as sufficiently robust for managing shocks, in view of the two-sided inflation risks and taking into account a broad range of possible scenarios. Overall, there continued to be a high option value to waiting for more information. Given all of this, the Governing Council was currently in a good place from a monetary policy point of view, though this should not be seen as a fixed place.
With regard to communication, members reiterated that the Governing Council was determined to ensure that inflation would stabilise at its 2% target in the medium term. Future interest rate decisions would continue to be based on its assessment of the inflation outlook and the risks surrounding it, in light of the incoming economic and financial data, as well as the dynamics of underlying inflation and the strength of monetary policy transmission. The Governing Council would also continue to follow a data-dependent and meeting-by-meeting approach to determining the appropriate monetary policy stance without pre-committing to a particular rate path.
With the outlook for inflation more uncertain than usual and with the risk of large inflation and growth shocks in both directions, it was important for the Governing Council to maintain full optionality for future meetings and to be agile in order to react quickly to the materialisation of risks or large shocks if necessary. Communication should therefore remain non-committal about future interest rate decisions.
Looking ahead, members reflected on possible strategies for future monetary policy. By the time of the December meeting there would be further important information on how recent shocks were affecting the inflation and growth outlook, and a new set of staff projections would be available. These projections would cover 2028 for the first time, thereby providing a clearer picture of the outlook at that horizon, although it was also argued that the information content of the projections was lower for more distant horizons and monetary policy could have less influence at that horizon, which suggested placing more weight on the nearer-term outlook. At the same time, the Governing Council’s medium-term orientation meant that it was important to avoid an excessive focus on the very near-term outlook even though the Governing Council had a clearer view of the outlook over those shorter horizons. The December meeting would also allow the Governing Council to update its assessment of the distribution and intensity of risks. In this regard, there were open questions related to how monetary policy should factor in these risks, as well as the extent to which the Governing Council should respond to any shift in the distribution of risks, and not only to their manifestation.
The view was expressed that the rate-cutting cycle had come to an end, since the current favourable outlook was likely to be maintained unless risks materialised. Taking a steady hand approach could increase the chances of remaining in a good place. According to this view, from a strategic perspective, provided inflation expectations remained firmly anchored, the monetary policy stance should not be fine-tuned in response to moderate and temporary fluctuations of inflation around target but should only be adjusted if a significant deviation from target was expected over the medium term. It was also suggested that such an approach could leave a greater margin for monetary policy to respond decisively to future disinflationary shocks that might materialise, especially given the backdrop of rising financial stability risks. More specifically, while future projections could be affected by new assumptions on the introduction of ETS2, it was important to maintain focus on the fundamental drivers of underlying inflation. It was also mentioned that it was questionable whether the stance should be adjusted on the basis of highly uncertain changes to political decisions, unless they had a meaningful impact on inflation expectations, which was unlikely. In addition, given that financial market valuations were already stretched in some euro area market segments, it was argued that it was important that future monetary policy deliberations took into account that easier financial conditions could further fuel risk-taking in the financial system.
At the same time, the view was also expressed that it was important to remain entirely open-minded on the possible need for a further rate cut, and that such a move was likely to be warranted if there were an increase in the likelihood or intensity of downside risk factors, or if the projected undershooting of the inflation target became sustained. According to this view, the bar for policy action should not be seen as being any higher than normal. While the economy was not so weak that it definitely implied an undershooting of the target over the medium term, it remained uncertain whether the economy had enough momentum to deliver the target, and monetary policy still had a bearing on growth even though the euro area faced structural growth challenges. It was also highlighted that the Governing Council’s monetary policy strategy, which called for appropriately forceful or persistent monetary policy action in response to large, sustained deviations of inflation from the target, did not imply that anything apart from large, sustained deviations should be ignored or obviate the need for a cyclical response from monetary policy to deal with demand-side shocks on an ongoing basis.
Taking into account the foregoing discussion among the members, upon a proposal by the President, the Governing Council took the monetary policy decisions as set out in the monetary policy press release. The members of the Governing Council subsequently finalised the monetary policy statement, which the President and the Vice-President would, as usual, deliver at the press conference following the Governing Council meeting.
Monetary policy statement
Monetary policy statement for the press conference of 30 October 2025
Press release
Meeting of the ECB’s Governing Council, 29-30 October 2025
Members
- Ms Lagarde, President
- Mr de Guindos, Vice-President
- Mr Cipollone
- Mr Dolenc, Deputy Governor of Banka Slovenije
- Mr Elderson
- Mr Escrivá
- Mr Kazāks*
- Mr Kažimír
- Mr Kocher
- Mr Lane
- Mr Makhlouf
- Mr Müller
- Mr Nagel*
- Mr Panetta
- Mr Patsalides*
- Mr Pereira
- Mr Radev**
- Mr Rehn
- Mr Reinesch*
- Ms Schnabel
- Mr Scicluna
- Mr Šimkus*
- Mr Sleijpen
- Mr Stournaras
- Mr Villeroy de Galhau
- Mr Vujčić
- Mr Wunsch
* Members not holding a voting right in October 2025 under Article 10.2 of the ESCB Statute.
** As observer.
Other attendees
- Ms Senkovic, Secretary, Director General Secretariat
- Mr Rostagno, Secretary for monetary policy, Director General Monetary Policy
- Mr Kapadia, Head of Division, Directorate General Monetary Policy
Accompanying persons
- Ms Bénassy-Quéré
- Ms Brezigar
- Mr Debrun
- Mr Demarco
- Mr Gilbert
- Mr Horváth
- Mr Kaasik
- Mr Koukoularides
- Mr López
- Mr Lünnemann
- Mr Madouros
- Ms Mauderer
- Mr Meichenitsch
- Mr Nicoletti Altimari
- Ms Raposo
- Mr Rutkaste
- Mr Šiaudinis
- Mr Tavlas
- Mr Välimäki
- Mr Walch
Other ECB staff
- Mr Proissl, Director General Communications
- Ms Vansteenkiste, Counsellor to the President
- Ms Rahmouni, Director General Market Operations
- Mr Arce, Director General Economics
- Mr Sousa, Deputy Director General Economics
Release of the next monetary policy account foreseen on 22 January 2025.
Dollar: Internal Weakness Plus Improvement Among Competitors
- The USD index’s peak began with the dollar itself, but the pound helped it along.
- The RBA may raise rates, while Japan may intervene in the forex market.
As soon as the US dollar weakened, its competitors immediately stiffened their resolve. The pound rose due to the markets’ acceptance of Rachel Reeves’ draft budget, the yen rose following the government’s strongest verbal interventions, the Australian dollar rose amid speculation about a key rate hike by the Reserve Bank, and the euro rose on hopes for a resolution to the Ukrainian conflict. However, the foundation for the decline was laid by the dollar itself.
Dovish rhetoric from influential Fed officials, a series of disappointing economic data, and the Hassett factor triggered a sell-off of the dollar. New York Fed President John Williams, San Francisco Fed President Mary Daly, and their FOMC colleague Christopher Waller are inclined to cut the federal funds rate in December. In their view, the risks of a cooling labour market outweigh the risks of accelerating inflation.
Data support this view. ADP reports a decline in private sector employment, while another report on repeat applications for unemployment benefits has returned to a four-year high. Concerns about the fate of the labour market are forcing Americans to tighten their belts. As a result, the chances of the Fed cutting rates in December jumped to 85%, triggering a fall in the dollar.
The pound’s reaction to tax increases in Britain accelerated the decline. Rachel Reeves plans to increase budget revenues by targeting wealthy individuals, as well as expensive real estate and investments. The markets reacted calmly to this approach, and GBPUSD continued to strengthen. The OBR’s upward revision of its economic forecast from 1% to 1.5% may cause the Bank of England to question the need for a rate cut in December.
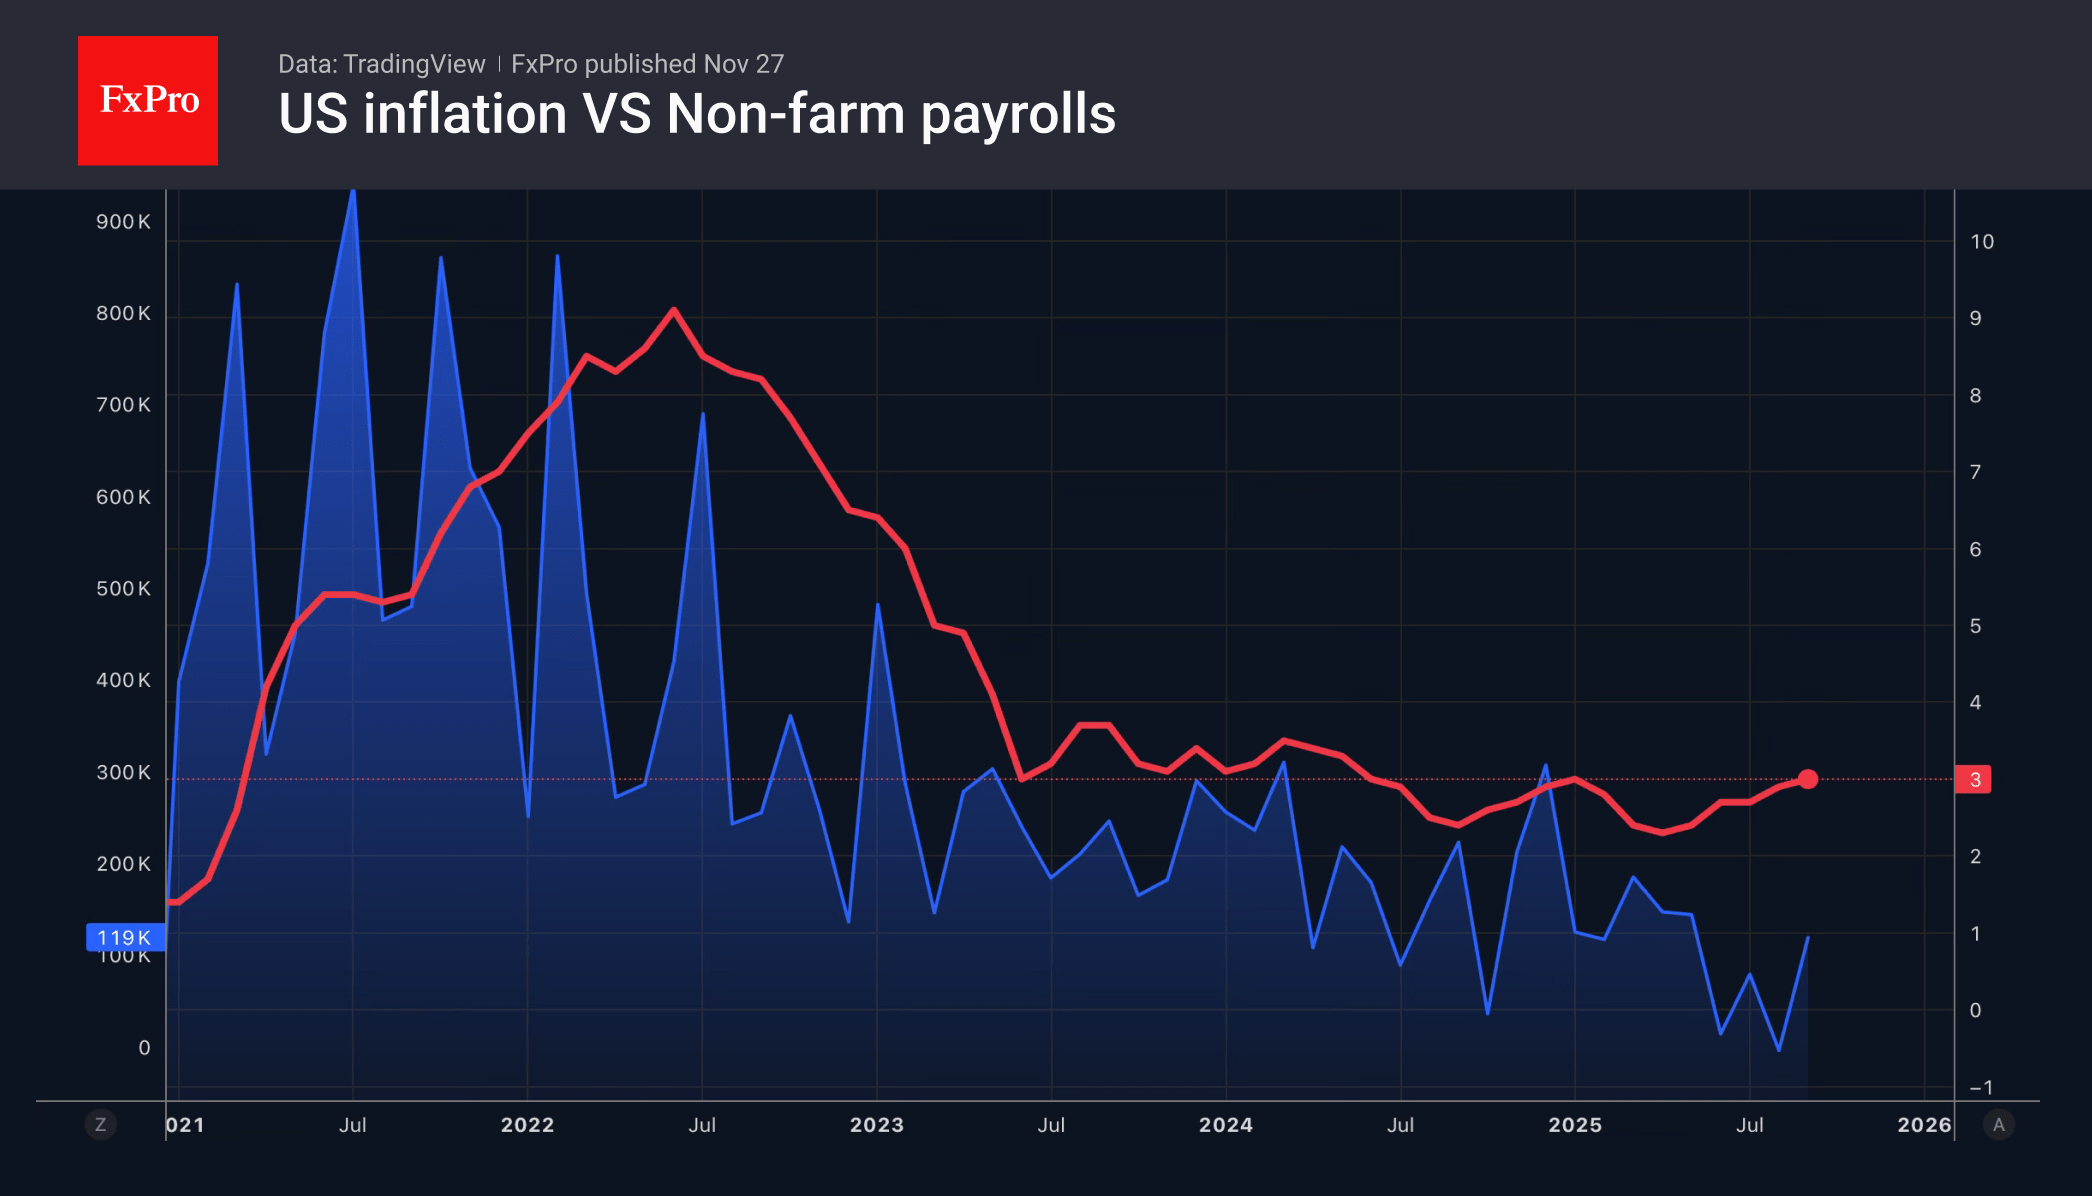
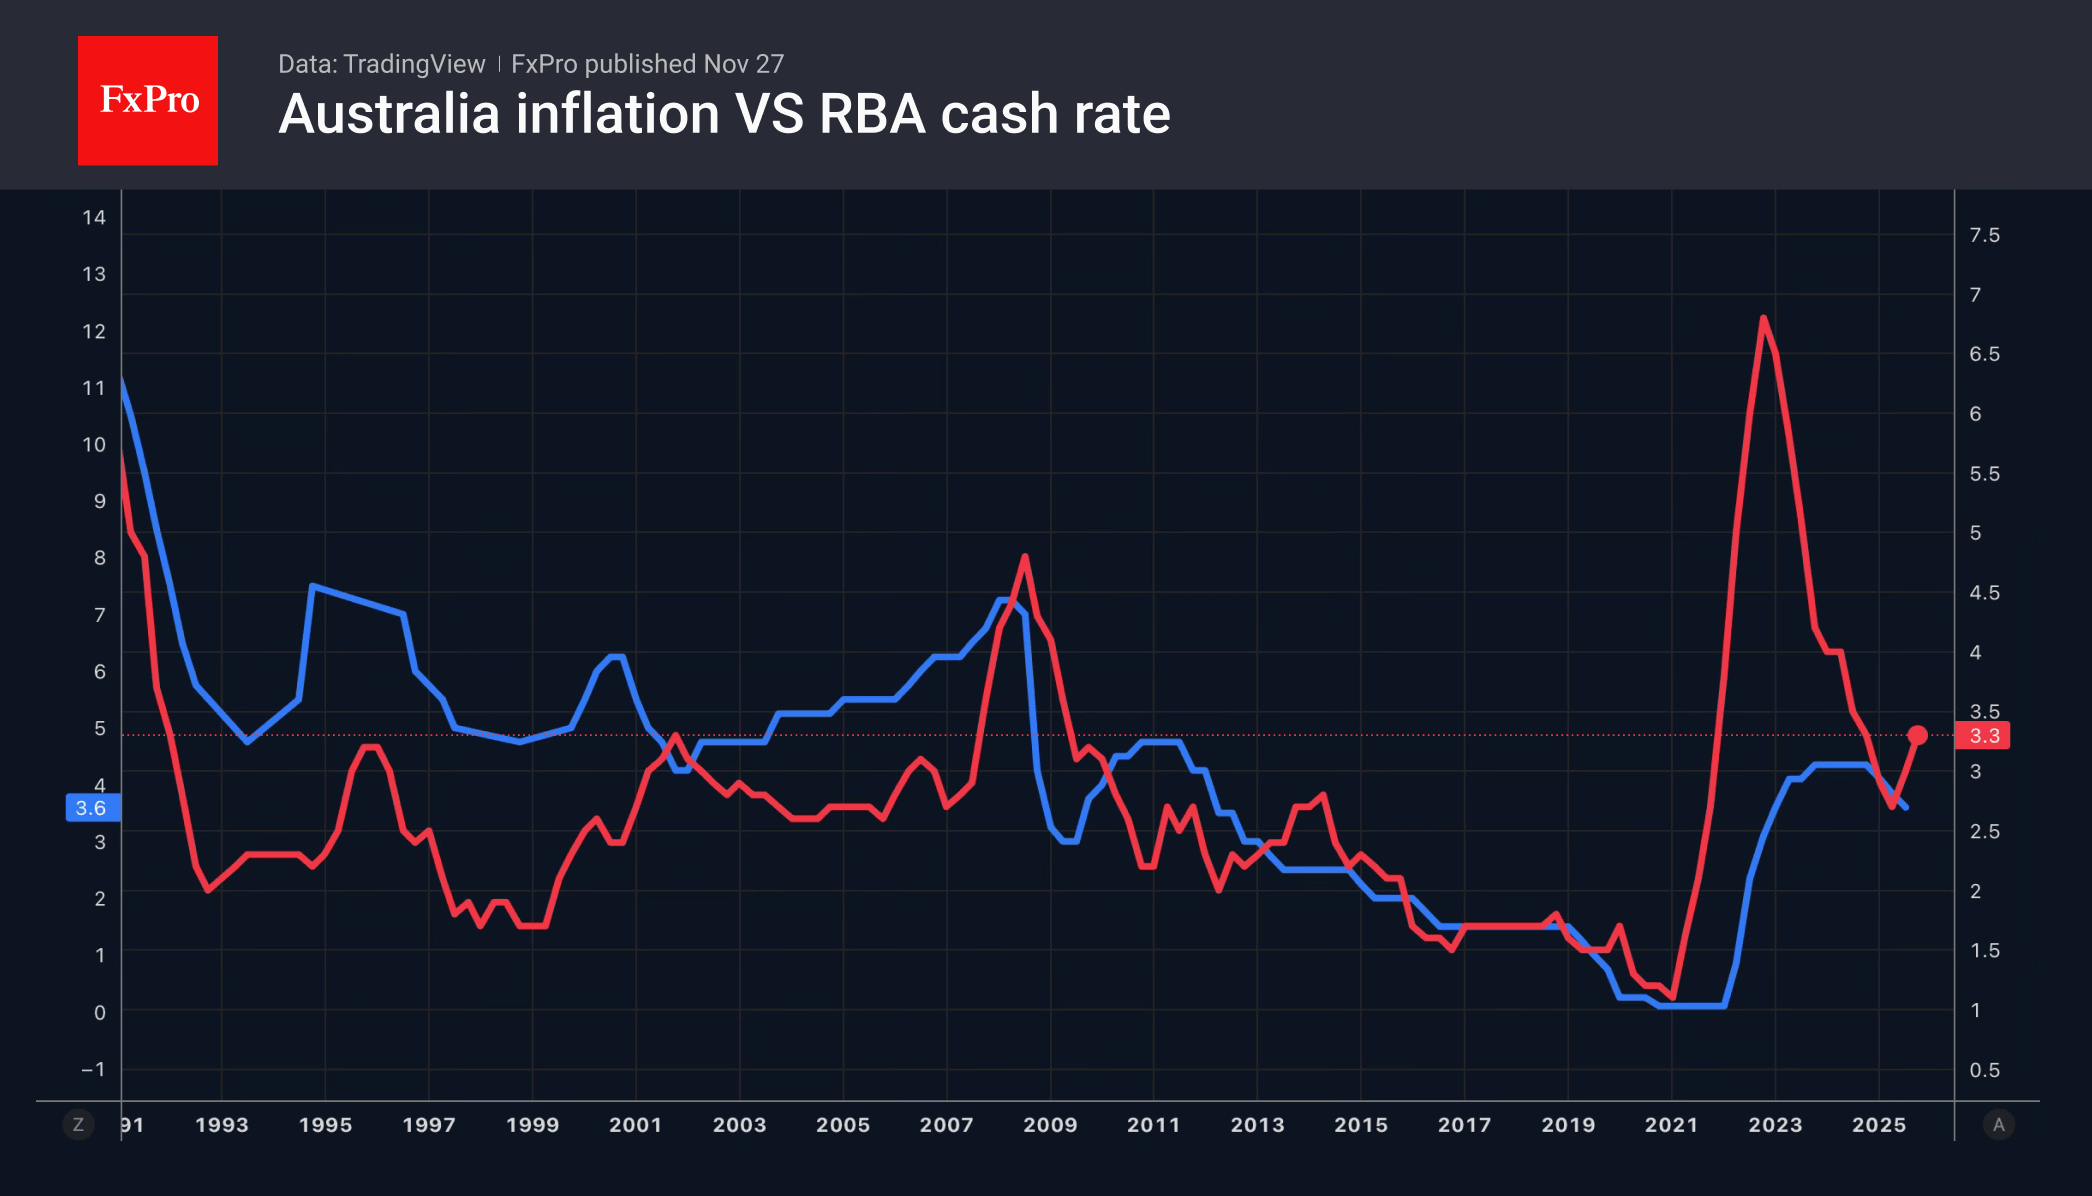
Down under in Australia, inflation accelerating to 3.3% in October may force the RBA to raise rates. The annual CPI growth rate exceeded not only experts’ forecasts, but also the upper limit of the Reserve Bank’s target range of 2-3%. As a result, some investment banks began to argue that the next step would be to tighten monetary policy. AUDUSD responded with growth.
Meanwhile, Finance Minister Satsuki Katayama stated that an agreement has been reached between the US and Japan regarding currency intervention, which allows the government to seriously consider intervening in the Forex market if the USDJPY rally persists.
Crypto Market Encouraged to Grow
Market Overview
The crypto market accelerated its growth, adding more than 3% over the past 24 hours to $3.12T and recovering to levels seen a week ago. Among the heavyweight coins, Bitcoin and BNB are driving the market’s growth, adding over 4%, while many altcoins seem to be waiting for confirmation that the market has turned around.
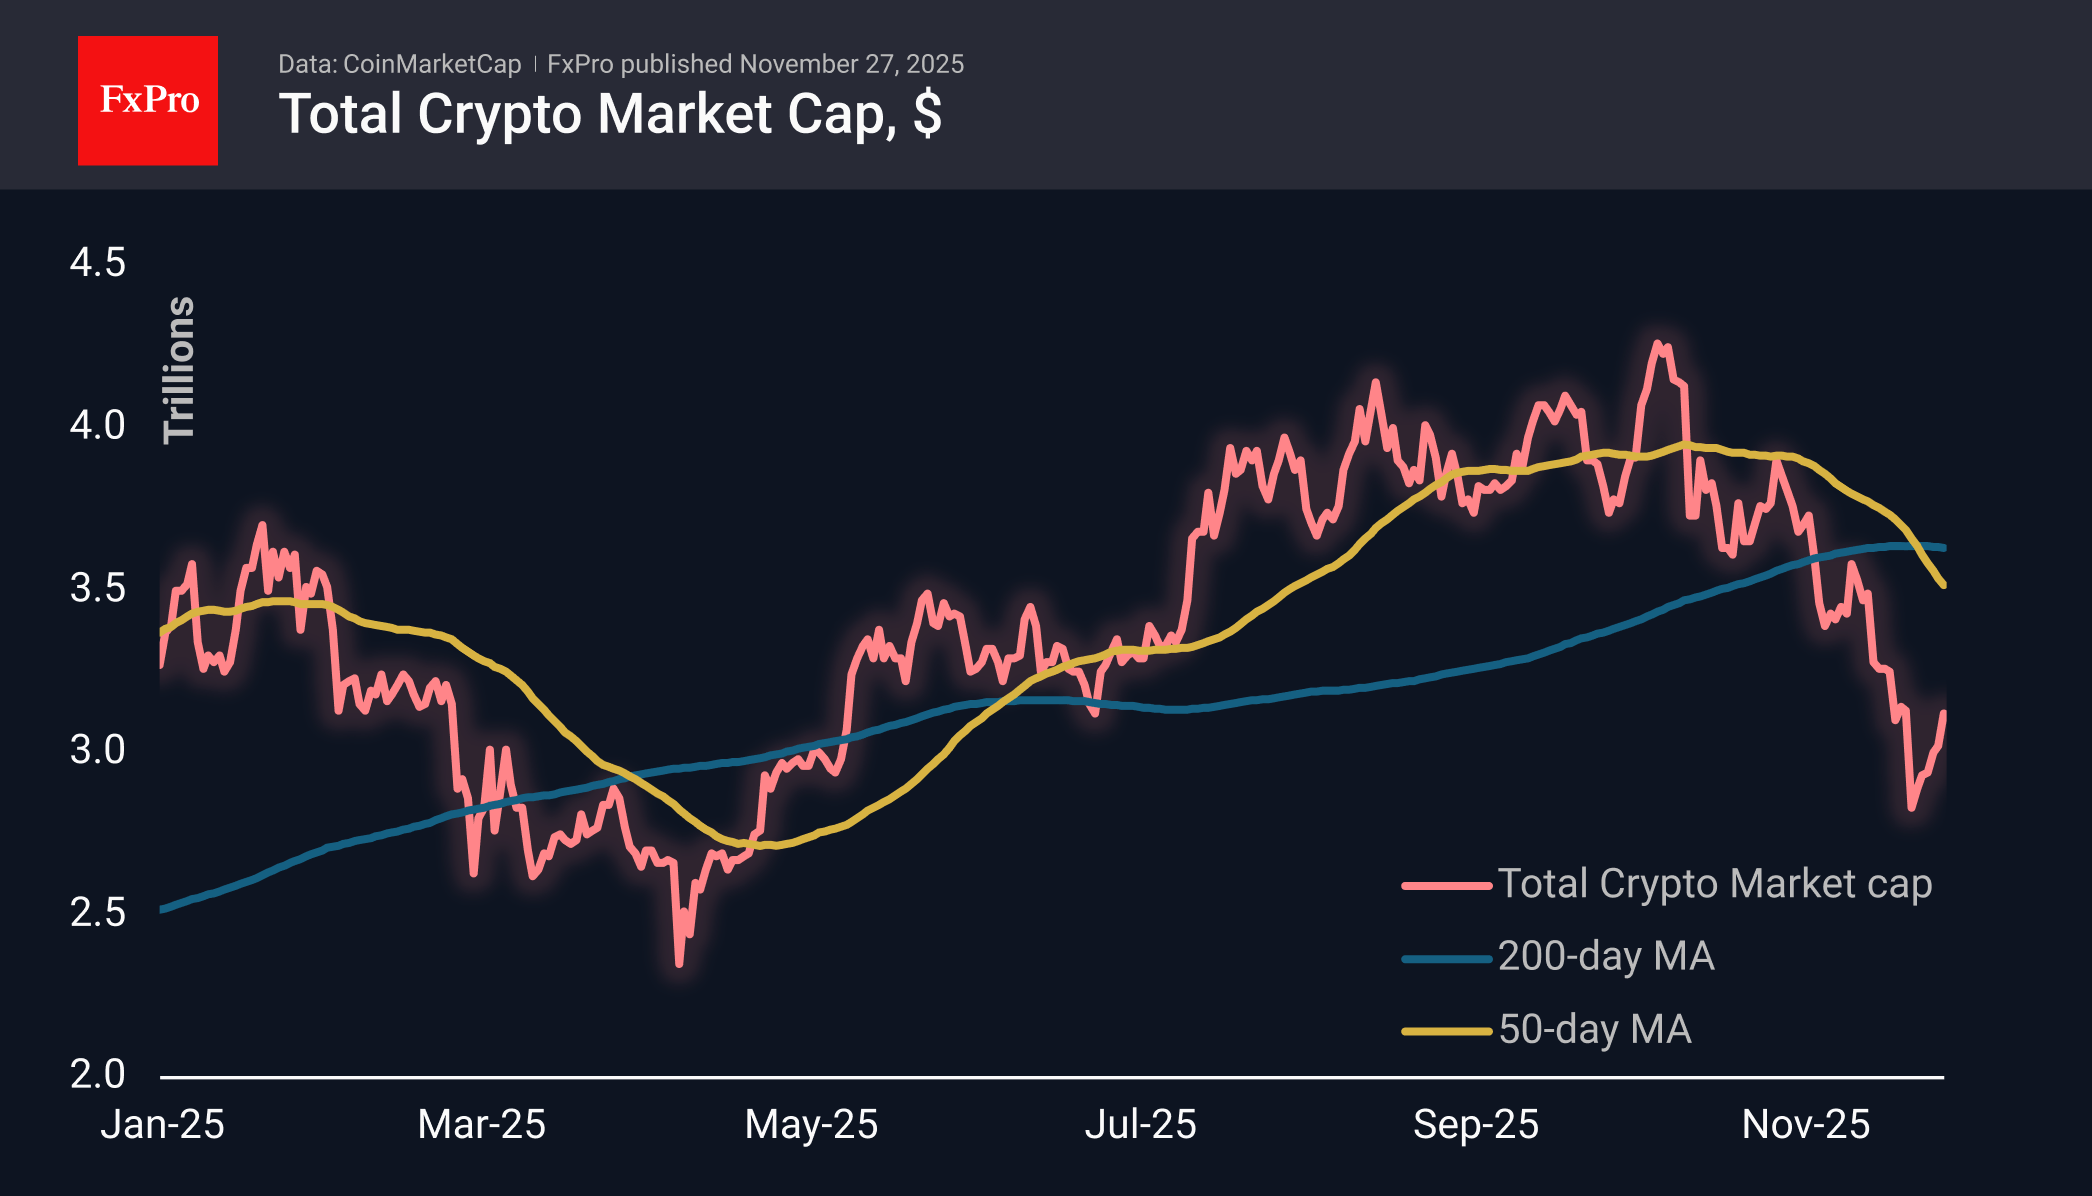
The sentiment index rose to 22, a two-week high, but still in ‘extreme fear’ territory. However, at this stage, it is easy to see the activation of buyers, whose interests are gradually expanding to a wider range of altcoins.
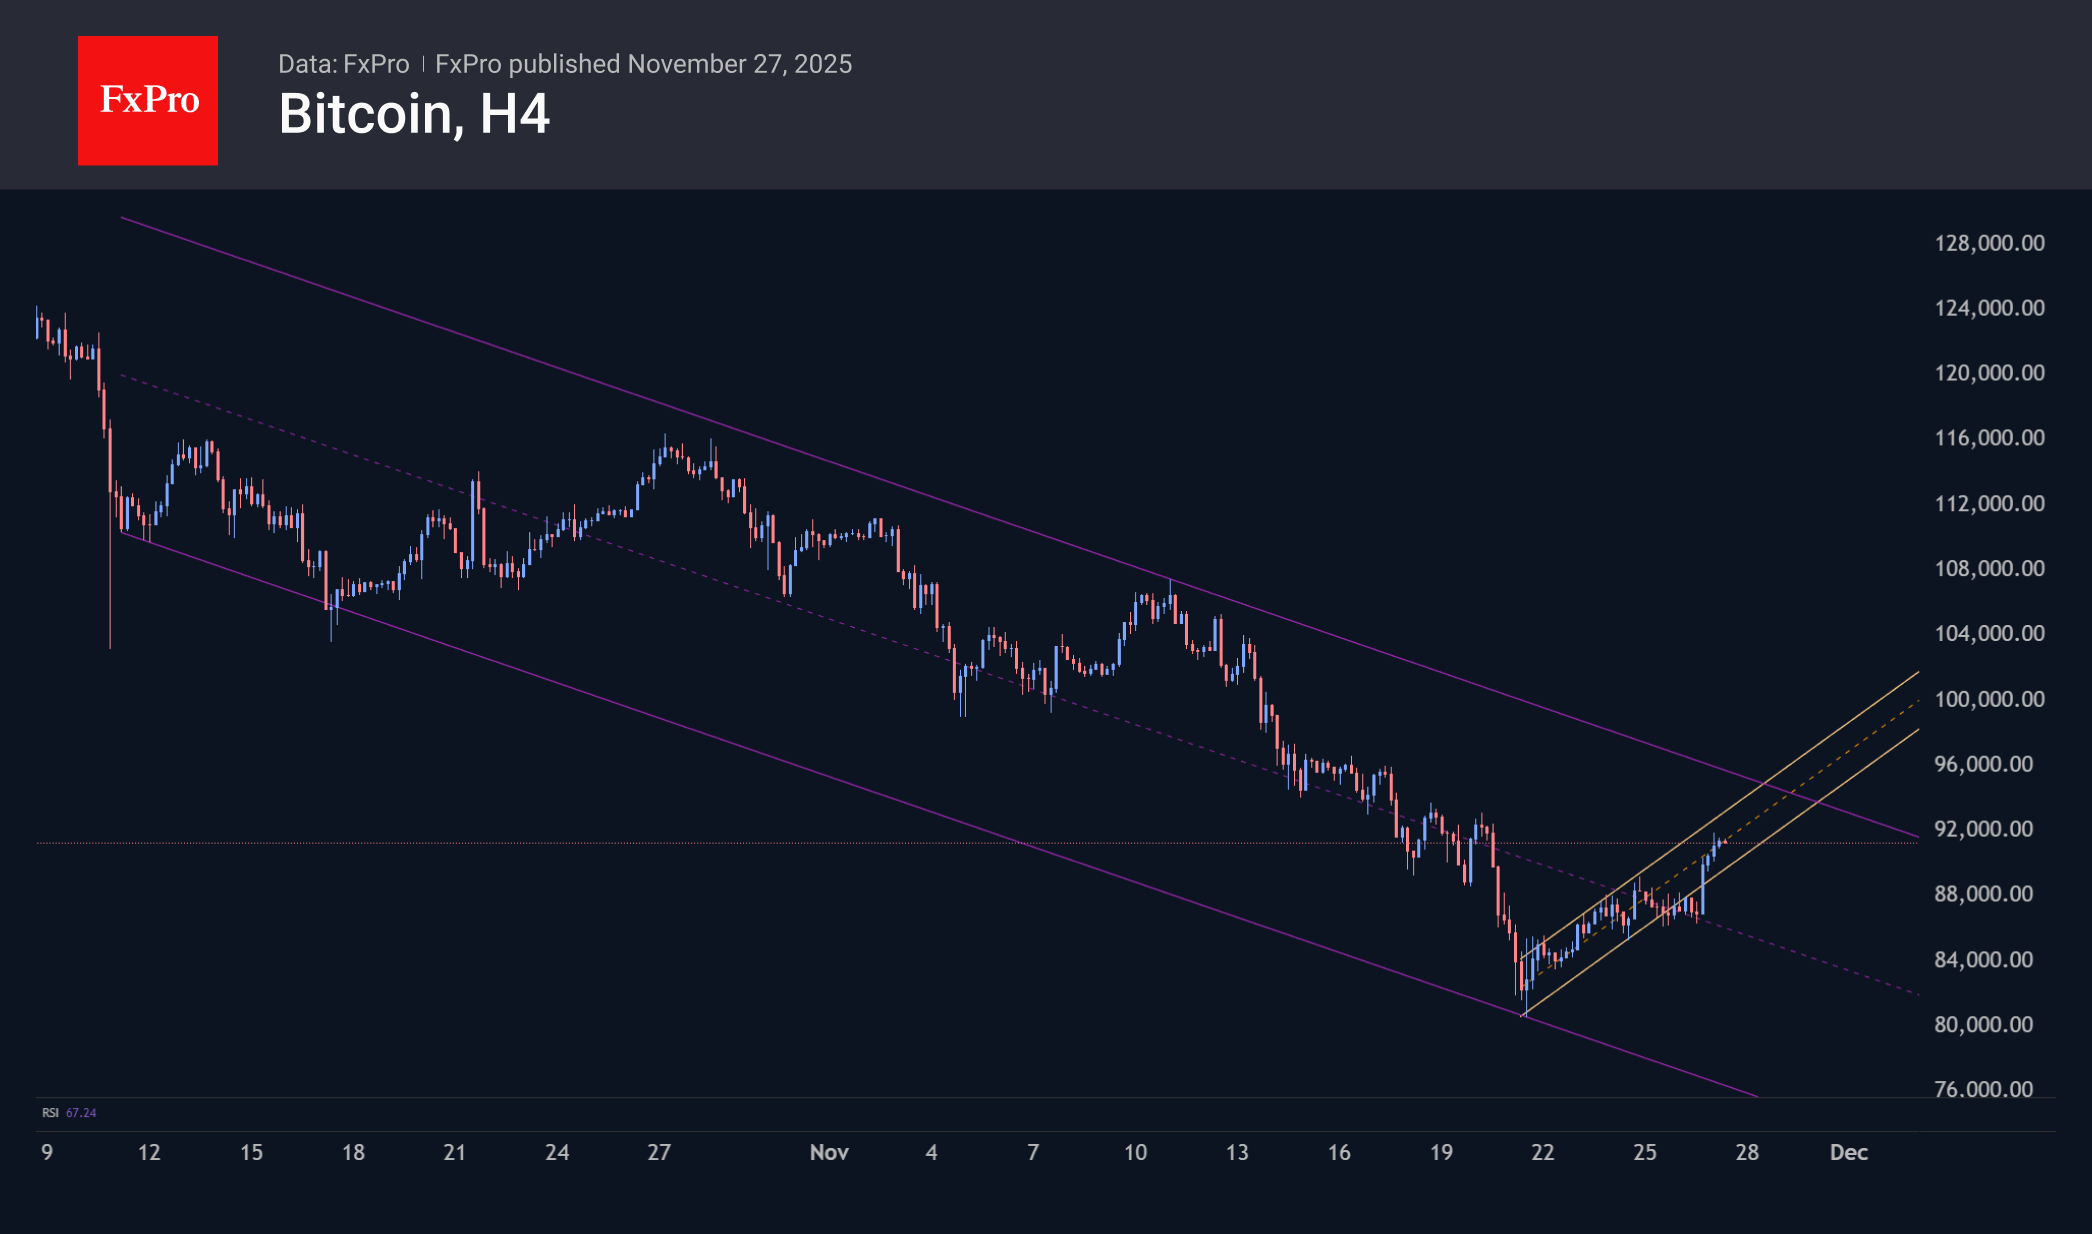
Bitcoin broke through the $91K mark, rising to 7-day highs and recovering to the classic Fibonacci retracement level of 61.8% of the collapse from November 11th to 21st. If the recovery does not lose momentum at these levels in the coming hours, we can expect a price rise to the $100K level soon and an attempt to break through an even more significant round level.
News Background
The 30% drop in Bitcoin from its highs provides an attractive long-term entry point, according to K33 Research, noting that BTC has lagged the Nasdaq in 70% of sessions over the past month. This situation has only been observed a few times since 2020.
According to data from the Deribit derivatives exchange, major players expect Bitcoin to rise to $100K-$118K, but do not believe that the asset will break above $120K soon.
Tether’s reserves have reached 116 tonnes of gold, which is comparable to the reserves of South Korea, Hungary or Greece. Investment bank Jefferies named the issuer of USDT stablecoins the largest holder of precious metals outside the public sector.
S&P Global Ratings downgraded the Tether (USDT) stablecoin to the fifth level: ‘weak’ due to its reliance on riskier asset classes, including Bitcoin, gold, and corporate bonds. This is the worst sustainability rating on the rating agency’s scale.
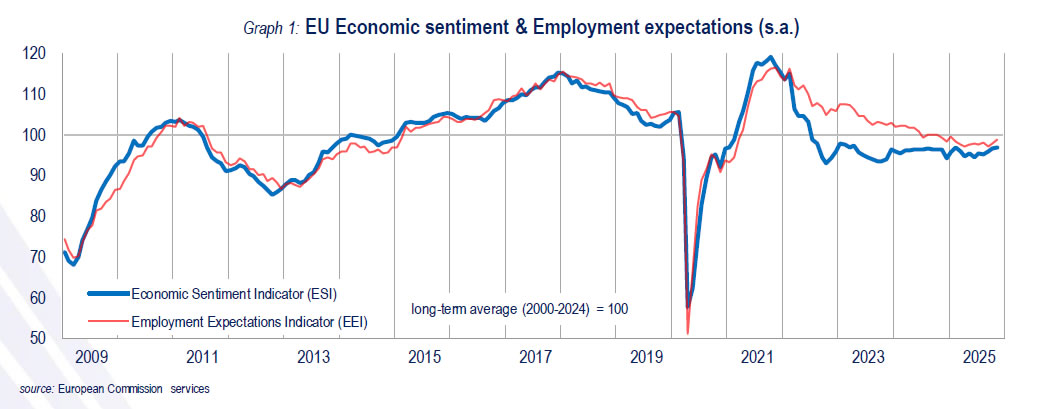
Eurozone economic sentiment marks mild gains, but stay below long-term average
EU and Eurozone posted only marginal improvements in sentiment in November, with the Economic Sentiment Indicator rising 0.2 points in both regions to 96.8 and 97.0. While the Employment Expectations Indicator saw a more meaningful lift—up to 98.8 in the EU and 97.8 in the Eurozone. Both gauges remain below their historical averages of 100.
Sector trends again showed uneven dynamics. Services, retail and construction recorded higher confidence. But industry confidence weakened further, nearly cancelling out those gains and keeping the overall ESI flat. Consumer sentiment was little changed,.
Across major EU economies, sentiment gains were led by Spain (2.0), Italy (1.1), France (0.) and Poland (0.5), while Germany and the Netherlands were steady at -0.3.
Is Silver Price Preparing to Challenge Its Record High?
The United States is celebrating Thanksgiving, meaning trading activity across financial markets will be lower than usual today (and to some extent tomorrow). Yesterday, we noted a decline in volatility in the gold market.
Against this backdrop, the silver market is drawing attention – and may not allow traders to relax. As the XAG/USD chart shows, silver has risen by more than 7% since the start of the week.
It is reasonable to assume that the holiday-induced drop in liquidity has opened the door to broader price movements. It is not impossible that we may soon see an attempt to break the all-time high (around $54.45 per ounce), which as of this morning lies roughly 1% away.
Technical Analysis of XAG/USD

Examining the XAG/USD chart, we can identify key swing points that allow us to outline an ascending channel. This week’s strong advance has pushed silver into the upper half of that channel.
The bulls’ strength is reflected in:
→ the steep slope of the orange channel, within which we see impulsive bullish candles followed by brief corrections – a classic pattern of a strong market;
→ a higher peak on the Awesome Oscillator.
Given this context, it is plausible that the median line could switch from resistance to support (as it has previously – shown by arrows), potentially helping the bulls gather the confidence needed to challenge the record high.
Start trading commodity CFDs with tight spreads. Open your trading account now or learn more about trading commodity CFDs with FXOpen.
This article represents the opinion of the Companies operating under the FXOpen brand only. It is not to be construed as an offer, solicitation, or recommendation with respect to products and services provided by the Companies operating under the FXOpen brand, nor is it to be considered financial advice.
Bitcoin Price Climbs Back Above $90k
Today, Bitcoin is trading above the psychological threshold of $90,000 – a modest consolation for the bulls after BTC/USD fell by around 25% between 1 and 21 November.
In our previous post on 18 November, we discussed why Bitcoin had been declining, highlighting the high leverage across the crypto market. The events of 21 November reinforced this point: within just four hours, according to Coinglass, crypto exchanges saw $1 billion worth of positions liquidated (mostly longs), a classic sign of panic. The CMC Fear and Greed Index dropped to 10, signalling extreme fear and marking the lowest reading ever recorded.
Does the rebound from the 21 November low offer reassurance that the worst is behind us? The chart gives strong reasons to doubt it.
Technical Analysis of BTC/USD
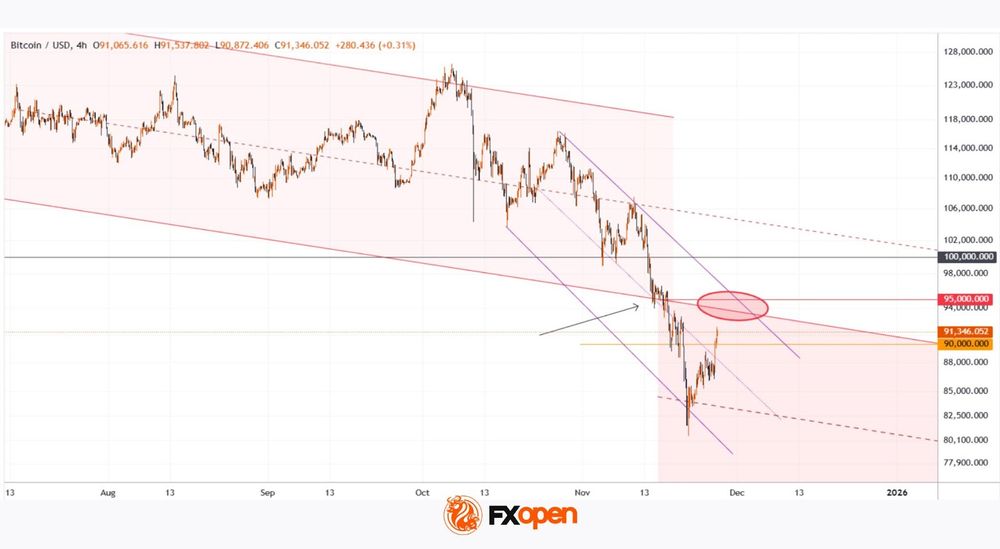
Following the abnormal surge in early October, Bitcoin formed a descending channel (left side of the chart). A major battle unfolded in mid-month near the $95k level (shown by an arrow) – bulls attempted to lift BTC/USD from the channel’s lower boundary but failed, forcing the channel to be extended downward on the right side of the chart.
Yesterday’s rise (possibly driven by cascading long liquidations and buyers finding prices near $80k too tempting) pushed Bitcoin back into a resistance zone (highlighted by an oval). This zone is defined by:
→ the upper boundary of the widened channel;
→ the $95k level, where bears previously asserted dominance;
→ the upper boundary of the downward trajectory (in purple), which has shaped BTC/USD movements since late October.
Only if bulls manage to break above this zone – a highly challenging task – will it confirm the seriousness of their intentions.
FXOpen offers the world's most popular cryptocurrency CFDs*, including Bitcoin and Ethereum. Floating spreads, 1:2 leverage — at your service. Open your trading account now or learn more about crypto CFD trading with FXOpen.
*Important: At FXOpen UK, Cryptocurrency trading via CFDs is only available to our Professional clients. They are not available for trading by Retail clients. To find out more information about how this may affect you, please get in touch with our team.
This article represents the opinion of the Companies operating under the FXOpen brand only. It is not to be construed as an offer, solicitation, or recommendation with respect to products and services provided by the Companies operating under the FXOpen brand, nor is it to be considered financial advice.
Structurally We Hold Our Bearish View Against UK Gilts and Sterling
Markets
The battle might be won, but the war definitely ain’t over. The corner stone of UK Chancellor Reeves’ Autumn Budget are £26bn of back-loaded tax rises (eg freezing income tax thresholds from 2028-29) which lift her fiscal buffer from £9.9bn to £22bn and help pay for higher welfare spending. Reeves avoids breaking her self-imposed rule that day-to-day public spending has to be covered by tax revenues by 2030. The Budget is a flurry of small measures, but lacks the big promised reforms to boost UK productivity/competitiveness and/or sustainably improve public finances. The Office for Budget Responsibility scaled back average growth from 1.8% to 1.5%. The public deficit is forecast on a declining path from 5.1% of GDP last year via 4.5% this year to 1.9% by 2029/2030. Debt as a share of GDP is seen at 95% this year and holding at 96% at the end of the decade. It’s clear that it won’t take a lot to derail the still precarious situation. UK markets traded initially volatile, partly because of the unwanted mismatch of OBR forecasts and Chancellor Reeves’ address, but in the end a fresh sell-off in UK assets was avoided. It suggests some more room for recovery in the very short run. Structurally we hold our bearish view against UK Gilts and sterling. In a daily perspective, UK yield curve bull flattened with yields ending 2.8 bps (2-yr) to 11.5 bps (30-yr) lower. Short-term (inflation-dampening) political incentives to safeguard UK households purchasing power might also help tipping the balance towards a slightly more dovish Bank of England in coming months. EUR/GBP closed at 0.8750 from a start around 0.8790.
US markets are closed today for Thanksgiving holiday with traded volumes expected to remain low tomorrow (Black Friday) with an early (US) close. The EMU eco calendar contains EC sentiment data and Minutes of the previous ECB meeting, but those won’t have a profound market impact. The risk rebound which started last Friday became technically relevant yesterday by taking out last week’s high and stemming fears of a potential sell-on-upticks pattern. The recent outperformance of US Treasuries and buoyant sentiment helped EUR/USD back towards 1.16. On a geopolitical level, any comments/developments in US-brokered peace talks between Ukraine and Russia remain a wildcard for trading.
News & Views
The Hungarian GKI Sentiment index showed a mild adjustment this month after three consecutive months of increases. Business expectations changed marginally (from -9.3 to -9.9). Consumers adapted somewhat more downbeat views with the index easing from -25.6 to -27.2. The Composite GKI sentiment index, summarizing these expectations, declined from -13.5 to -14.4, which GKI assesses as a shift within the margin of error. The retreat in business confidence was driven solely by industry (-2). The construction index was unchanged, while the retail and services indicators each rose (+2). The retail indicator has not stood this high for fourteen months, nor the services indicator for thirteen. Looking ahead, construction remains the least, and business services the most optimistic. Firms willingness to hire rose to the highest in a year. The price indictor tracking firms’ expected sales prices over the next three months rose slightly after three months of stagnation. GKI consumer confidence eased from a 14-month high Households’ assessment of their financial situation deteriorated noticeably, and their financial outlook worsened slightly. Changes in indices on the economic outlook, on major purchases or inflation didn’t change much. Prospects on future unemployment improved markedly.
The Bank of Korea voted to keep the policy rate at 2.5% for the fourth consecutive meeting this morning. The BoK also changed its assessment on future policy as it now indicates that it will “decide whether and when to implement further rate cuts”, being less explicit on a rate cut bias compared to previous meeting (maintaining a rate cut stance). At the press conference governor Rhee admitted a divide within the MPC as three members preferred the option to keep rates unchanged while three others believe the possibility of a rate cut should remain open. The governor also sees current policy rate as close to a neutral level. The BoK in an updated forecast upwardly revised is 2026 growth forecast to 1.8% from 1.6%. Inflation next year now is expected at 2.1% (from 1.9%). Aside from financial stability concerns due to elevated property prices and high debt, the MPC also grows more concerned on the risk of a weak won raising inflation. The won gains marginally this morning (USD/KRW 1464.76), but holds near multi-year lows
USD/JPY Extends Decline as Yen Recovers on Intervention Fears
The USD/JPY pair fell to 156.13 on Thursday, with the Japanese yen recouping recent losses as markets remain on high alert for potential intervention by Japanese authorities.
Traders are speculating that the US Thanksgiving holiday, which typically sees lower liquidity and thinner market conditions, could provide a strategic "window" for regulators to intervene and support the yen. Notably, the mere risk of intervention is already acting as a deterrent, effectively capping the currency's recent decline.
Fundamentally, sentiment is also shifting as investors reassess the Bank of Japan's (BoJ) policy trajectory. Recent media reports suggest the central bank is actively preparing for a potential rate hike as early as next month. This shift is driven by persistent inflationary pressures, the pass-through effects of a weak yen, and a perceived easing of political pressure to maintain ultra-loose monetary settings.
Externally, the yen has found additional support from a broadly weaker US dollar. Markets have increased bets on further Fed easing, weighing on the greenback across the board.
Technical Analysis: USD/JPY
H4 Chart:
On the H4 chart, USD/JPY is forming a consolidation range around 156.40. We anticipate a near-term decline to 154.90, which is likely to be followed by a technical rebound to retest the 156.40 level. A decisive upward breakout above this resistance would open the path for a more significant rally towards 158.47. However, following such a move, we would expect the formation of a new lower high and the start of a fresh downward impulse, targeting 154.00 and potentially extending the correction to 153.30. The MACD indicator supports this bearish medium-term bias. Its signal line is below zero, pointing downward, confirming that selling momentum remains strong.
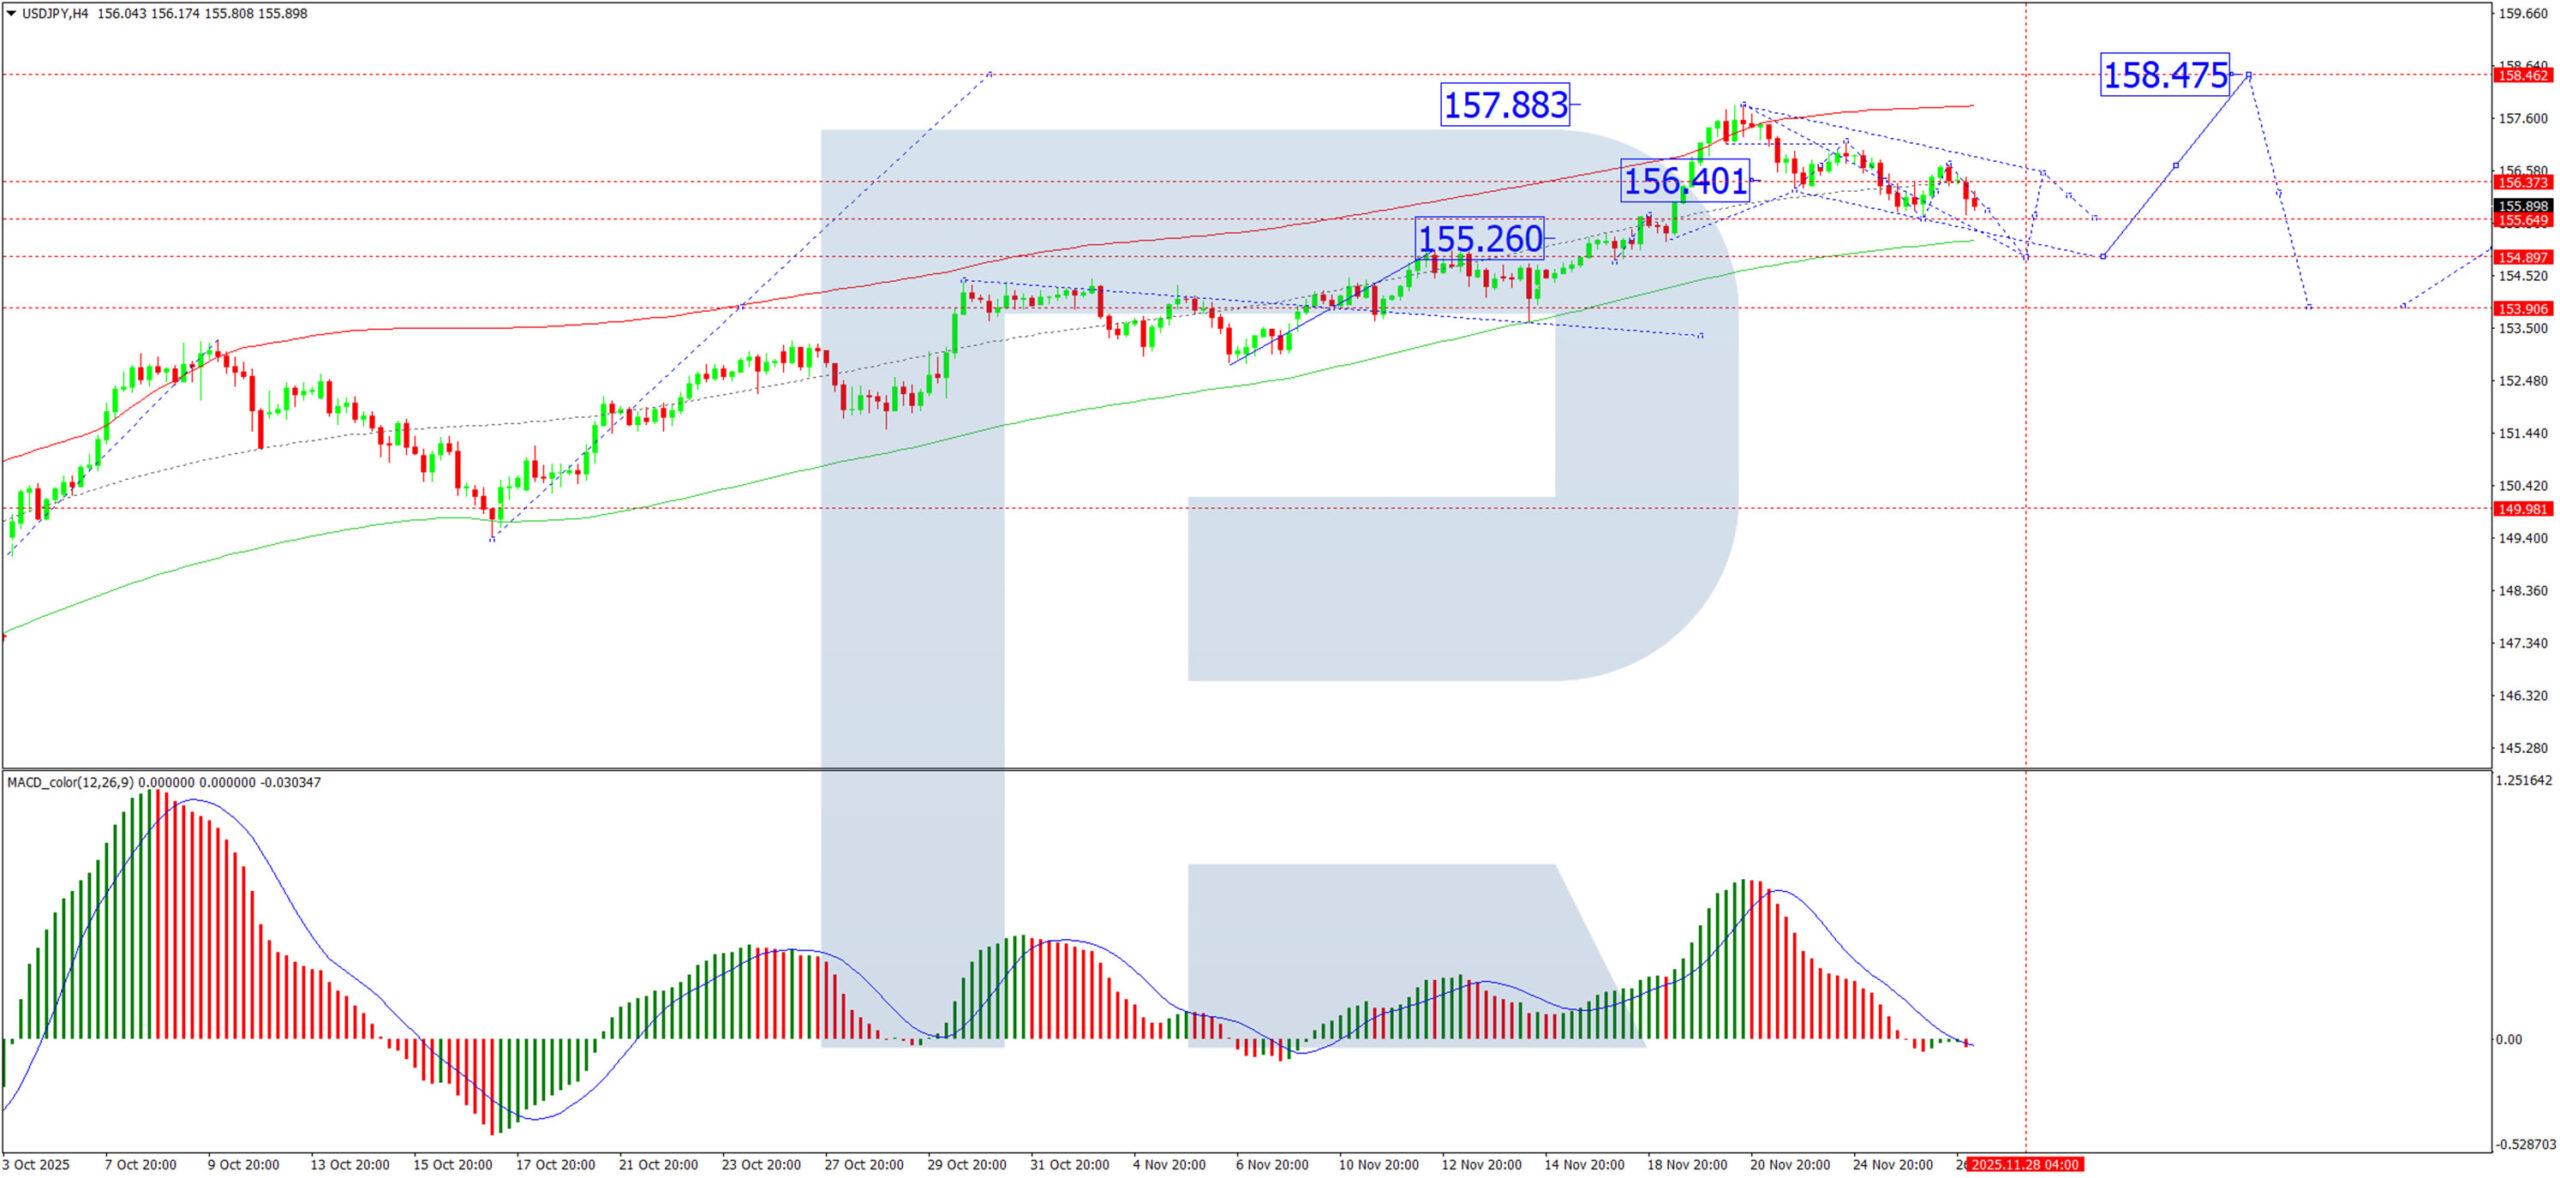
H1 Chart:
On the H1 chart, the pair is developing a clear downward wave structure with an initial target at 154.90. We expect this target to be reached, after which a corrective wave of growth should emerge, retesting the 156.40 level from below. The Stochastic oscillator corroborates this near-term bearish view. Its signal line is below 50 and falling towards 20, indicating that short-term downward momentum remains intact for now.
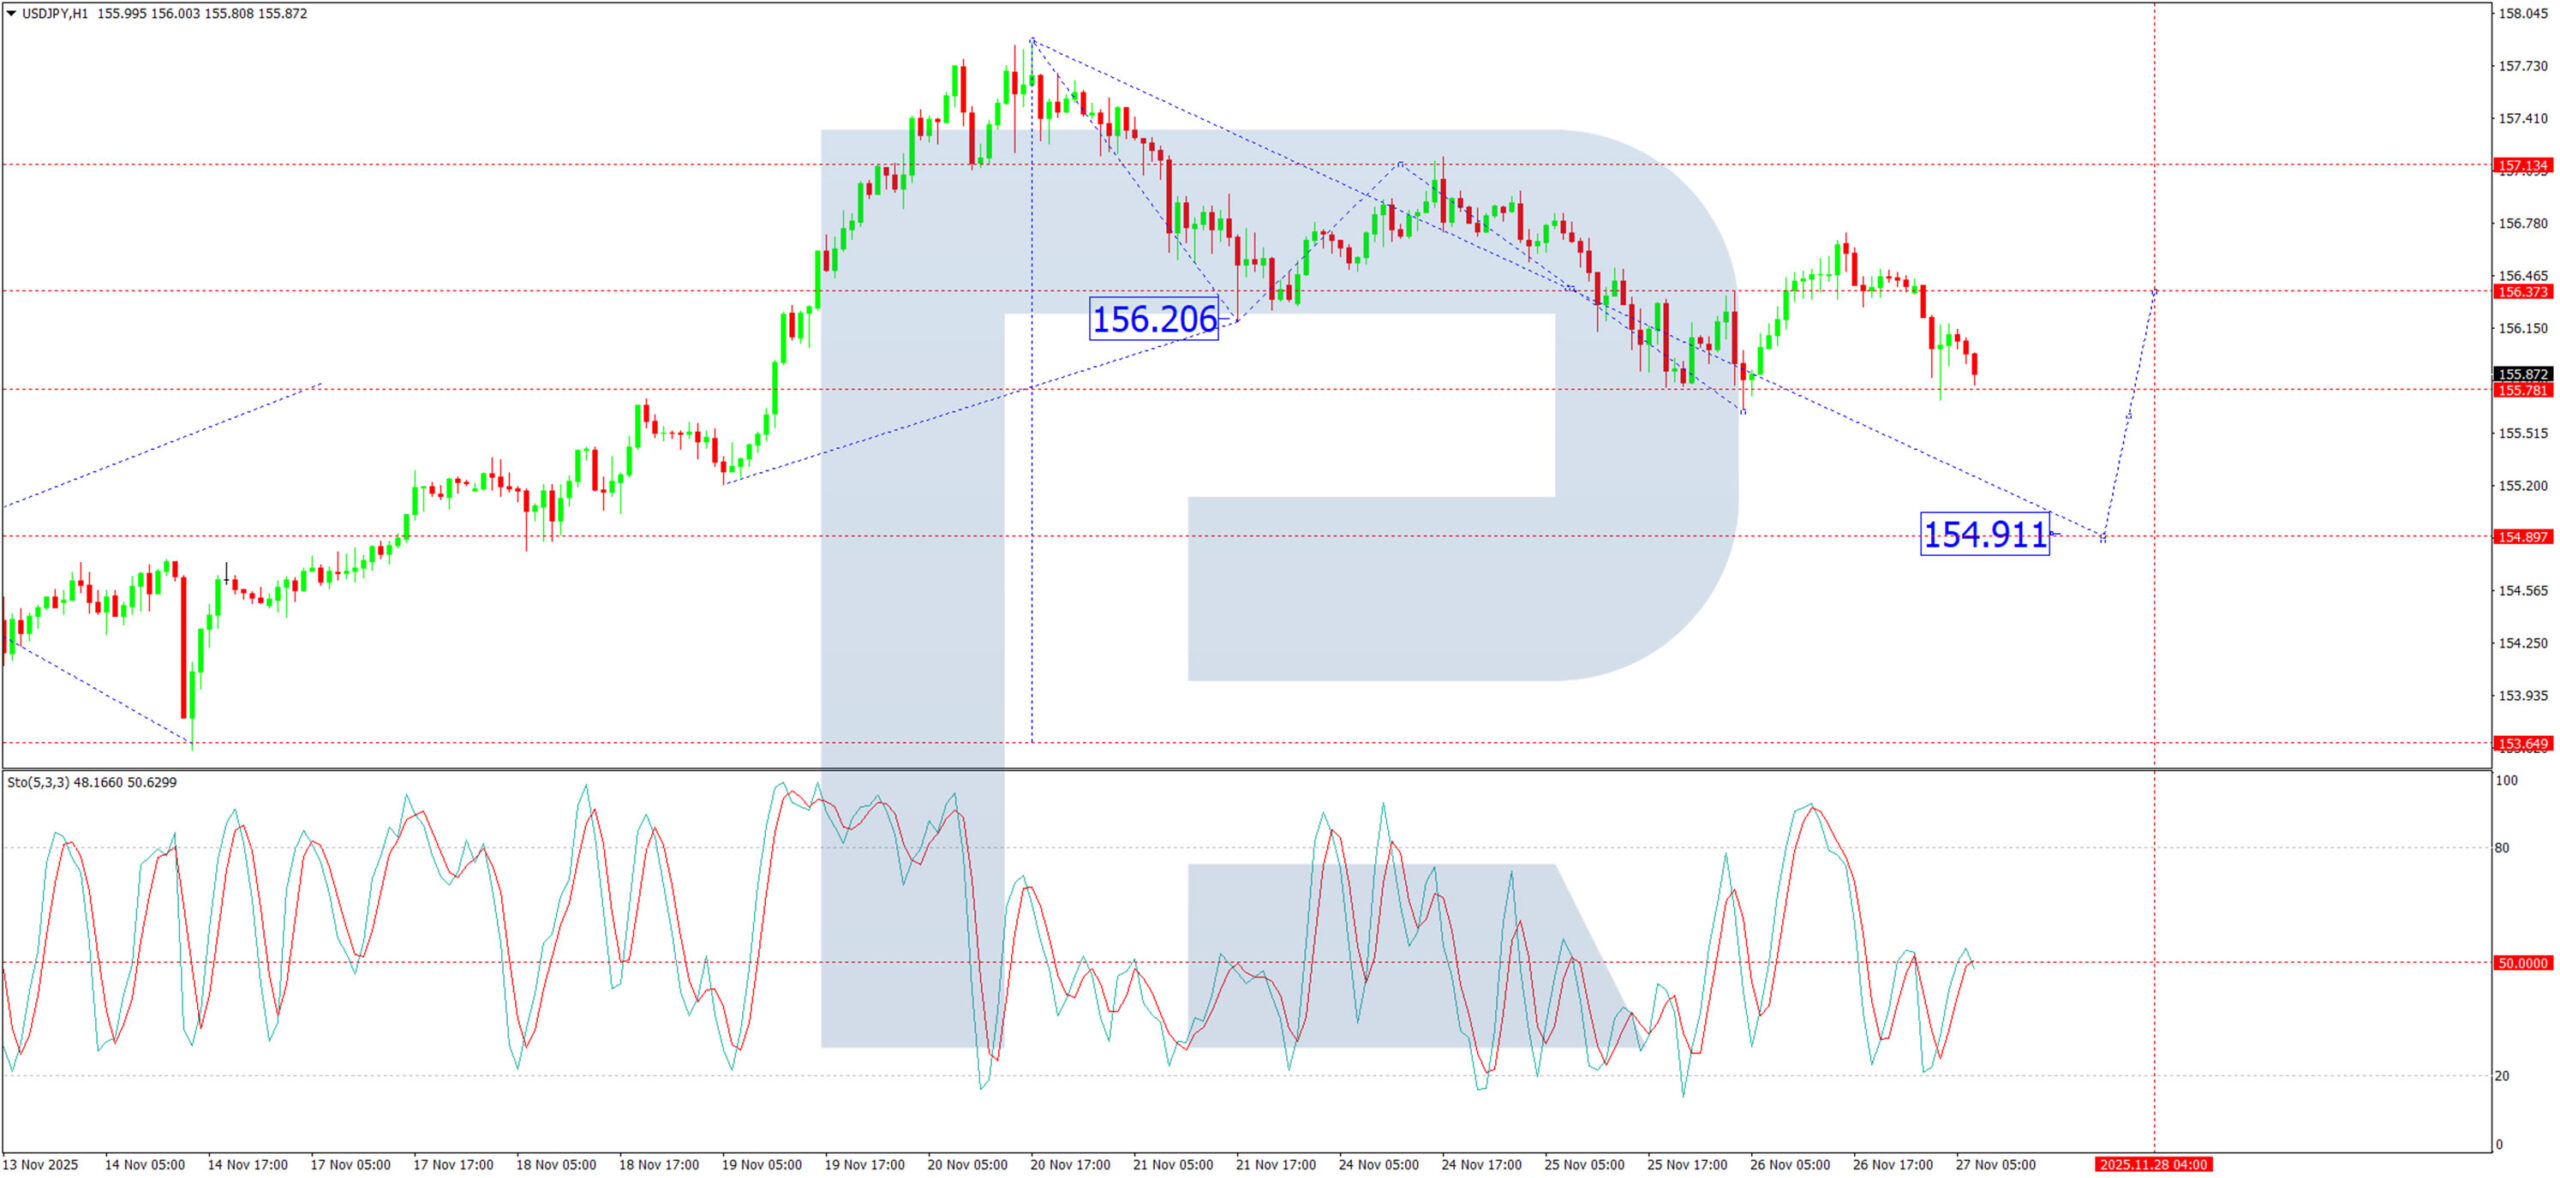
Conclusion
The yen is strengthening on a confluence of intervention threats and a fundamental reassessment of BoJ policy. Technically, USD/JPY is in a corrective phase with an immediate target at 154.90. While a rebound to 156.40 is expected thereafter, the broader risk is tilted to the downside. A break above 158.47 would be required to invalidate the current bearish corrective structure. Traders should remain vigilant for intervention-driven volatility, particularly during periods of low liquidity.
Spot Silver XAGUSD Aiming for All Time High, Targeting $57.4
Spot Silver (XAGUSD) continues to display a constructive technical outlook, suggesting that the metal is preparing to challenge new all‑time highs. The short‑term structure from the 28 October low has unfolded as a five‑wave impulse, reinforcing the bullish trajectory. Wave 1 of this sequence concluded at $54.39, as indicated on the one‑hour chart. Following this peak, the market experienced a corrective pullback in wave 2, which developed into a classic zigzag Elliott Wave formation. Within this correction, wave ((a)) terminated at $49.33. Wave ((b)) rallied to $52.46, and wave ((c)) declined to $48.6 low. Thereby completing wave 2 at a higher degree.
From that low, silver has resumed its upward momentum in wave 3. However, a decisive break above the prior wave 1 high at $54.39 remains necessary to eliminate the possibility of a double correction. Progressing from wave 2, wave (i) ended at $50.66, while the subsequent pullback in wave (ii) found support at $49.69. The current expectation is for the metal to extend higher in wave (iii). After which a modest retracement in wave (iv) should occur before another advance resumes. In the near term, as long as the pivot at $48.6 holds firm, dips are anticipated to attract buyers. Support is likely to emerge in the form of three, seven, or eleven swings, providing the foundation for continued upside potential. This structure underscores the resilience of silver’s bullish cycle and highlights the importance of maintaining key pivots to sustain momentum.
XAGUSD 1-Hour Elliott Wave Chart From 11.27.2025
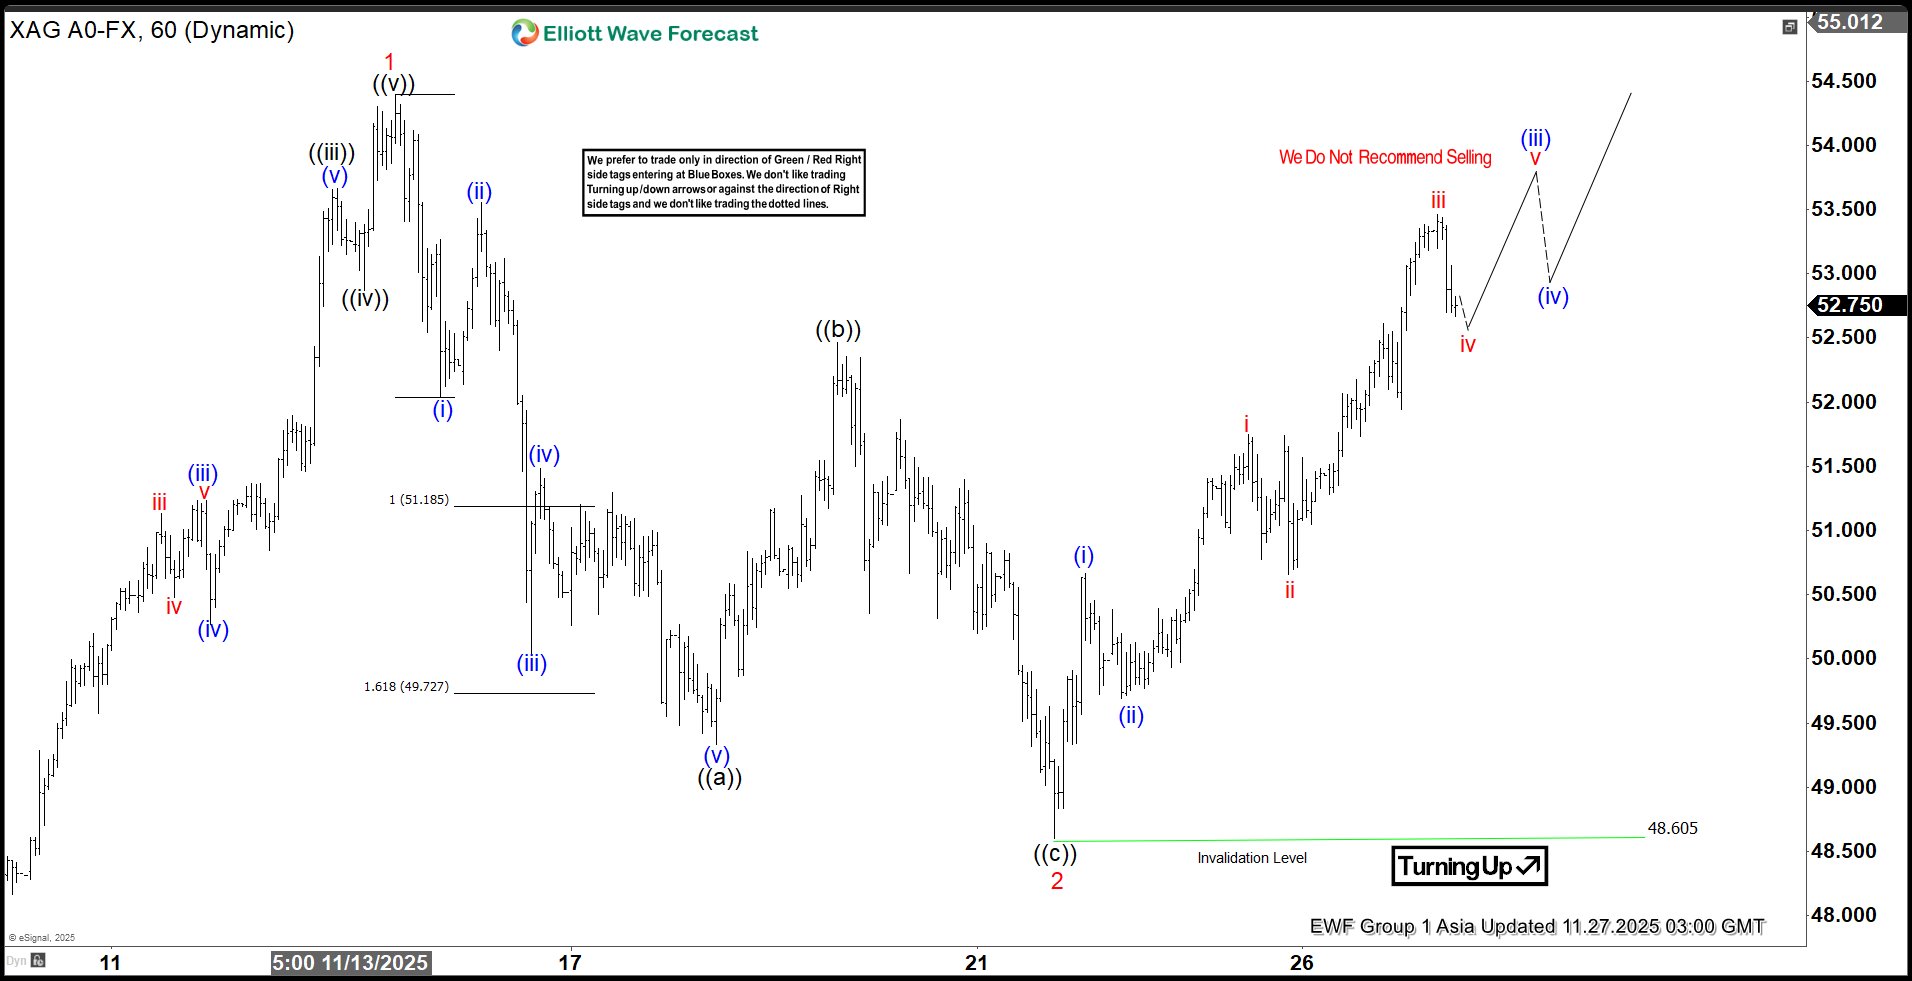
XAGUSD Elliott Wave Video:
https://www.youtube.com/watch?v=ofTRLD35bUI
Happy Thanksgiving
The calm has returned to the markets before US traders left their desks for the turkey dinner. The US indices added to their gains for the fourth session, as US yields kept falling. The 2-year yield, for example — the part of the curve that captures the December Federal Reserve (Fed) expectations — fell straight to 3.45%. From today’s standpoint, an additional 25bp cut in December is largely priced in, with more than 80% probability attached to it.
Cherry on top: the news that Kevin Hassett could be the next Fed Chair further revived expectations that the Fed may adopt a lower-rate policy moving forward— in line with the White House’s wishes. Hassett is also pro-deregulation and friendly toward crypto, everything the risk markets adore! And with Powell’s term ending in May 2026 — and rumours of a nomination before the end of the year — markets are already picturing a Fed that’s softer on rates, lighter on rules and a bit more welcoming to the digital-asset world. The expectation is that there would be 2–4 more rate cuts in 2026, on top of the one anticipated to land in December.
What could go wrong? When the Fed cuts rates — or even before it does — markets react by pulling yields lower. Lower yields reduce borrowing costs. Cheaper borrowing helps companies finance their projects, boosting growth. And lower yields also lift valuations because the rate at which you discount future revenues falls, making those future revenues worth more today. The lower the yields, the higher the growth expectations and the higher the valuations. This is why Trump wants the Fed to lower yields so badly.
But this transmission mechanism — Fed cuts – lower market yields – easier financing — is not guaranteed. That’s the catch. If the market decides that cutting rates is not the right call — that it could revive inflation and require future hikes — yields can rise even after the Fed cuts. This is exactly what happened in September 2024. Remember: within hours, the Fed expectations suddenly swung toward a 50bp cut... and yields spiked after that decision. The Fed then had to pause cuts for a full year.
So whether the Fed cuts rates in December is only half the question. The other half is whether it’s the right thing to do. And we won’t know, because we don’t have the inflation data — and that data is expected to arrive the week after the Fed decision. So even if the Fed cuts, if inflation surprises to the upside the following week, yields could jump higher and the expectation of those extra 2–4 cuts could evaporate — weighing on risk appetite. Conclusion: Fed expectations should be taken with a pinch of salt.
Good news: if you celebrate Thanksgiving, your turkey dinner will cost around 5% less this year compared to last. Turkey prices are down roughly 16%, enough to offset the increase in vegetables and general groceries.
Anyway, market mood is fine but the risk of a potential policy mistake should remain at the back of your mind as we walk into the Fed decision next month. The US dollar softened below the 200-DMA on the back of easing Fed bets. But the dovish expectations may have run slightly ahead of themselves, and the dollar index could find support near the 98.85/99 range — the major 38.2% Fibonacci retracement and the 50-DMA — before attempting to recover some of this year’s heavy losses. In the medium run, the US dollar outlook remains negative.
Back to the short run: the recent weakness of the dollar was helped by recoveries in the yen and sterling. But for both currencies, gains remain fragile. In Japan, Takaichi’s spending and borrowing plans leave the yen with no other reasonable or natural path than south. And for sterling, the post-Budget rebound will likely be challenged by softer Bank of England (BoE) expectations.
So, diving into the UK economics: yesterday’s Budget announcement went much better than many — including myself — expected. Everyone was braced for drama, volatility and even a few tears to spice it up. But none of it materialised. Apart from the OBR accidentally releasing its forecast an hour early, the measures were largely in line with market expectations and were warmly welcomed by gilt markets.
We heard plenty of tax rises — about £26bn, though most only kick in around the election year. Reeves opted for a softer stance on benefits, but financed by more people paying taxes. She announced a decent fiscal headroom: investors were seduced.
But a bleak setup for productivity and growth means that the UK will increasingly rely on financial markets to finance government operations. And that means investors — not voters — end up determining how much the government can spend and how much pain people in the streets must endure. The only way to break this cycle is to grow as much as you spend. I’d say there’s a better chance of unicorns invading the skyline.
The good news: gilt yields have fallen sharply after what was meant to be the most feared Budget in years, and cable is extending gains above 1.32. But again, the BoE now has the green light to cut rates in December. That will cap sterling’s upside — though only as much as the USD and the Fed bets allow.