Sample Category Title
Euro Area and Scandies in Spotlight as Investors Assess Outlook
In focus today
In the euro area, the inflation flash estimates are released for Germany, France, Italy, and Spain which together will reveal almost entirely how inflation in the euro area fared ahead of the aggregate data next week. We expect headline inflation remained at 2.1% y/y in November and core inflation remained at 2.4% y/y as in October.
In Sweden, the Q3 GDP statistics are announced. Preliminary estimates indicate growth of 1.1% q/q (2.4% y/y) and although the GDP indicator is highly unreliable and prone to revisions, broader activity data supports the notion of a tentative recovery. Private consumption increased in September and appeared to be the main driver of Q3 growth, which we expect to print at 0.9% and 1.7% y/y.
In Norway, we expect the seasonally adjusted unemployment rate to be unchanged at 2.2% in November, but the number of unemployed to increase, signalling a gradually weaker labour market. We also keep an eye on new vacancies, as they can act as an indicator of labour demand. We expect retail sales grew 0.5% m/m in October after a couple of weak months. High real wage growth, lower mortgage rates and still low unemployment should support private consumption going forward, and we see some upside risk to our estimate.
Economic and market news
What happened overnight
In Japan, Tokyo November CPI released at 2.8% y/y (cons: 2.7%) and CPI excl. fresh food and fuel remained at 2.8%. October retail sales surpassed expectations at 1.7% y/y (cons: 0.8%) and marked the strongest uptick in four months. The largest increase in sales was seen in machinery and equipment (8%), pharmaceuticals and cosmetics (5.1%) and automobiles (4.8%). Additionally, the unemployment rate held steady at 2.6% in October and it appears the economy is weathering the impact of higher US tariffs. Markets are now pricing in slightly more than a 50% chance of an interest rate hike from the Bank of Japan at the December meeting.
What happened yesterday
In the euro area, the ECB minutes from the October meeting did not reveal much new information and the wording was very balanced. The ECB GC members are clearly in no rush to change policy rates and continue to see "a high option value in waiting for additional data." Most members saw inflation risks as two-sided and balanced.
On the data side, credit growth for October released above expectations with adjusted loans to non-financial corporations increasing by 2.9% y/y. Loan growth to households increased to 2.8% y/y from 2.6% in September. The readings were above expectations of a slowing momentum which we expected would result in a smaller reading.
In Denmark, retail sales for October surprised to the upside, with a reading of 0.9% m/m and 4.9% y/y in October, marking the highest monthly gain since February 2024. The main driver can be found in other consumer goods, which increased by 8.6%, up from 7.6% in September, and food and other groceries which were up 0.9% vs -2.0% in September.
In Sweden, the NIER survey showed overall sentiment improving to 101.7 in November from 100.9 in October. Consumer confidence disappointed and declined following six months of positive gains. The decline appears to be driven by a slightly more negative view of the domestic economy.
The Swedish National Debt Office (NDO) presented an updated forecast and borrowing plan. The borrowing requirement for 2026 was revised up by SEK 89bn, bringing the total deficit- or net borrowing requirement to SEK 173bn. The NDO stated that the increase "is mainly due to expansionary fiscal policy".
Equities: Thursday was a quiet day in markets, as US was closed for Thanksgiving. European equities edged slightly higher, with the Stoxx 600 up 0.1% and the MSCI Nordics up 0.4%. As Nordics have lagged in the recent rebound, it would make sense if Nordics outperformed on the coming trading days. Beneath the surface, the tone was risk-on, with global cyclicals and small caps outperforming. It is unclear if this continues today, as futures markets are closed this morning due to technical issues. However, Asian markets are little changed, which gives a hint of another slow trading day today. US markets will reopen today, but only for a half-day session.
FI and FX: Small to no moves in the rates and equity space as US is closed for Thanksgiving. US10y flat at 4%, equity futures in green. Scandi FX traded modestly higher yesterday. EUR/SEK is just below 11.00 ahead of month-end, which we estimate could generate a small need to sell SEK for rebalancing purposes. Focus on today's Swedish GDP data, a well. EUR/NOK trades around 11.88 going into the Norwegian data releases this morning.
GBP/JPY Daily Outlook
Daily Pivots: (S1) 206.52; (P) 206.86; (R1) 207.28; More...
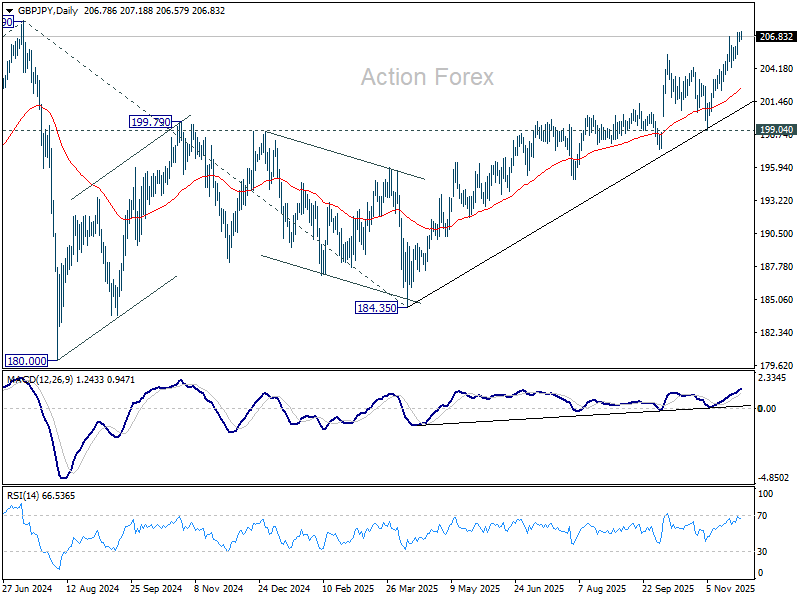
Intraday bias in GBP/JPY remains on the upside at this point. Current rally from 184.35 should target a retest on 208.09 high. Firm break there will confirm larger up trend resumption. On the downside, below 205.29 minor support will turn bias neutral again.
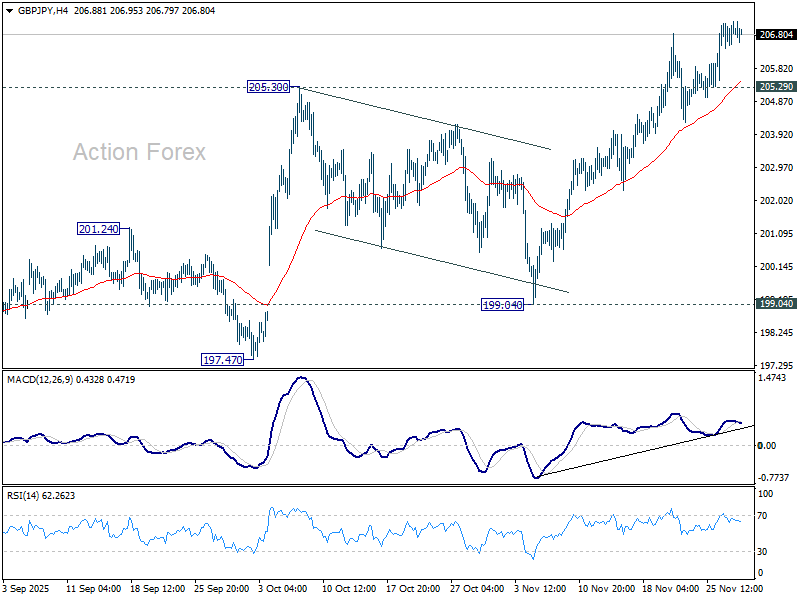
In the bigger picture, price actions from 208.09 (2024 high) are seen as a corrective pattern which might have completed at 184.35. Firm break of 208.09 high will resume the up trend from 123.94 (2020 low). Next target is 61.8% projection of 148.93 to 208.09 from 184.35 at 220.90. However, decisive break of 199.04 support will dampen this view and extend the corrective pattern with another fall.
EUR/JPY Daily Outlook
Daily Pivots: (S1) 180.85; (P) 181.14; (R1) 181.51; More...
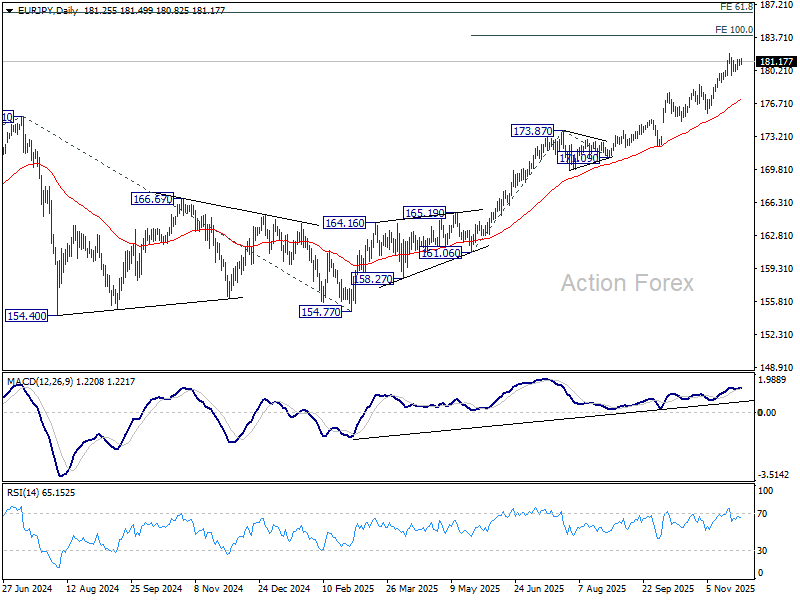
Consolidations continue below 181.98 and intraday bias stays neutral in EUR/JPY. Deeper retreat cannot be ruled out, but downside should be contained by 178.80 resistance turned support to bring another rally. On the upside, break of 181.98 will target 100% projection of 161.06 to 173.87 from 171.09 at 183.90 next. However, firm break of 178.80 will argue that deeper correction is already underway towards 55 D EMA (now at 177.09).
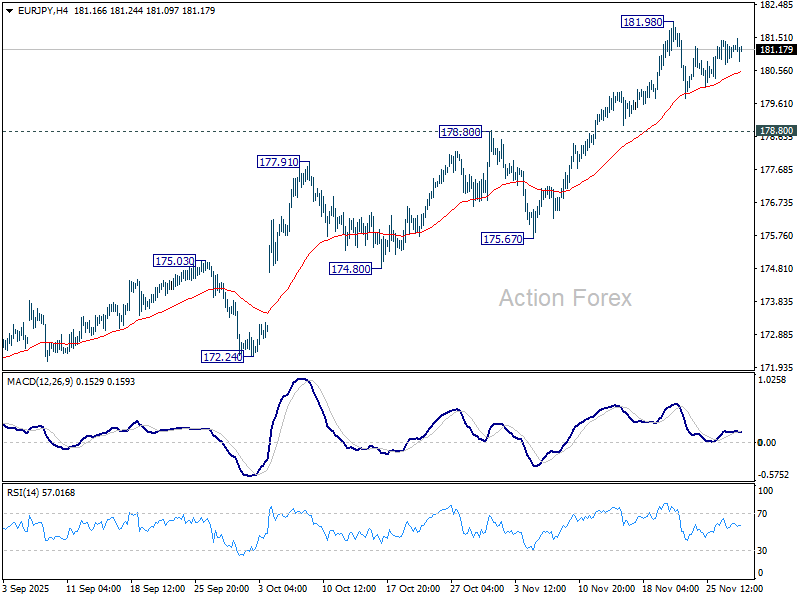
In the bigger picture, up trend from 114.42 (2020 low) is in progress and should target 61.8% projection of 124.37 to 175.41 from 154.77 at 186.31. Outlook will continue to stay bullish as long as 55 W EMA (now at 169.42) holds, even in case of deep pullback.
EUR/GBP Daily Outlook
Daily Pivots: (S1) 0.8746; (P) 0.8758; (R1) 0.8770; More…
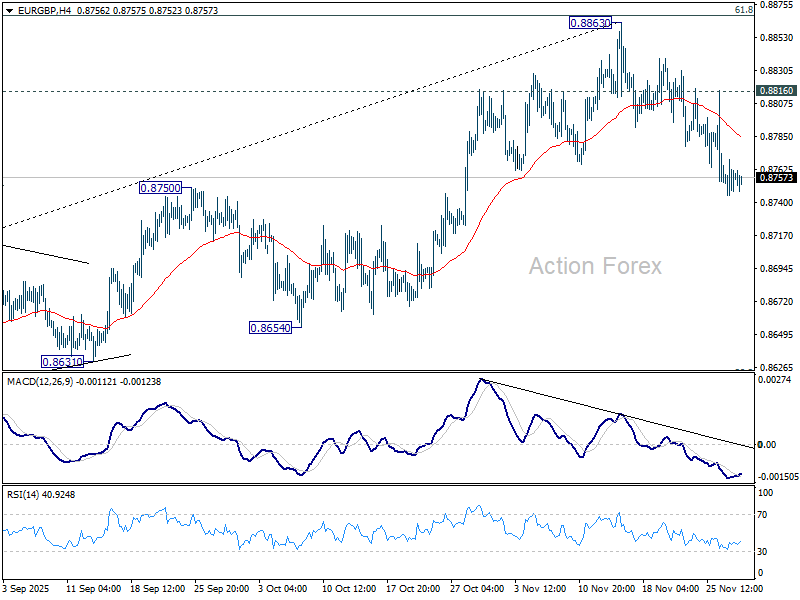
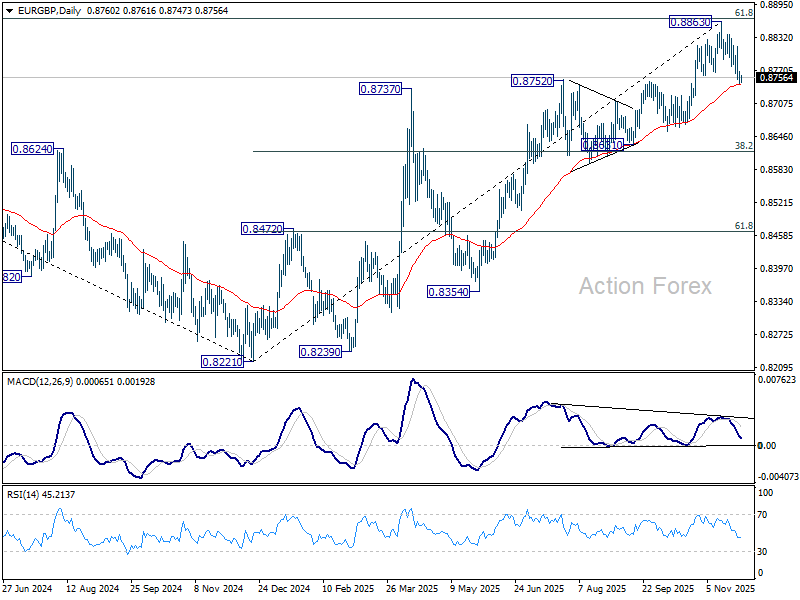
Intraday bias in EUR/GBP remains on the downside and outlook is unchanged. Sustained trading below 55 D EMA (now at 0.8744) will be an early sign of bearish trend reversal. Deeper fall should then be seen to 0.8631 cluster (38.2% retracement of 0.8221 to 0.8663 at 0.8618. However, break of 0.8816 minor resistance will bring stronger rebound to retest 0.8863 high instead.
In the bigger picture, rise from 0.8221 medium term bottom is still seen as a corrective move. Upside should be limited by 61.8% retracement of 0.9267 to 0.8221 at 0.8867. Sustained trading below 55 W EMA (now at 0.8588) should confirm that this corrective bounce has completed. However, decisive break of 0.8867 will suggest that EUR/GBP is already reversing whole decline from 0.9267 (2022 high). That should pave the way back to 0.9267.
EUR/AUD Daily Outlook
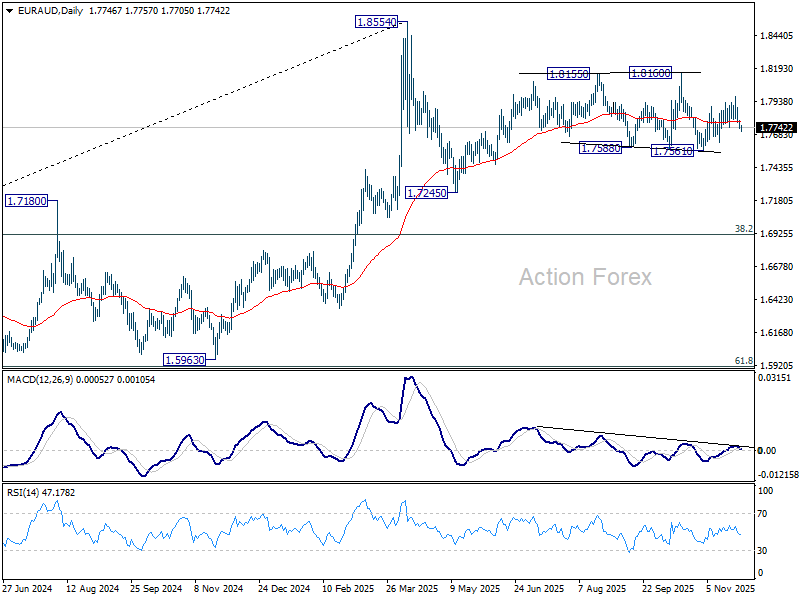
Daily Pivots: (S1) 1.7725; (P) 1.7760; (R1) 1.7781; More...
EUR/AUD's break of 1.7739 supports suggests that rebound from 1.7561 has completed as a corrective move at 1.7976. Intraday bias is back on the downside for retesting 1.7561. For now, risk will stay on the downside as long as 1.7976 holds, in case of recovery.
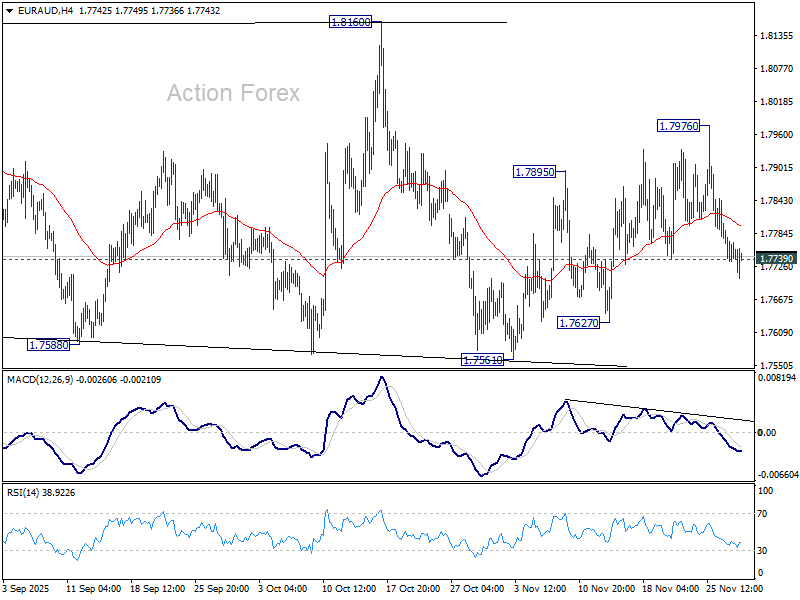
In the bigger picture, price actions from 1.8554 medium term top are seen as a corrective pattern. Sustained break of 55 W EMA (now at 1.7426) will suggest that it's correcting the whole rally from 1.4281 (2022 low). In this case, deeper decline would be seen to 38.2% retracement of 1.4281 to 1.8554 at 1.6922. Nevertheless, strong rebound from 55 W EMA will likely bring resumption of the up trend sooner.
EUR/CHF Daily Outlook
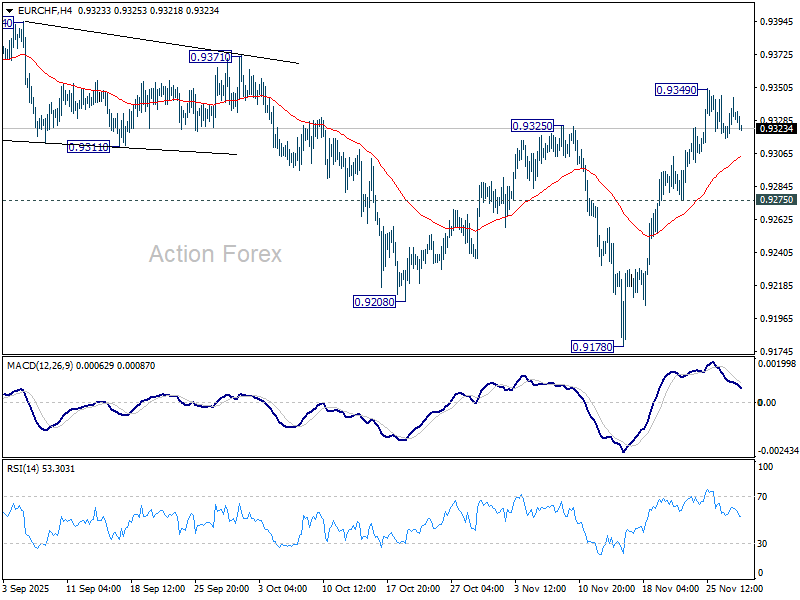
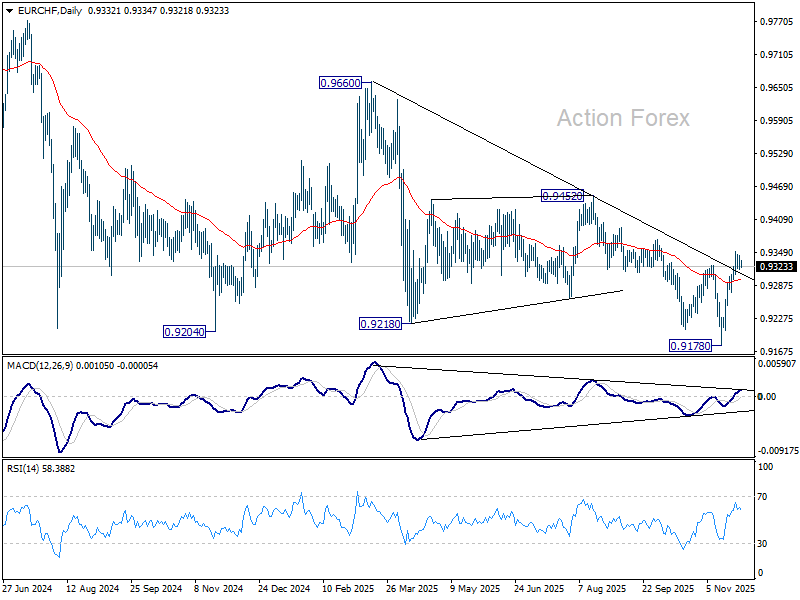
Daily Pivots: (S1) 0.9318; (P) 0.9332; (R1) 0.9345; More....
Intraday bias in EUR/CHF stays neutral and more consolidations could be seen below 0.9349. Fall from 0.9660 could have completed at 0.9178, on bullish convergence condition in D MACD. Above 0.9349 will resume the rise from 0.9178, and target 0.9452 resistance next. However, break of 0.9275 will turn bias back to the downside for 0.9178 low instead.
In the bigger picture, outlook remains bearish with EUR/CHF staying well inside long term falling channel after multiple rejection by 55 W EMA (now at 0.9377). Next target is 61.8% projection of 1.1149 to 0.9407 from 0.9928 at 0.8851. Break of 0.9452 resistance is needed to be the first sign of medium term bottoming. Otherwise, outlook will stay bearish in case of strong rebound.
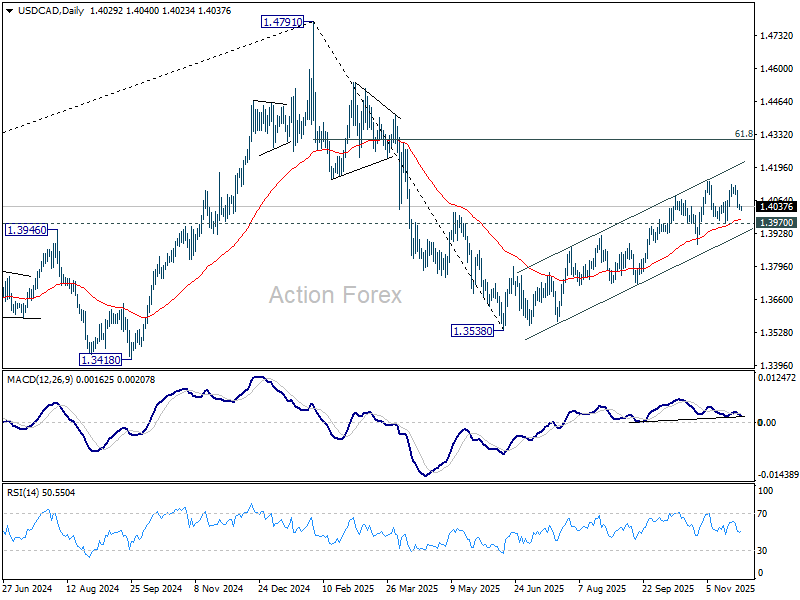
USD/CAD Daily Outlook
Daily Pivots: (S1) 1.4022; (P) 1.4037; (R1) 1.4045; More...
USD/CAD is still bounded in consolidations below 1.4139 and intraday bias remains neutral. Further rally is expected with 1.3970 support intact. On the upside, decisive break of 1.4139 resistance will resume whole rally from 1.3538. Next target is 61.8% retracement of 1.4791 to 1.3538 at 1.4312. However, firm break of 1.3970 will suggest near term reversal, and bring deeper fall back to 1.3886 support.
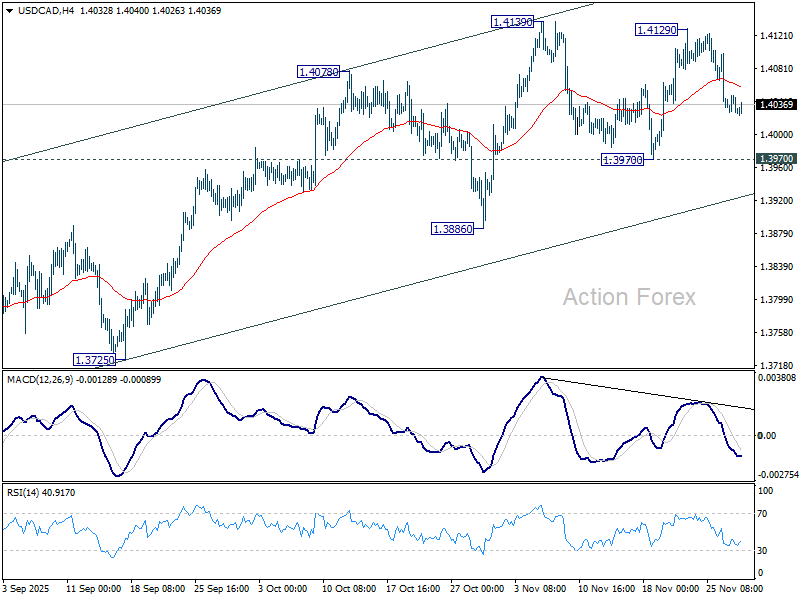
In the bigger picture, price actions from 1.4791 medium term top is likely just unfolding as a correction to up trend from 1.2005 (2021 low), with rise from 1.3538 as the second leg. A third leg should follow before up trend resumption. That is, range trading is set to extend for the medium term. For now, this will remain the favored case as long as 1.3886 support holds. However, firm break of 1.3886 will revive the case that fall from 1.4791 is indeed a larger scale correction.
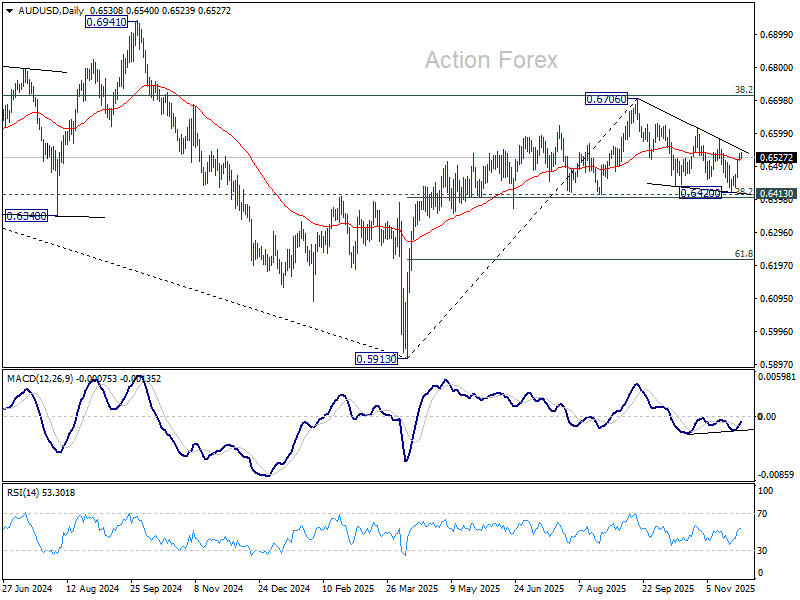
AUD/USD Daily Report
Daily Pivots: (S1) 0.6520; (P) 0.0.6530; (R1) 0.6544; More...
Intraday bias in AUD/USD stays on the upside at for 0.6579 resistance. Decisive break there should confirm that whole fall from 0.6706 has completed as a three wave correction. Stronger rally should then be seen back to retest 0.6706. On the downside, below 0.6483 minor support will turn intraday bias neutral first.
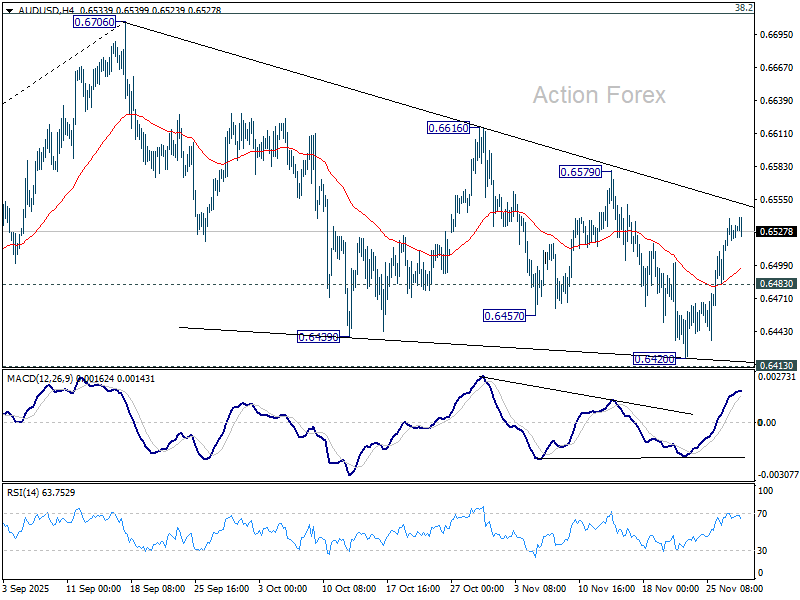
In the bigger picture, there is no clear sign that down trend from 0.8006 (2021 high) has completed. Rebound from 0.5913 is seen as a corrective move. Outlook will remain bearish as long as 38.2% retracement of 0.8006 to 0.5913 at 0.6713 holds. Break of 0.6413 support will suggest rejection by 0.6713 and solidify this bearish case. Nevertheless, considering bullish convergence condition in W MACD, sustained break of 0.6713 will be a strong sign of bullish trend reversal, and pave the way to 0.6941 structural resistance for confirmation.
EUR/USD Daily Outlook
Daily Pivots: (S1) 1.1578; (P) 1.1596; (R1) 1.1615; More…
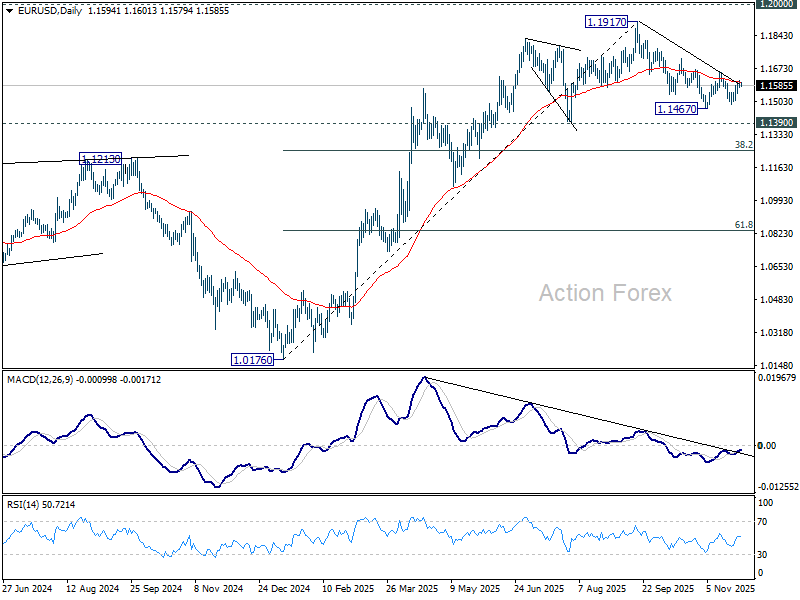
EUR/USD is still bounded in sideway trading and intraday bias remains neutral. Further decline is expected with 1.1655 resistance intact. On the downside, below 1.1490 and 1.1467 will resume the whole decline from 1.1917 high. Next targets are 1.1390, and then 38.2% retracement of 1.0176 to 1.1917 at 1.1252. However, decisive break of 1.1655 will argue that fall from 1.1917 has completed, and turn bias back to the upside for 1.1727 resistance and above.
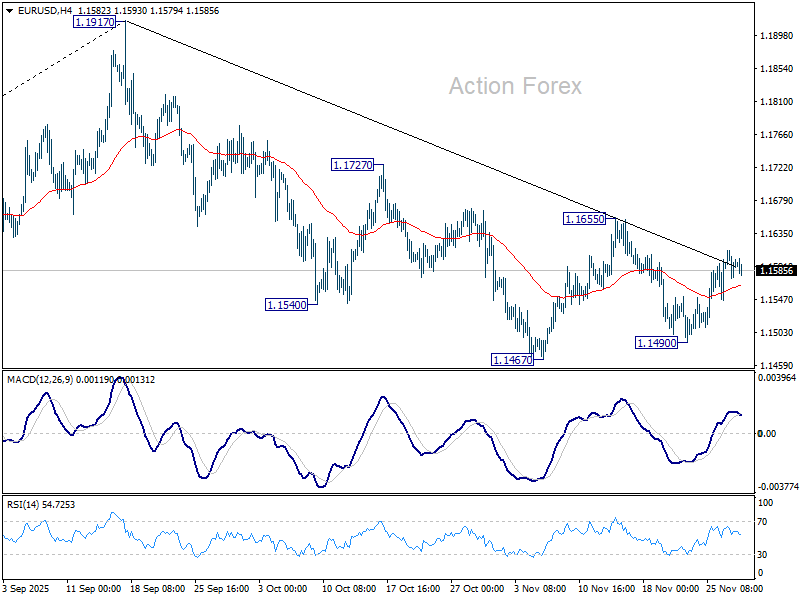
In the bigger picture, considering bearish divergence condition in D MACD, a medium term top is likely in place at 1.1917, just ahead of 1.2 key psychological level. As long as 55 W EMA (now at 1.1328) holds, the up trend from 0.9534 (2022 low) is still in favor to continue. Decisive break of 1.2000 will carry larger bullish implications. However, sustained trading below 55 W EMA will argue that rise from 0.9534 has completed as a three wave corrective bounce, and keep long term outlook bearish.
GBP/USD Daily Outlook
Daily Pivots: (S1) 1.3210; (P) 1.3240; (R1) 1.3270; More...
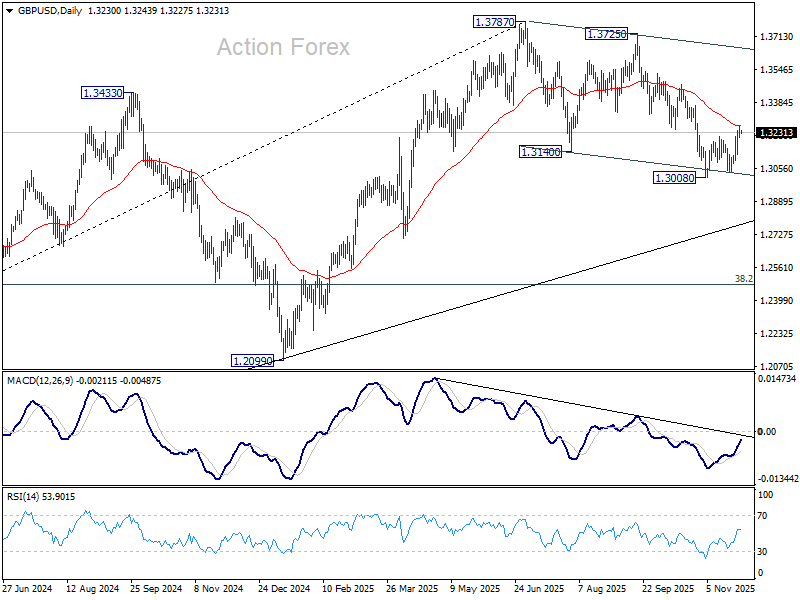
Intraday bias in GBP/USD remains mildly on the upside for the moment. As noted before, corrective fall from 1.3787 could have completed at 1.3008 already. Sustained trading above 55 D EMA (now at 1.3266) should confirm and target a retest on 1.3725/3787 resistance zone. Nevertheless, break of 1.3123 minor support will revive near term bearishness, and bring retest of 1.3008.
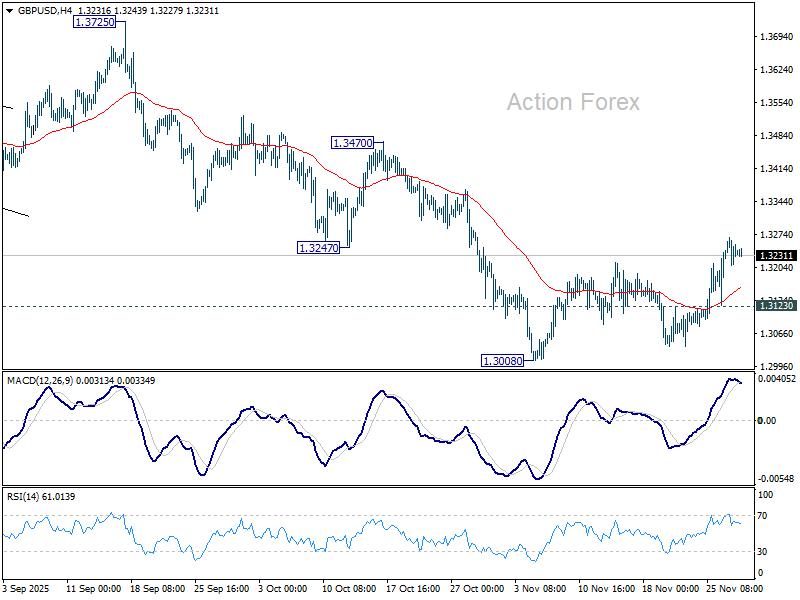
In the bigger picture, the break of 55 W EMA (now at 1.3184) is taken as the first sign that corrective rise from 1.0351 (2022 low) has completed. Decisive break of trend line support (now at 1.2760) will solidify this case and target 38.2% retracement of 1.0351 to 1.3787 at 1.2474 next. Meanwhile, in case of another rise, strong resistance should emerge below 1.4248 (2021 high) to cap upside to preserve the long term down trend.