Sample Category Title
USD/CHF Daily Outlook
Daily Pivots: (S1) 0.8027; (P) 0.8048; (R1) 0.8069; More…
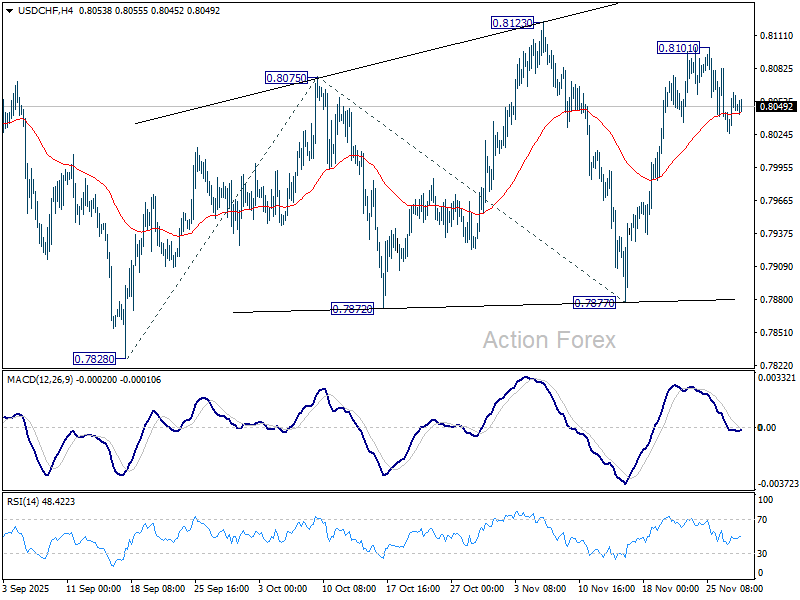
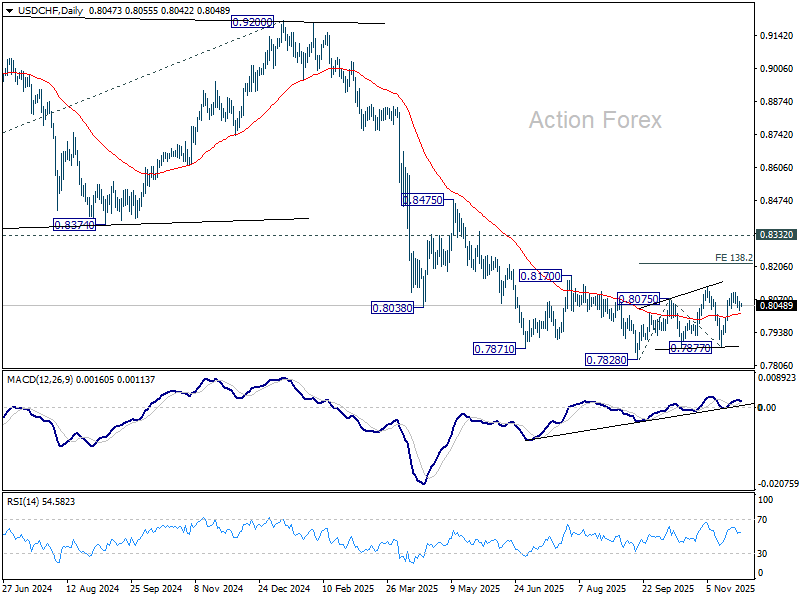
USD/CHF is still bounded in consolidations below 0.8101 and intraday bias remains neutral. Outlook is unchanged that current rise from 0.7877 is still seen as the third leg of the corrective pattern from 0.7828 low. Above 0.8101 will target 0.8123 resistance, and then 138.2% projection of 0.7828 to 0.8075 from 0.7877 at 0.8218. However, sustained break of 55 D EMA (now at 0.8015) will bring deeper fall back to 0.7877 support instead.
In the bigger picture, long term down trend from 1.0342 (2017 high) is still in progress. Next target is 100% projection of 1.0146 (2022 high) to 0.8332 from 0.9200 at 0.7382. In any case, outlook will stay bearish as long as 0.8332 support turned resistance holds (2023 low).
USD/JPY Daily Outlook
Daily Pivots: (S1) 155.85; (P) 156.17; (R1) 156.63; More...
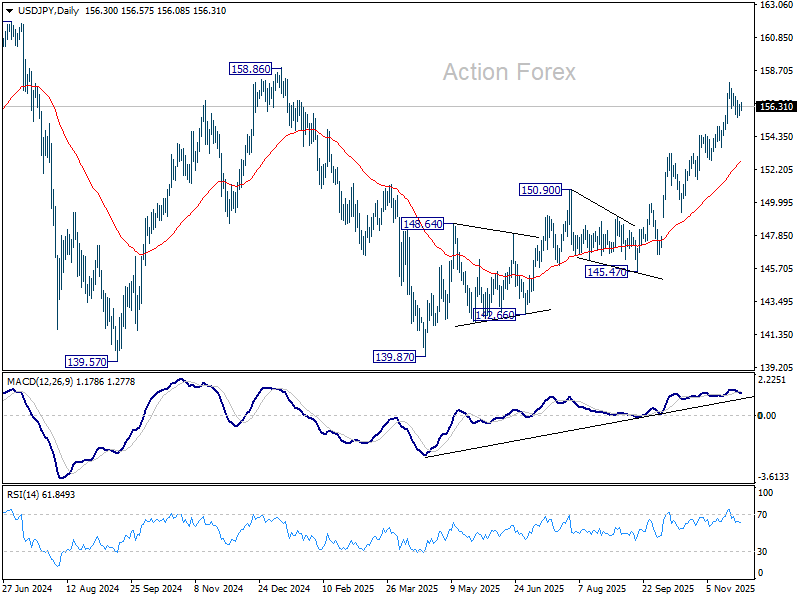
USD/JPY is still bounded in consolidations below 157.88 and intraday bias remains neutral. Downside should be contained by 154.47 resistance turned support. On the upside, break of 157.88 will resume the whole rally from 139.87. Next target is 158.86 structural resistance, and then 161.94 high. However, firm break of 154.47 will bring deeper correction to 55 D EMA (now at 152.63).
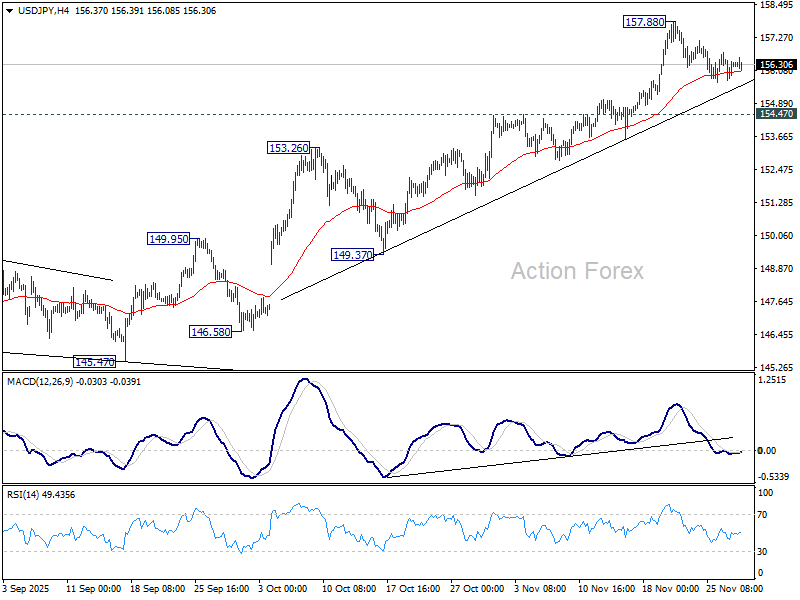
In the bigger picture, current development suggests that corrective pattern from 161.94 (2024 high) has completed with three waves at 139.87. Larger up trend from 102.58 (2021 low) could be ready to resume through 161.94 high. Decisive break of 158.85 structural resistance will solidify this bullish case and target 161.94 for confirmation. On the downside, break of 150.90 resistance turned support will dampen this bullish view and extend the corrective range pattern with another falling leg.
Japan Data Beats But Yen Lacks Traction; Dollar Heads for Worst Week Since Mid-Year
Japan’s data releases were surprisingly strong today, with both industrial output and retail sales showing impressive gains. Combined, they paint a picture of an economy that is slowly regaining momentum on both production and consumption fronts. Yet the Yen remains notably weak, failing to capitalize on the firmer-than-expected numbers.
One of the key constraints remains the inflation mix. Tokyo’s CPI held firm, but the strength is still concentrated in food prices, with rice, coffee, and chocolate continuing to show outsized gains. Services inflation, however, stayed relatively tame. That provides ammunition for the government’s argument that underlying inflation momentum is still insufficient to declare inflation “well anchored”—a key condition for more decisive BoJ tightening.
There is, however, a counter-argument. The reduction in U.S. auto tariffs is already showing up in production figures, and many expect the positive spillover to widen in the months ahead. That narrative supports the BoJ’s October assessment that downside growth risks are easing. With this major external drag fading, BoJ has more room to proceed with gradual tightening without threatening the recovery. However, how soon the BoJ acts is still an open question. The base case remains a January hike, but confidence in that call is low.
Dollar, meanwhile, remains under pressure and is heading toward its worst weekly performance since mid-year. Markets continue to price roughly 85% probability of a 25bps cut in December. That expectation has kept USD recoveries short-lived and contributed to sustained downside across the major pairs. Still, rate expectations beyond December are far from settled. Markets currently assign around 50% probability that the Fed will remain on hold through Q1, viewing the December cut largely as a risk-management move.
With the recent government shutdown delaying key data releases, the 2026 outlook remains highly uncertain. That fog should begin to lift after November non-farm payrolls on December 16 and CPI on December 18, which will provide the missing clarity on labor-market and inflation trends. Until then, any bets on extended easing—or on a prolonged pause—are premature.
In weekly performance terms, Kiwi continues to lead, followed by Aussie and Sterling. Dollar sits at the bottom, ahead of Yen and Swiss Franc, while Euro and Loonie hold mid-table positions.
In Asia, at the time of writing, Nikkei is down -0.04%. Hong Kong HSI is down -0.24%. China Shanghai SSE is up 0.21%. Singapore Strait Times is up 0.46%. Japan 10-year JGB yield is up 0.022 at 1.825.
Tokyo core CPI holds at 2.8% in November, inflation pressures still firm
In Japan, Tokyo’s inflation profile showed little moderation in November, with both core CPI and core-core CPI staying at 2.8% yoy. The readings came in slightly firmer than expected, while headline CPI eased just one-tenth to 2.7%. The stability of these measures indicates that underlying inflation momentum remains intact.
Much of the price momentum came from food, where sharp gains continued. The cost of rice surged 38.5% yoy, coffee beans rose 63.4%, and chocolate jumped 32.5%, reflecting broad price pressures across essential and discretionary categories.
Meanwhile, goods inflation climbed 4.0% yoy. Services inflation eased only marginally to 1.5% from 1.6%.
Japan industrial production surges 1.4% mom in October on auto rebound, but fluctuation to continue
Japan’s industrial production rose 1.4% mom in October, sharply beating expectations of a -0.6% decline. The rebound was driven primarily by a 6.6% jump in motor vehicle output, a sector benefiting from the U.S. tariff rate on Japanese cars being reduced to 15% from 27.5% in mid-September. The improvement highlights how quickly Japanese automakers responded once tariff uncertainty eased.
However, the forward outlook remains soft. Based on its manufacturer survey, METI expects output to fall -1.2% in November and contract a further -2.0% in December. Despite October’s upside surprise, the ministry kept its overall assessment unchanged, saying industrial production “fluctuates indecisively” amid continued uncertainty at home and abroad.
Retail sales also surprised to the upside, rising 1.7% yoy versus expectations of 0.8%. The strength suggests domestic demand remains more resilient than many feared, even as the industrial sector continues to face uneven momentum.
USD/JPY Daily Outlook
Daily Pivots: (S1) 155.85; (P) 156.17; (R1) 156.63; More...
USD/JPY is still bounded in consolidations below 157.88 and intraday bias remains neutral. Downside should be contained by 154.47 resistance turned support. On the upside, break of 157.88 will resume the whole rally from 139.87. Next target is 158.86 structural resistance, and then 161.94 high. However, firm break of 154.47 will bring deeper correction to 55 D EMA (now at 152.63).
In the bigger picture, current development suggests that corrective pattern from 161.94 (2024 high) has completed with three waves at 139.87. Larger up trend from 102.58 (2021 low) could be ready to resume through 161.94 high. Decisive break of 158.85 structural resistance will solidify this bullish case and target 161.94 for confirmation. On the downside, break of 150.90 resistance turned support will dampen this bullish view and extend the corrective range pattern with another falling leg.
USD/JPY Prepares for Fresh Upside Impulse as Bulls Tighten Grip
Key Highlights
- USD/JPY corrected gains and tested the 155.75 support.
- A declining channel is forming with resistance at 156.50 on the 4-hour chart.
- Bitcoin started a recovery wave above $90,000.
- EUR/USD is consolidating below the 1.1620 resistance.
USD/JPY Technical Analysis
The US Dollar failed to continue higher above 158.00 and corrected gains against the Japanese Yen. USD/JPY dipped below 157.00 before the bulls appeared.
Looking at the 4-hour chart, the pair tested the 50% Fib retracement level of the upward move from the 153.61 swing low to the 157.89 high. The pair started a consolidating phase above the 100 simple moving average (red, 4-hour) and the 200 simple moving average (green, 4-hour).
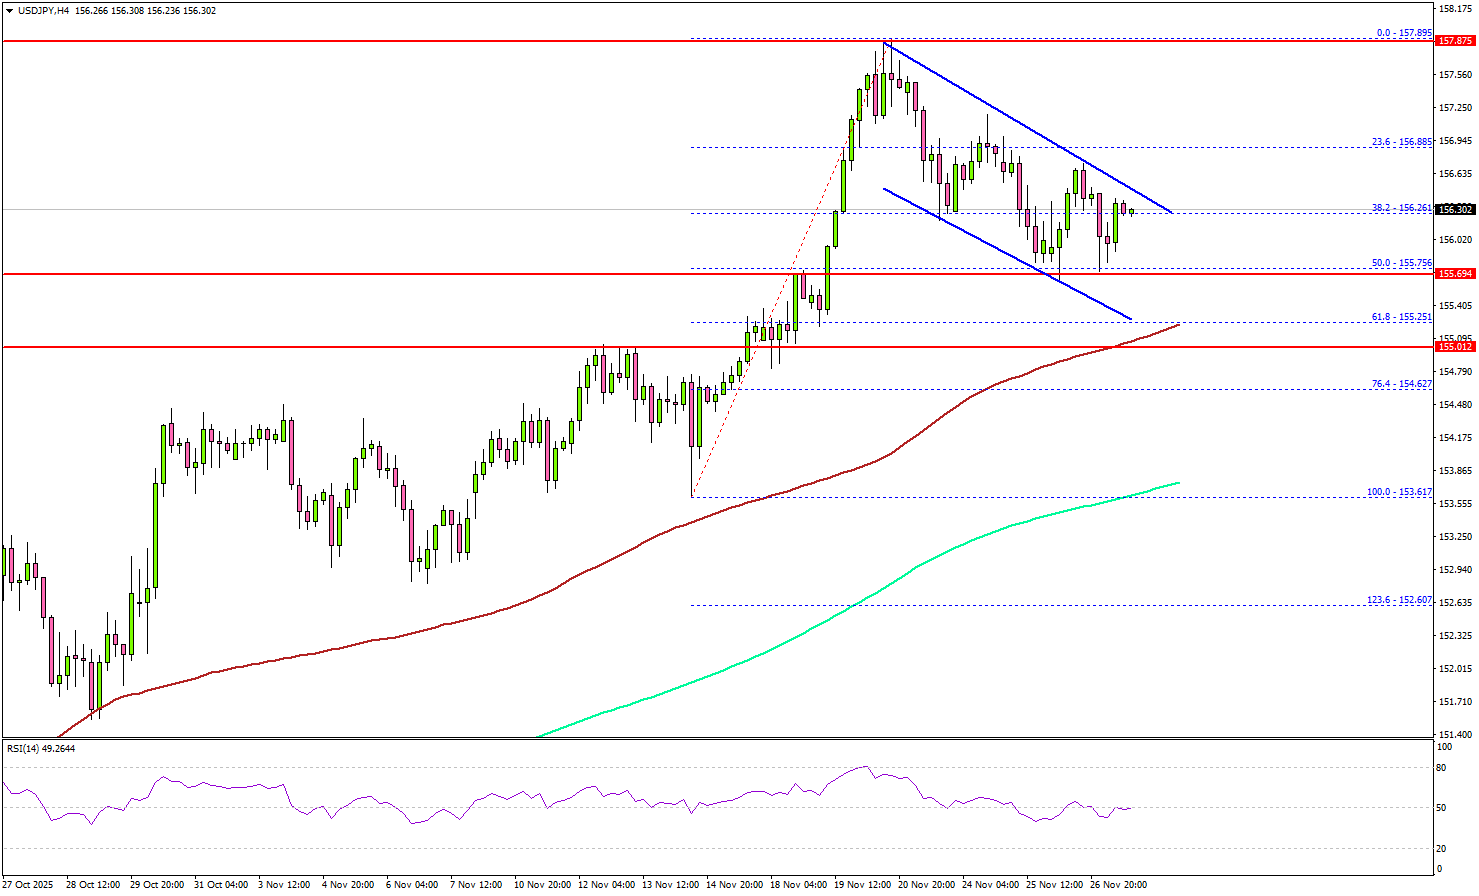
Immediate resistance sits near 156.50. There is also a declining channel forming with resistance at 156.50. A close above the channel barrier could start a fresh surge.
The first key hurdle sits at 157.25. The next area of interest for the bulls could be 157.50. Any more gains could set the pace for a steady increase toward 158.00.
On the downside, there is key support at 155.75. The next support is 155.25 or the 61.8% Fib retracement level of the upward move from the 153.61 swing low to the 157.89 high, below which the pair could start a steady decline to 154.60.
Looking at EUR/USD, the pair remains in a positive zone, but it must surpass 1.1620 to start a decent increase.
Upcoming Key Economic Events:
- Canadian Gross Domestic Product for Q3 2025 (Annualized) – Forecast +0.5%, versus -1.6% previous.
Japan industrial production surges 1.4% mom in October on auto rebound, but fluctuation to continue
Japan’s industrial production rose 1.4% mom in October, sharply beating expectations of a -0.6% decline. The rebound was driven primarily by a 6.6% jump in motor vehicle output, a sector benefiting from the U.S. tariff rate on Japanese cars being reduced to 15% from 27.5% in mid-September. The improvement highlights how quickly Japanese automakers responded once tariff uncertainty eased.
However, the forward outlook remains soft. Based on its manufacturer survey, METI expects output to fall -1.2% in November and contract a further -2.0% in December. Despite October’s upside surprise, the ministry kept its overall assessment unchanged, saying industrial production “fluctuates indecisively” amid continued uncertainty at home and abroad.
Retail sales also surprised to the upside, rising 1.7% yoy versus expectations of 0.8%. The strength suggests domestic demand remains more resilient than many feared, even as the industrial sector continues to face uneven momentum.
Tokyo core CPI holds at 2.8% in November, inflation pressures still firm
In Japan, Tokyo’s inflation profile showed little moderation in November, with both core CPI and core-core CPI staying at 2.8% yoy. The readings came in slightly firmer than expected, while headline CPI eased just one-tenth to 2.7%. The stability of these measures indicates that underlying inflation momentum remains intact.
Much of the price momentum came from food, where sharp gains continued. The cost of rice surged 38.5% yoy, coffee beans rose 63.4%, and chocolate jumped 32.5%, reflecting broad price pressures across essential and discretionary categories.
Meanwhile, goods inflation climbed 4.0% yoy. Services inflation eased only marginally to 1.5% from 1.6%.
Cliff Notes: Looking Through the Noise
Key insights from the week that was.
It was a historic week in Australia, marked by the ABS publishing the October CPI – the first complete set of monthly inflation data. In the event, it surprised markets materially to the upside on both a headline (3.8%yr) and trimmed mean (3.3%yr) basis, although headline came in marginally lower than our forecast of 3.9%. Base effects around electricity prices, due to government subsidies, was the chief culprit behind the lift in headline inflation. On the firmer trimmed mean result: around a third of the basket is running above 5%yr, but most of these components are administered prices, known supply shocks or volatile items, downplaying the impact of demand-side strength. Given this, we do not suspect such a pace of inflation to be sustained in 2026, so we retain our view on the outlook for inflation and interest rates.
Another surprise this week was APRA’s decision to limit high debt-to-income ratio mortgage loans. In this week’s note, Chief Economist Luci Ellis explains the policy change and why it is slightly dovish for the interest rate outlook.
In the run-up to Q3 GDP next Wednesday, we also received two partial indicators of investment.
Construction activity fell –0.7% in Q3, although this was mostly driven by an unwind in mining infrastructure installations. This is treated on a ‘completion’ basis and hence will not impact the National Accounts’ accruals-based estimates of construction activity. Rather, the strong lift in residential construction (4.2%) and bounce-backs in other infrastructure (3.1%) and non-res building (3.7%) point to a strong result for Q3.
Private CAPEX subsequently surprised to the upside, surging 6.4% in Q3 to be up 6.9% over the year. This latest move reflects a large pick-up in machinery and equipment spending (11.5%), centred on data centres and aircrafts. That said, strength was broad-based across many other non-structural industries, suggesting the cyclical upswing is broadening to businesses. The latest estimate to 2025-26 CAPEX plans were upgraded significantly off the back of the latest actual increase, and even after adjusting for inflation, the data suggests real investment intentions are on a firmer footing.
Together, these releases point to a stronger outcome for Q3 GDP. Our preview will be published later today on Westpac IQ.
In the UK, the government handed down the Autumn Budget touted as a classic ‘tax and spend’ budget. On taxation, the government announced a freeze on income tax thresholds until 2031 which will allow bracket creep to boost revenues over time. This is not dissimilar to Australia’s experience and, as we have previously discussed, can lead to a greater squeeze on household incomes over time. Other measures include a ‘mansion tax’ – a surcharge on properties valued above £2 million – and the removal of the two-child benefit cap, ending the limit on tax relief for families with more than two children. The government is also planning to raise the minimum wage by 4.1%, freeze fuel duty and rail fares and cut energy bills. All together, these measures aim to address cost of living measures while remaining fiscally prudent. The proposed budget provides the government with £22bn of headroom under its fiscal rules with borrowing expected to increase by £57bn over the forecast horizon.
Across the pond, the Fed’s Beige Book reported that even though consumer activity appears to have softened, manufacturing activity increased despite businesses remaining cautious about tariff activity. Respondents also noted that there was labour demand has weakened though businesses are opting for hiring freezes and similar strategies rather than outright layoffs. On prices, respondents reported an increase in input cost pressures though not all businesses are passing on these costs. They are being guided by “demand, competitive pressures, prices sensitivity and pushback from customers”. These comments highlighted to clear risks for activity, margins and potential inflationary pressure heading into 2026.
Closer to home, the Reserve Bank of New Zealand cut the OCR by 25bps to 2.25% reflecting greater spare capacity in the economy than previously thought. The RBNZ’s OCR track was revised down to a terminal rate of 2.20% (from 2.55% in August) with the first hike now pushed out to mid-2027. Current monetary policy settings are thought to be stimulatory and are expected to support an economic recovery. We anticipate 2.25% will be the low point for the OCR and the resulting stimulatory conditions will work to support the economy. Policy normalisation will be guided by the timing of recovery; we expect the first hike to occur in December 2026. You can read more about our RBNZ view here.
Finally, the Tokyo CPI print for September came in at 2.7% in headline terms and 2.8% excluding fresh food and energy, in line with market expectations. Food prices decelerated for a fourth month though rice prices, a key staple for Japanese consumers which shape inflation expectations and consumer sentiment, remain elevated. Prices of discretionary items in the CPI basket such as clothing and recreation items also remain high and could help justify another rate increase come December. This week BoJ dove Noguchi reiterated that the Policy Board remain on a path to raise rates but was tight-lipped on timing. Governor Ueda’s speech next week is anticipated to provide more colour on timing.
Bank of Japan’s FX Intervention: Mechanism, Impact, and Historical Precedent
Foreign exchange (FX) intervention in Japan is defined by a unique division of labor where the Bank of Japan (BoJ) acts strictly as an agent for the Ministry of Finance (MOF). FX policy is fundamentally a fiscal decision, executed under the authority of the Minister of Finance to "contain excessive fluctuations" and stabilize exchange rates deemed inconsistent with economic fundamentals.
Operational Mechanics
How the Process Works
Who Decides? The Ministry of Finance (MOF) is the boss. They decide if and how to intervene after looking closely at the currency market.
Who Executes? The Bank of Japan (BoJ) handles the actual buying and selling of currency, following the MOF's specific orders.
Where Does the Money Come From?
To Make the Yen Stronger (Buying Yen): The MOF uses the government’s existing foreign currency reserves (money saved in U.S. dollars, etc.).
To Make the Yen Weaker (Selling Yen): The MOF has to borrow yen by issuing special government debt called Financing Bills (FBs).
Controlling the Money Supply: Even when the BoJ carries out the trade, it makes sure these currency operations don't mess up its main goal of controlling the country's money supply. The intervention is factored into its daily financial planning.
Why Interventions Work (or Don't)
Currency intervention works in two main ways:
Portfolio Balance (Changing the Supply): This involves changing the amount of different assets (like yen vs. dollars) available in the market.
Signaling (Changing Expectations): This is when the government sends a strong message to traders about what future economic policy will be.
The Big Problem for Japan: Japan has had near-zero interest rates (ZIRP) for a very long time.
Normally, actions that change the money supply (unsterilized intervention) are very effective.
However, under ZIRP, cash and short-term government debt are viewed as almost the same thing. This means changing the money supply doesn't have its usual big impact.
The Key to Success: Because the first method is weakened, the success of Japan's currency intervention depends almost entirely on the Signaling channel. The government must show strong credibility and commitment to back up its currency trades with future policy action.
The Limit: Intervention cannot permanently overcome powerful economic forces, such as the persistent difference between Japan's low interest rates and higher rates in other countries. It is only a temporary tool to reduce quick and extreme price swings.
Key Historical Interventions
Japan has historically executed interventions for two distinct purposes:
JPY-Weakening (2003–2004): This phase involved selling JPY and buying vast quantities of USD to prevent the yen's rapid appreciation, which was perceived as a hinderance to the fledgling economic recovery. The scale was record-breaking, totaling approximately ¥35 trillion (USD 340 billion) over 15 months, an amount equating to roughly 7% of Japanese GDP. This massive, concentrated scale was essential to generate a persistent, temporary impact on the exchange rate by leveraging the signaling channel.
JPY-Strengthening (2022 and 2024): Facing extreme depreciation driven by widening interest rate differentials, the MOF executed its first "buy-yen" intervention since 1998 on September 22, 2022, selling USD and buying JPY worth ¥2,838.2 billion.
Japanese Yen Index, Daily Chart
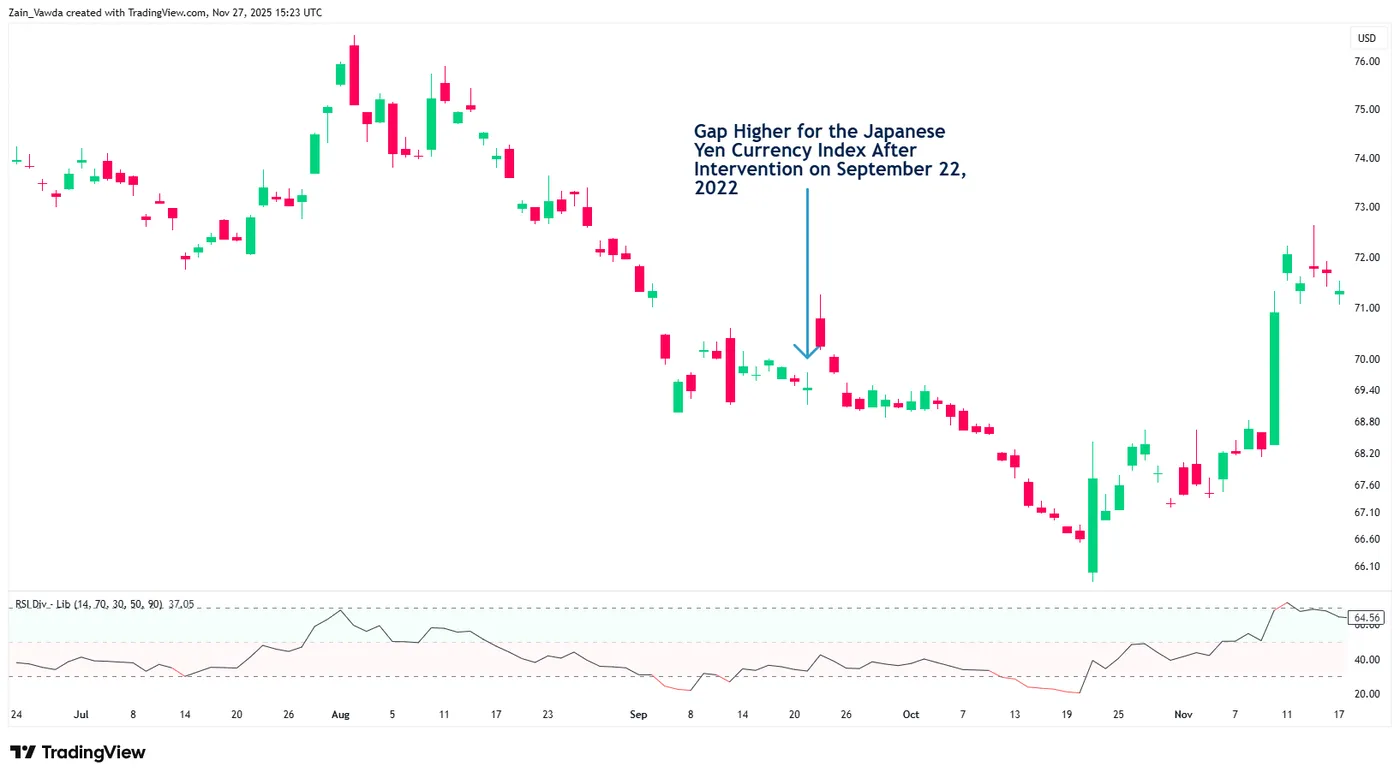
Source: TradingView
Similar apparent actions were taken in April/May 2024. In this modern context, intervention serves strategically to dampen imported inflation and buy time for the BoJ to execute its cautious, gradual monetary normalization path focused on achieving sustainable, wage-led inflation.
The Current Dynamic, USD/JPY
In recent weeks there has been a lot of chatter around possible FX intervention from Japanese officials. In the past, comments made by officials at times did the job as it served to strengthen the Japanese Yen.
Market participants have gotten wiser over time and nowadays tend to ignore comments. This means only action will suffice if the BoJ are really concerned about the value of the Yen.
USD/JPY Daily Chart, November 27, 2025
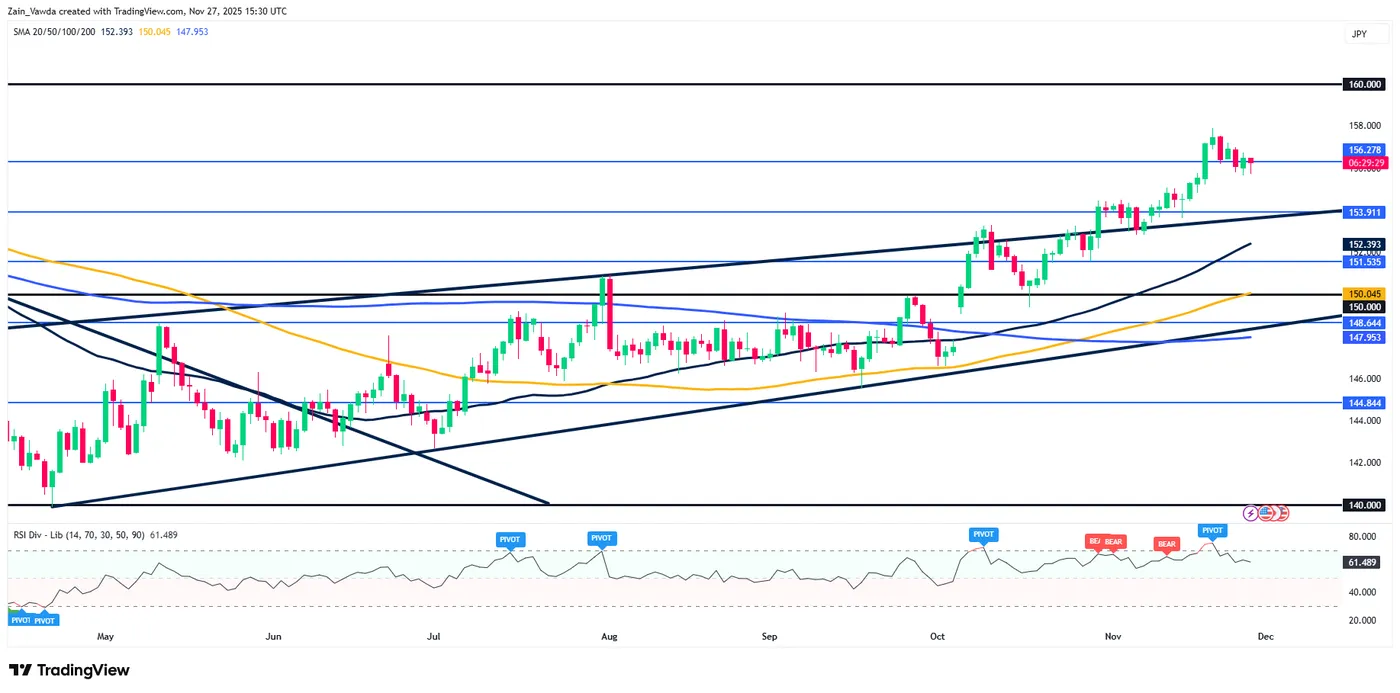
Source: TradingView
NZD/USD Posts Major Reversal Higher After RBNZ Cut – Technical Outlook
While US Markets are away for the Thanksgiving holiday, leaving the broader session fairly calm, the FX markets remain open and active, with all eyes turning to the Kiwi Dollar (NZD), posting yet another strong session.
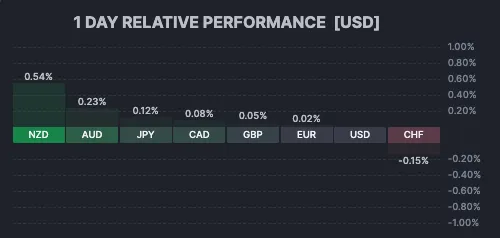
1-Day FX Performance – NZD demarks itself in the calm Thanksgiving Session – Source: Finviz
The Antipodean currency has faced its share of struggles this year, weighed down by a slowing New Zealand economy that proved more sensitive than its neighbor Australia to the slowdown in global trade post-tariffs—a weakness that was starkly evident in a terrible Q2 GDP growth rate of -0.9%.
However, after 325 basis points of cuts, the data has started to come back in a flash. New Zealand Retail Sales just posted a strong beat of 1.9% versus the 0.5% expected, a sign of strong recovery that follows stronger inflation prints and improving Manufacturing PMIs.
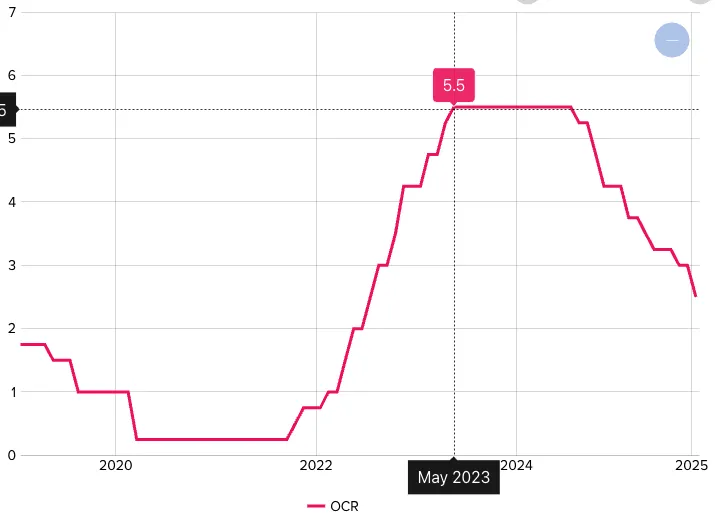
New Zealand's Main Interest Rate (OCR) since 2020 – Source: Reserve Bank of New Zealand
Adding to the shift in sentiment, RBNZ Governor Christian Hawkesby mentioned that a future rate cut faces "significant hurdles."
This wording sufficed the market to assume that the 2.25% rate is the lower bound for the Kiwi rate, with markets now pricing rates to stay put throughout 2026.
This fundamental pivot is a clear sign of renewed strength for the NZD, which is up 2.65% against the US Dollar since last Friday.
Let's look at the major Kiwi pair, NZD/USD, to spot where that takes the action looking forward.
NZD/USD Multi-Timeframe Technical Analysis
Daily Chart
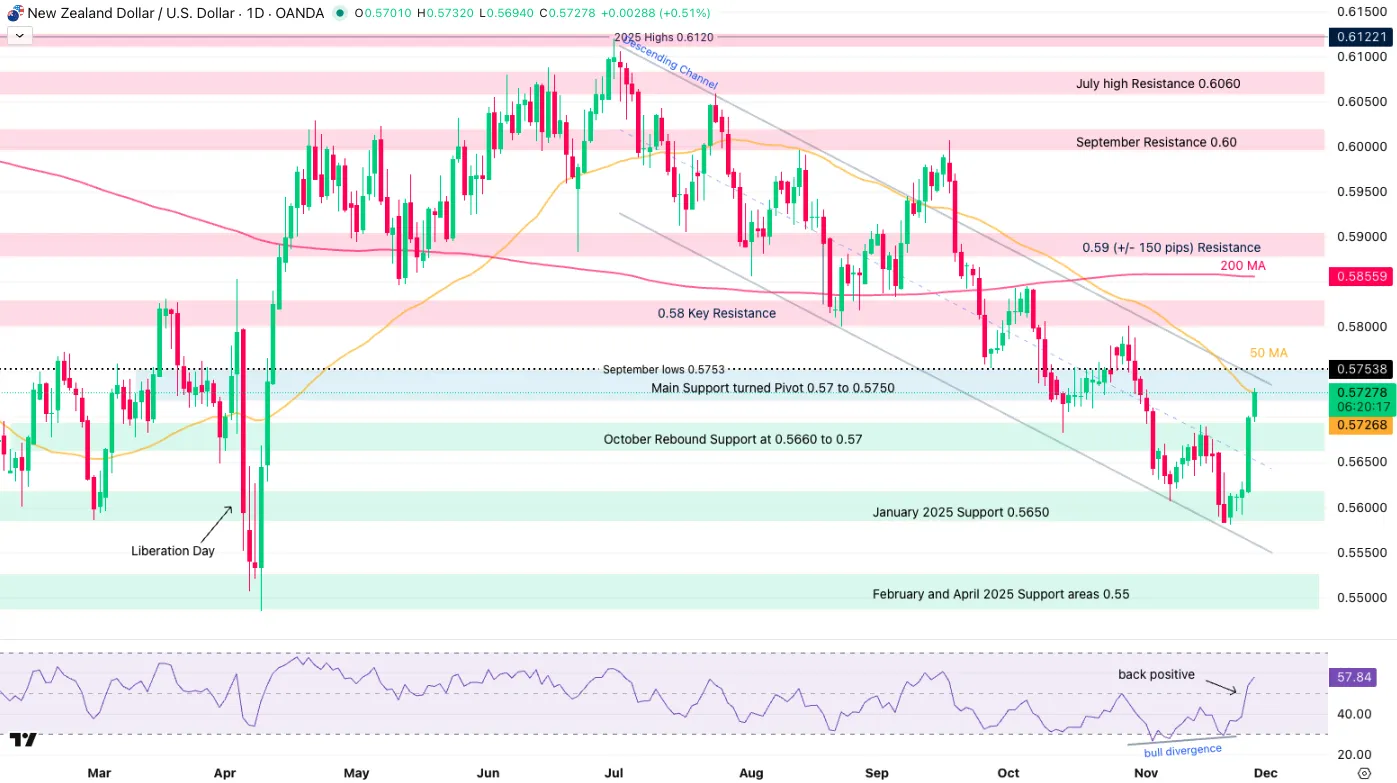
NZD/USD Daily Chart, November 27, 2025 – Source: TradingView
Since July 1st and the comeback of the US Dollar, the NZD/USD has been in a one-way descent, exacerbated by diverging policies between the Fed and the RBNZ.
Taking the pair all the way down to a retest of the Liberation Day troughs in a Monthly Downward Channel, the action is now marking a first clear rebound in months.
Propulsed by changing fundamentals and bullish daily divergences, the ongoing action is strong and will face hurdles at the 50-Day Moving Average (0.57268) and Channel highs.
Still, when looking at how strong the current candles are, these hurdles could be breached soon. For confirmation, look at a session close above the 50-MA.
4H Chart and Technical Levels
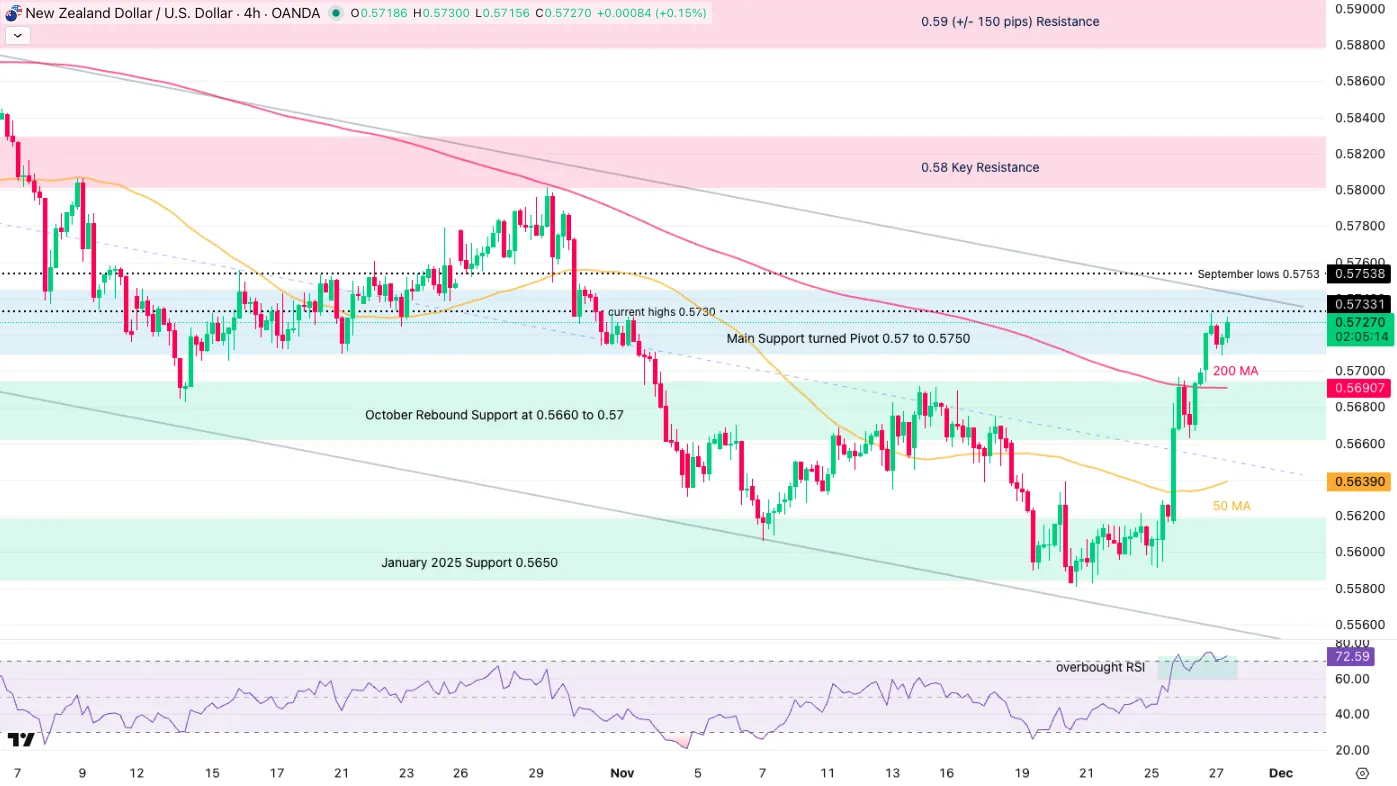
NZD/USD 4H Chart, November 27, 2025 – Source: TradingView
The ongoing rally is also facing a few hurdles on the intraday timeframe:
Overbought RSI levels within the Pivot Zone (0.5720 to 0.5750) could trigger some small mean-reversion.
A retest of the 4H-MA 200 (0.5690) could see higher probability for the action to continue its path higher.
NZD/USD Technical Levels to keep on your charts:
Resistance levels (NZDUSD)
- Main Support turned Pivot 0.5720 to 0.5750 (testing)
- Daily highs 0.5730
- 0.58 Key Resistance
- 0.59 (+/- 150 pips) Resistance
Support levels
- 4H 200 MA at 0.5690
- October Rebound Support at 0.5660 to 0.57
- 4H 50-period MA 0.56385
- January 2025 Support 0.5650
1H Chart
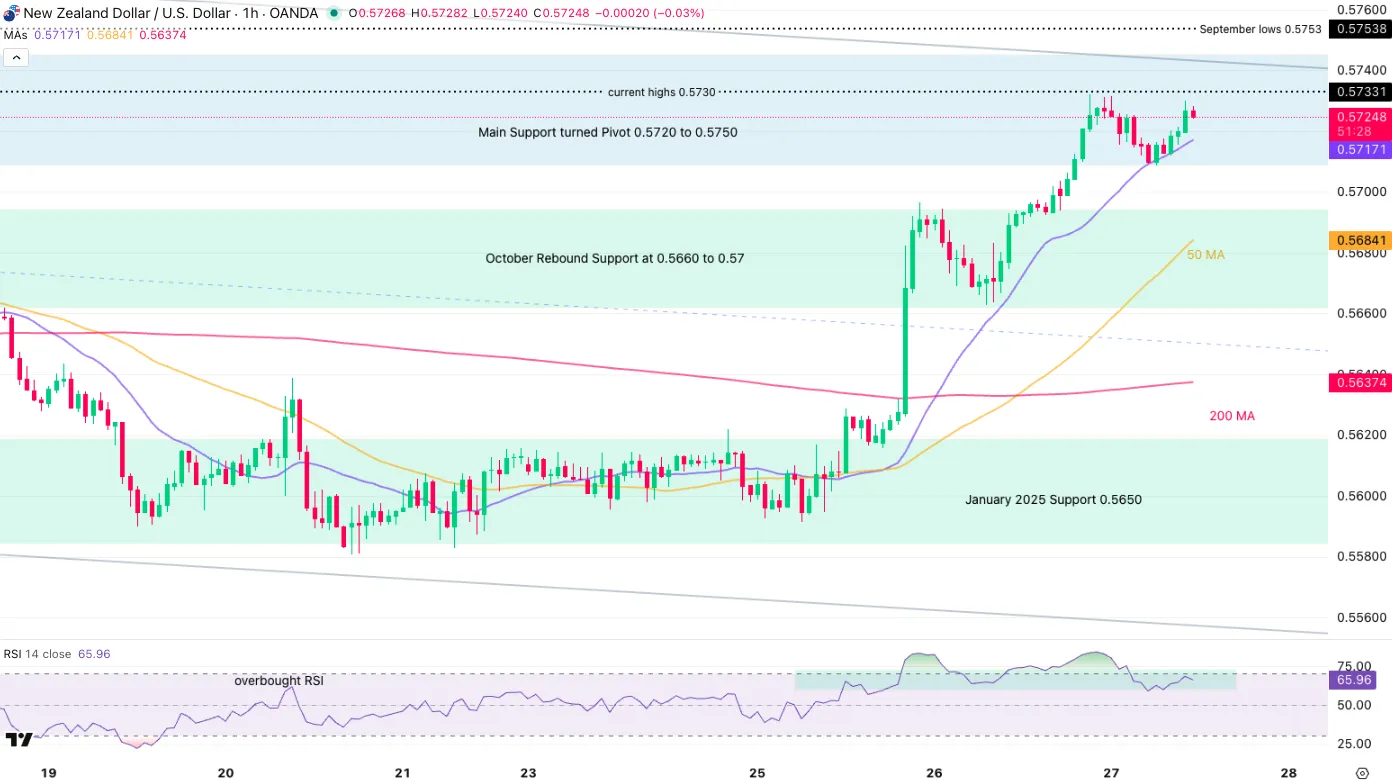
NZD/USD 1H Chart, November 27, 2025 – Source: TradingView
Looking even closer, the action is strongly following the 20-Hour MA at 0.57140;
- A break below would point to a retest of the 4H MA 200 mentioned on the 4H Timeframe
- A break and close above the Daily highs (0.5730) will then face a 100-pip resistance to breakout of the Weekly bear Channel
- Above this, the next Resistance is 600 pips higher.
Safe Trades!
NZDUSD Wave Analysis
NZDUSD: ⬆️ Buy
- NZDUSD broke daily Falling Wedge
- Likely to rise to resistance level 0.5800
NZDUSD currency pair recently reversed from support area between the powerful support level 0.5550 (which has been reversing the price from January) and the lower daily Bollinger Band.
The upward reversal from this support area stopped the previous minor impulse wave 5 of the intermediate impulse wave (C) from September.
Having recently broken the resistance level 0.5700 and the daily Falling Wedge from August, NZDUSD can be expected to rise to the next resistance level 0.5800.