
Sample Category Title
USD/CAD Daily Outlook
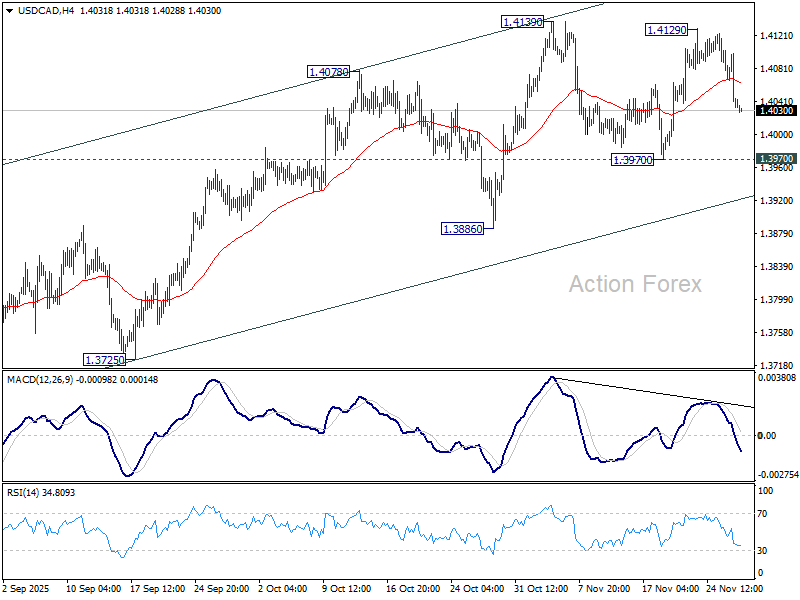
Daily Pivots: (S1) 1.4016; (P) 1.4062; (R1) 1.4088; More...
No change in USD/CAD's outlook as range trading continues below 1.4139. Intraday bias remains neutral for the moment. Further rally is expected with 1.3970 support intact. On the upside, decisive break of 1.4139 resistance will resume whole rally from 1.3538. Next target is 61.8% retracement of 1.4791 to 1.3538 at 1.4312. However, firm break of 1.3970 will suggest near term reversal, and bring deeper fall back to 1.3886 support.
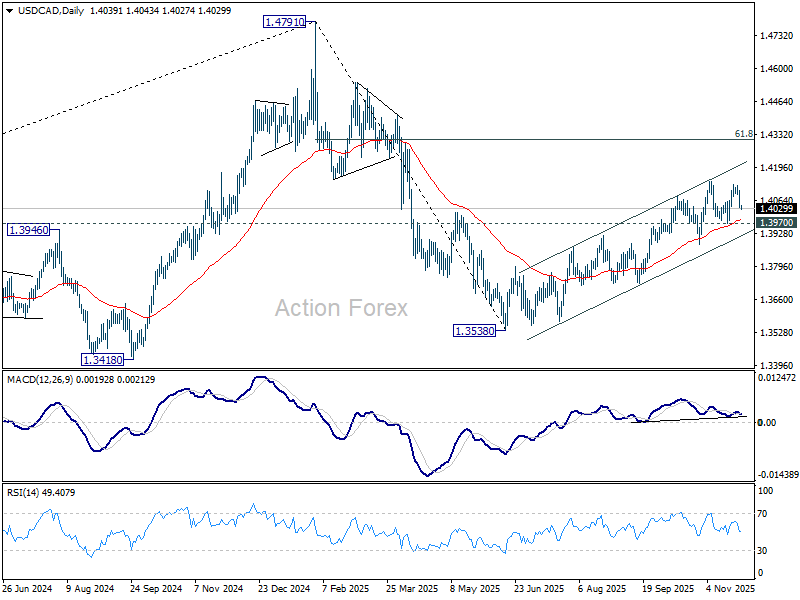
In the bigger picture, price actions from 1.4791 medium term top is likely just unfolding as a correction to up trend from 1.2005 (2021 low), with rise from 1.3538 as the second leg. A third leg should follow before up trend resumption. That is, range trading is set to extend for the medium term. For now, this will remain the favored case as long as 1.3886 support holds. However, firm break of 1.3886 will revive the case that fall from 1.4791 is indeed a larger scale correction.
AUD/USD Daily Report
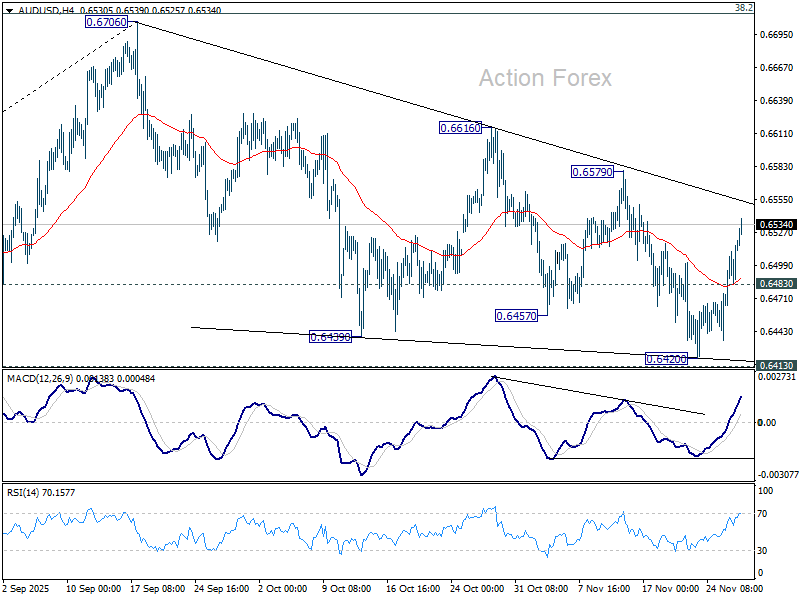
Daily Pivots: (S1) 0.6482; (P) 0.6501; (R1) 0.6538; More...
AUD/USD's rise from 0.6420 accelerates higher today and intraday bias remains on the upside for 0.6579 resistance. Decisive break there should confirm that whole fall from 0.6706 has completed as a three wave correction. Stronger rally should then be seen back to retest 0.6706. On the downside, below 0.6483 minor support will turn intraday bias neutral first.
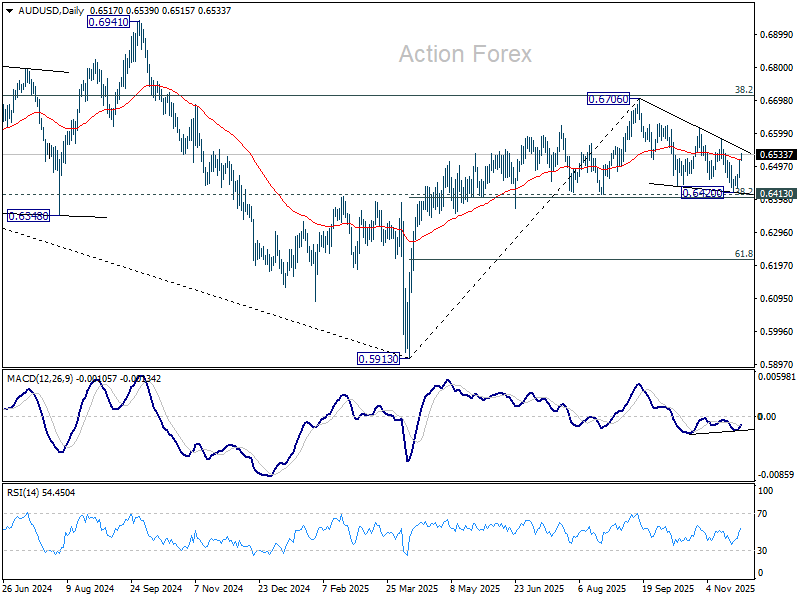
In the bigger picture, there is no clear sign that down trend from 0.8006 (2021 high) has completed. Rebound from 0.5913 is seen as a corrective move. Outlook will remain bearish as long as 38.2% retracement of 0.8006 to 0.5913 at 0.6713 holds. Break of 0.6413 support will suggest rejection by 0.6713 and solidify this bearish case. Nevertheless, considering bullish convergence condition in W MACD, sustained break of 0.6713 will be a strong sign of bullish trend reversal, and pave the way to 0.6941 structural resistance for confirmation.
Kiwi, Aussie Power Ahead While Dollar Sinks
New Zealand Dollar’s broad-based rally extended through today’s Asian session as a run of solid domestic data continued to bolster confidence in the country’s recovery. Strong retail sales in Q3 suggested the rebound is already underway, while the surge in business confidence and activity pointed to a more durable upturn. Together, the indicators painted a picture of improving real-side momentum rather than a temporary sentiment bounce.
The optimism was reinforced by outgoing RBNZ Governor Christian Hawkesby, who made clear that the hurdle for further rate cuts is now very high. Hawkesby emphasized that only a significant deterioration in the outlook would justify a shift away from the central bank’s current projection of holding rates through next year. His comments reinforce the perception that the easing phase has ended and that policy is likely to remain on hold for an extended period.
Aussie also traded strongly, buoyed by shifting expectations around the RBA outlook. Some economists have flipped their calls and now argue the next move may in fact be a rate hike rather than a cut. NAB said that if growth accelerates and the labor market tightens, a hike as early as the first half of 2026 is possible. Some others have taken an even more hawkish view, penciling in increases in both May and August next year.
Dollar, by contrast, stayed broadly weak. Markets are firming expectations that the Fed will deliver another risk-management cut before year-end. At the same time, risk appetite has returned to U.S. equities, while 10-year Treasury yield has slipped back below the 4% mark. These factors are interconnected, reinforcing downward pressure on the greenback as investors rotate toward higher-beta currencies.
Taken together, the macro backdrop has encouraged further selling in the Dollar while supporting the antipodeans, particularly Kiwi. Risk-sensitive FX is benefitting from the combination of solid domestic fundamentals and a friendlier global risk tone.
For the week so far, Kiwi remains at the top, followed by Aussie and then Sterling, which emerged from the UK Autumn Budget without major damage. At the bottom end, Dollar sits as the weakest performer, trailed by Yen and then Loonie. Euro and Swiss Franc are hovering in the middle of the pack.
In Asia, at the time of writing, Nikkei is up 1.24%. Hong Kong HSI is up 0.53%. China Shanghai SSE is up 0.59%. Singapore Strait Times is up 0.44%. Japan 10-year JGB yield is down -0.02 at 1.799. Overnight, DOW rose 0.67%. S&P 500 rose 0.69%. NASDAQ rose 0.82%. 10-year yield fell -0.004 to 3.998.
Noguchi says BoJ can restart hikes gradually as Yen weakness turns problematic
BoJ board member Asahi Noguchi said today that the central bank could resume interest rate hikes once U.S. tariff risks recede, but emphasized that any tightening must "measured, step-by-step".
He warned that maintaining very low real interest rates for too long risks undermining the economy by pushing Yen lower and stoking undesirable inflation. A weaker currency, he said, lifts prices through import costs and boosts exports in a way that can overheat the economy .
Noguchi highlighted that Yen depreciation was once a tailwind during Japan’s deflation era, supporting exporters and helping revive demand. However, "as supply constraints intensify, the positive effects eventually disappear and are replaced by negative effects that merely push inflation higher than needed," he added.<
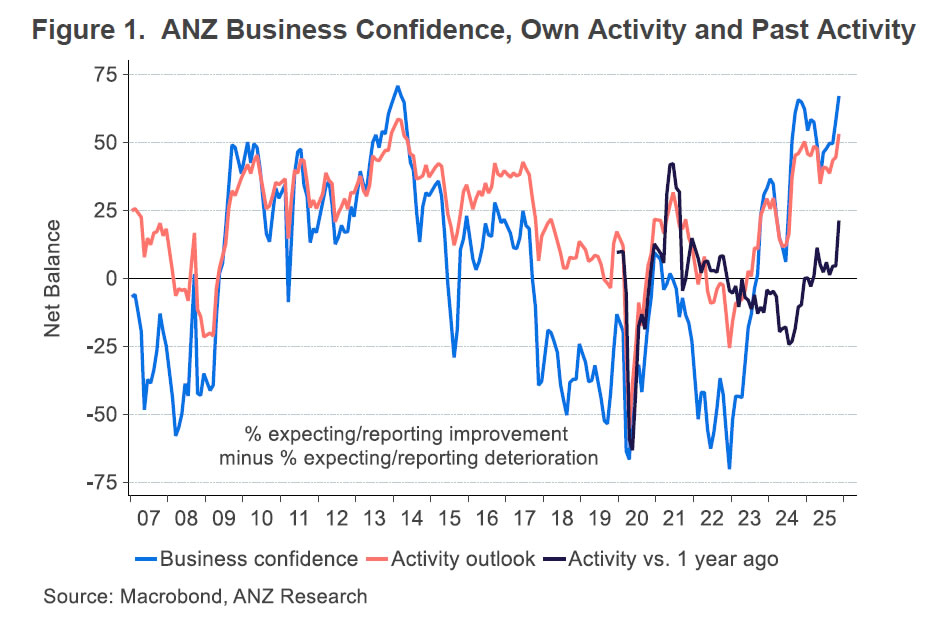
NZ ANZ business confidence jumps to 11 year high, green shoots well established
New Zealand’s ANZ Business Confidence index jumped from 58.1 to 67.1 in November, the strongest reading in 11 years. The survey’s own-activity outlook also surged from 44.6 to 53.1, marking the highest level since 2014 and signaling a material improvement in real economic momentum rather than sentiment alone. ANZ noted that "green shoots are looking well established", with recent gains increasingly rooted in actual activity.
Inflation signals were more mixed. The share of firms planning to raise prices over the next three months climbed from 44% to 51%, the highest since March. However, expected cost increases eased slightly from 76% to 74%, and one-year-ahead inflation expectations were steady at 2.7%. The combination points to stabilizing inflation pressures, but not yet disinflation strong enough to encourage fresh easing from the RBNZ.
ANZ said the underlying improvement in conditions offers reassurance that the pickup is likely to be sustained. With the recovery underway and CPI sitting at the top of the target band, the bank sees little reason for further OCR cuts “barring unexpected developments.”
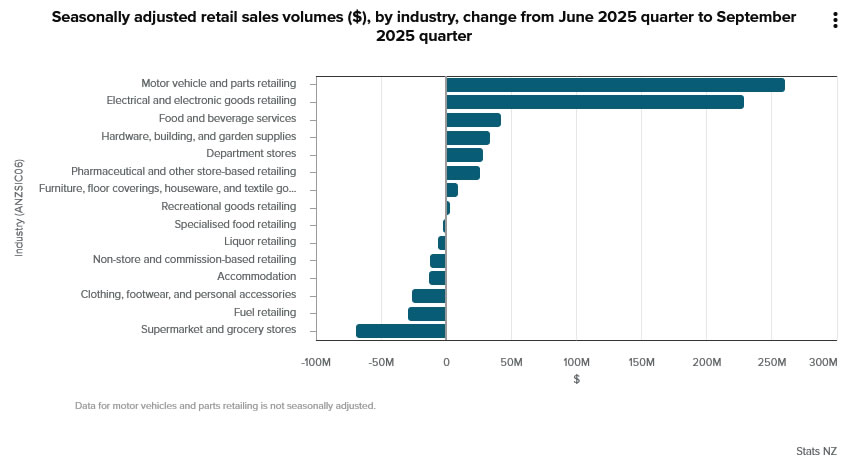
NZ retail sales surge 1.9% qoq in Q3, strongest since 2021
New Zealand retail sales delivered a strong upside surprise in Q3, rising 1.9% qoq versus expectations of 0.6%. Ex-auto sales also beat forecasts, up 1.2% qoq compared with 0.8% consensus.
Statistics New Zealand said this was the largest quarterly increase in retail activity since late 2021, with broad-based gains across the sector. Most industries recorded growth during the September.
The details showed particularly strong demand in motor vehicles and electrical and electronic goods retailing, which posted the biggest increases. Eight of the 15 retail industries reported higher volumes compared with Q2.
Fed's Beige Book: Activity little changed, employment eases, costs still rising
The Fed’s Beige Book indicated an economy that has largely stalled, with activity “little changed” across Districts. Consumer spending declined again, while manufacturing posted slight improvement despite the drag from tariffs and uncertainty around their future path. Outlooks were broadly unchanged, though several contacts flagged "increased risk of slower activity in coming months.
The labor market showed clearer signs of easing, with employment slipping "slightly" and around half of Districts reporting "weaker labor demand". Wage gains were generally "modest", consistent with a gradual loosening in labor conditions.
Price growth remained moderate but continued to reflect tariff-related pressures on input costs, especially in manufacturing and retail. Firms reported uneven ability to pass these higher costs through, with outcomes shaped by competition, consumer sensitivity, and client resistance. While businesses expect cost pressures to persist, "plans to raise prices in the near term were mixed," suggesting a more uneven path for inflation heading into early 2026.
ECB’s Lane says more cooling needed in core inflation
ECB chief economist Philip Lane said overnight that while headline inflation has hovered near target for most of the year, the picture is still flattered by energy deflation. Non-energy inflation remains “well above 2%,” and Lane stressed that a further slowdown is required to ensure inflation is sustainably anchored at target. Nevertheless, he added "We're confident that's going to happen because everything we look at tells us wage dynamics are set to decelerate further."
Lane also addressed concerns around U.S. tariffs and Europe’s export exposure. He argued the hit may be smaller than feared, as the AI-driven expansion and high U.S. government spending are supporting American demand. Under these conditions, firms still have room to pass through tariff-related costs to U.S. importers and consumers. While the U.S. is an important partner, Lane underlined that it is “not the predominant driver of the European economy.”
However, he warned that tariffs are reshaping global trade flows in meaningful ways, particularly in Asia. China is exporting more to Southeast Asia, Southeast Asia is exporting more to the U.S., and China is simultaneously increasing its footprint in Europe and other markets. Lane called this a “very big reconfiguration” of the global system, one that intensifies competitive pressure on European firms even at home.
AUD/USD Daily Report
Daily Pivots: (S1) 0.6482; (P) 0.6501; (R1) 0.6538; More...
AUD/USD's rise from 0.6420 accelerates higher today and intraday bias remains on the upside for 0.6579 resistance. Decisive break there should confirm that whole fall from 0.6706 has completed as a three wave correction. Stronger rally should then be seen back to retest 0.6706. On the downside, below 0.6483 minor support will turn intraday bias neutral first.
In the bigger picture, there is no clear sign that down trend from 0.8006 (2021 high) has completed. Rebound from 0.5913 is seen as a corrective move. Outlook will remain bearish as long as 38.2% retracement of 0.8006 to 0.5913 at 0.6713 holds. Break of 0.6413 support will suggest rejection by 0.6713 and solidify this bearish case. Nevertheless, considering bullish convergence condition in W MACD, sustained break of 0.6713 will be a strong sign of bullish trend reversal, and pave the way to 0.6941 structural resistance for confirmation.
Noguchi says BoJ can restart hikes gradually as Yen weakness turns problematic
BoJ board member Asahi Noguchi said today that the central bank could resume interest rate hikes once U.S. tariff risks recede, but emphasized that any tightening must "measured, step-by-step".
He warned that maintaining very low real interest rates for too long risks undermining the economy by pushing Yen lower and stoking undesirable inflation. A weaker currency, he said, lifts prices through import costs and boosts exports in a way that can overheat the economy .
Noguchi highlighted that Yen depreciation was once a tailwind during Japan’s deflation era, supporting exporters and helping revive demand. However, "as supply constraints intensify, the positive effects eventually disappear and are replaced by negative effects that merely push inflation higher than needed," he added.
GBP/USD Aims Steady Recovery as Buyers Test Early Upside
Key Highlights
- GBP/USD started a recovery wave above the 1.3120 barrier.
- It cleared a key bearish trend line with resistance at 1.3115 on the 4-hour chart.
- Gold could extend upside if it clears the $4,200 resistance.
- WTI Crude Oil prices declined steadily below $60.00.
GBP/USD Technical Analysis
The British Pound formed a base above 1.3050 against the US Dollar. GBP/USD started a steady recovery and climbed above 1.3100.
Looking at the 4-hour chart, the pair cleared a key bearish trend line with resistance at 1.3115. There was a move above the 38.2% Fib retracement level of the downward move from the 1.3471 swing high to the 1.3009 low.
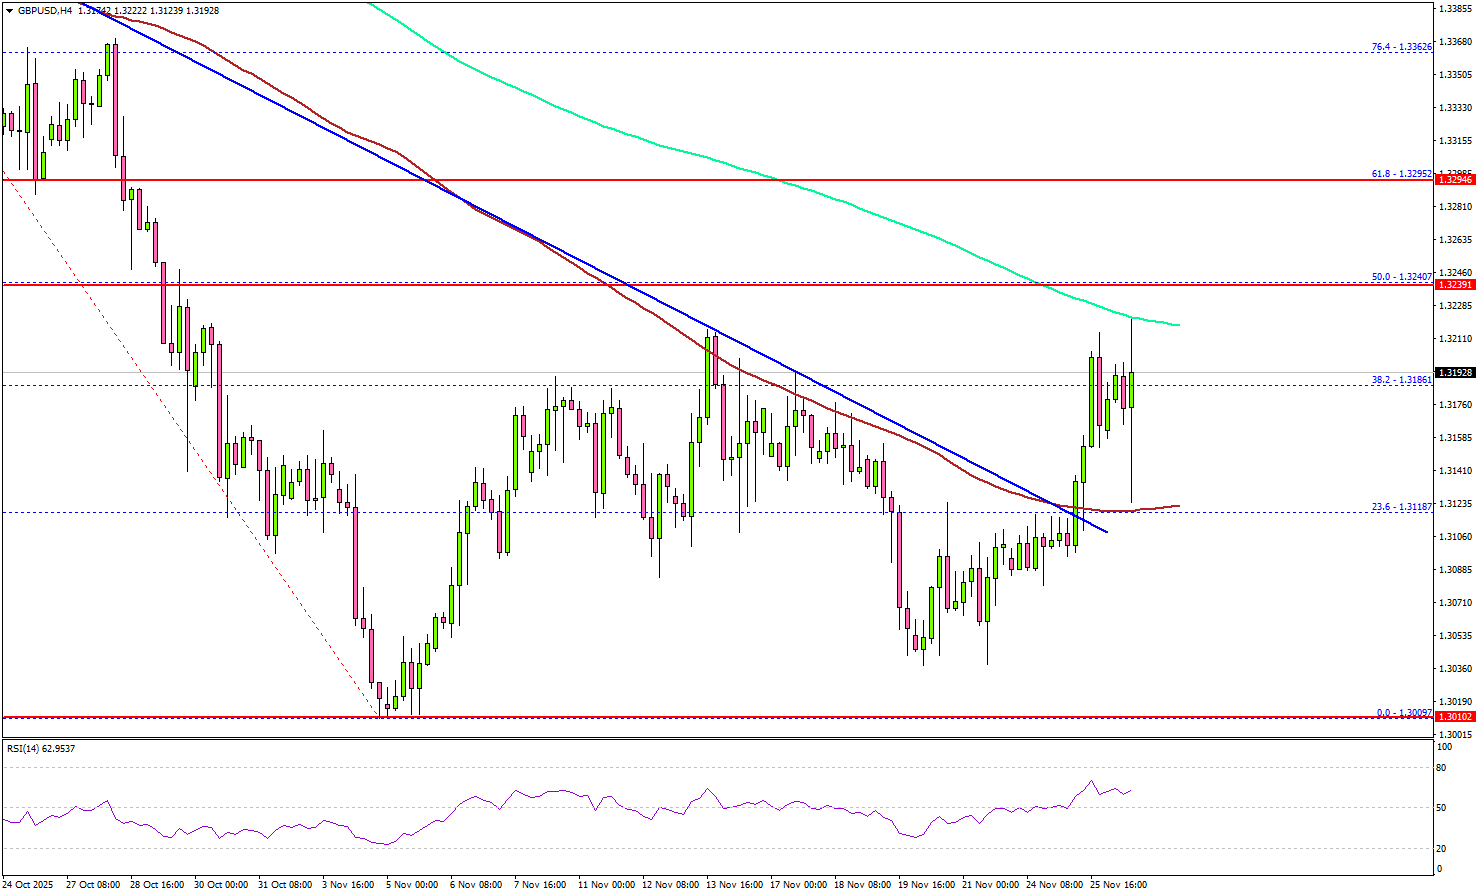
The pair settled above the 100 simple moving average (red, 4-hour) and tested the 200 simple moving average (green, 4-hour). Immediate resistance sits near 1.3220.
The first key hurdle sits at 1.3240 and the 50% Fib retracement level of the downward move from the 1.3471 swing high to the 1.3009 low. The next area of interest for the bulls could be 1.3295. Any more gains could set the pace for a steady increase toward 1.3350.
On the downside, there is a key support at 1.3160. The next support is 1.3120, below which the pair could start a steady decline to 1.3050. A close below 1.3050 could start a pullback toward 1.3000.
Looking at Gold, the bulls seem to be in action, but they need to push the price above $4,200 for more upside.
NZ ANZ business confidence jumps to 11 year high, green shoots well established
New Zealand’s ANZ Business Confidence index jumped from 58.1 to 67.1 in November, the strongest reading in 11 years. The survey’s own-activity outlook also surged from 44.6 to 53.1, marking the highest level since 2014 and signaling a material improvement in real economic momentum rather than sentiment alone. ANZ noted that "green shoots are looking well established", with recent gains increasingly rooted in actual activity.
Inflation signals were more mixed. The share of firms planning to raise prices over the next three months climbed from 44% to 51%, the highest since March. However, expected cost increases eased slightly from 76% to 74%, and one-year-ahead inflation expectations were steady at 2.7%. The combination points to stabilizing inflation pressures, but not yet disinflation strong enough to encourage fresh easing from the RBNZ.
ANZ said the underlying improvement in conditions offers reassurance that the pickup is likely to be sustained. With the recovery underway and CPI sitting at the top of the target band, the bank sees little reason for further OCR cuts “barring unexpected developments.”
NZ retail sales surge 1.9% qoq in Q3, strongest since 2021
New Zealand retail sales delivered a strong upside surprise in Q3, rising 1.9% qoq versus expectations of 0.6%. Ex-auto sales also beat forecasts, up 1.2% qoq compared with 0.8% consensus.
Statistics New Zealand said this was the largest quarterly increase in retail activity since late 2021, with broad-based gains across the sector. Most industries recorded growth during the September.
The details showed particularly strong demand in motor vehicles and electrical and electronic goods retailing, which posted the biggest increases. Eight of the 15 retail industries reported higher volumes compared with Q2.
Fed’s Beige Book: Activity little changed, employment eases, costs still rising
The Fed’s Beige Book indicated an economy that has largely stalled, with activity “little changed” across Districts. Consumer spending declined again, while manufacturing posted slight improvement despite the drag from tariffs and uncertainty around their future path. Outlooks were broadly unchanged, though several contacts flagged "increased risk of slower activity in coming months.
The labor market showed clearer signs of easing, with employment slipping "slightly" and around half of Districts reporting "weaker labor demand". Wage gains were generally "modest", consistent with a gradual loosening in labor conditions.
Price growth remained moderate but continued to reflect tariff-related pressures on input costs, especially in manufacturing and retail. Firms reported uneven ability to pass these higher costs through, with outcomes shaped by competition, consumer sensitivity, and client resistance. While businesses expect cost pressures to persist, "plans to raise prices in the near term were mixed," suggesting a more uneven path for inflation heading into early 2026.
ECB’s Lane says more cooling needed in core inflation
ECB chief economist Philip Lane said overnight that while headline inflation has hovered near target for most of the year, the picture is still flattered by energy deflation. Non-energy inflation remains “well above 2%,” and Lane stressed that a further slowdown is required to ensure inflation is sustainably anchored at target. Nevertheless, he added "We're confident that's going to happen because everything we look at tells us wage dynamics are set to decelerate further."
Lane also addressed concerns around U.S. tariffs and Europe’s export exposure. He argued the hit may be smaller than feared, as the AI-driven expansion and high U.S. government spending are supporting American demand. Under these conditions, firms still have room to pass through tariff-related costs to U.S. importers and consumers. While the U.S. is an important partner, Lane underlined that it is “not the predominant driver of the European economy.”
However, he warned that tariffs are reshaping global trade flows in meaningful ways, particularly in Asia. China is exporting more to Southeast Asia, Southeast Asia is exporting more to the U.S., and China is simultaneously increasing its footprint in Europe and other markets. Lane called this a “very big reconfiguration” of the global system, one that intensifies competitive pressure on European firms even at home.
Gold (XAU/USD) Price Up 2.5% for the Week. Is a Break of $4200/oz a Certainty?
Gold prices are currently maintaining a robust uptrend and trading near two-week highs, around the $4150/oz handle. The precious metal is poised to log its fourth consecutive monthly gain, building on a record-setting surge experienced in October that briefly targeted the $4,400 area.
The continuation of the bullish rally could be a sign that the current rally still has deep support. The bullish trend is reinforced by technical indicators that confirm strong underlying momentum, following a selloff that allowed some profit taking.
Foundational Drivers: The Federal Reserve Pivot Proxy
The current rally and supporting Gold’s valuation is the aggressive market expectation of impending monetary policy easing by the US Federal Reserve. Current forecasts indicate an 84% probability of a US interest rate cut in December , with broader market consensus pricing in approximately 90 basis points of easing by the end of 2026.
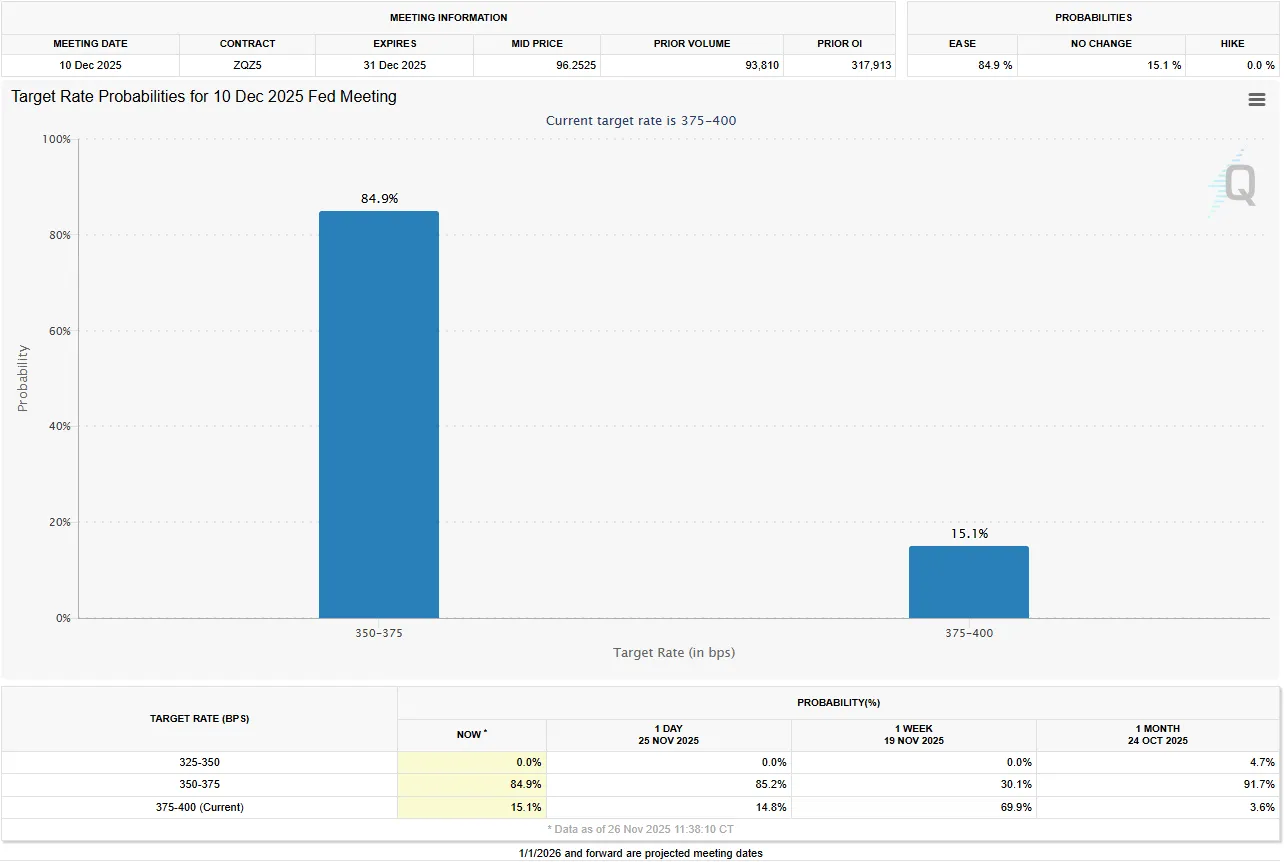
Source: CME FedWatch Tool
Market participants are expecting the FED to start cutting rates despite mixed rhetoric. The expectations do keep the US Dollar (USD) under broad pressure and force US Treasury yields to drift lower. Gold is a beneficiary in this environment as declining real yields reduce the opportunity cost of holding the metal.
These easing expectations are validated by a sequence of disappointing US economic releases, including softer ADP employment numbers, weaker Retail Sales figures, and a notable drop in the Conference Board’s Consumer Confidence reading for November. Market participants are continuing a recent trend by actively front-running the central bank’s mandated reaction function.
Technical Outlook - Gold (XAU/USD)
Looking at the four-hour chart below, the technical picture is strong.
Price action looks favorable with the RSI above 50, a sign of the bullish momentum.
Price continues to trade some way away from both the 50 and 100-day MA. This could lead to a short-term pullback at some stage.
Given the Thanksgiving Holiday in the US tomorrow, markets could see lower levels of liquidity. This could keep Gold prices rangebound as well.
Keep a close watch on Ukraine-Russia developments. Any sign that a deal may be edging close could lead to increased selling pressure on Gold and thus push Gold prices lower.
Gold (XAU/USD) Four-Hour Chart, November 26, 2025
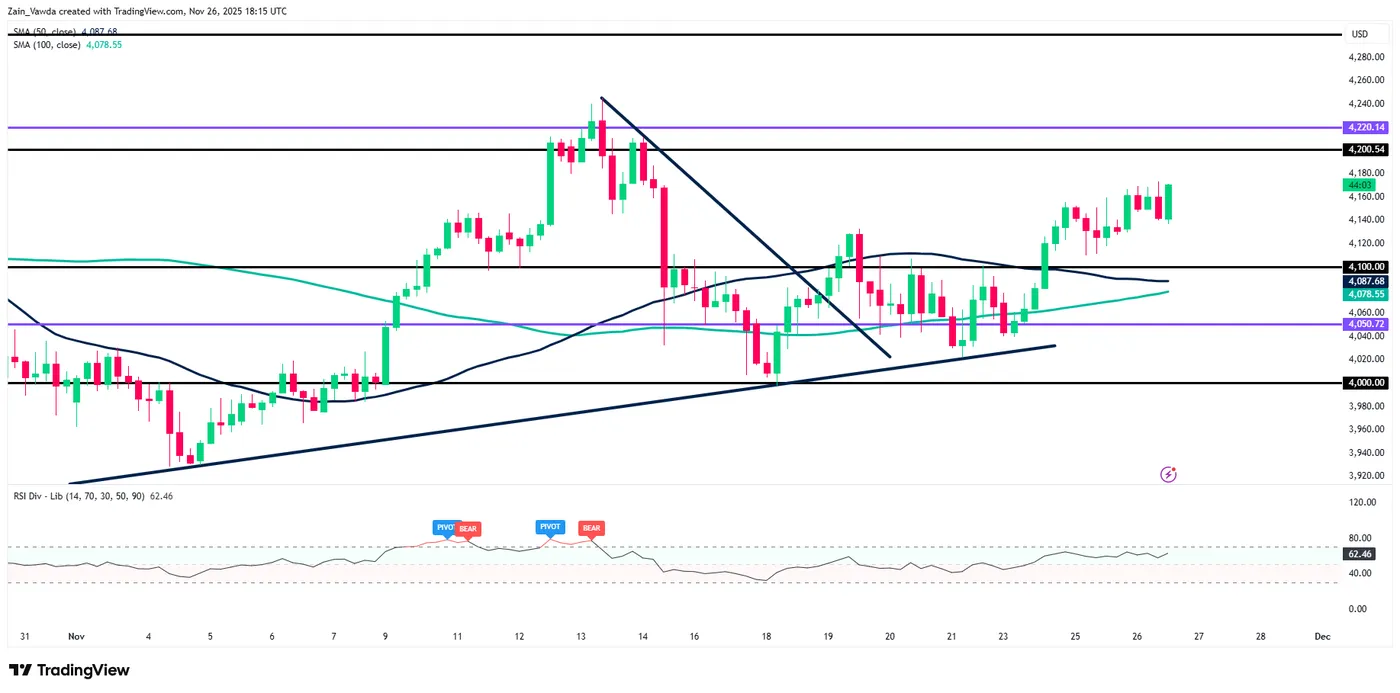
Source: TradingView (click to enlarge)
Gold: Key Near-Term Technical Levels
As mentioned above, bulls may struggle to break beyond the $4200/ounce heading into the weekend as liquidity is expected to be thin. This is not to say it is not a possibility.
Key levels to pay attention to include
- $4,380, All-Time High/Previous Record High (October 17)
- $4,220, Critical Breakout Resistance Key threshold for acceleration
- $4042, Key to Uptrend Integrity