
Sample Category Title
USD/CAD Daily Outlook
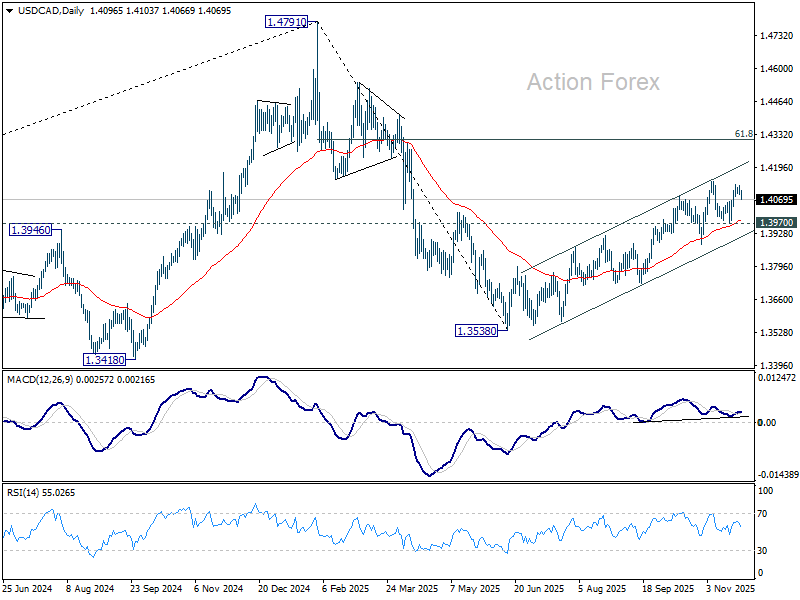
Daily Pivots: (S1) 1.4084; (P) 1.4105; (R1) 1.4119; More...
USD/CAD failed to break through 1.4139 resistance and retreated. Intraday bias remains neutral and more consolidations could be seen. Further rally is expected with 1.3970 support intact. On the upside, decisive break of 1.4139 resistance will resume whole rally from 1.3538. Next target is 61.8% retracement of 1.4791 to 1.3538 at 1.4312.
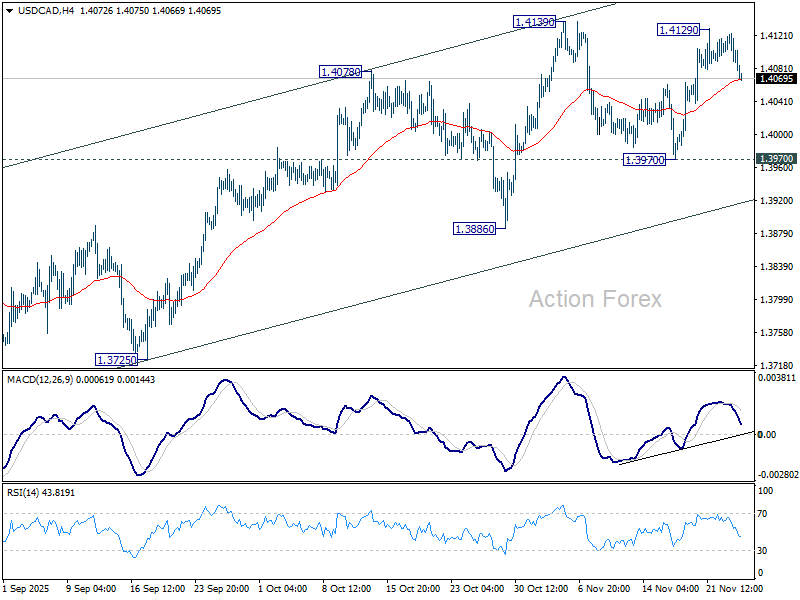
In the bigger picture, price actions from 1.4791 medium term top is likely just unfolding as a correction to up trend from 1.2005 (2021 low), with rise from 1.3538 as the second leg. A third leg should follow before up trend resumption. That is, range trading is set to extend for the medium term. For now, this will remain the favored case as long as 1.3886 support holds. However, firm break of 1.3886 will revive the case that fall from 1.4791 is indeed a larger scale correction.
AUD/USD Daily Report
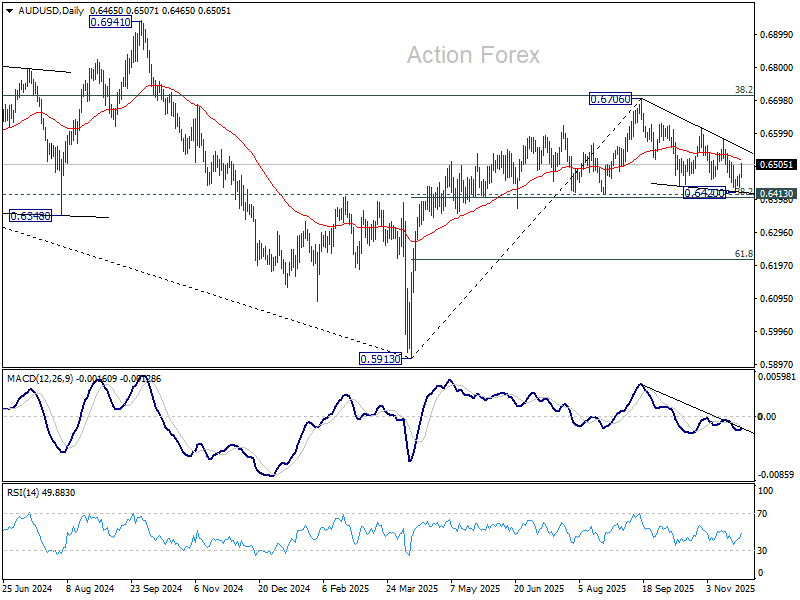
Daily Pivots: (S1) 0.6445; (P) 0.6461; (R1) 0.6485; More...
AUD/USD's extended rebound and break of 0.6501 resistance suggests short term bottoming at 0.6420. Intraday bias is back on the upside for 06579 resistance. Firm break there should confirm that whole fall from 0.6706 has completed as a three wave correction. Stronger rally should then be seen back to retest 0.6706. On the downside, sustained break of 0.6413 cluster (38.2% retracement of 0.5913 to 0.6706 at 0.6403) should confirm near term bearish reversal.
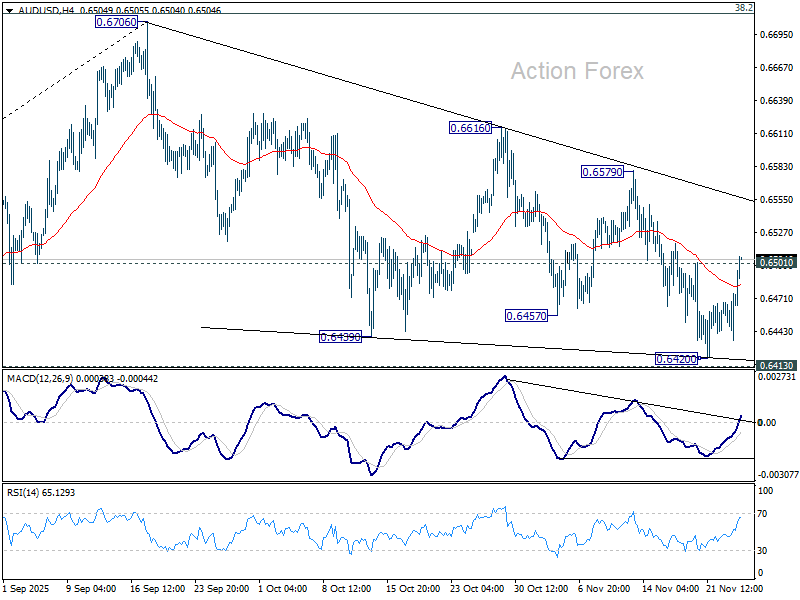
In the bigger picture, there is no clear sign that down trend from 0.8006 (2021 high) has completed. Rebound from 0.5913 is seen as a corrective move. Outlook will remain bearish as long as 38.2% retracement of 0.8006 to 0.5913 at 0.6713 holds. Break of 0.6413 support will suggest rejection by 0.6713 and solidify this bearish case. Nevertheless, considering bullish convergence condition in W MACD, sustained break of 0.6713 will be a strong sign of bullish trend reversal, and pave the way to 0.6941 structural resistance for confirmation.
Kiwi, Aussie Dominate; Sterling Awaits for High-Stakes Budget
Risk-on sentiment extended through Asian session, from intensifying bets on December Fed rate cut. The shift in sentiment sent US stocks higher overnight, and pushed 10-year yield briefly below 4% handle. Kiwi and Aussie are the biggest beneficiary of this backdrop, with both additionally supported by domestic developments.
Kiwi is the standout performer as markets digested RBNZ’s hawkishly framed rate cut. By signaling that the OCR is likely already at its trough and projecting only a modest lift through 2027, the central bank effectively pushed back against earlier expectations of a deeper easing cycle. Aussie also attracted buyers after Australia’s inflation data showed sharper acceleration than expected. Any RBA rate cut is pushed further into 2026.
Yen, however, remained soft despite renewed chatter around a December BoJ hike. Reuters reported that the central bank is preparing markets for a possible move as early as next month, following a key meeting between Prime Minister Sanae Takaichi and Governor Kazuo Ueda that appeared to remove political hurdles. Even so, sources suggested a close call between a December hike and a delay to January, with the Fed decision a week earlier likely to influence the decision. But for now, Yen traders appear e unconvinced.
Attention turns next to the UK Autumn Budget, which carries unusually high uncertainty after contradictory messaging from Chancellor Rachel Reeves on tax measures. Markets have little guidance on the scope or direction of fiscal changes, leaving room for large surprises. Gilt reaction will be the clearest test of investor confidence in the government’s fiscal stance. Sterling will trade off Gilt yields, but inversely—this is a confidence story, not a yield-seeking one.
For the week so far, Kiwi leads the performance board, followed by Aussie and Sterling. Dollar sits at the bottom, with Loonie and Yen also heavy, while Euro and Swiss Franc hover around the middle of the pack.
In Asia, at the time of writing, Nikkei is up 1.98%. Hong Kong HSI is up 0.44%. China Shanghai SSE is up 0.14%. Singapore Strait Times is up 0.56%. Japan 10-year JGB yield is up 0.015 at 1.819. Overnight, DOW rose 1.43%. S&P 500 rose 0.91%. NASDAQ rose 0.67%. 10-year yield fell -0.036 to 4.002.
RBNZ delivers 25bps cut but signals little room for further easing
RBNZ cut the OCR by 25bps to 2.25% as widely expected, but the tone of the announcement was more hawkish than markets had anticipated.
Policymakers revealed they had debated holding rates at 2.50% versus cutting to 2.25%, and the final decision was reached by a 5–1 vote. The lone dissenter in favour of holding highlights pockets of concern about easing too deeply and reflects a more cautious internal balance than many had assumed.
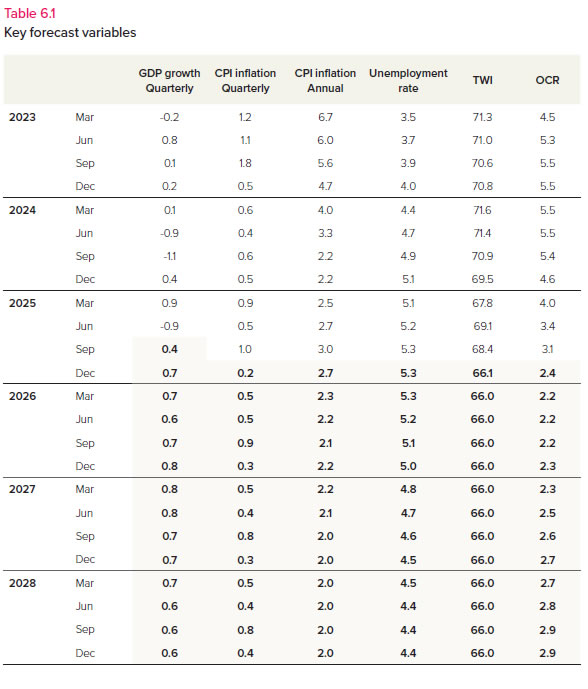
More importantly for markets, RBNZ’s updated forward guidance showed a notably firmer policy path. The Bank now expects the OCR to bottom at just 2.2% through 2026 before gradually rising to 2.7% by the end of 2027. That trajectory implies minimal scope for further cuts next year if the economic outlook holds, effectively signaling that today’s move may mark the end of the easing cycle.
The accompanying statement reinforced that message. RBNZ said economic activity was weak through mid-2025 but is now improving, with lower interest rates supporting household spending and the labor market stabilizing. The fall in the exchange rate is also lifting exporters’ incomes, reducing the need for more aggressive stimulus from here. Risks to the inflation outlook are now viewed as “balanced”.
Australia CPI surges to 3.8% in October, goods and services prices accelerate
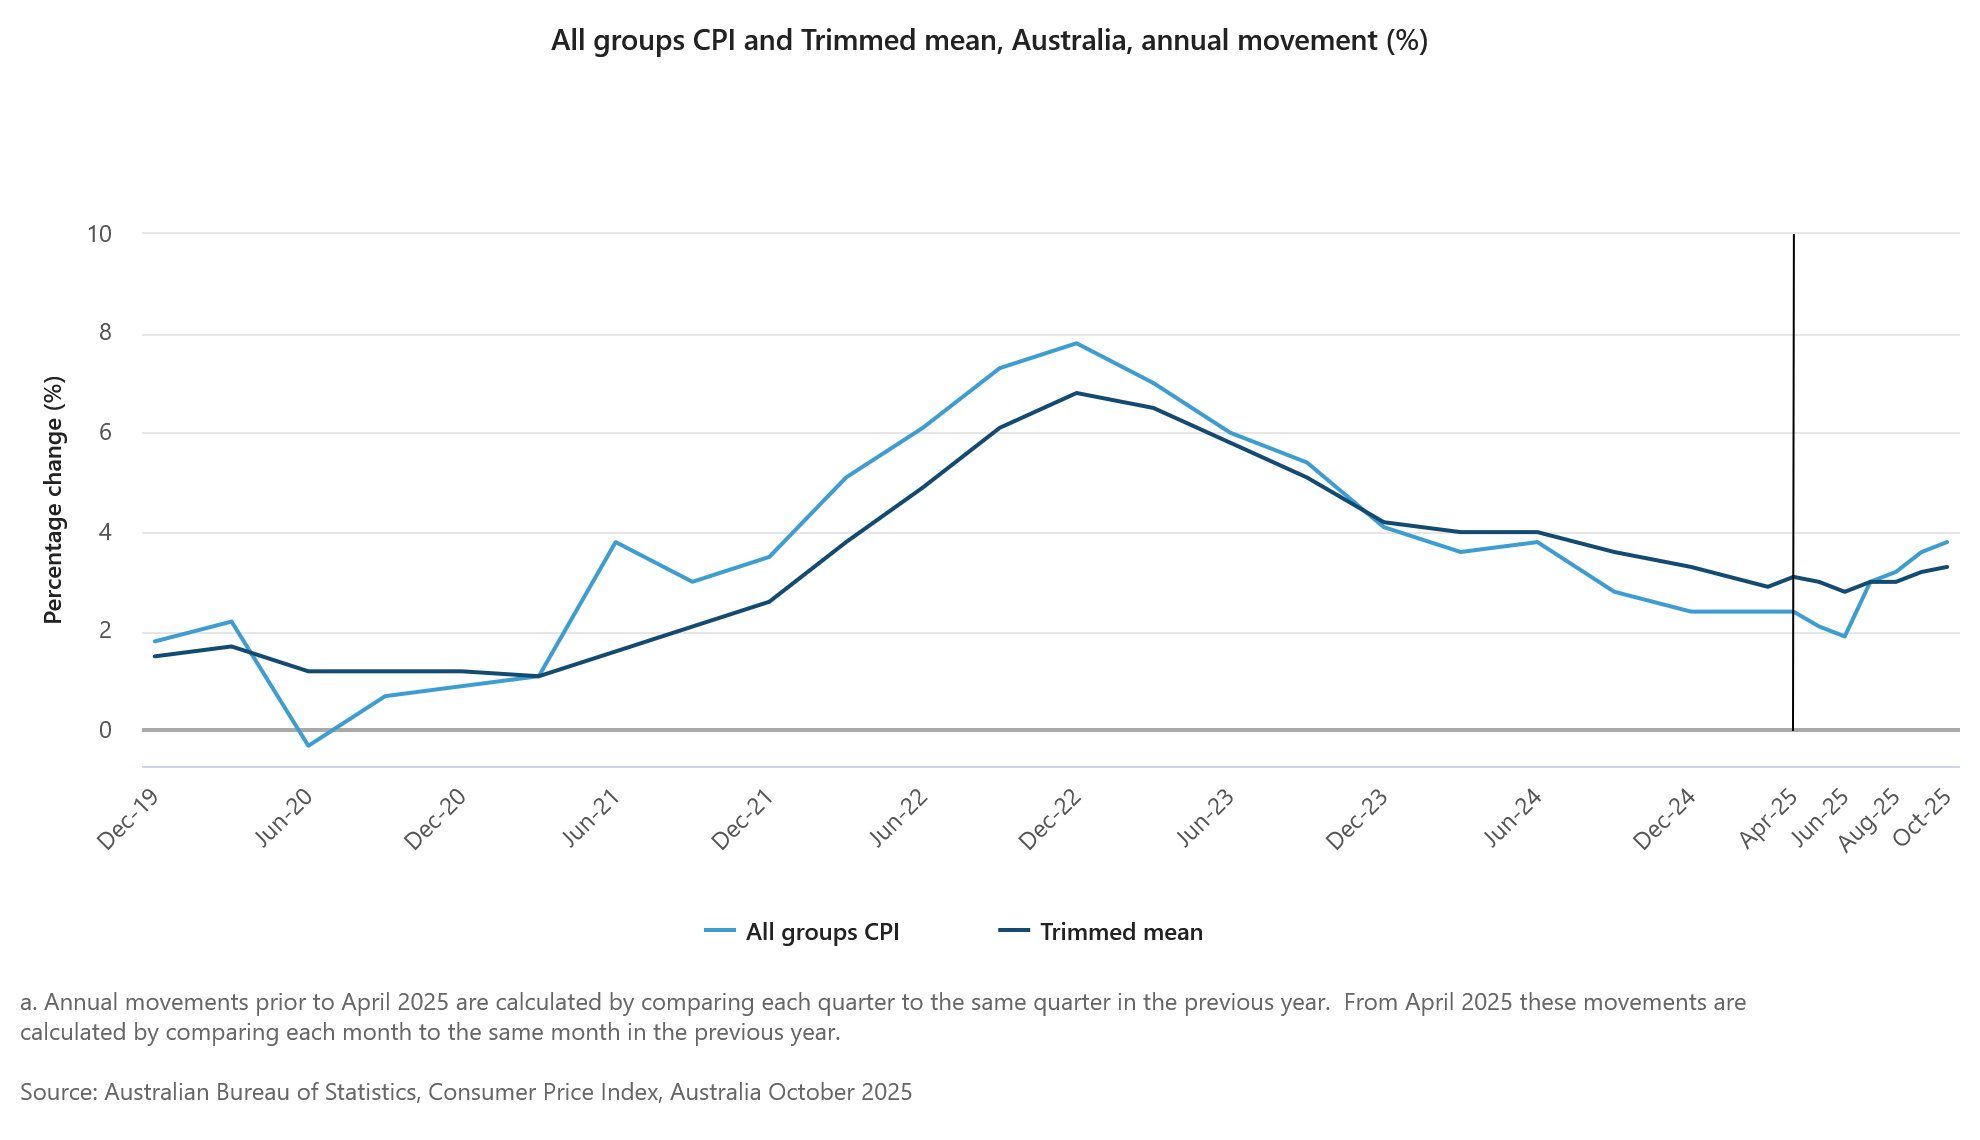
Australia’s CPI accelerated more than expected in October, rising from 3.5% yoy to 3.8%, beating expectations of 3.6%. Underlying pressure also firmed, with trimmed mean CPI moving up from 3.2% to 3.3%.
Both goods and services inflation picked up, with annual goods inflation at 3.8% (up from 3.7%) and services inflation at 3.9% (up from 3.5), signaling renewed price momentum. The combination will keep the RBA wary of easing again too soon.
The details showed broad-based increases. Housing costs was the largest contributor at 5.9%, followed by food and non-alcoholic beverages at 3.2%, and recreation and culture at 3.2%.
The release is also notable as the first in which Monthly CPI replaces the quarterly gauge as Australia’s primary headline measure.
AUD/NZD drops as hawkish RBNZ cut overpowers hot Australia CPI
AUD/NZD tumbled sharply today as markets digested two major releases: RBNZ’s widely expected 25bps cut and Australia’s stronger-than-forecast CPI print. Despite the upside surprise on inflation, AUD buying was no match for the hawkish tone embedded in RBNZ’s announcement, which effectively signaled that the easing cycle is now complete.
That distinction proved decisive. With RBNZ projecting the OCR to bottom near current levels and rise gradually into 2027, the case for deeper easing has evaporated. Although the RBA is also expected to stay on hold through early 2026, the interest-rate differential is now set to remain stable rather than widening. Investors who previously bet on wider divergence, a trend accelerated by New Zealand’s sharp Q2 economic contraction, are now unwinding positions.
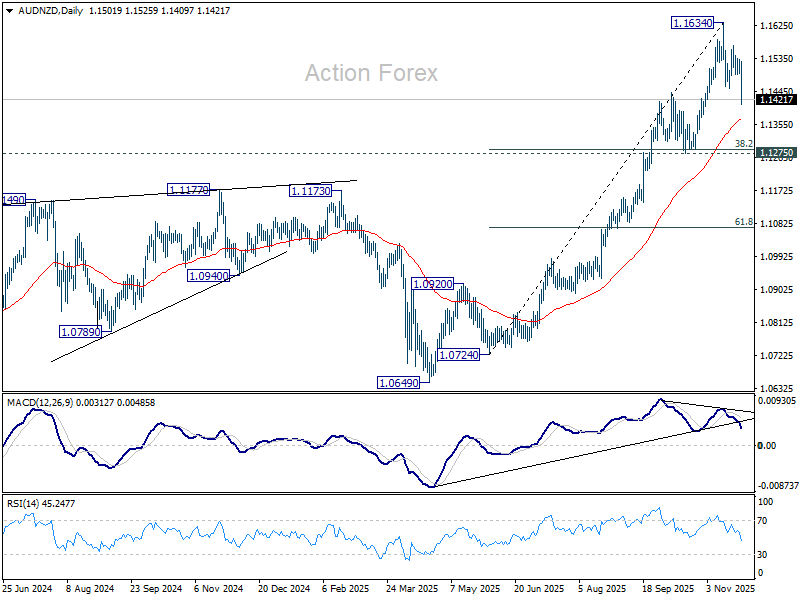
Technically, AUD/NZD's break of 1.1452 support confirms resumption of the decline from 1.1634 short term top. Considering bearish divergence condition in D MACD, fall from 1.1634 is likely correcting rise from 1.0724. Deeper fall should be seen to 55 D EMA (now at 1.1367) and possibly below.
But strong support is expected from 1.1275 cluster (38.2% retracement of 1.0724 to 1.1634 at 1.1286) to bring rebound and set the range for sideway trading.
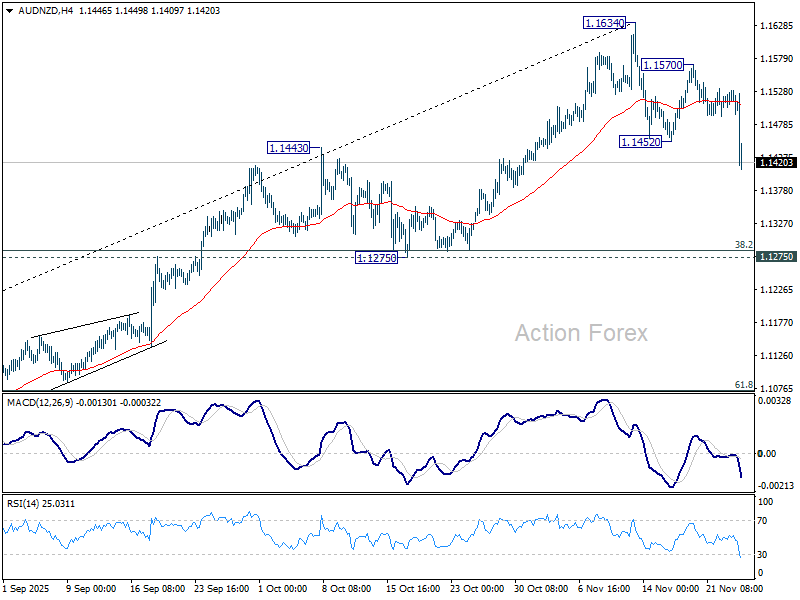
Rise from 1.0649 is still expected to have another rising leg through 1.1634 to complete a five-wave impulsive pattern. But that's unlikely to happen soon. The move may only come when the markets start to bet that RBA would hike interest rate earlier than RBNZ, which won't be in the near future.
That next leg, however, would require a significant shift in rate expectations—specifically, a scenario where markets begin to see the RBA tightening earlier than RBNZ, which is not on the horizon at present.
AUD/USD Daily Report
Daily Pivots: (S1) 0.6445; (P) 0.6461; (R1) 0.6485; More...
AUD/USD's extended rebound and break of 0.6501 resistance suggests short term bottoming at 0.6420. Intraday bias is back on the upside for 06579 resistance. Firm break there should confirm that whole fall from 0.6706 has completed as a three wave correction. Stronger rally should then be seen back to retest 0.6706. On the downside, sustained break of 0.6413 cluster (38.2% retracement of 0.5913 to 0.6706 at 0.6403) should confirm near term bearish reversal.
In the bigger picture, there is no clear sign that down trend from 0.8006 (2021 high) has completed. Rebound from 0.5913 is seen as a corrective move. Outlook will remain bearish as long as 38.2% retracement of 0.8006 to 0.5913 at 0.6713 holds. Break of 0.6413 support will suggest rejection by 0.6713 and solidify this bearish case. Nevertheless, considering bullish convergence condition in W MACD, sustained break of 0.6713 will be a strong sign of bullish trend reversal, and pave the way to 0.6941 structural resistance for confirmation.
RBNZ Review: Enter the Nightwatchman
- The RBNZ cut the OCR by 25bps to 2.25%. The decision was made following a 5 – 1 vote, with one MPC member voting to hold the OCR at 2.5%.
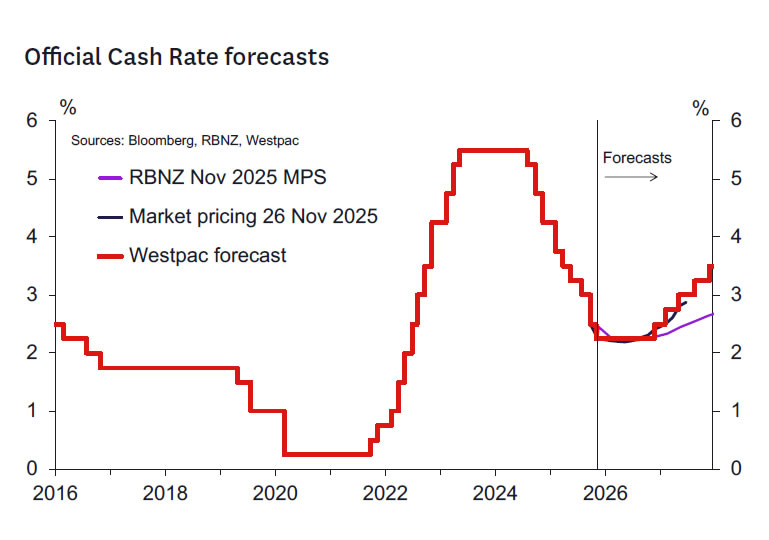
- The RBNZ’s OCR forecast profile was revised down as expected and now shows a terminal OCR of 2.20% (in Q2 2026), down from 2.55% previously.
- The RBNZ’s forecasts imply a first OCR hike around the middle of 2027, with the OCR to gradually move up towards 3% (the RBNZ’s estimated neutral rate) by the end of 2028.
- The RBNZ is presenting a neutral outlook for the OCR looking forward. The MPC retains flexibility to respond to incoming data, and is not drawing a firm line under the easing cycle just yet.
- Westpac expects no further cuts in the OCR. Our baseline forecast is that the OCR will begin a gradual move higher from late next year.
Key take out: OCR cut 25bps, RBNZ signals a neutral bias for February and perhaps beyond.
As widely expected, the RBNZ cut the OCR by 25bps to 2.25%. The decision was reached following a 5 - 1 vote, with one MPC member voting in favour of leaving the OCR at 2.5%.
The general tone of the Monetary Policy Statement seems more neutral than we expected. For example, there was no consideration of a 50bp cut, and one MPC member voted for no change in the OCR. The RBNZ’s assessment that the economy is picking up is perhaps a little more confident that we might have thought. Fixing the March 2026 OCR average at 2.25% sends a neutral bias for the February 2026 meeting. Glenn Turner was definitely opening the batting for the MPC in this innings!
As expected, the RBNZ’s projected track for the OCR was revised lower:
- The terminal OCR is 2.20% (in Q2 2026), down from 2.55% in the August MPS.
- The projected OCR for Q4 2026 was revised to 2.28% from 2.62% previously.
- The projected OCR for Q4 2027 was revised to 2.65% from 2.80% previously.
- The RBNZ assumes the OCR reaches 2.90% in Q4 2028 (the final quarter of the new forecast).
According to the RBNZ, the most important drivers of the reduction in the OCR track were a larger degree of spare capacity in the economy this year than assumed previously (reflecting the weak Q2 GDP outcome) and a lower outlook for export prices (due to recent falls in dairy product prices). The lower exchange rate supports exporter earnings and leans against disinflation in the short term.
The RBNZ is presenting a neutral, but data-dependent outlook. The Governor noted some slight downside risk to the OCR in the short term, but upside risk in the medium term. The Governor noted that the OCR is now at stimulatory levels and should support growth in time. Up to now, the RBNZ has been less clear about whether interest rates are at stimulatory levels.
The overall implication is that the MPC is now ready to send the nightwatchman in to see the innings through for the foreseeable future. The new Governor can reassess the situation next year in light of the data to come.
Notable quotes.
Some notable quotes from the press statement and Statement of Record were:
“Economic indicators are recovering, and economic activity is expected to strengthen through 2026.” “Risks to the inflation outlook are balanced.”
“Committee members discussed an improvement in near-term indicators of economic activity from their lows in the June quarter, suggesting a return to modest GDP growth in the September quarter. Feedback from recent business visits also suggests that, while activity remains weak, demand has stabilised.”
“Some members highlighted the risk that continued caution on the part of households and businesses could further slow the recovery in domestic demand, which could see inflation fall below the target midpoint. Conversely, other members highlighted the possibility of a faster recovery if house prices and household spending increase more quickly than assumed given lower mortgage rates, leading to more persistence in medium-term inflation pressures.”
“Members noted that tariffs have had less impact on the global economy than initially expected, reflecting the imposition of lower tariff rates than originally envisaged, inventory management, and adjustments in global supply chains… The Committee still expects trade barriers to weigh on global economic activity and to have a modest disinflationary effect on New Zealand.”
“The Committee discussed the risk that unsustainable fiscal dynamics and increased politicisation of central banks globally could create the conditions for higher and more persistent inflation.”
“The case for a further reduction in the OCR emphasised significant excess capacity in the economy. This provides confidence that medium term inflation will return to, and remain around, the target mid-point. The economic recovery is at an early stage, and the inflation outlook provides scope to place more emphasis on avoiding unnecessary volatility in output and employment. With this context, retention of the easing in overall monetary conditions delivered to date would support an enduring recovery in economic activity.”
“Future moves in the OCR will depend on how the outlook for medium-term inflation and the economy evolve.”
Westpac’s OCR call.
We continue to expect 2.25% to mark the nadir of the easing cycle. The RBNZ looks like it has a neutral bias looking forward and is certainly not signalling any intention to cut the OCR in February. Of course, much could change between then and now. Hence, we continue to expect the RBNZ to maintain a flexible data-dependent approach. We agree that the current OCR, left long enough, should be sufficient to support the recovery in the economy.
The timing of the return of the OCR to higher, more neutral levels will depend on the pace of the eventual recovery. Hence while we continue to see the first hike as occurring in December 2026 (likely after the 2026 General Election), there are two-sided risks to that call. Should the economy pick up relatively quickly, the normalisation of the OCR could come before the election, closer to the middle of 2026. A disappointing recovery could mean the OCR on hold for longer.
The exchange rate has moved a touch higher as markets likely expected a more dovish outlook than seen today. More generally, we suspect that the New Zealand dollar will remain weak against most currencies until such time as markets turn away from the risks of a lower OCR and consider the timing of the tightening cycle. It will likely be some time before we get to that position.
RBNZ forecast detail.
The RBNZ’s updated forecasts align broadly with our own assessment.
The economy is starting from a weaker position than the RBNZ anticipated back in August. That’s due to the much weaker than expected June quarter GDP result. Like ourselves, the RBNZ thinks that result likely overstated the degree of weakness in activity. Even so, economic conditions were soft through the middle part of the year, and the economy has more spare capacity than the RBNZ anticipated (i.e., a lower output gap). And even with lower interest rates, that spare capacity is expected to dissipate only very gradually.
That lingering spare capacity has reinforced the downward pressure on the RBNZ’s forecasts for domestic inflation. This is an area where we think the RBNZ could be surprised on the upside. The RBNZ has acknowledged the strength in the prices for items like council rates, but expects this to ease. In contrast, we anticipate such pressure will be a bit more enduring.
Nevertheless, we agree with the RBNZ’s more general assessment that spare capacity in the economy will see inflation dropping back over the year ahead.
The RBNZ’s statement noted early signs that the economy is starting to turn. Consistent with such indicators and the large fall in interest rates over the past year, we think that domestic demand will pick up a bit faster than the RBNZ. However, much of that increase in demand will be met by increased imports.
Key things to watch ahead of the RBNZ’s 18 February 2026 Review.
The next RBNZ policy review will take place on 18 February 2026. Given the longer than usual break until the next meeting, there will be a significant number of key domestic economic data releases ahead of that meeting. Indeed, the RBNZ will receive a new round of all the top-tier quarterly indicators, and so there is plenty of scope for outcomes to drive a different outcome to that currently projected by the RBNZ. The most important releases are:
- The Q3 GDP report (18 December): The outcome of this report will be compared to the RBNZ’s estimate, with any deviation having implications for the RBNZ’s estimate of the output gap and perhaps also its view on near-term growth momentum. The RBNZ’s forecast of 0.4% growth is in line with our own view. The Q3 release will also include a range of revisions to the historical data, which could have a bearing on the RBNZ’s assessment of the economy’s spare capacity.
- The Q4 QSBO survey (13 January, TBC): The focus will be on indicators of spare capacity and cost/inflation pressures. It will also be interesting to see to what extent hiring and investment indicators are lifting as easy monetary conditions continue to transmit through the economy.
- The Q4 CPI (23 January) and January Selected Price Indexes (17 February): With headline inflation currently at the top of the RBNZ’s target range, the focus will be on whether the CPI is evolving in a manner consistent with the RBNZ’s forecast that it will quickly move back towards the target midpoint over the coming year.
- The Q4 labour market survey (4 February): Developments in both the unemployment rate and labour costs will be compared against the RBNZ’s updated estimates, while measures of labour input will provide some insight into how GDP might have fared during the quarter.
In addition to the above, key monthly activity indicators such as the BusinessNZ manufacturing and services indexes and the ANZ Business Outlook survey will also be of interest, as will developments in retail spending and housing indicators (albeit the latter tend to be difficult to read given that the housing market typically goes somewhat quiet over the holiday period). The Government’s Half-Year Economic and Fiscal Update and Budget Policy Statement (16 December) might also contain information bearing on expectations regarding the future stance of fiscal policy (of particular interest given the seemingly tight General Election that looms later next year).
Finally, the other factor that will have a bearing on the next policy decision will be the arrival of the new Governor Anna Breman, who takes up her role next week. In addition, the departure of current Governor, Christian Hawkesby, will maintain a vacancy on the MPC. That vacancy may be filled by the time of the February MPS meeting, possibly by a temporary appointment pending the appointment of a new Deputy Governor.
Bitcoin Starts to Rebound, But Momentum Faces a Steep Climb
Key Highlights
- Bitcoin started a recovery wave above $85,000 and $86,500.
- BTC/USD cleared a key bearish trend line with resistance at $86,800 on the 4-hour chart.
- Ethereum also started a decent increase above $2,800.
- XRP price climbed above $2.10 to move into a positive zone.
Bitcoin Price Technical Analysis
Bitcoin price found support near $80,500 and started a recovery wave against the US Dollar. BTC climbed above $85,000 and $86,500 to enter a short-term positive zone.
Looking at the 4-hour chart, the price surpassed the 23.6% Fib retracement level of the downward move from the $107,459 swing high to the $80,510 low. During the increase, the price broke a key bearish trend line with resistance at $86,800.
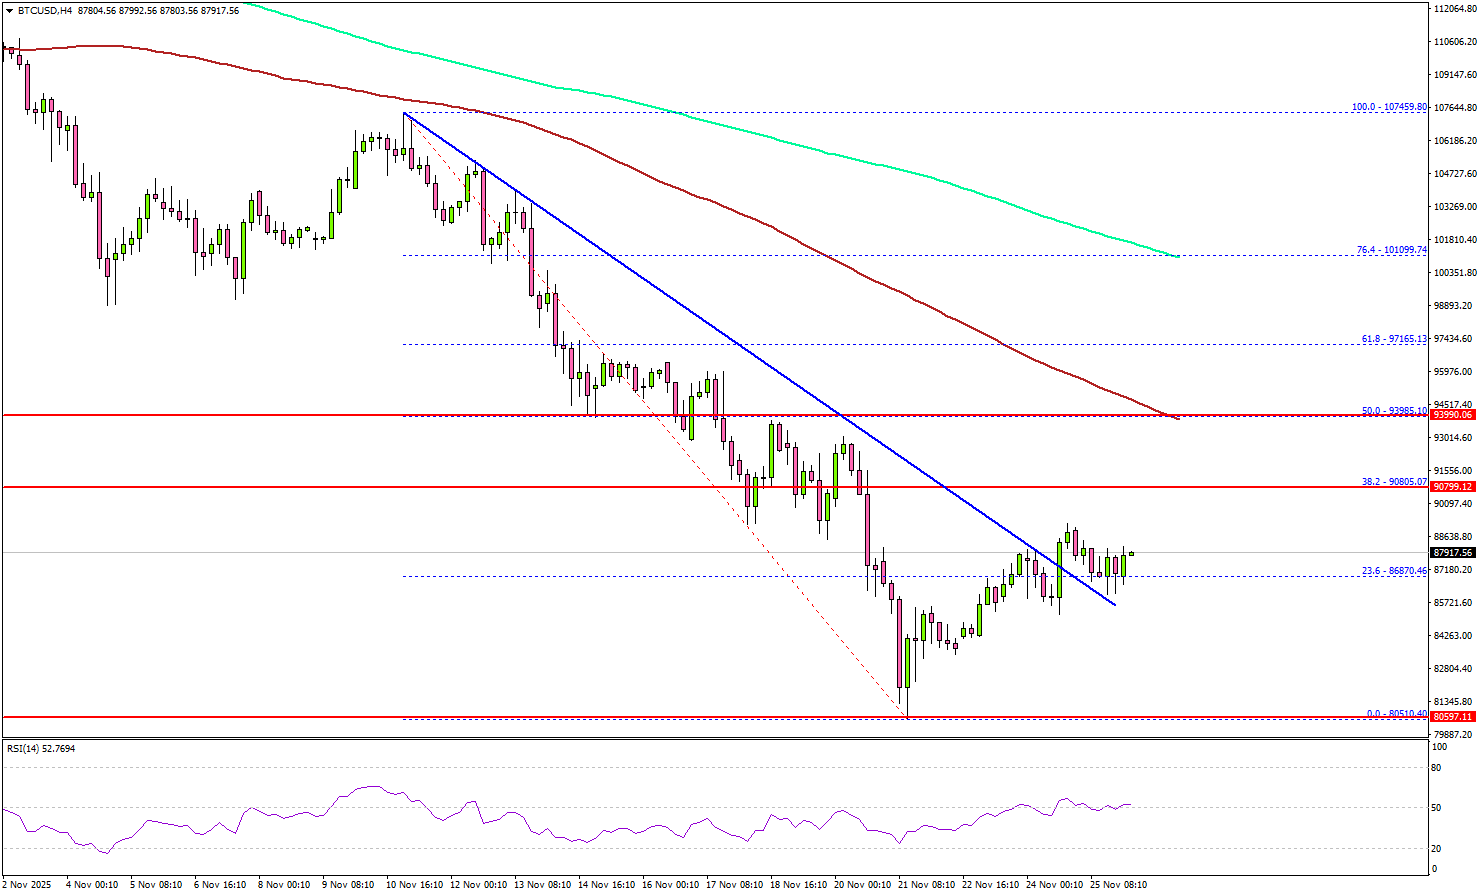
BTC faces many hurdles and remains below the 100 simple moving average (red, 4-hour) and the 200 simple moving average (green, 4-hour). If the price extends gains, it could face resistance at $90,800.
The main hurdle is now forming near $94,000 and the 50% Fib retracement level of the downward move from the $107,459 swing high to the $80,510 low. A successful close above $94,0000 might start another steady increase. In the stated case, the price may perhaps rise toward the $95,500 level. Any more gains might call for a test of $97,000.
Immediate support sits at $85,000. A downside break below $85,000 might start another decline. The next major support is $84,200. Any more losses might call for an extended decline toward the $82,800 support zone.
Looking at Ethereum, the price was able to follow Bitcoin and climbed above the $2,850 resistance region.
Today’s Key Economic Releases
- US Initial Jobless Claims - Forecast 227K, versus 220K previous.
- US Durable Goods Orders for Sep 2025 – Forecast +0.2% versus +2.9% previous.
AUD/NZD drops as hawkish RBNZ cut overpowers hot Australia CPI
AUD/NZD tumbled sharply today as markets digested two major releases: RBNZ’s widely expected 25bps cut and Australia’s stronger-than-forecast CPI print. Despite the upside surprise on inflation, AUD buying was no match for the hawkish tone embedded in RBNZ’s announcement, which effectively signaled that the easing cycle is now complete.
That distinction proved decisive. With RBNZ projecting the OCR to bottom near current levels and rise gradually into 2027, the case for deeper easing has evaporated. Although the RBA is also expected to stay on hold through early 2026, the interest-rate differential is now set to remain stable rather than widening. Investors who previously bet on wider divergence, a trend accelerated by New Zealand’s sharp Q2 economic contraction, are now unwinding positions.
Technically, AUD/NZD's break of 1.1452 support confirms resumption of the decline from 1.1634 short term top. Considering bearish divergence condition in D MACD, fall from 1.1634 is likely correcting rise from 1.0724. Deeper fall should be seen to 55 D EMA (now at 1.1367) and possibly below.
But strong support is expected from 1.1275 cluster (38.2% retracement of 1.0724 to 1.1634 at 1.1286) to bring rebound and set the range for sideway trading.
Rise from 1.0649 is still expected to have another rising leg through 1.1634 to complete a five-wave impulsive pattern. But that's unlikely to happen soon. The move may only come when the markets start to bet that RBA would hike interest rate earlier than RBNZ, which won't be in the near future.
That next leg, however, would require a significant shift in rate expectations—specifically, a scenario where markets begin to see the RBA tightening earlier than RBNZ, which is not on the horizon at present.
Australia CPI surges to 3.8% in October, goods and services prices accelerate
Australia’s CPI accelerated more than expected in October, rising from 3.5% yoy to 3.8%, beating expectations of 3.6%. Underlying pressure also firmed, with trimmed mean CPI moving up from 3.2% to 3.3%.
Both goods and services inflation picked up, with annual goods inflation at 3.8% (up from 3.7%) and services inflation at 3.9% (up from 3.5), signaling renewed price momentum. The combination will keep the RBA wary of easing again too soon.
The details showed broad-based increases. Housing costs was the largest contributor at 5.9%, followed by food and non-alcoholic beverages at 3.2%, and recreation and culture at 3.2%.
The release is also notable as the first in which Monthly CPI replaces the quarterly gauge as Australia’s primary headline measure.
RBNZ delivers 25bps cut but signals little room for further easing
RBNZ cut the OCR by 25bps to 2.25% as widely expected, but the tone of the announcement was more hawkish than markets had anticipated.
Policymakers revealed they had debated holding rates at 2.50% versus cutting to 2.25%, and the final decision was reached by a 5–1 vote. The lone dissenter in favour of holding highlights pockets of concern about easing too deeply and reflects a more cautious internal balance than many had assumed.
More importantly for markets, RBNZ’s updated forward guidance showed a notably firmer policy path. The Bank now expects the OCR to bottom at just 2.2% through 2026 before gradually rising to 2.7% by the end of 2027. That trajectory implies minimal scope for further cuts next year if the economic outlook holds, effectively signaling that today’s move may mark the end of the easing cycle.
The accompanying statement reinforced that message. RBNZ said economic activity was weak through mid-2025 but is now improving, with lower interest rates supporting household spending and the labor market stabilizing. The fall in the exchange rate is also lifting exporters’ incomes, reducing the need for more aggressive stimulus from here. Risks to the inflation outlook are now viewed as “balanced”.
(RBNZ) OCR lowered to 2.25%
Media release
Annual consumers price inflation increased to 3 percent in the September quarter. However, with spare capacity in the economy, inflation is expected to fall to around 2 percent by mid-2026.
Economic activity was weak over mid-2025 but is picking up. Lower interest rates are encouraging household spending, and the labour market is stabilising. The exchange rate has fallen, supporting exporters’ incomes.
Global economic growth has benefited from strong AI-related investment but is expected to slow in 2026 as trade barriers weigh on activity.
Risks to the inflation outlook are balanced. Greater caution on the part of households and businesses could slow the pace of New Zealand’s economic recovery. Alternatively, the recovery could be faster and stronger than expected if domestic demand proves more responsive to lower interest rates.
The Committee voted to reduce the OCR by 25 basis points to 2.25 percent. Future moves in the OCR will depend on how the outlook for medium-term inflation and the economy evolve.
Summary record of meeting – November 2025
Annual consumers price inflation increased to 3 percent in the September quarter, the top of the Monetary Policy Committee’s 1 to 3 percent target band. Significant spare capacity remains in the economy and inflation is expected to fall to around 2 percent by mid-2026. The significant reduction in the OCR since August 2024 is expected to support a recovery in economic activity.
Annual inflation is at the top of the target band but expected to moderate
The Committee noted that both core and non-tradables inflation have continued to decline. Annual tradables inflation increased in September due to petrol prices and high food inflation but is expected to decline over the medium term. Annual headline CPI inflation increased due to higher tradables inflation along with high inflation in household energy costs and local council rates. As these dissipate, this will support headline CPI inflation returning to near the 2 percent mid-point of the target range in mid-2026.
Household inflation expectations have fallen but remain high relative to recent history. The inflation expectations of professional forecasters and business leaders have remained stable at slightly above the 2 percent target midpoint.
The economic recovery stalled in the June quarter
Committee members considered how US tariff policy announcements and broader geoeconomic uncertainty disrupted New Zealand’s nascent economic recovery. Greater uncertainty likely led to increased precautionary behaviour by households and businesses, dampening consumption and investment.
However, while measured GDP declined by 0.9 percent in the June quarter, this likely overstates the weakness in the economy through this period. The Committee noted that an unusually large seasonal balancing item contributed to the weakness in the headline figure. This is expected to be reversed over the next few data releases.
Some industry-specific factors may also have constrained supply. For example, high milk prices and unfavourable weather conditions likely contributed to higher livestock retention and lower meat production in the first half of 2025. Limited access to domestic energy sources and higher energy prices are likely to have weighed on manufacturing more generally.
Significant spare capacity remains
The Committee discussed the balance between supply capacity and demand. In addition to short-run factors, the economy’s medium-term supply capacity has been reduced by weak growth in productivity and the working age population. Estimates suggest that annual potential output growth is currently around 1.5 percent.
Weak economic activity has resulted in significant spare capacity opening in the economy since mid-2024. Unemployment and measures of labour underutilisation have increased, and firms are reporting that it is now relatively easy to find workers. While job losses are not high compared to past economic downturns, job vacancies and job transitions have been low, so it has been relatively difficult for unemployed people to transition back to work.
Economic conditions have been variable across different sectors and regions of the economy. High prices for New Zealand’s commodity exports have lifted incomes in the rural economy. This has supported economic activity in rural areas, although debt reduction by farmers has meant measures of on-farm investment have not yet increased to the extent seen in previous commodity price cycles. The level of economic activity remains low in industries reliant on domestic demand.
Financial conditions have eased and the financial system remains stable
The Committee discussed the easing in domestic financial conditions that has occurred. Wholesale interest rates have declined and the New Zealand dollar Trade Weighted Index has depreciated since August. Cuts to the OCR have reduced borrowing costs and mortgage rates. The average yield on mortgages has fallen to 5.4 percent. With close to 40 percent of fixed rate mortgages due to reprice over the December and March quarters, the average mortgage yield is expected to fall further to 4.7 percent by September 2026 based on current market pricing.
Measures of domestic financial stress have eased as lower interest rates reduce debt servicing pressures. Early arrears, which provide an early indicator of impaired lending, have declined. Non-performing housing loans have also declined, and banks expect further reductions in housing and commercial property impairments over 2026. Non-performing loans in the business sector remain elevated, although at lower levels than in previous downturns.
Economic activity is recovering
Committee members discussed an improvement in near-term indicators of economic activity from their lows in the June quarter, suggesting a return to modest GDP growth in the September quarter. Feedback from recent business visits also suggest that, while activity remains weak, demand has stabilised.
The Committee noted that there are also some early signs of stabilisation in labour demand, with job vacancies and total hours worked increasing in the September quarter. This is expected to broaden into a wider improvement in labour market conditions over coming quarters, which will support household confidence and spending.
Relative weakness in the labour market over the past two years has contributed to higher outward migration from New Zealand, particularly to Australia. Regional disparities in housing and labour markets have also likely encouraged higher internal migration. Outward migration is expected to reduce as the New Zealand economy and labour market recovers, with net migration expected to increase towards long-run trends.
Future growth in house prices is expected to be moderate
Members discussed that house prices, in aggregate, have remained stable to date despite lower mortgage interest rates and a modest pick-up in housing market activity. Stable house prices could reflect weak population growth and elevated long-term interest rates. Supply side reforms in the housing market, such as less restrictive zoning laws, may also be moderating the extent to which increases in housing demand contribute to house price inflation.
The Committee assessed that upcoming reductions in mortgage loan-to-value ratio requirements are unlikely to have a material effect on house prices, especially with debt-to-income restrictions now in place. House price growth is expected to be moderate over the projection period, broadly in line with growth in nominal incomes.
Global growth has been resilient but is expected to slow
Members noted that tariffs have had less impact on the global economy than initially expected, reflecting the imposition of lower tariff rates than originally envisaged, inventory management, and adjustments in global supply chains. Global growth has also been supported by higher investment in artificial intelligence technology, particularly in the US, which has boosted exports from Asia. Higher demand for exports has supported economic growth in China, despite weakness in domestic demand.
Global growth is expected to slow modestly in 2026. This reflects an anticipated weakening in global export demand as the pace of AI investment slows. The Committee still expects trade barriers to weigh on global economic activity and to have a modest disinflationary effect on New Zealand.
Risks to the outlook for inflation are balanced
The Committee discussed the risk that price setting behaviour by businesses may become more sensitive to upside inflation surprises, given recent high inflation and inflation expectations remaining above the target mid-point. Spare capacity in the economy has reduced business profit margins and some restoration in margins is expected as demand improves. This restoration in margins could occur more rapidly than anticipated, which would pose an upside inflation risk.
Members noted there are risks around the speed of the recovery. Some members highlighted the risk that continued caution on the part of households and businesses could further slow the recovery in domestic demand, which could see inflation fall below the target midpoint. Conversely, other members highlighted the possibility of a faster recovery if house prices and household spending increase more quickly than assumed given lower mortgage rates, leading to more persistence in medium-term inflation pressures. Members also discussed the possibility of a stronger increase in on-farm investment stemming from high export commodity prices and the expected return of capital to dairy farmers in 2026 from the sale of Fonterra’s consumer brands business.
The Committee discussed risks to the global outlook. Investment in AI technologies has been a significant driver of global growth and equity returns over the past year. Uncertainty remains around the returns from AI adoption. There is a risk of a more significant correction in equity markets and reduced investment if heightened investor expectations are not met.
Inflation remains high in several advanced economies. Global policy uncertainty also remains high. The Committee noted downside risks to growth in China, as policy makers attempt to maintain growth in the face of weak domestic demand and an increasingly fragmented global trading environment. The Committee also noted uncertainty about US economic policy, and the associated risk of higher US inflation.
The Committee discussed the risk that unsustainable fiscal dynamics and increased politicisation of central banks globally could create the conditions for higher and more persistent inflation.
The Committee voted to lower the OCR to 2.25 percent
The Committee discussed the options of holding the OCR at 2.5 percent and lowering the OCR to 2.25 percent, noting low tolerance for prolonging the return of inflation to the target mid-point.
The case for holding the OCR emphasised the considerable reduction in the OCR to date, which is still working its way through the economy. Economic indicators are recovering, and economic activity is expected to strengthen through 2026. Particular emphasis was placed on the upside risks to inflation and output. Leaving the OCR unchanged at this meeting would provide the optionality to lower the OCR in the future if required.
The case for a further reduction in the OCR emphasised significant excess capacity in the economy. This provides confidence that medium-term inflation will return to, and remain around, the target midpoint. The economic recovery is at an early stage, and the inflation outlook provides scope to place more emphasis on avoiding unnecessary volatility in output and employment. With this context, retention of the easing in overall monetary conditions delivered to date would support an enduring recovery in economic activity.
The Committee discussed how to balance the achievement of their inflation mandate with the need to avoid unnecessary instability in output, employment, interest rates and the exchange rate.
On Wednesday 26 November the Committee voted by 5 to 1 to reduce the OCR by 25 basis points to 2.25 percent. The Committee noted that a reduction in the OCR would help to underpin consumer and business confidence and lean against the risk that the economy recovers more slowly than needed to meet the inflation objective.
Future moves in the OCR will depend on how the outlook for medium-term inflation and the economy evolves.
Attendees:
MPC members: Christian Hawkesby (Chair), Carl Hansen, Hayley Gourley, Karen Silk, Paul Conway, Prasanna Gai
Treasury Observer: James Beard
MPC Secretary: Chris Bloor
US Dollar Takes a Hit as Dovish Fed U-Turn Boosts AUD, EUR, and JPY Outlook
Strongest Major currency of the past month, the Dollar had swept through most of its peers powered by a hawkish repricing, assumed by the Market after Powell's speech at the October 29th FOMC (You can access it right here).
The Federal Reserve Chair made many more mentions of their dual mandate to monitor both Employment and Inflation compared to the September meeting which had seen a tilt towards employment (meaning tariffs were posing an issue yet again).
The rough numbers and downward revisions to NFP in August and many other labor releases had warranted such a dovish turn from the Fed during the early Summer, but also caught people by surprise when data did not continue to worsen consequently – Explaining by the way the steep rally from 97.50 all the way to above 100.00 in the Dollar Index.
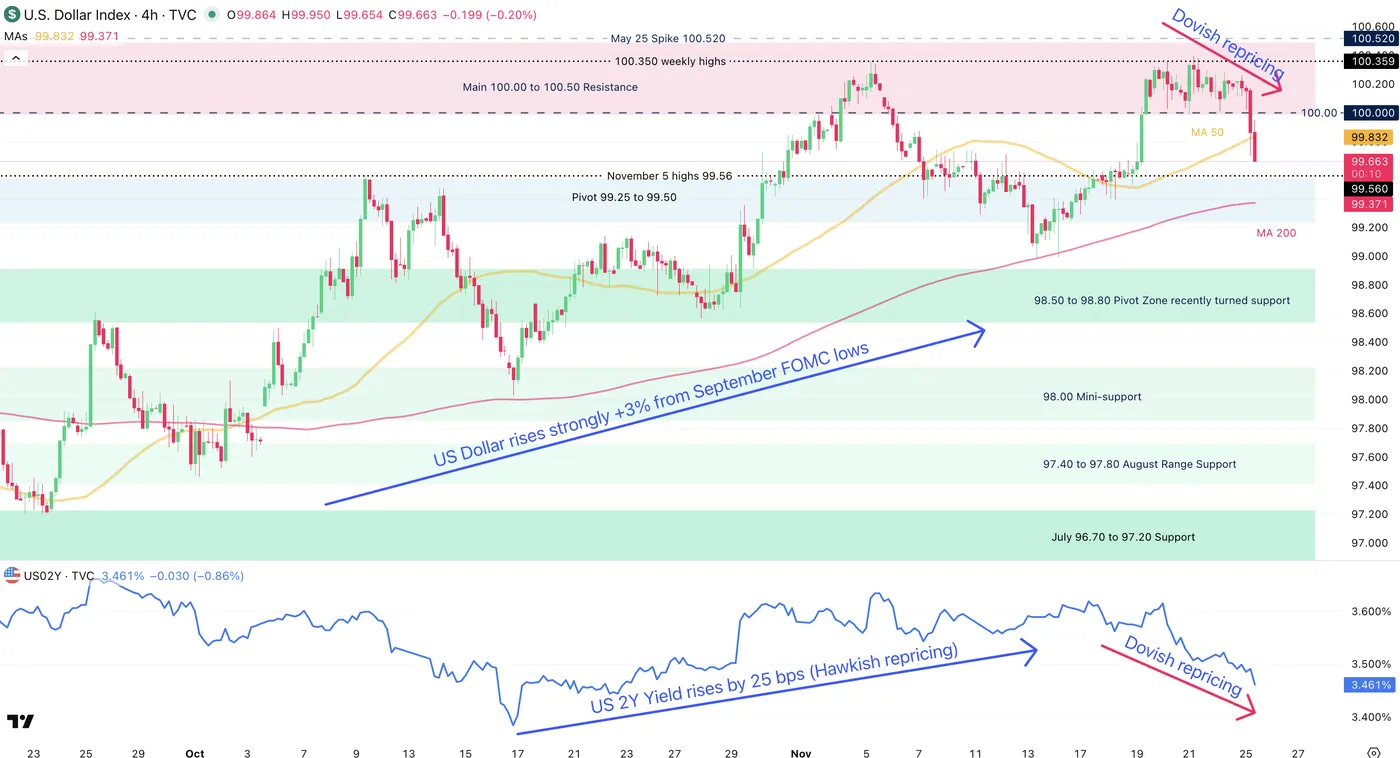
Dollar Index (DXY) since end-September 2025 (top panel) with US 2-Year Yield (bottom panel) – Source: TradingView
Turning to today, late releases from the Bureau of Labor Statistics haven't corroborated with a high inflation and better employment picture; Quite the opposite actually:
Despite better Jobless Claims last Thursday, consecutive misses in US Retail Sales (particularly ex. Auto and Gas at 0.1% vs 0.4% exp), PPI (Headline as expected, but a 0.1% miss on the Core) and Private Labor Data (-13.5K vs -2.5K previous) confirmed the more protective tone from Fed's Williams at his speech last Friday.
Since the end of last week, the Pricing for a 25 bps cut consequently went from lows of 20% all the way to the current 85%.
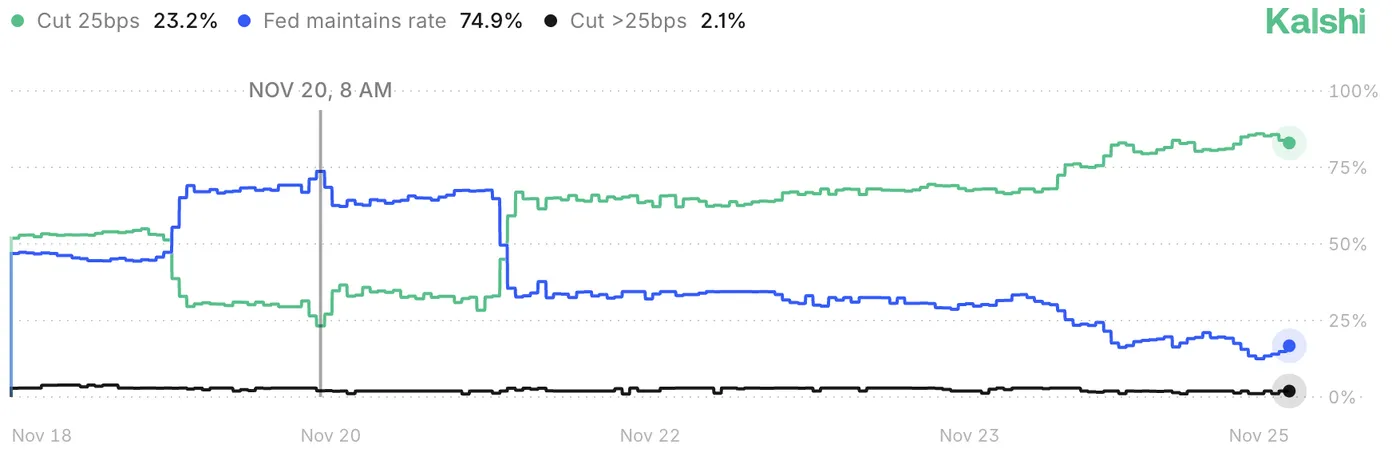
Evolution of the Fed's Rate Cut odds, November 25, 2025 – Source: Kalshi
Let's have a look at a few intraday FX Major Pairs (USD/JPY, EUR/USD and AUD/USD) to see how the turn in the pricing for the December 10 meeting led to strong reversals.
USD/JPY – Is the Squeeze done?
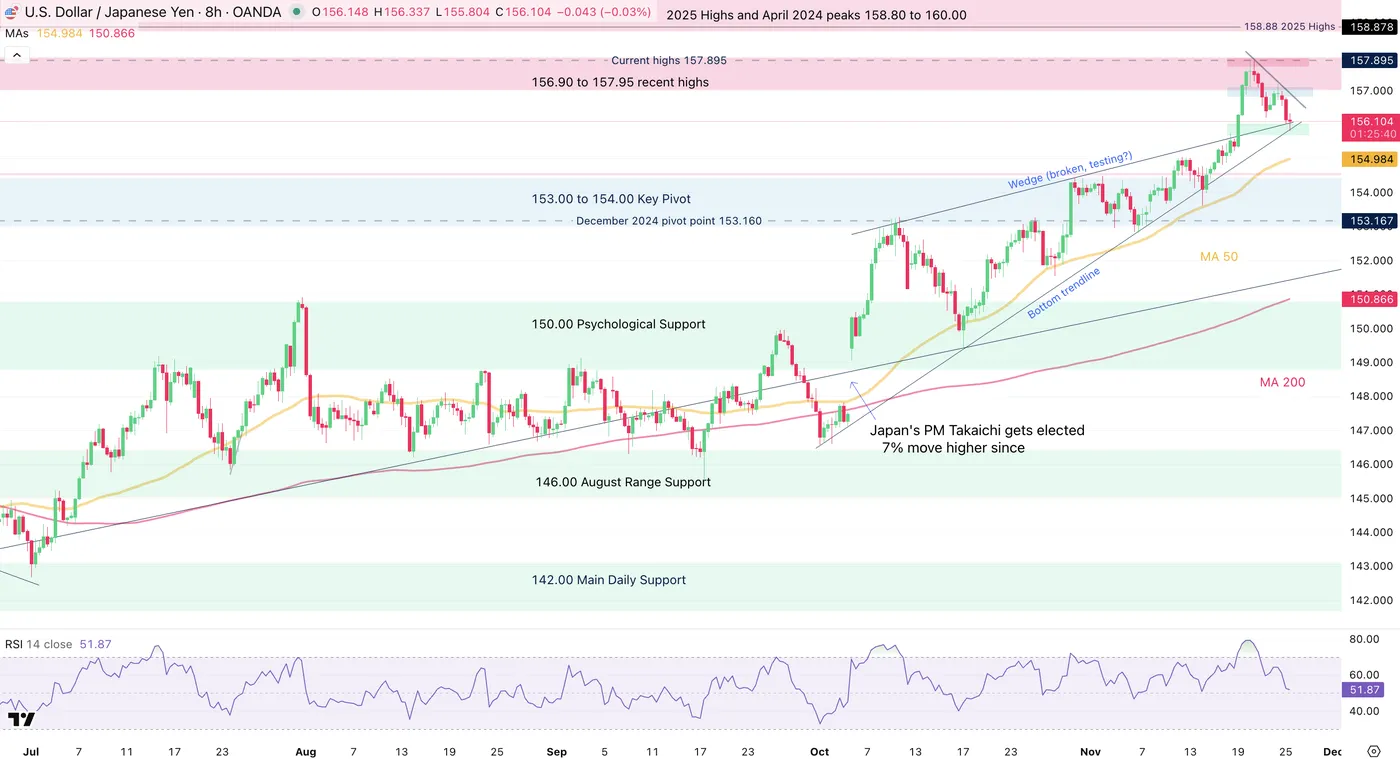
USD/JPY 8H Chart. November 25, 2025 – Source: TradingView
USD/JPY, subject to a 10,000 pip, one-way up-move since beginning October, has just initiated a turn lower since the speech from Fed's Williams.
A monetary policy convergence trade (where rates differential between US –at 4% – and Japan –at 0.5%– bearish for the pair had been put on the side after PM Takaichi's appointment.
However, the Bank of Japan is showing their teeth after the one-sided move, pointing towards a potential rate hike in December to help the yen.
Fears of intervention which could come during Thanksgiving have also calmed the squeeze.
Currently at 156.00 after reaching 158.80, the pair is holding tight at an hourly support.
- An hourly close below the 156.00 handle opens the door for a Major retracement all the way to 153.00.
- A rebound from here would point to 157.00, a test of the descending trendline
Levels of interest for USD/JPY Trading
Resistance levels
- 156.90 to 157.95 Recent top resistance
- 2025 Highs and April 2024 peaks 158.80 to 160.00
- 1990 and July 2024 Peak 161.00 to 162.00
- November highs at 157.895
Support levels
- 156.00 to 156.20 Short-timeframe Support
- 153.00 to 154.00 Key high timeframe pivot
- 150.00 Psychological support
- 146.00 August range support
- 2025 142.00 Main daily support
EUR/USD holds its range
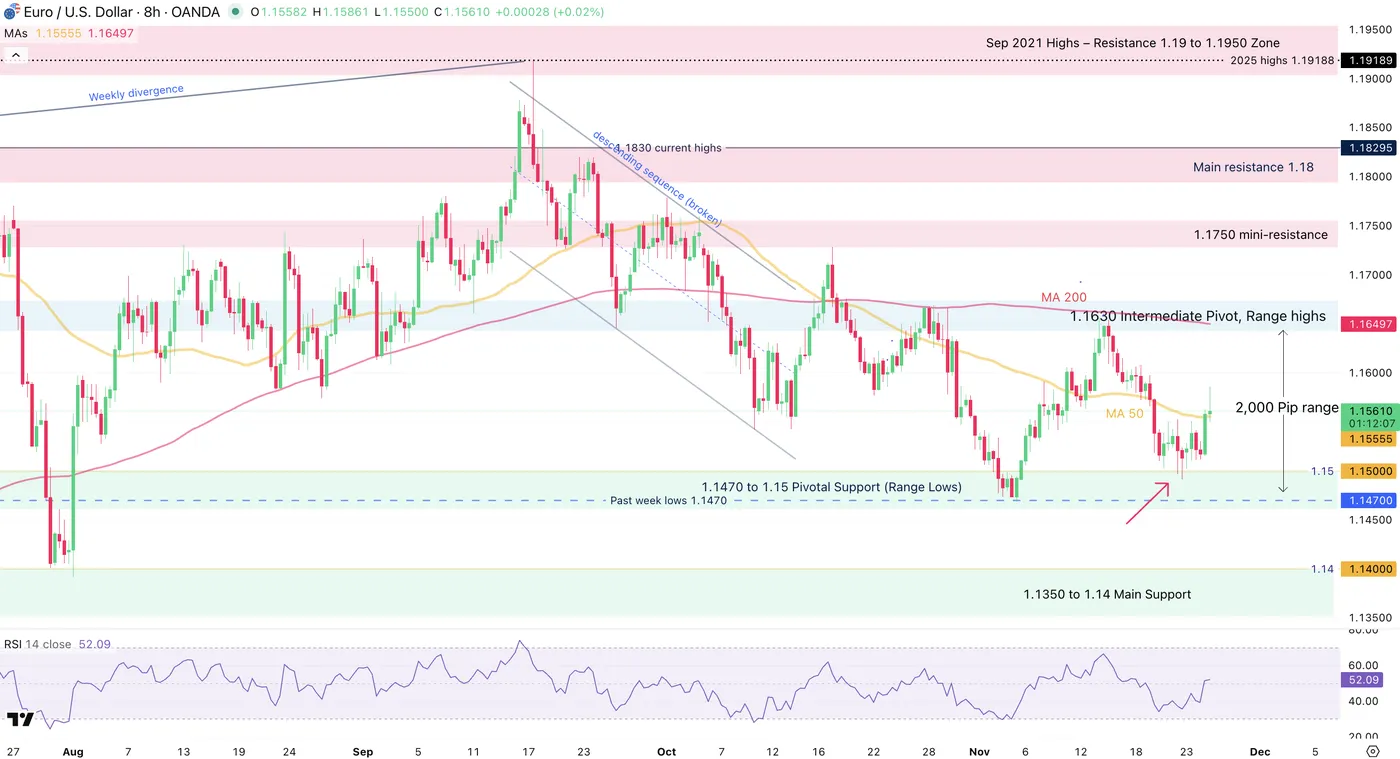
EUR/USD 8H Chart. November 25, 2025 – Source: TradingView
The range in EUR/USD, mentioned throughout our recent detailed analysis of the pair, is holding extremely well in those current conditions.
Since October 27, Fiber has been holding between 1.1470 lows and 1.1650 highs.
Confirmed by a flattening MA 200 and with fundamentals not coinciding with major breakouts, the range can be expected to hold ; Directional trends have the tendency to slow down before FOMC meetings– However, always watch for fakeouts and don't forget that everything can happen .
Levels of interest for EUR/USD Trading
Resistance levels
- 1.1630 to 1.1670 Pivot zone (range Highs)
- 1.1750 mini-resistance
- Resistance Zone around 1.18 (+/- 150 pips)
- Sep 2021 Highs – Resistance 1.19 to 1.1950 Zone
- Weekly highs 1.1656
Support levels
- 1.1470 to 1.15 range support
- 4H MA 200 Mini-support 1.16190
- 1.1475 to 1.15 Support Zone
- 1.1350 to 1.14 Support
- Session lows 1.14966
AUD/USD bounces back at the lows of its yearly range
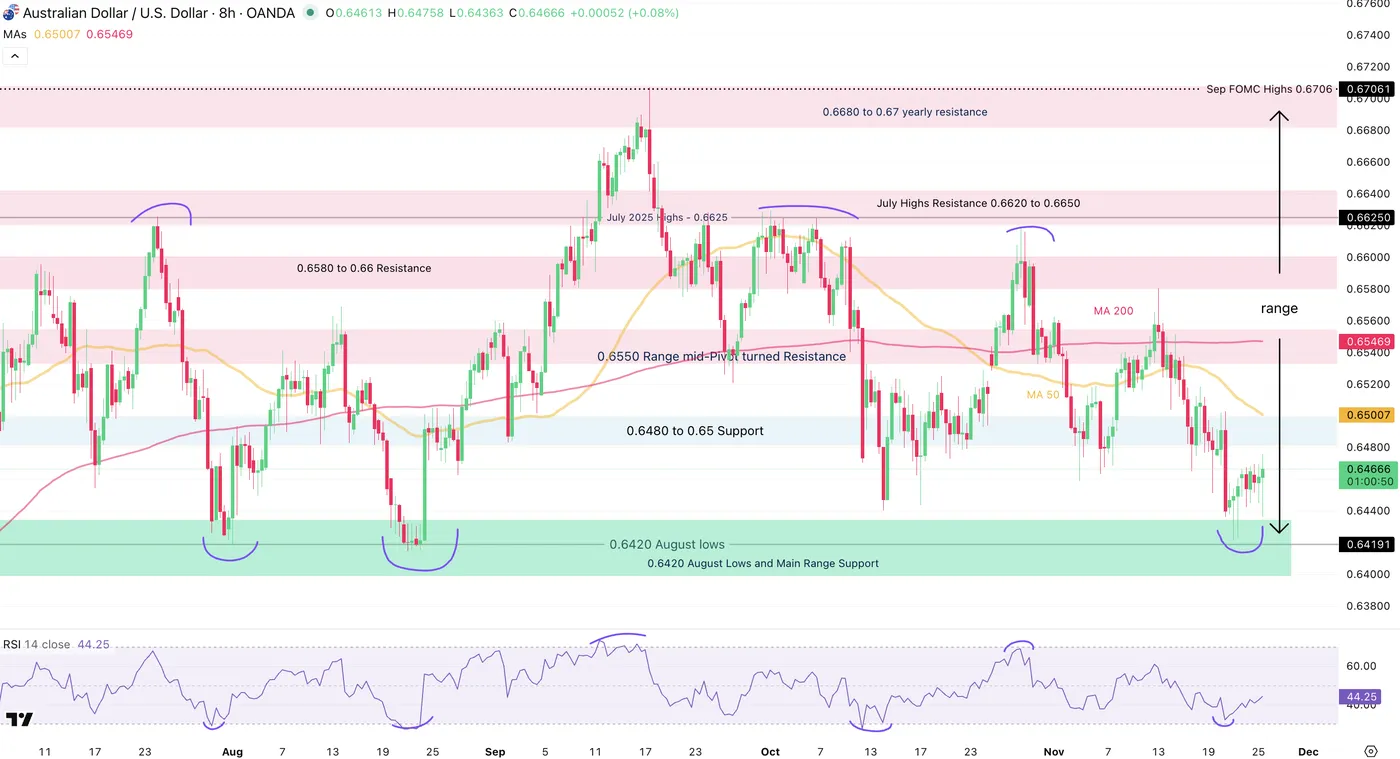
AUD/USD 8H Chart. November 25, 2025 – Source: TradingView
It is one of the first time that I noticed such an obvious range!
Since August 2025, FX Markets haven't materialized any trends – Pretty logical when seeing the extent of the moves throughout the first half of this year.
Nevertheless, AUD/USD had caught quite a wave of weakness after a strong performance against all its major counterparts, with the "Risk-on" currency brought down by a worsening sentiment (The Aussie tends to correlate well with Equity markets).
Holding between 0.64 (Support) and 0.66 (Resistance) since August, the latest bounce can offer quite a mean-reversion setup.
Still, as always, keep an eye on any session close below support or above resistance, but same as EUR/USD, you can expect the range to hold ahead of the FOMC meeting (as fundamentals have few chances of changing much more).
Levels of interest for AUD/USD Trading
Resistance levels
- 0.6480 to 0.65 Pivot
- 0.6550 Range mid-Pivot turned Resistance
- 0.6580 to 0.66 Resistance (Range Highs)
- July Highs Resistance 0.6620 to 0.6650
Support levels
- 0.6420 August Lows and Main Range Support (recent bounce)
- 0.6250 May support
- 0.62 Psychological support
- Liberation Day lows 0.59140
Safe Trades!