Sample Category Title
XAU/USD Chart Analysis: Market Volatility Eases (Again)
As the daily XAU/USD chart shows today, the ADX indicator is trending downwards following the extremely turbulent swings in October. This suggests:
→ gold price volatility is decreasing;
→ the market is finding balance around the psychological $4,000 level;
→ it recalls mid-July, when we noted a period of reduced volatility.
At that time, we:
→ drew an ascending channel;
→ observed that supply and demand were balancing each other, effectively reflecting all factors influencing the price.
Looking back, it can be noted that the market was in a consolidation phase (A) before the rally resumed (B) with renewed strength, as the price broke through the R1 resistance of the consolidation pattern.
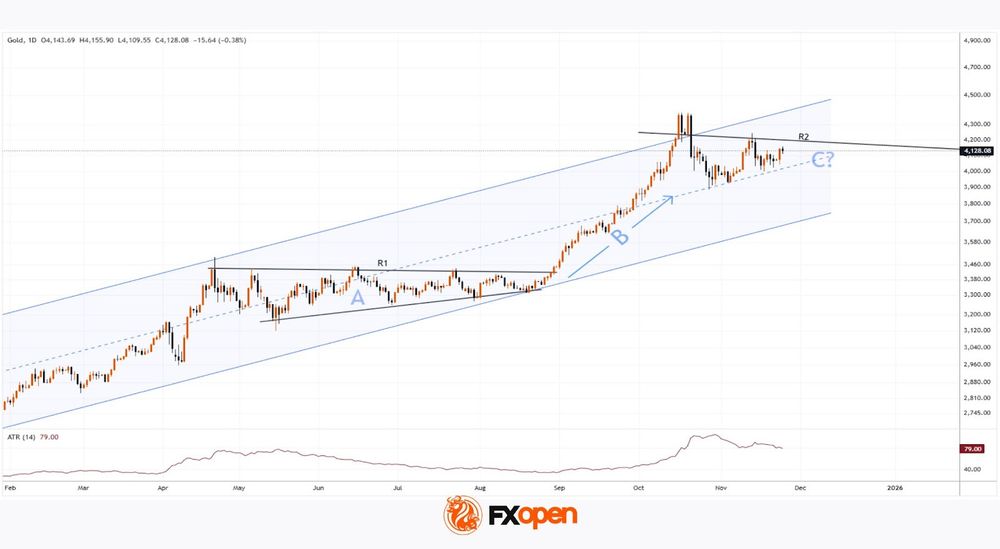
It is reasonable to suggest a similar scenario may be occurring now, with the market in a new consolidation phase (C), and price fluctuations around the psychological $4,000 level reflecting new factors, including:
→ Anticipation of Fed action: Traders are hesitant to push prices to new highs ($4,400) without assurances of further monetary easing, yet are reluctant to sell below $3,900, as the global rate-cut cycle is not yet complete.
→ Dollar strength (DXY) at the end of October – early November.
→ Stabilisation of the geopolitical backdrop.
According to analysts from JPMorgan, Goldman Sachs, and independent experts, gold may remain within a range of $3,950 – $4,150 until the end of 2025.
By analogy with the previous situation, we can expect R2 to hold, with bulls “taking a break” while gold drifts towards the lower boundary of the current channel.
Start trading commodity CFDs with tight spreads. Open your trading account now or learn more about trading commodity CFDs with FXOpen.
This article represents the opinion of the Companies operating under the FXOpen brand only. It is not to be construed as an offer, solicitation, or recommendation with respect to products and services provided by the Companies operating under the FXOpen brand, nor is it to be considered financial advice.
Dow Jones (DJIA): Outperforming US Mega-Cap Technology Stocks
Key takeaways
- Dow Jones continues to outperform despite the AI-led sell-off, holding smaller losses than the Nasdaq 100 and maintaining relative strength supported by value-oriented sector weightings.
- Intermarket signals favour the value factor, with a re-steepening US yield curve and a bullish breakout in value ETF versus momentum ETF, reinforcing the case for medium-term DJIA outperformance over tech-heavy indices.
- The DJIA’s medium-term uptrend remains intact, with price still above its ascending channel support and momentum stabilising; holding 45,650/45,020 keeps the bullish structure intact, with resistances at 48,460 and 49,130/49,220.
The price actions of the US Wall Street 30 CFD Index (a proxy of the Dow Jones Industrial Average futures) have staged the expected rally and hit a fresh all-time high of 48,460 on 12 November 2025.
Thereafter, it faces an “indiscriminating sell-off” in the following week of 17 November 2025, triggered by a loop of negative cascading price actions on the Artificial Intelligence (AI) juggernaut, Nvidia, and other AI-related technology stocks over “bubble bursting” fears.
Despite the synchronized sell-off seen in the past week among the major US stock indices, Dow Jones (DJIA)’s month-to-date performance as of 24 November 2025 fared better than the technology-heavy Nasdaq 100, with a loss of -2.3% versus -3.8% (see Fig. 1).

Fig. 1: Month-to-day performances of global benchmark stock indices as of 24 Nov 2025 (Source: MacroMicro)
Also, intermarket and relative strength analyses of relevant factors (smart beta) exchange-traded funds continue to point to potential outperformance of the Dow Jones (DJIA) over the mega-cap technology-heavy Nasdaq 100 in the medium-term horizon (multi-week)
Let’s unravel.
Value factor outperformance and re-steepening of the US Treasury yield

Fig. 2: US Wall Street 30 CFD Index, momentum, value factors, US Treasury yield curve major trends as of 25 Nov 2025 (Source: TradingView)
The Dow Jones Industrial Average tends to be viewed as a more “value-oriented” barometer benchmark US stock index due to its higher weightage of value-related sectors, such as Financials, over the Nasdaq 100; the Financials sector has a weightage of 27% in the DJIA.
One of the key drivers that allows the DJIA to stage a rally to its recent all-time high on 12 November 2025 is the re-steepening of the US Treasury yield curve (10-year minus 2-year) from 0.48% on 29 October 2025 to 0.53% on 7 November 2025, which, in turn, also reinforced the bullish breakout of the ratio chart of the S&P 500 Enhanced Value ETF (35% weightage in Financials)/S&P 500 ETF (see Fig. 2).
At the same time, the ratio chart of the S&P 500 Momentum ETF (36% weightage in Information Technology)/S&P 500 ETF staged a bearish breakdown on 3 November 2025.
The current re-steepening of the US Treasury yield curve, coupled with a major bullish breakout seen on the ratio chart of S&P 500 Enhanced Value ETF (35% weightage in Financials)/S&P 500 ETF (which indicates the potential outperformance of the value factor in the US stock market) is likely to support a medium-term outperformance of the Dow Jones (DJIA) over the Nasdaq 100.
The Dow Jones (DJIA) continues to oscillate within a medium-term ascending channel

Fig. 3: US Wall Street 30 CFD Index medium-term trend as of 25 Nov 2025 (Source: TradingView)
Despite the recent price action breakdown of the US Wall Street 30 CFD Index below its 20-day and 50-day moving averages, the current price level of 46,392 at the time of writing is still holding above its medium-term ascending channel support in place since the 23 May 2025 low of 41,156 (see Fig. 3).
In addition, the daily RSI momentum indicator has just managed to bounce off a key horizontal support at the 35 level, indicating that downside momentum has started to wane.
Maintain a bullish bias over the medium-term horizon with key medium-term pivotal support zone at 45,650/45,020. A clearance above the 47,100 intermediate resistance is likely to kickstart a new potential bullish implusive up move sequence to retest the 48,460 current all-time high before the next medium-term resistance comes in at 49,130/49,220 (also a Fibonacci extension cluster).
However, a break below 45,020 invalidates the recovery scenario for an extension of the medium-term correction towards the 43,935 long-term pivotal support (also the 200-day moving average).
Commodity Currencies Steady Ahead of US Inflation Data and RBNZ Decision
Commodity-linked currencies have moved into a stabilisation phase after a prolonged decline. Last week, pressure on the AUD and NZD eased slightly, and the pace of the downturn slowed. AUD/USD and NZD/USD are consolidating near major support levels — their yearly lows — where the market is weighing the chances of a short-term rebound against the potential for renewed downside if incoming data disappoints. Investors are cautious ahead of tomorrow’s Reserve Bank of New Zealand meeting and today’s US inflation release, both of which are likely to set the tone for further movement.
Market sentiment remains mixed. On the one hand, risk appetite is supported by reports of progress in US–China trade consultations, although persistent tariff risks continue to limit demand for high-yielding assets. On the other hand, soft US business activity figures and weak industrial data are fuelling expectations that upcoming inflation reports may confirm slowing price pressures. This makes the market particularly sensitive to today’s releases, which may include additional surprises given the impact of the recent shutdown.
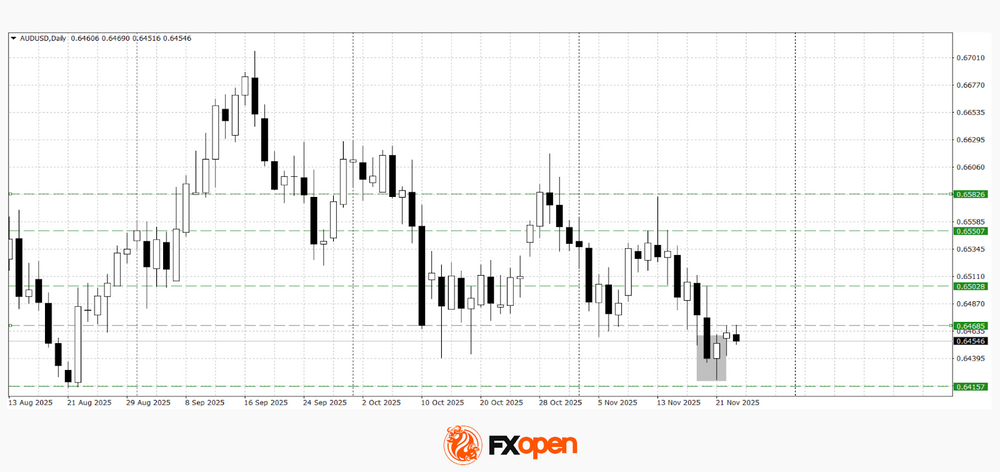
AUD/USD
After failing to reach this year’s August lows, AUD/USD reversed upwards, forming a “piercing line” pattern on the daily timeframe. However, the pattern’s follow-through remains weak, with buyers unable to hold above the key 0.6470–0.6500 range. A break above 0.6500 could trigger a corrective rise towards 0.6550–0.6580. A move below last week’s low may resume the medium-term downtrend.
Key events for AUD/USD:
- Today at 16:30 (GMT+3): US core retail sales
- Today at 16:30 (GMT+3): US Producer Price Index (PPI)
- Tomorrow at 03:30 (GMT+3): Australia Consumer Price Index (CPI)
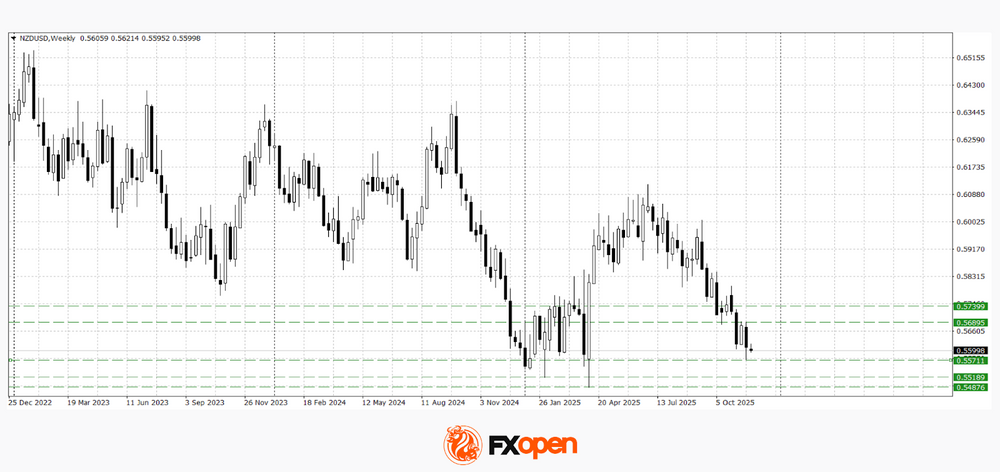
NZD/USD
NZD/USD is trading near 0.5600, slightly above the yearly lows of 0.5490–0.5570. If sentiment deteriorates and the RBNZ cuts rates again, the pair may test and break new lows for the year. If it holds above 0.5600, a corrective rise towards 0.5690–0.5740 is possible.
Key events for NZD/USD:
- Today at 18:00 (GMT+3): US CB Consumer Confidence
- Tomorrow at 04:00 (GMT+3): Reserve Bank of New Zealand rate decision
- Tomorrow at 05:00 (GMT+3): RBNZ press conference
Trade over 50 forex markets 24 hours a day with FXOpen. Take advantage of low commissions, deep liquidity, and spreads from 0.0 pips. Open your FXOpen account now or learn more about trading forex with FXOpen.
This article represents the opinion of the Companies operating under the FXOpen brand only. It is not to be construed as an offer, solicitation, or recommendation with respect to products and services provided by the Companies operating under the FXOpen brand, nor is it to be considered financial advice.
Missing Eco Data Suggest Room for Divided Fed to Push Through One Final “Risk Management” Rate Cut
Markets
Friday’s dip buyers were rewarded by yesterday’s buoyant market conditions, especially in the US. The EuroStoxx50 was still in doubt (+0.25%), but main US indices gained 1.55% (S&P) to 2.7% (Nasdaq). If they manage to take out last week’s high, it would help put to bed fears of a developing sell-on-upticks market. The jury remains out, but stars seem to be aligning in what some hope for: a fresh rally into Christmas. US money markets trade more and more in line with our preferred December Fed rate cut scenario (75% probability). Missing US eco data suggest room for the divided committee to push through one final “risk management” rate cut to bring the policy rate closer to/in neutral territory which is where you want to be as a central bank when conflicting forces on your dual mandate call for different action. Lower rates for downside employment risks and higher rates for upside inflation risks. It’s clear now that the US government will limit data releases to outdated September numbers with new figures (October and/or November payrolls/CPI; Q3 US GDP) all packed between the Dec 10 Fed gathering and Christmas. On a geopolitical front, investors take some comfort by the fact that US President Trump and his Chinese counterpart Xi Jinping are back on speaking terms. After their first in-face encounter since Trump’s first tenure ended in an extension of the trade truce by one year, both men yesterday spoke by phone to further discuss hot topics like fentanyl, soy beans, but also the Russian war in Ukraine. This weekend’s high-stake talks in Geneva gave peace negotiations some fresh momentum. An initial US-brokered 28-point proposal was reduced to a new 19-point plan by the US & Ukraine. Key US and Russian negotiators began talks in Abu Dhabi last night which are set to continue today.
Today’s eco calendar contains September US retail sales and PPI numbers, November Richmond Fed manufacturing index and November consumer confidence. We don’t expect them to really shift market sentiment with regard to the Fed. The faith of the US tech/AI comeback is probably key for overall sentiment in the shortened US trading week (Thanksgiving on Thursday). In FX space, the (trade-weighted) dollar keeps bumping into first important resistance around 100.25. EUR/USD holds steady in the low 1.15-area, but the downside is still vulnerable.
News & Views
The European Automobile Manufacturers’ Association (ACEA) this morning published monthly European car registrations data. Car registrations in the EU in October were 5.8% higher compared to the same month last year. YTD registrations over the Jan-October period were higher by 1.4% Y/Y, slightly up from 0.9% in the previous month. Despite recent positive momentum, ACEA indicates that overall volumes remain far below pre-pandemic levels. The market share of battery electric cars reached 16.4% YTD, up from a low baseline in the Jan-Oct period of 2024, but ACEA assesses that this is still below the pace needed at this stage of the energy transition. The largest four markets in the EU, which together account for 62% of battery-electric car registrations, saw gains: Germany (+39.4%), Belgium (+10.6%), the Netherlands (+6.6%), and France (+5.3%). Hybrid-electric vehicles lead as the most popular power type choice among buyers (34.6% share YTD), with plug-in hybrids ( 9.1%) continuing to gain momentum. The combined market share of petrol and diesel cars fell to 36.6%, down from 46.3% over the same period in 2024. By the end of October 2025, petrol car registrations declined by 18.3%, with all major markets experiencing decreases.
Over the previous days, US Commerce Secretary Lutnick revived a US demand for the EU to make its regulation of the tech sector more balanced. This could be the basis for the US to reduce its 50% levy on EU-imports of steel and aluminum. However, representatives of the European Commission already indicated that the EU digital rulebook is not up for negotiation as the regulation is seen as ensuring “fair markets and to protect consumers rights while ensuring Europe’s digital future”. The US also wants the EU to resolve legal cases against big US tech corporations which the US interprets as a kind of non -tariff barrier. Europe from his side tries to convince the US that its rules are not discriminatory and don’t target US companies. The debate comes as the EU is concerned on the scope of goods that the US keeps under the 50% metals regime, potentially undermining the broader trade agreement that was reached in July.
Fed Cut Hopes Fuel a Rebound Ahead of US Data
Friday’s rebound was thanks to NY Federal Reserve (Fed) President John Williams — who, in the middle of a less-dovish Fed crowd, said the Fed could lower rates in the near term – The Comment that flipped the market’s expectation of a December Fed cut from less than 30% a few days earlier to above 70%. Yesterday’s 1.50% rally in the S&P 500, which particularly revived tech stocks and triggered a 2.62% rally in the Nasdaq 100, was fueled by Fed’s Christopher Waller calling for a December rate cut to support the weakening US jobs market. After that, “we should take a meeting-by-meeting approach,” he said. San Francisco Fed’s Mary Daly echoed similar support for a December cut. The winds have turned very quickly since last week.
The US 2-year yield, which best captures Fed rate expectations, slipped below 3.50% this morning for the first time since October 29 — after the Fed had cut rates by 25 bp but Powell had warned that a December cut was not a done deal.
What changed since then? Well, not much really. Or maybe things have changed, but we don’t yet know in what direction, because a few days after the Fed’s decision the US government shut down — and remained closed for more than a month — meaning the official data flow largely stopped until last week.
When it resumed, September’s NFP data showed that the US economy may have added 120k new nonfarm jobs before the shutdown, but wage growth slowed and the unemployment rate rose to 4.4%. And we still haven’t seen the full inflation picture. CPI data reportedly won’t arrive until after the Fed’s December meeting.
So we must guess: we know US jobs data is weakening, but we don’t know if inflation is heating up. Subdued energy prices certainly keep inflation in check, but we don’t know how much this offsets the impact of tariffs. The latest CPI printed an inflation rate of 3% in the US — significantly above the Fed’s 2% target — and we continue to believe inflation could rise due to tariffs, now that pre-tariff stocks have been sold and companies may need to pass some costs onto consumers.
I see three possible Fed scenarios for December
- The Fed refrains from cutting rates, waiting for inflation data to ensure they’re cutting based on facts, not hope. Short-term yields rebound, risk assets may be disappointed, and the following data shapes January expectations — likely pushing the rate cut further out.
- The Fed cuts and CPI data comes in line — or ideally softer than expected, with hints of no tariff-led inflation. Bulls rush in, stress over tech valuations and accounting rules fades, Santa arrives with gifts, and the party could continue.
- The Fed cuts but CPI prints hotter than expected the week after. The idea that the Fed should walk back the latest rate cut injects stress and volatility, potentially triggering a 10-15% S&P 500 selloff as hopes for further cuts vanish.
I can’t tell you what’s on the menu. But the probability of a December rate cut just spiked past 80% over the past two sessions. The last time we saw Fed rate expectations change that fast — September 2024 — the last-minute 50 bp cut turned out to be a mistake, and the Fed had to pause for a year before moving again. Did it prevent the bulls from buying? Not really.
Anyway, it’s always fun to watch the data. Today, the US will release its latest PPI and retail sales. Last week’s results from big US retailers suggest the consumer isn’t cracking — but is clearly tightening the purse strings as higher prices and borrowing costs bite. Retail sales may have slowed in September (which is good for those hoping for a 25 bp cut) and producer prices may have accelerated month-on-month but slowed year-on-year (mixed enough to let the market focus on the metric it prefers). But because data tells the past, what Fed members say is more important to investors than what prints. For now, investors are banking on another 25 bp cut — positive for sentiment.
US futures are flat to slightly negative this morning. The 10% drop in SoftBank reflects fears it bet on the wrong horse — OpenAI and Nvidia — following news that Alibaba’s Qwen 3 counted more than 10 million downloads in its first week and Google’s latest Gemini 3 earned praise for its progress in 3D reasoning, agentic abilities, and “vibe” coding. Here’s a suggestion: the AI bubble may not burst entirely, but some parts could. Whatever happens, Google looks set to keep rallying like it’s 2023!
In FX, the US dollar seems confused by the quick Fed-expectation swing. It looks very doji-like since spiking past the 200-DMA and hasn’t been willing to move lower — partly because other majors like the yen and sterling look unappealing. For the yen, t the Bank of Japan (BoJ) will hardly hike rates in the next meeting, as Takaichi doesn’t want it, and JGB yields are spiking to levels that make the risk unappealing. For sterling, tomorrow’s Budget is make-or-break: either the Bank of England (BoE) steps in to prevent a gilt flare-up if investors dislike what they hear, or to cushion the economy if tax hikes bite hard. Either way, the Fed will say the last word, but the dovish shift in other central bank stances could soften any renewed weakness in greenback.
US Data Back on the Radar
In focus today
Several key indicators for the US economy are set to be released in the afternoon. This includes the PPI, retail sales and the consumer confidence indicator. Note that the PPI and retail sales are part of the delayed September releases. With few other data prints are on the agenda, the market reaction could be larger than usual and may very well affect sentiment surrounding the FOMC December meeting.
Economic and market news
What happened overnight
In the Ukraine war, the US and Ukraine drafted a 19-point peace deal with the remaining elements to be discussed by President Trump and President Zelenskiy. The remainders include territorial concessions and NATO relations. The Ukrainian delegation said that the next steps include presenting the plan to both Presidents and the White House approaching Moscow with the deal.
What happened yesterday
In the US, Fed governor Waller said he would support the central bank cutting rates in December, citing the weak job market. He also added that any further action would depend on the delayed US data releases. The market is currently pricing the odds of a December interest rate cut about 70%.
In Germany, the Ifo Business Climate index for November declined to 88.1 (cons: 88.5) from 88.4. The assessment of the current situation rose marginally to 85.6 as expected (cons: 85.5) from 85.3. The expectations index was behind the decline, unexpectedly declining to 90.6 (cons: 91.6) from 91.6. The current situation remains stable around the average level of the past year. Despite this month's decline, expectations are markedly higher than last year. The German economy has yet to recover but expectations for a recovery remain intact. We will likely have to await the effects of fiscal easing before the economy records a rebound in activity.
Equities: Global equities rebounded for a second consecutive day. The US market led the way, with the S&P 500 rising 1.7%. Unlike Friday's session - which was a selective rotation in all areas but growth and momentum stocks - Monday's rebound was about buying the dip in US tech. Outside US tech most sectors were flat or even lower, signalling a rotation out of staples and energy and back into AI-related names (tech outperformed staples by 4 percentage points yesterday). To give a sense of the magnitude, Alphabet, Broadcom and Tesla rallied between 7-11%.
The 2% gain in the S&P 500 contrasts to lukewarm 0.3% return in European equities on Monday. Not to mention Danish equities that fell 2% after Novo Nordisk failed to demonstrate a statistically significant reduction in Alzheimer's disease progression. The key point is that while an "AI capex hangover" is the most common and logical explanation for the recent pullback, European- and Nordic equities have now sold off more from their peak than US markets, despite a far smaller AI exposure. This either argues for a catch-up in the coming days or suggests that the selloff has also been driven by factors beyond AI scepticism.
FI and FX: While it is clearly a strong divide between the doves and the hawks in the Fed board as revealed by the dots, by Powell's words at the press conference, his pushback against the then-almost-fully-priced December cut, and recent Fed speeches, the market has taken its cue from the dovish camp. As such, US rates edge lower, the Fed is being re-priced (again) and the December contract now trades at -19bp, while equities and therein particularly the tech sector rally. Yesterday, S&P 500 closed at +1.6% and Nasdaq at +2.7%. Interestingly, the positive sentiment has not had much impact on FX this week. EUR/USD is roughly stable just above 1.15 while EUR/SEK and EUR/NOK are stuck around 11.00 and 11.80.
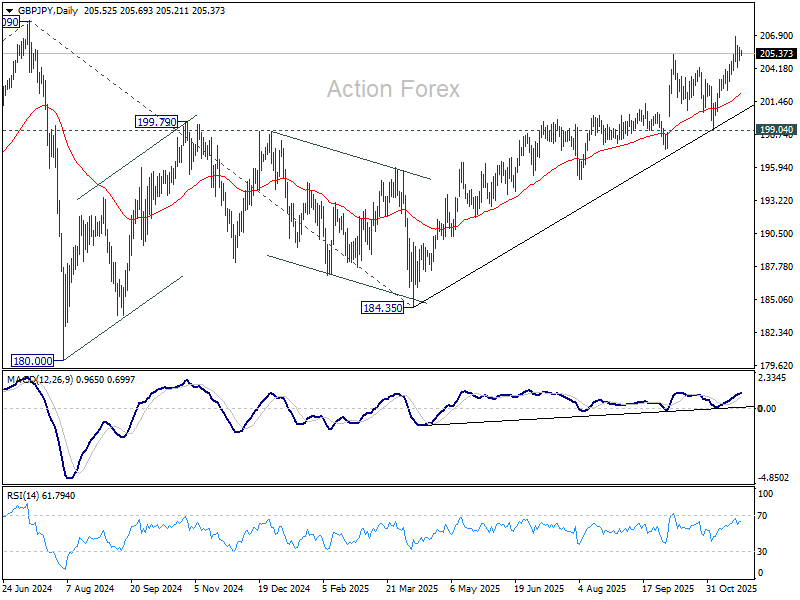
GBP/JPY Daily Outlook
Daily Pivots: (S1) 205.02; (P) 205.46; (R1) 206.09 More...
Intraday bias in GBP/JPY remains neutral and more consolidations could be seen below 206.84. Deeper retreat cannot be ruled out, but downside be contained by 202.31 support to bring another rise. Break of 206..84 will target 208.09 high. Decisive break there will confirm long term up trend resumption.
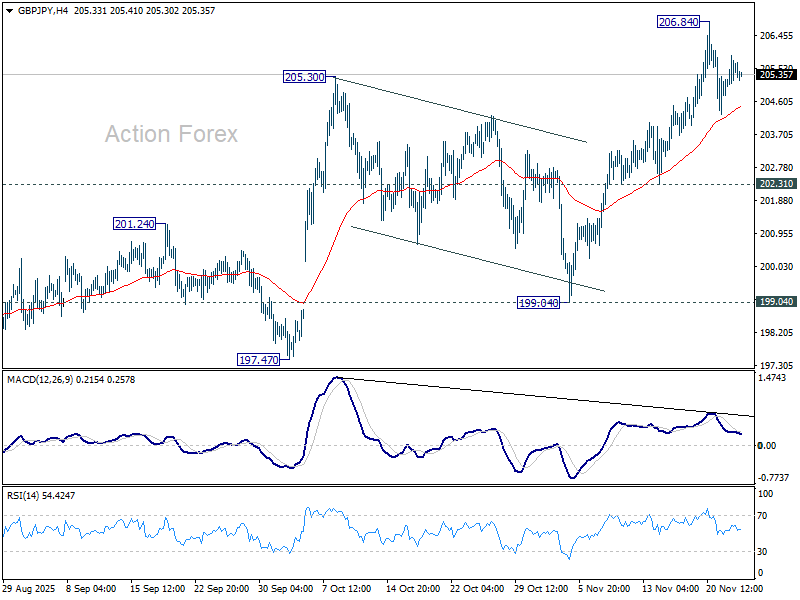
In the bigger picture, price actions from 208.09 (2024 high) are seen as a corrective pattern which might have completed at 184.35. Firm break of 208.09 high will resume the up trend from 123.94 (2020 low). Next target is 61.8% projection of 148.93 to 208.09 from 184.35 at 220.90. However, decisive break of 199.04 support will dampen this view and extend the corrective pattern with another fall.
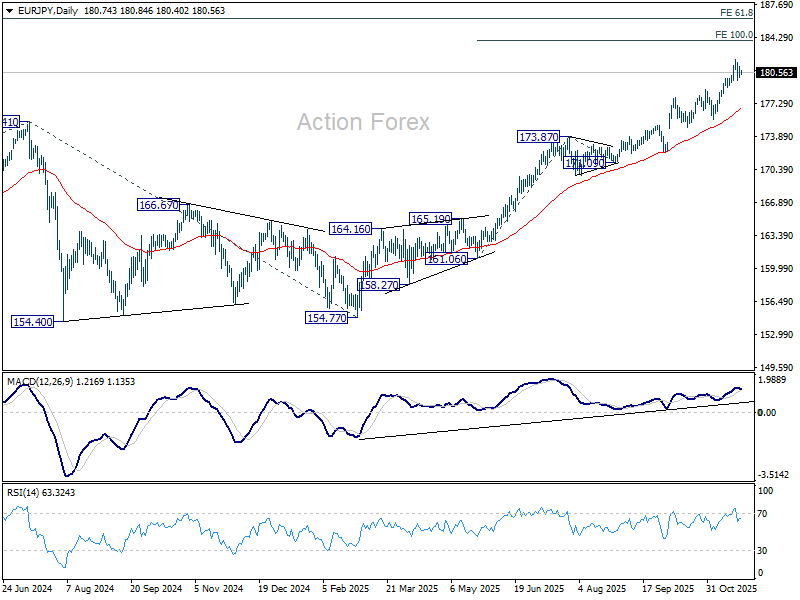
EUR/JPY Daily Outlook
Daily Pivots: (S1) 180.14; (P) 180.71; (R1) 181.34; More...
Intraday bias in EUR/JPY remains neutral and more consolidations could be seen below 181.98. Deeper retreat cannot be ruled out, but downside should be contained by 178.80 resistance turned support to bring another rally. On the upside, break of 181.98 will target 100% projection of 161.06 to 173.87 from 171.09 at 183.90 next. However, firm break of 178.80 will argue that deeper correction is already underway towards 55 D EMA (now at 176.63).
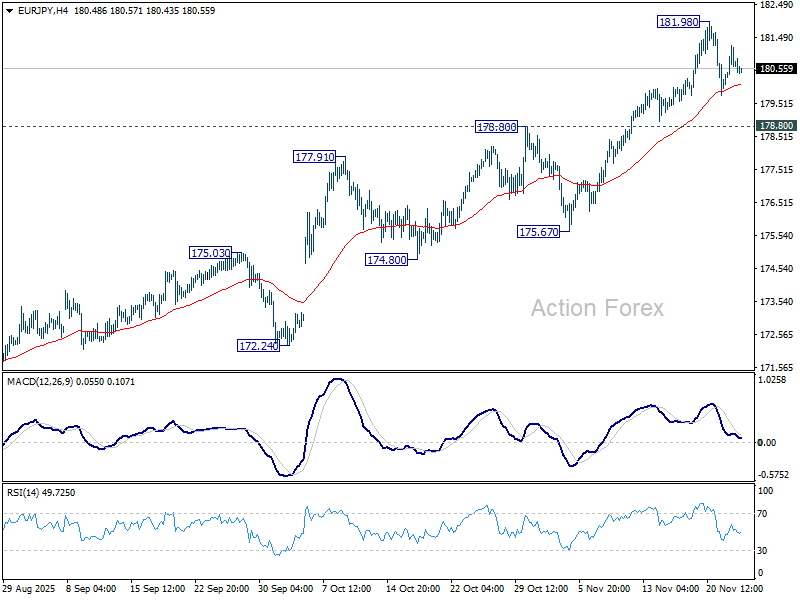
In the bigger picture, up trend from 114.42 (2020 low) is in progress and should target 61.8% projection of 124.37 to 175.41 from 154.77 at 186.31. Outlook will continue to stay bullish as long as 55 W EMA (now at 169.42) holds, even in case of deep pullback.
EUR/GBP Daily Outlook
Daily Pivots: (S1) 0.8777; (P) 0.8799; (R1) 0.8813; More…
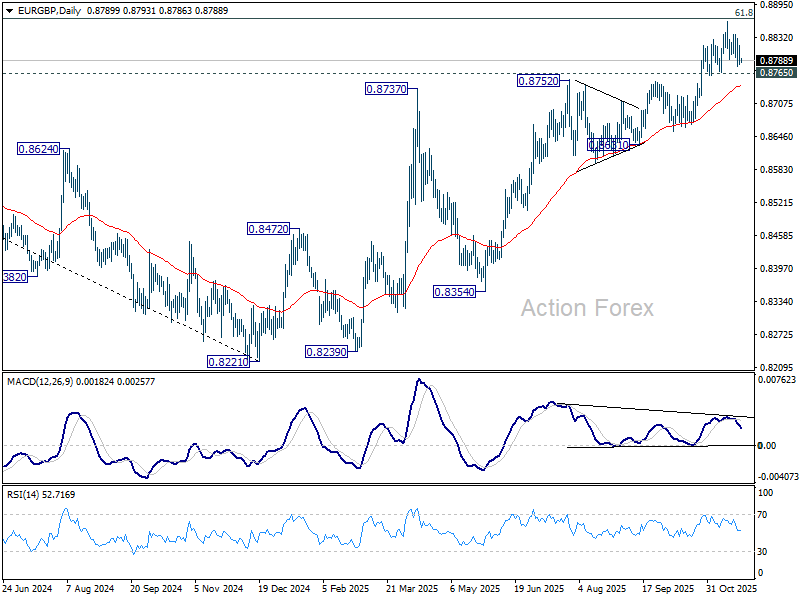
Intraday bias in EUR/GBP remains neutral as sideway trading continues. Considering bearish divergence condition in 4H MACD, firm break of 0.8765 support will confirm short term topping. Intraday bias will be back to the downside for 55 D EMA (now at 0.8741). Sustained break there will be an early sign of bearish trend reversal. Nevertheless, decisive break of 0.8867 fibonacci level will carry larger bullish implications.
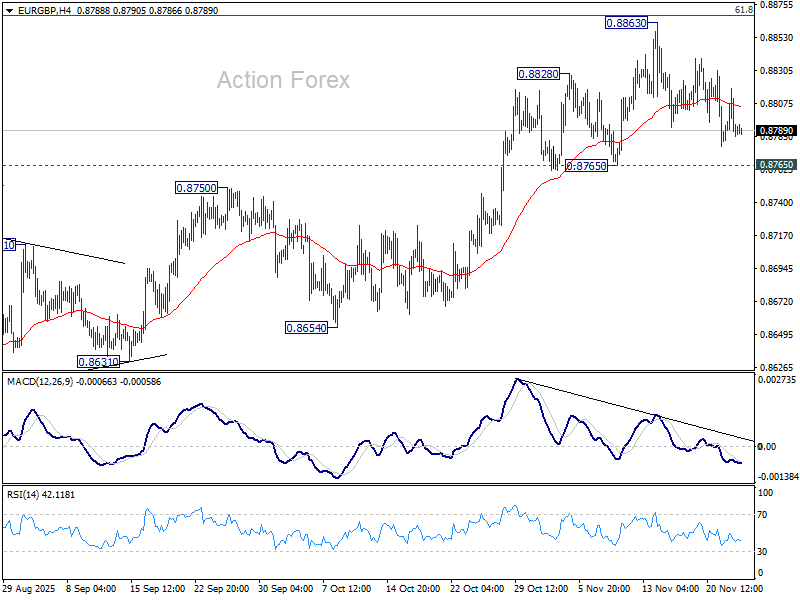
In the bigger picture, rise from 0.8221 medium term bottom is still seen as a corrective move. Upside should be limited by 61.8% retracement of 0.9267 to 0.8221 at 0.8867. Sustained trading below 55 W EMA (now at 0.8588) should confirm that this corrective bounce has completed. However, decisive break of 0.8867 will suggest that EUR/GBP is already reversing whole decline from 0.9267 (2022 high). That should pave the way back to 0.9267.
EUR/AUD Daily Outlook
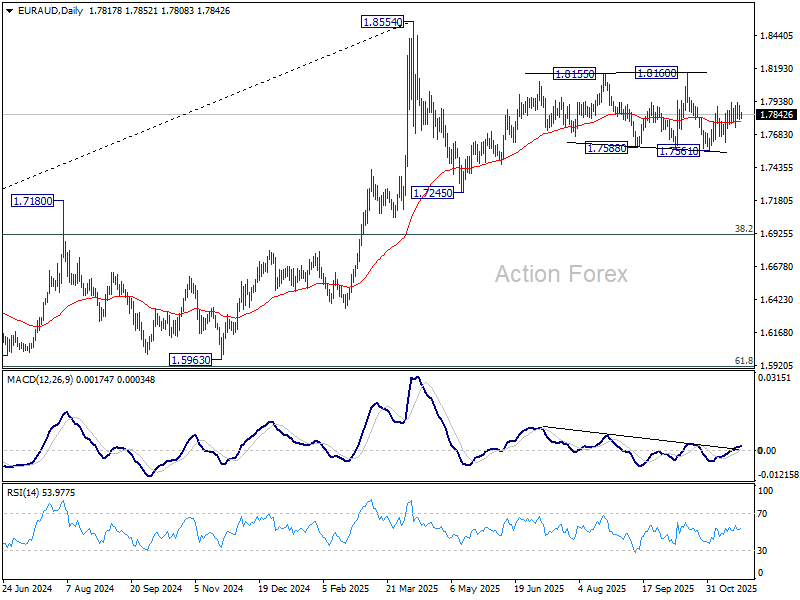
Daily Pivots: (S1) 1.7782; (P) 1.7845; (R1) 1.7889; More...
Intraday bias in EUR/AUD stays neutral as sideway trading continues. On the upside, above 1.7934 will resume the rebound from 1.7561 towards 0.8160 resistance. On the downside, however, break of 1.7739 support will argue that the rebound has completed and turn bias back to the downside for 1.756.
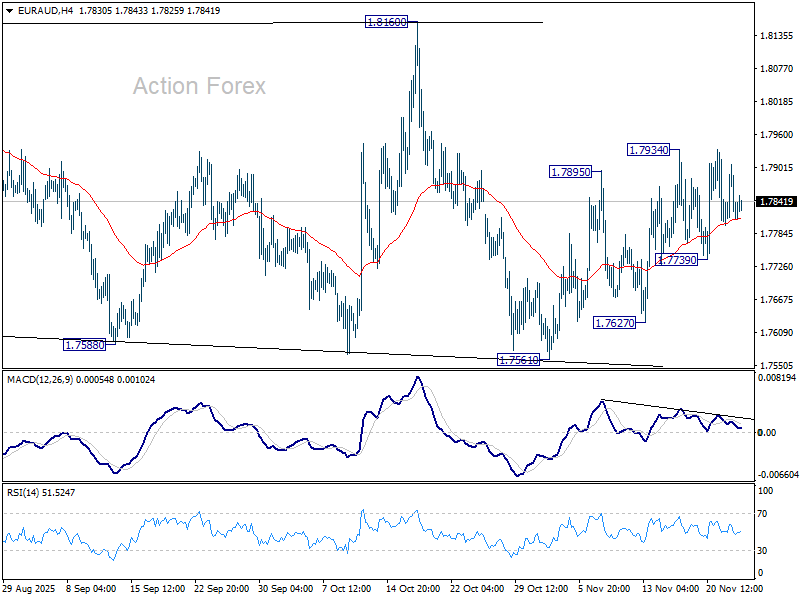
In the bigger picture, price actions from 1.8554 medium term top are seen as a corrective pattern. Sustained break of 55 W EMA (now at 1.7426) will suggest that it's correcting the whole rally from 1.4281 (2022 low). In this case, deeper decline would be seen to 38.2% retracement of 1.4281 to 1.8554 at 1.6922. Nevertheless, strong rebound from 55 W EMA will likely bring resumption of the up trend sooner.