
Sample Category Title
EUR/CHF Daily Outlook
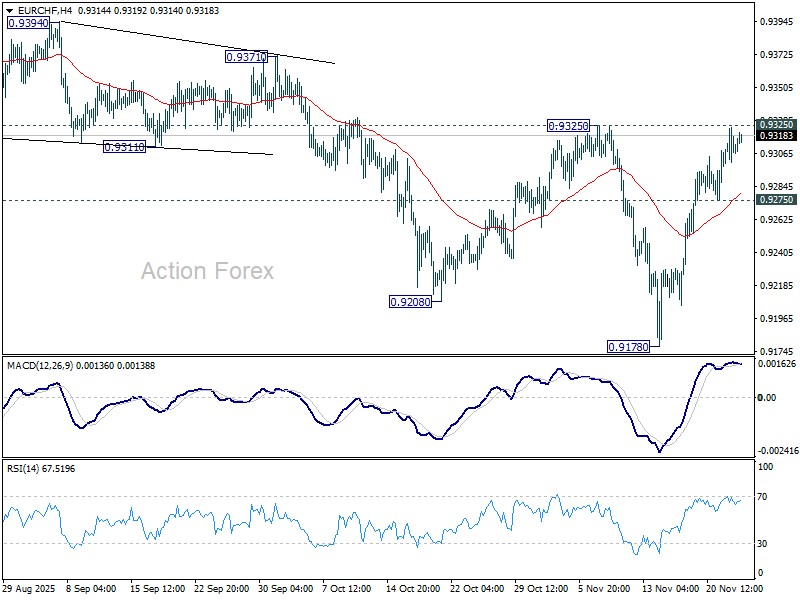
Daily Pivots: (S1) 0.9299; (P) 0.9313; (R1) 0.9327; More....
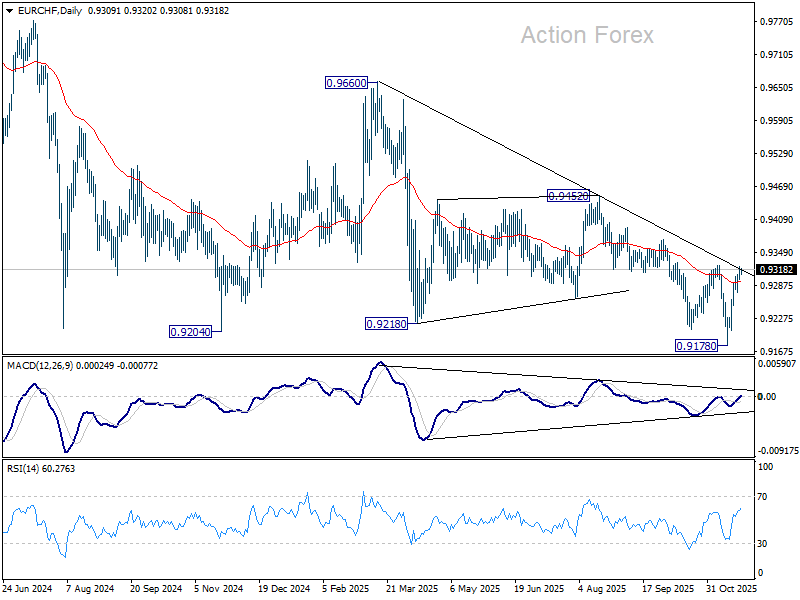
Focus stays on 0.9325 resistance in EUR/CHF. Considering bullish convergence condition in D MACD, decisive break of 0.9325 will argue that whole fall from 0.9660 has completed. Strong rally should then be seen towards 0.9452 resistance. Nevertheless, rejection by 0.9325 will retain near term bearishness. Break of 0.9275 minor support will turn bias back to the downside for 0.9178 low.
In the bigger picture, outlook remains bearish with EUR/CHF staying well inside long term falling channel after multiple rejection by 55 W EMA (now at 0.9377). Next target is 61.8% projection of 1.1149 to 0.9407 from 0.9928 at 0.8851. Break of 0.9452 resistance is needed to be the first sign of medium term bottoming. Otherwise, outlook will stay bearish in case of strong rebound.
EUR/USD Daily Outlook
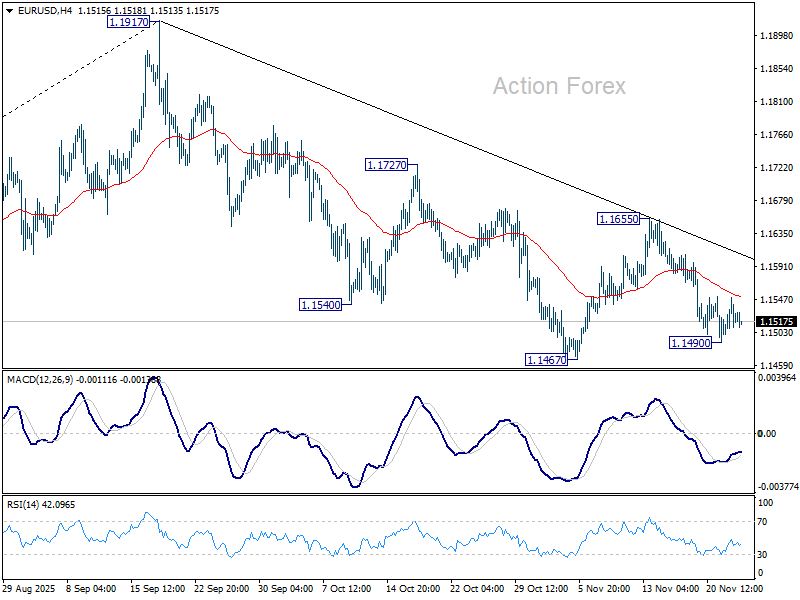
Daily Pivots: (S1) 1.1499; (P) 1.1524; (R1) 1.1547; More…
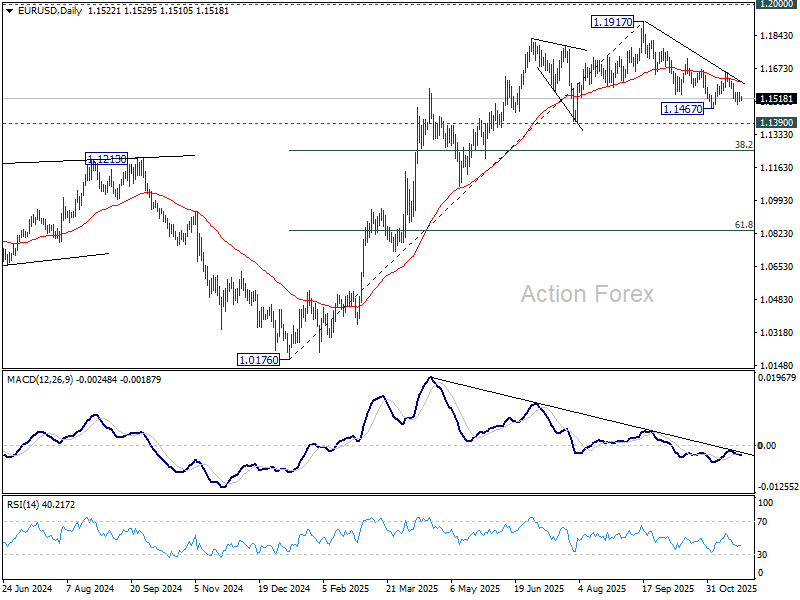
Intraday bias in EUR/USD remains neutral for the moment, and some more consolidations could be seen. Nevertheless, risk will stay on the downside as long as 1.1655 resistance holds. Below 1.1490 and 1.1467 will resume the whole decline from 1.1917 high. Next targets are 1.1390, and then 38.2% retracement of 1.0176 to 1.1917 at 1.1252.
In the bigger picture, considering bearish divergence condition in D MACD, a medium term top is likely in place at 1.1917, just ahead of 1.2 key psychological level. As long as 55 W EMA (now at 1.1328) holds, the up trend from 0.9534 (2022 low) is still in favor to continue. Decisive break of 1.2000 will carry larger bullish implications. However, sustained trading below 55 W EMA will argue that rise from 0.9534 has completed as a three wave corrective bounce, and keep long term outlook bearish.
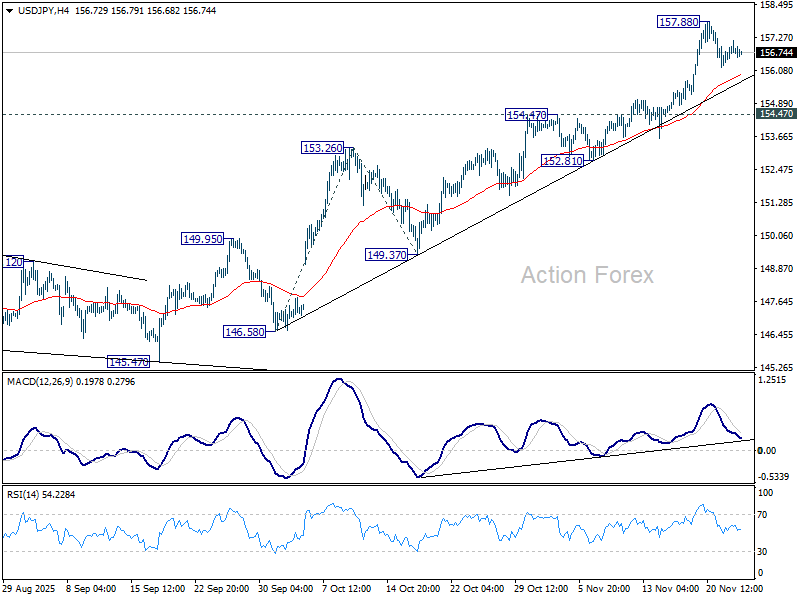
USD/JPY Daily Outlook
Daily Pivots: (S1) 156.46; (P) 156.82; (R1) 157.30; More...
USD/JPY's consolidations continue below 157.88 and intraday bias remains neutral. Downside of retreat should be contained by 154.47 resistance turned support to bring rebound. On the upside, break of 157.88 will resume the whole rally from 139.87, and target 161.8% projection of 146.58 to 153.26 from 149.37 at 160.17.
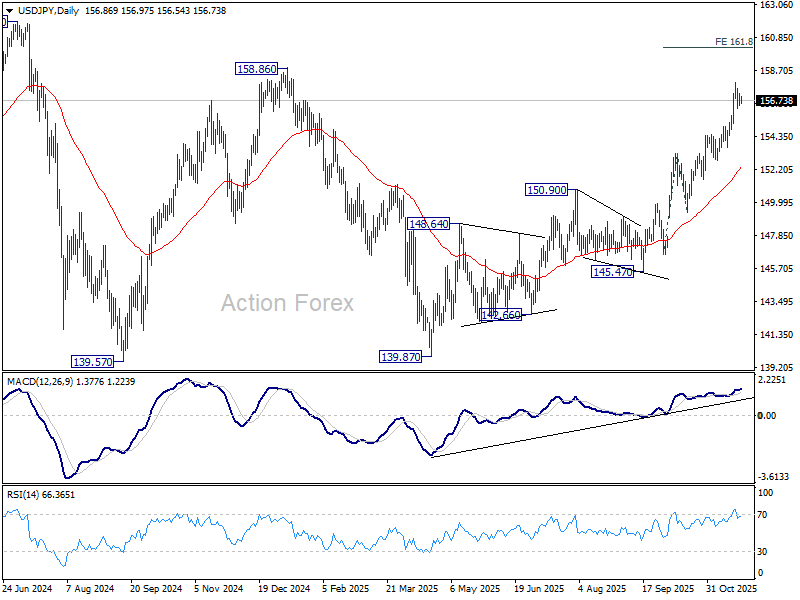
In the bigger picture, current development suggests that corrective pattern from 161.94 (2024 high) has completed with three waves at 139.87. Larger up trend from 102.58 (2021 low) could be ready to resume through 161.94 high. Decisive break of 158.85 structural resistance will solidify this bullish case and target 161.94 for confirmation. On the downside, break of 150.90 resistance turned support will dampen this bullish view and extend the corrective range pattern with another falling leg.
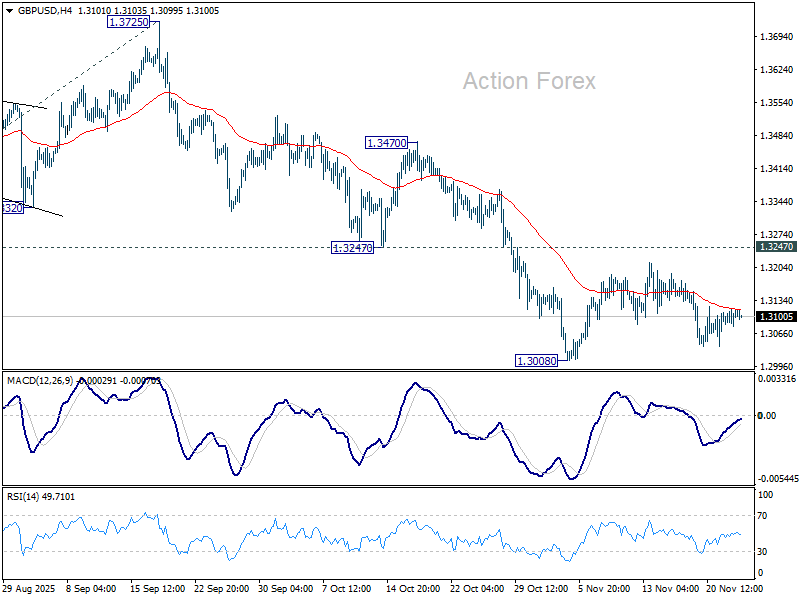
GBP/USD Daily Outlook
Daily Pivots: (S1) 1.3083; (P) 1.3101; (R1) 1.3121; More...
Intraday bias in GBP/USD remains neutral as range trading continues. With 1.3247 support turned resistance intact, further decline is expected. On the downside, break of 1.3008 will resume the fall from 1.3725 to 138.2% projection of 1.3787 to 1.3140 from 1.3725 at 1.2831. Nevertheless, firm break of 1.3247 will suggest that fall from 1.3787 has completed as a corrective move already.
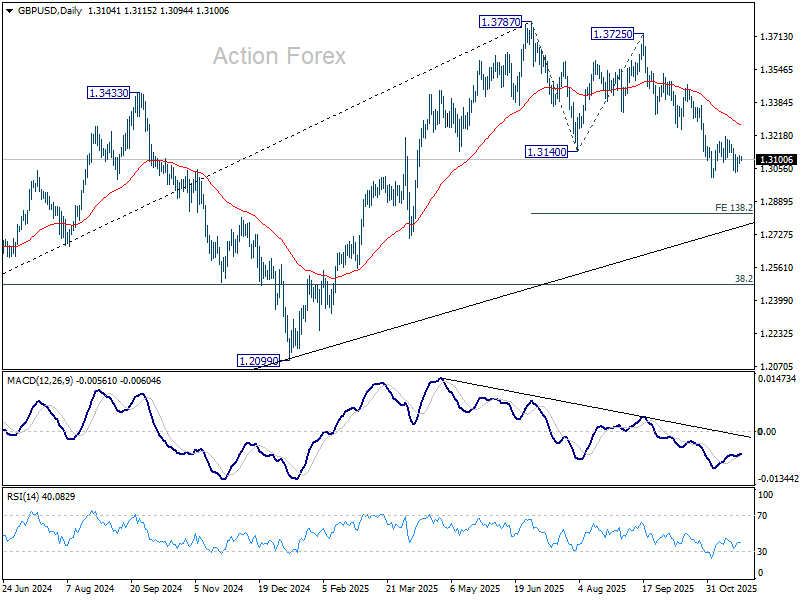
In the bigger picture, the break of 55 W EMA (now at 1.3184) is taken as the first sign that corrective rise from 1.0351 (2022 low) has completed. Decisive break of trend line support (now at 1.2760) will solidify this case and target 38.2% retracement of 1.0351 to 1.3787 at 1.2474 next. Meanwhile, in case of another rise, strong resistance should emerge below 1.4248 (2021 high) to cap upside to preserve the long term down trend.
USD/CHF Daily Outlook
Daily Pivots: (S1) 0.8063; (P) 0.8082; (R1) 0.8104; More…
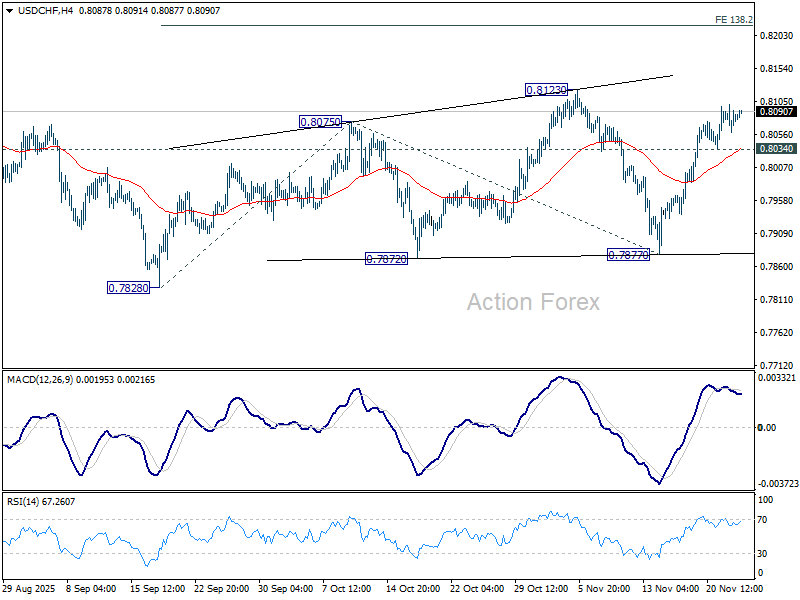
Intraday bias remains mildly on the upside or 0.8123. Outlook is unchanged that corrective pattern from 0.7828 low is still extending. Break of 0.8123 will target 138.2% projection of 0.7828 to 0.8075 from 0.7877 at 0.8218. On the downside, below 0.8034 minor support will turn intraday bias neutral first.
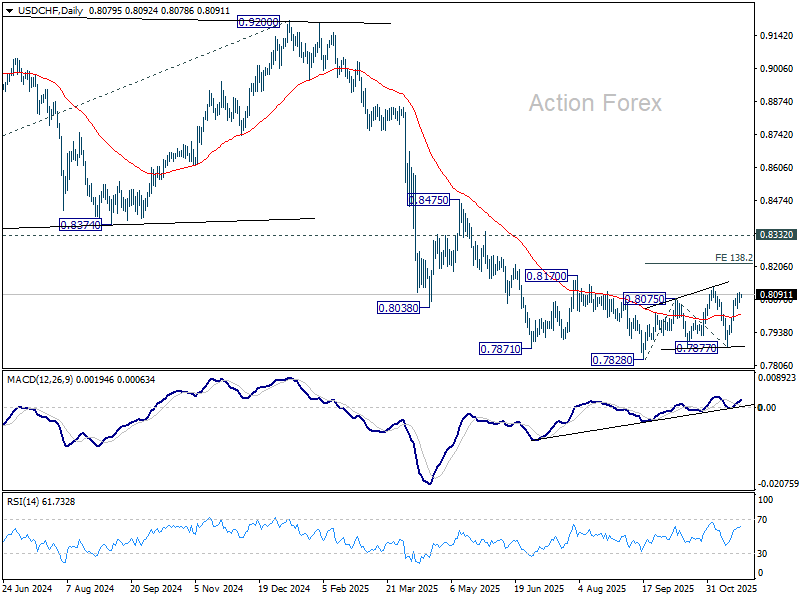
In the bigger picture, long term down trend from 1.0342 (2017 high) is still in progress. Next target is 100% projection of 1.0146 (2022 high) to 0.8332 from 0.9200 at 0.7382. In any case, outlook will stay bearish as long as 0.8332 support turned resistance holds (2023 low).
USD/CAD Daily Outlook
Daily Pivots: (S1) 1.4093; (P) 1.4106; (R1) 1.4120; More...
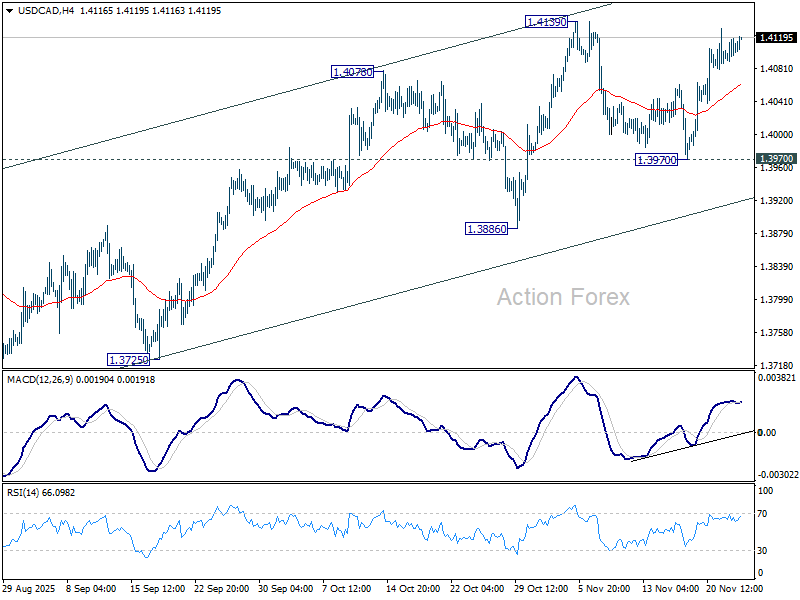
No change in USD/CAD's outlook and intraday bias stays neutral. Further rally is expected with 1.3970 support intact. On the upside,f decisive break of 1.4139 resistance will resume whole rally from 1.3538. Next target is 61.8% retracement of 1.4791 to 1.3538 at 1.4312.
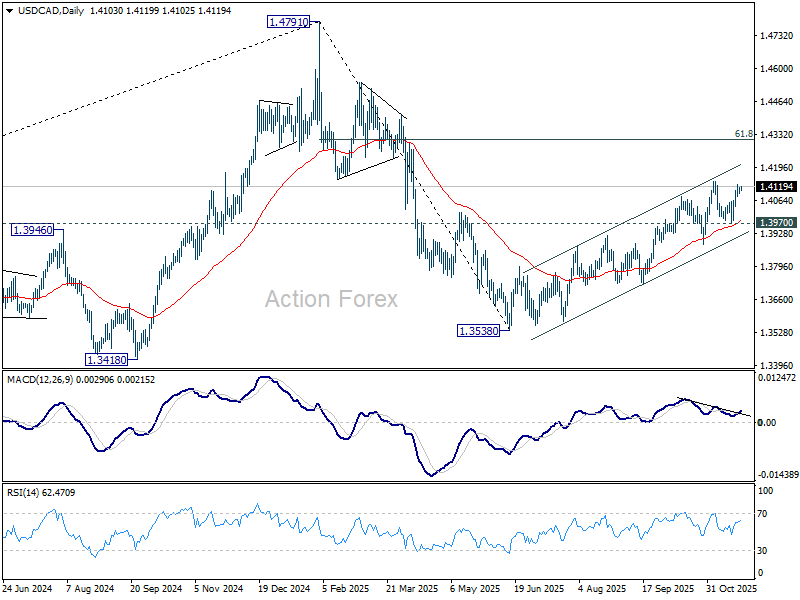
In the bigger picture, price actions from 1.4791 medium term top is likely just unfolding as a correction to up trend from 1.2005 (2021 low), with rise from 1.3538 as the second leg. A third leg should follow before up trend resumption. That is, range trading is set to extend for the medium term. For now, this will remain the favored case as long as 1.3886 support holds. However, firm break of 1.3886 will revive the case that fall from 1.4791 is indeed a larger scale correction.
AUD/USD Daily Report
Daily Pivots: (S1) 0.6447; (P) 0.6458; (R1) 0.6474; More...
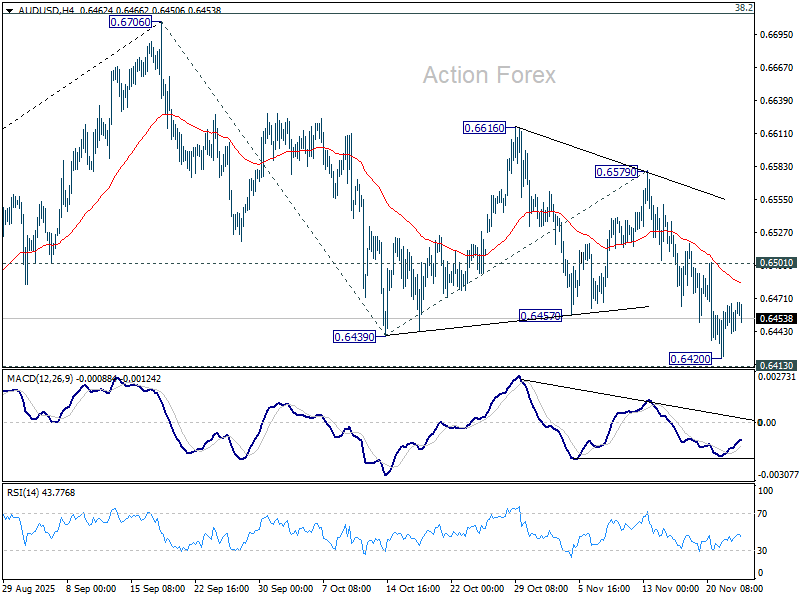
Intraday bias in AUD/USD stays neutral for the moment. Further fall is expected as long as 0.6501 resistance holds. Decisive break of 0.6413 cluster (38.2% retracement of 0.5913 to 0.6706 at 0.6403) should confirm near term bearish reversal. Next target is 100% projection of 0.6706 to 0.6439 from 0.6579 at 0.6312. However, firm break of 0.6501 will turn bias back to the upside for stronger rebound.
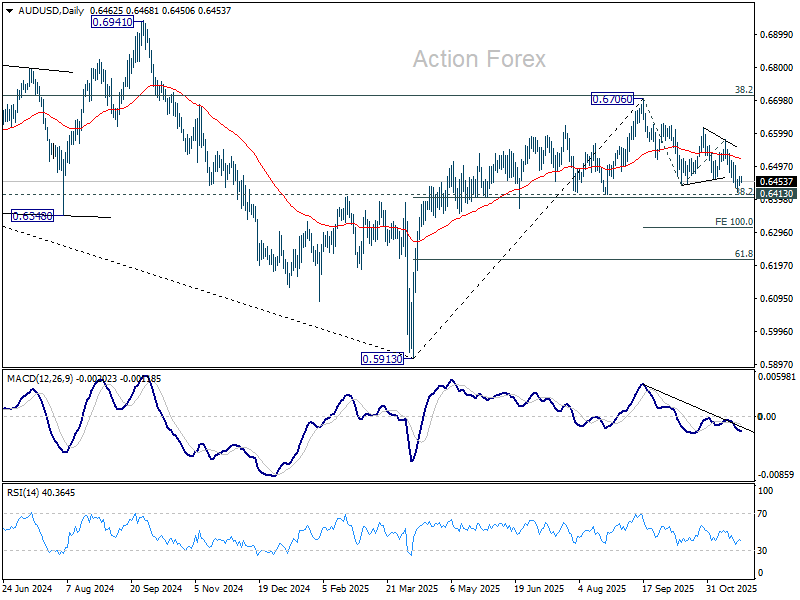
In the bigger picture, there is no clear sign that down trend from 0.8006 (2021 high) has completed. Rebound from 0.5913 is seen as a corrective move. Outlook will remain bearish as long as 38.2% retracement of 0.8006 to 0.5913 at 0.6713 holds. Break of 0.6413 support will suggest rejection by 0.6713 and solidify this bearish case. Nevertheless, considering bullish convergence condition in W MACD, sustained break of 0.6713 will be a strong sign of bullish trend reversal, and pave the way to 0.6941 structural resistance for confirmation.
Currencies Stay Calm Despite Risk-On Tone; Focus Turns to Delayed U.S. Data
Trading in the currency markets remained largely steady in Asian session, with major pairs and crosses stuck in unusually tight ranges. There was little conviction in either direction, and the mild risk-on tone that followed the strong U.S. close failed to generate follow-through in FX.
The December Fed cut narrative has effectively been priced in, which has supported equities, bonds, and precious metals but left currencies with little incremental reaction. But traders are reluctant to extend Dollar selling without new surprises.
Attention turns to another batch of delayed U.S. data today, including September retail sales and PPI. While these releases will help fill in missing pieces from the shutdown period, they are not expected to generate meaningful volatility. With the Fed’s near-term path largely settled, only a significant surprise would impact rate expectations.
For the week so far, Euro is leading the pack, followed by Aussie and Dollar. At the other end, Yen is the weakest performer, with Kiwi and Swiss Franc also soft. Sterling and Loonie sit in the middle. The distribution reflects an environment where risk sentiment is steady but uninspired.
In Asia, at the time of writing, Nikkei is up 0.20%. Hong Kong HSI is up 0.69%. China Shanghai SSE is up 0.86%. Singapore Strait Times is down -0.31%. Japan 10-year JBG yield is up 0.008 at 1.796. Overnight, DOW rose 0.44%. S&P 500 rose 1.55%. NASDAQ rose 2.69%. 10-year yield fell -0.025 to 4.038.
Fed’s Daly backs December cut, warns job market risks outweigh inflation
San Francisco Fed President Mary Daly signaled clear support for a rate cut at next month’s FOMC meeting, telling the Wall Street Journal that the Fed now faces greater risk from a sudden deterioration in the labor market than from another inflation flare-up.
She said the job market is “vulnerable enough now” that the risk of a sharp, "nonlinear" weakening is rising, leaving policymakers with less room to react if they wait too long. Daly emphasized that she no longer feels confident the Fed can “get ahead of” labor-market weakening, arguing that the damage from a sudden drop in hiring would be harder to manage than moderating inflation.
On inflation, Daly said the chance of a meaningful reacceleration appears limited, pointing to softer-than-expected tariff-related cost increases this year.
Gold rises towards 4244 as dovish Fed signals drive yields lower
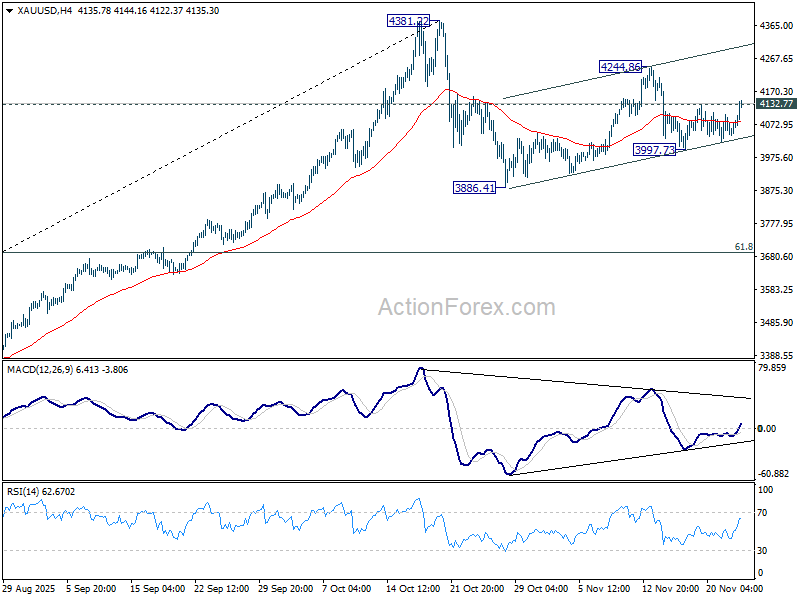
Gold pushed higher this week as markets continued to recalibrate toward a December Fed rate cut. The move come in tandem with notable falling 10-year yield, which provide some tailwinds to the precious metal too. More upside is expected in Gold in the near term, even though a new record is still expected next year, rather than this.
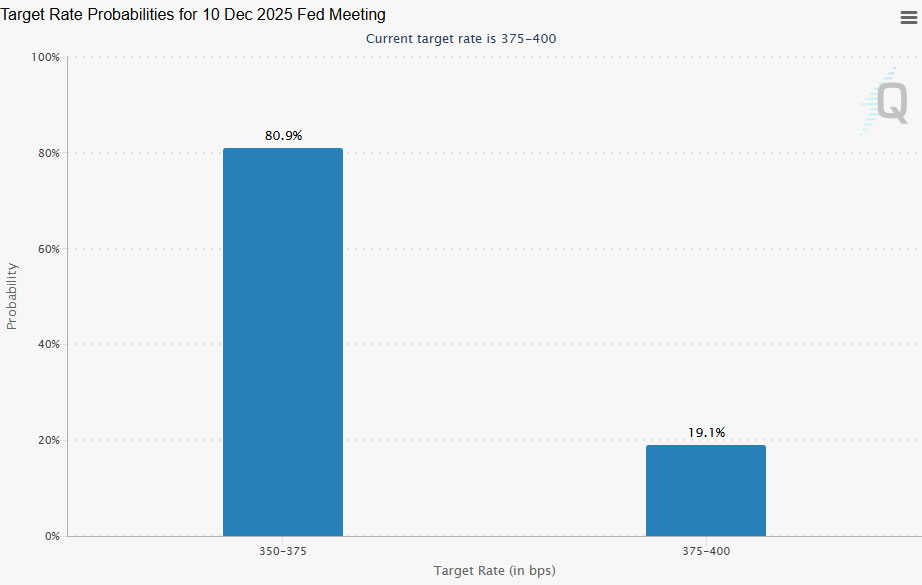
The Fed’s internal balance has moved noticeably toward the dovish camp. Mary Daly, in her WSJ interview, argued that labor-market fragility now poses a greater risk than inflation and said she supports easing next month. While not a vote, her comments—combined with John Williams’ earlier pivot—validates that the center of the Fed’s spectrum has shifted meaningfully towards easing. That has driven expectations for a December cut to around 80%.
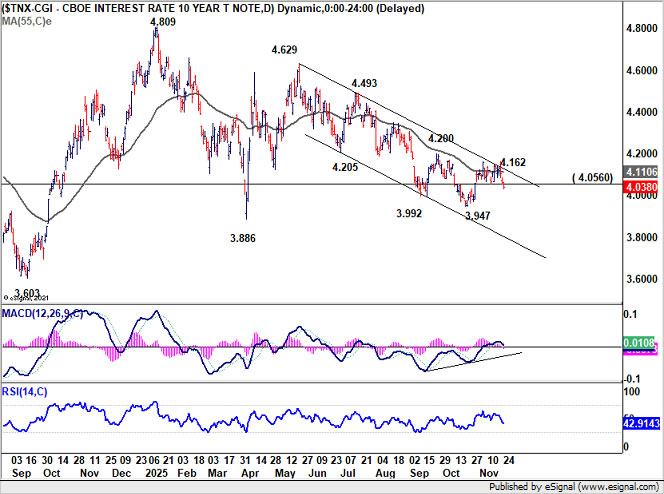
Technically, 10-year yield's break of 4.056 support suggests that corrective rebound from 3.947 has completed at 4.162, after hitting falling channel resistance that started at 4.629 (May high). Further decline would now be seen towards 3.947 low.
Gold’s breakout above 4,132.77 indicates that pullback from 4,244.86 bottomed at 3,997.73. The rally from 3,886.41, as the second leg of the broader corrective pattern from 4,381.22, remains in progress. Further rise is expected to 4,244.86 and higher, as support by weakness in yield. But strong resistance should emerge from 4,381.22 high to cap upside to bring the third leg of the pattern.
Two-way risks for AUD/NZD as RBNZ cut meets rising Australia CPI
AUD/NZD is shaping up for an active week, with two major catalysts—RBNZ’s rate announcement and Australia’s monthly CPI—set to hit on Wednesday.
RBNZ is widely expected to cut the OCR by 25bps to 2.25%. The NZIER Monetary Policy Shadow Board also endorsed a quarter-point reduction, arguing that although the economy is beginning to recover from a low base, excess capacity remains and a small additional cut is justified. Some members, however, warned against pushing stimulus too far, citing the risk of reigniting inflation—highlighting a cautious undercurrent within the broader policy debate.
On the medium-term path, the Shadow Board’s views clustered around an OCR of 2.25%–2.50% in a year, implying broad consensus that only limited easing will be required beyond November. While a minority still consider the risk of a larger, front-loaded cut—particularly given the long three-month gap until the next meeting—the Board’s recommendations may help stabilize expectations at a standard 25bps move.
In Australia, CPI is expected to rise again, from 3.5% to 3.6% for October, the fourth consecutive acceleration from June’s trough of 1.9%. A trend like this keeps the RBA firmly on hold for the remainder of the year, with any upside surprise diminishing the likelihood of a February rate cut. Sticky inflation would strengthen AUD by reinforcing Australia’s higher-for-longer stance relative to New Zealand’s easing cycle.
Technically, AUD/NZD carved out a short-term top at 1.1634 earlier this month and has since turned sideway. For now, it’s seen as in a brief near term correction. Break of 1.1570 minor resistance will solidify this case and bring retest of 11634 high.
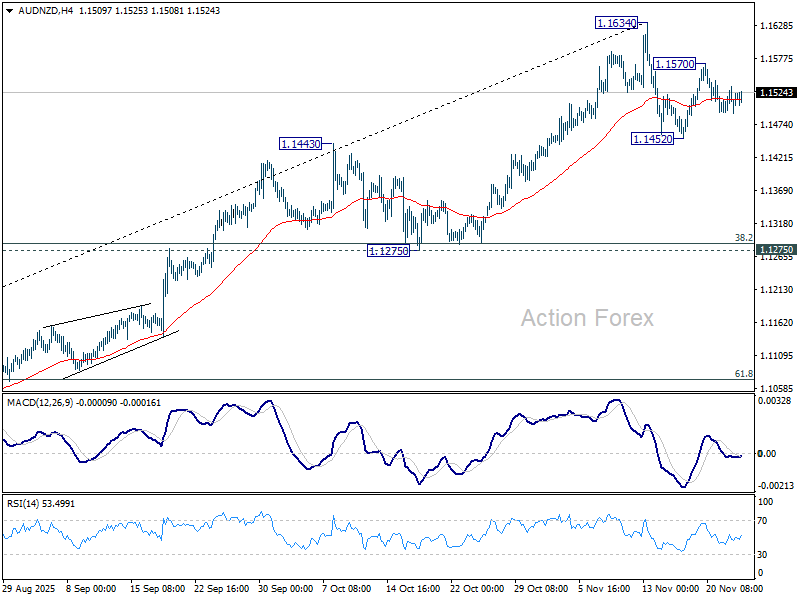
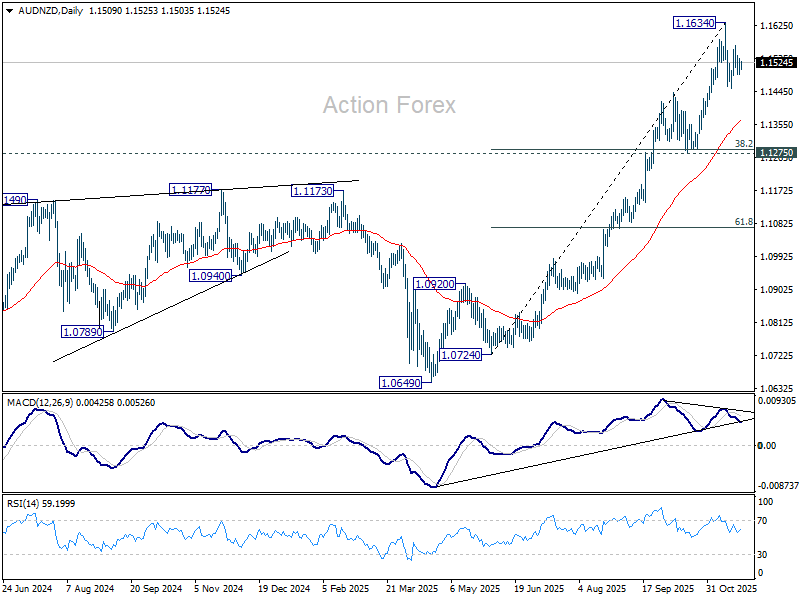
However, on the downside, break of 1.1452 support will indicate that deeper decline is underway, as fall from 1.1634 could be correcting whole rise from 1.0724. But even so, downside should be contained by 1.1275 cluster support (38.2% retracement of 1.0724 to 1.1634 at 1.1286) or even higher at 55 D EMA (now at 1.1362).
There should be one more up leg through 1.1634 before the whole five-wave up trend from 1.0649 (April low) completes.
AUD/USD Daily Report
Daily Pivots: (S1) 0.6447; (P) 0.6458; (R1) 0.6474; More...
Intraday bias in AUD/USD stays neutral for the moment. Further fall is expected as long as 0.6501 resistance holds. Decisive break of 0.6413 cluster (38.2% retracement of 0.5913 to 0.6706 at 0.6403) should confirm near term bearish reversal. Next target is 100% projection of 0.6706 to 0.6439 from 0.6579 at 0.6312. However, firm break of 0.6501 will turn bias back to the upside for stronger rebound.
In the bigger picture, there is no clear sign that down trend from 0.8006 (2021 high) has completed. Rebound from 0.5913 is seen as a corrective move. Outlook will remain bearish as long as 38.2% retracement of 0.8006 to 0.5913 at 0.6713 holds. Break of 0.6413 support will suggest rejection by 0.6713 and solidify this bearish case. Nevertheless, considering bullish convergence condition in W MACD, sustained break of 0.6713 will be a strong sign of bullish trend reversal, and pave the way to 0.6941 structural resistance for confirmation.
EURJPY Eyes Double Correction While Bulls Stay in Control
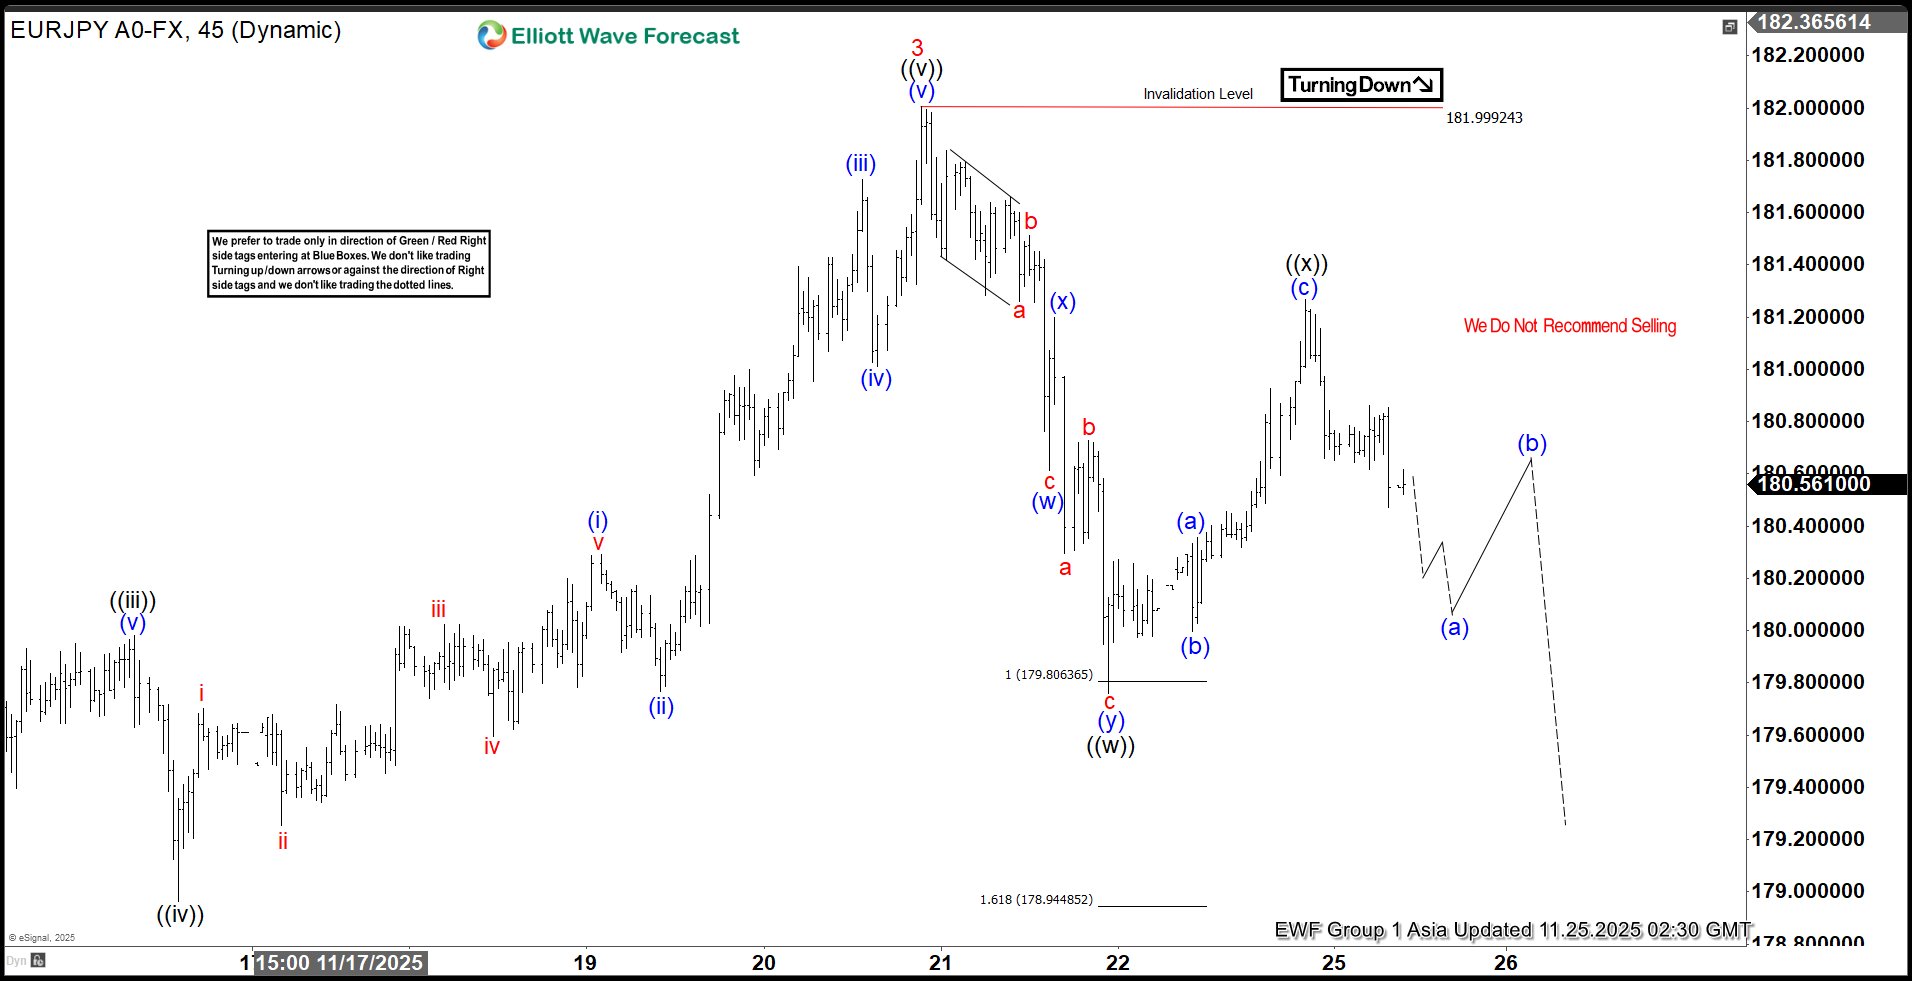
The short-term Elliott Wave outlook for EURJPY indicates that the cycle from the 17 October 2025 low remains in progress as a structured five-wave impulse. From that low, wave 1 advanced and concluded at 178.82f. A corrective pullback in wave 2 then followed, which ended at 175.69. The pair then resumed its upward trajectory, with wave 3 reaching 182, as reflected in the 45‑minute chart. At present, wave 4 is unfolding, serving to correct the cycle from the 5 November low, and its internal subdivision is developing in the form of a double three pattern.
Down from wave 3, wave (w) ended at 180.61 and rally in wave (x) ended at 181.2. Pair resumed lower in wave (y) towards 179.76 which completed wave ((w)) in higher degree. Rally in wave ((x)) ended at 181.26 with internal subdivision as a zigzag. Pair has turned lower in wave ((y)) but still need to break below wave ((w)) at 179.76 to confirm this view. Near term, as far as pivot at 182 high stays intact, expect pair to extend lower. Potential target lower is 100% – 161.8% Fibonacci extension of wave ((w)) towards 177.6 – 179.02.
EURJPY 45-Minute Elliott Wave Chart From 11.25.2025
EURJPY Elliott Wave Video
https://www.youtube.com/watch?v=AFaNxtlkZ5A
Two-way risks for AUD/NZD as RBNZ cut meets rising Australia CPI
AUD/NZD is shaping up for an active week, with two major catalysts—RBNZ’s rate announcement and Australia’s monthly CPI—set to hit on Wednesday.
RBNZ is widely expected to cut the OCR by 25bps to 2.25%. The NZIER Monetary Policy Shadow Board also endorsed a quarter-point reduction, arguing that although the economy is beginning to recover from a low base, excess capacity remains and a small additional cut is justified. Some members, however, warned against pushing stimulus too far, citing the risk of reigniting inflation—highlighting a cautious undercurrent within the broader policy debate.
On the medium-term path, the Shadow Board’s views clustered around an OCR of 2.25%–2.50% in a year, implying broad consensus that only limited easing will be required beyond November. While a minority still consider the risk of a larger, front-loaded cut—particularly given the long three-month gap until the next meeting—the Board’s recommendations may help stabilize expectations at a standard 25bps move.
In Australia, CPI is expected to rise again, from 3.5% to 3.6% for October, the fourth consecutive acceleration from June’s trough of 1.9%. A trend like this keeps the RBA firmly on hold for the remainder of the year, with any upside surprise diminishing the likelihood of a February rate cut. Sticky inflation would strengthen AUD by reinforcing Australia’s higher-for-longer stance relative to New Zealand’s easing cycle.
Technically, AUD/NZD carved out a short-term top at 1.1634 earlier this month and has since turned sideway. For now, it's seen as in a brief near term correction. Break of 1.1570 minor resistance will solidify this case and bring retest of 11634 high.
However, on the downside, break of 1.1452 support will indicate that deeper decline is underway, as fall from 1.1634 could be correcting whole rise from 1.0724. But even so, downside should be contained by 1.1275 cluster support (38.2% retracement of 1.0724 to 1.1634 at 1.1286) or even higher at 55 D EMA (now at 1.1362).
There should be one more up leg through 1.1634 before the whole five-wave up trend from 1.0649 (April low) completes.