Sample Category Title
US Dollar Index Hovers Near Key Resistance
As the chart of the US Dollar Index (DXY) shows, today the value is sitting near an important resistance level around 100.20 points. We highlighted this level earlier — including in our analytical post from 10 November.
Fluctuations in the USD against other currencies are forming a configuration of two channels:
→ A blue bullish trajectory that began back in September. However, this resistance level appears to be a significant obstacle. Last week, the bulls attempted to push the DXY to a six-month high, but they failed to hold those gains.
→ A red alternative bearish trajectory, which may become more pronounced and relevant if the bears seize the initiative once it becomes clear that the bulls are running out of steam.
At the start of the week, the index is also moving within a narrowing triangle — the breakout direction may indicate the key trend into the year-end.
The balance between the two scenarios will largely depend on the fundamental backdrop, with traders mainly focusing on:
→ News related to the prospects of a Federal Reserve rate cut. Barclays analysts expect the Fed to cut rates in December.
→ A possible intervention by the Bank of Japan to support the weakened yen, which has come under pressure due to low domestic interest rates. Japan’s Finance Minister, Satsuki Katayama, reinforced this rhetoric last week.
→ The release of data — including US retail sales and producer prices — which were postponed due to the record-long government shutdown.
Trade global index CFDs with zero commission and tight spreads. Open your FXOpen account now or learn more about trading index CFDs with FXOpen.
This article represents the opinion of the Companies operating under the FXOpen brand only. It is not to be construed as an offer, solicitation, or recommendation with respect to products and services provided by the Companies operating under the FXOpen brand, nor is it to be considered financial advice.
GBP/USD Attempts Recovery, USD/CAD Maintains Bullish Strength
GBP/USD is attempting a recovery wave from 1.3035. USD/CAD is showing positive signs and might aim for more gains above 1.4130.
Important Takeaways for GBP/USD and USD/CAD Analysis Today
- The British Pound started a recovery wave above 1.3050 and 1.3080.
- There is a key bearish trend line forming with resistance near 1.3110 on the hourly chart of GBP/USD at FXOpen.
- USD/CAD rallied above 1.4000 and 1.4050 before the bears appeared.
- There is a connecting bullish trend line forming with support at 1.4085 on the hourly chart at FXOpen.
GBP/USD Technical Analysis
On the hourly chart of GBP/USD at FXOpen, the pair started a fresh decline from 1.3220 after a decent increase. The British pound fell below 1.3150, re-entering a short-term bearish zone against the US dollar.
The pair even traded below 1.3050 and the 50-hour simple moving average. Finally, the bulls appeared near 1.3035. A low was formed near 1.3037 and the pair is now attempting a short-term recovery wave.
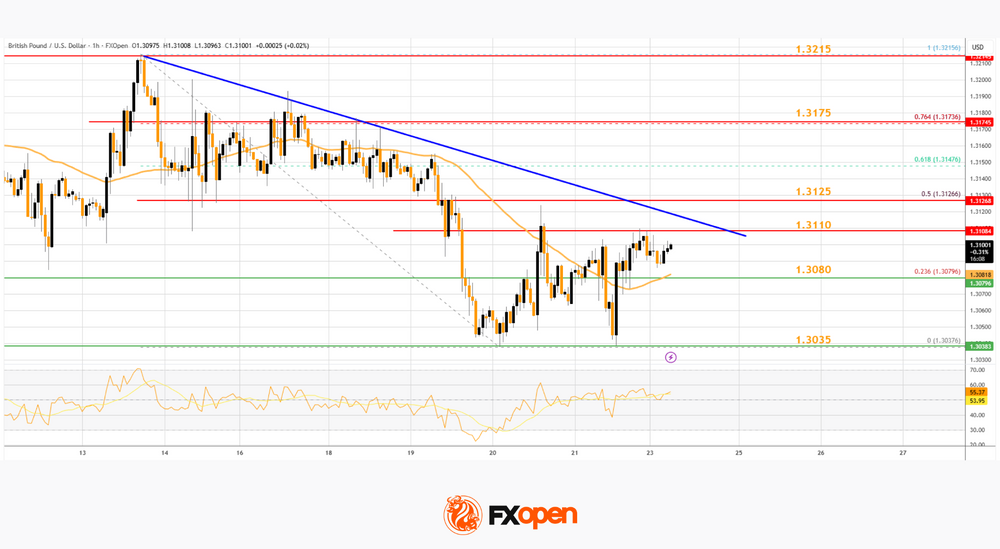
There was a fresh upside above 1.3050 and the 23.6% Fib retracement level of the downward move from the 1.3215 swing high to the 1.3037 low. The pair is now showing positive signs above 1.3080. Immediate resistance is near a bearish trend line at 1.3110.
The first major hurdle for the bulls on the GBP/USD chart is 1.3125 and the 50% Fib retracement. A close above 1.3125 might spark a decent increase. The next stop for the bulls might be 1.3175. Any more gains could lead the pair toward 1.3215 in the near term.
Initial support sits near the 50-hour simple moving average at 1.3080. The next key area of interest might be 1.3035, below which there is a risk of another sharp decline. In the stated case, the pair could drop toward 1.2965.
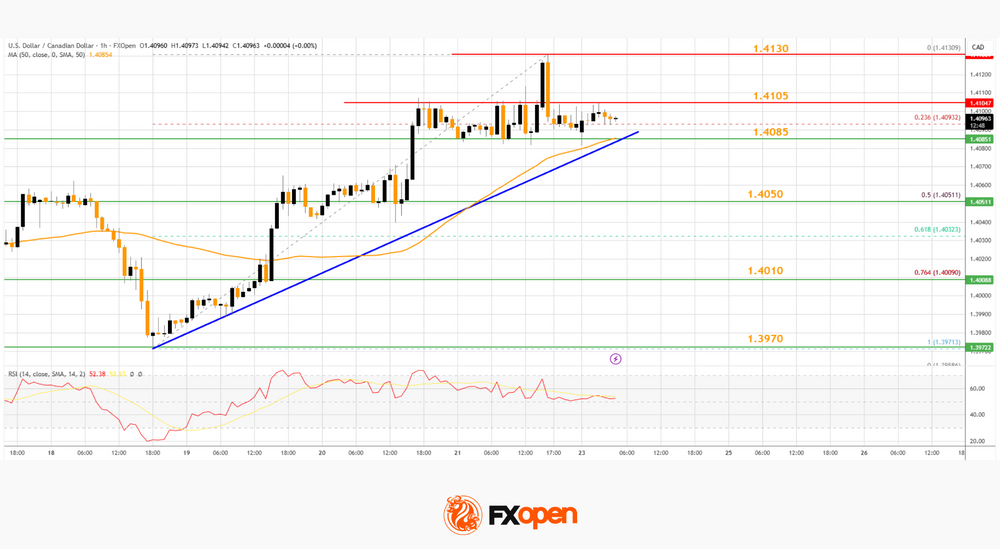
USD/CAD Technical Analysis
On the hourly chart of USD/CAD at FXOpen, the pair formed a strong support base above the 1.3970 level. The US Dollar started a fresh increase above 1.4000 against the Canadian Dollar.
The pair cleared the 50-hour simple moving average and climbed above 1.4050. Finally, it tested the 1.4130 zone before the bears appeared. The pair traded below the 23.6% Fib retracement level of the upward move from the 1.3971 swing low to the 1.4130 high.
Initial support is near a connecting bullish trend line at 1.4085 and the 50-hour simple moving average. A downside break below the trend line might send the pair toward 1.4050.
The next major area on the USD/CAD chart could be the 76.4% Fib retracement at 1.4010. A close below 1.4010 could push the pair further lower. In the stated case, the bears might aim for a test of 1.3970.
On the upside, initial resistance sits near 1.4105. The main breakout zone could be 1.4130. A clear upside break above 1.4130 could start another steady increase. The next major stop for the bulls might be 1.4200. Any more gains could open the doors for a test of 1.4250.
Trade over 50 forex markets 24 hours a day with FXOpen. Take advantage of low commissions, deep liquidity, and spreads from 0.0 pips. Open your FXOpen account now or learn more about trading forex with FXOpen.
This article represents the opinion of the Companies operating under the FXOpen brand only. It is not to be construed as an offer, solicitation, or recommendation with respect to products and services provided by the Companies operating under the FXOpen brand, nor is it to be considered financial advice.
Dollar’s Attempt to Take Out First Resistance Failed
Markets
Dip buyers emerged on stock markets as key indices tested crucial support levels (combination of October lows & 100d moving average; both for the likes of EuroStoxx50 and S&P 500/Nasdaq). We must add that breathing space above those crucial levels remains extremely thin for the moment. One spark could suffice in flipping the balance again. Apart from technical consideration, Ukrainian peace talks (probably unacceptable at current terms, but starting point for negotiations), November US PMI’s (composite 55 from 54.8 vs 54.6 expected) and NY Fed Williams comments offered some comfort. Flash PMI’s signaled faster economic growth, but price pressures also intensified. Input costs rose at one of the fastest rates seen over the past three years, driving a re-acceleration of selling price inflation. Higher costs and prices were again commonly attributed to tariffs. The pace of job creation meanwhile remained only modest, principally due to cost concerns. The upturn was driven by the largest increase in new orders received by businesses since last December (and the second greatest gain since April 2022), indicating a second successive monthly improvement in demand growth. October and November survey data are consistent with the economy expanding at a 2.5% annualized rate in Q4, pointing to robust and resilient economic growth as we head into the year end. NY Fed Williams sees room for a rate cut in the near term, boosting December rate cut bets (our preferred scenario) again to 65%. The US yield curve showed a modest bull steepening with yields 2.5 bps to 1 bp lower on the day. The (trade-weighted) dollar’s attempt to take out first resistance failed, but the greenback keeps pushing against the 100.25-area this morning. EUR/USD currently changes hands at 1.1520 but is at risk of reverting back to the 1.1392 August bottom.
Risk sentiment on Asian stock markets is generally constructive this morning with Japanese markets closed for Labor Thanksgiving Day. Today’s eco calendar is thin with only German Ifo Business sentiment. Key themes in this holiday-shortened US week (Thanksgiving on Thursday) are the US-brokered peace talks in Ukraine (Thursday as a first deadline; gas prices drop to lowest level since May 2024 this morning), general risk sentiment, tomorrow’s eco data (retail sales & consumer confidence) and UK Chancellor Reeves’ budget on Wednesday. We also eye the faith of Belgian OLO’s vs French OAT’s this morning. Belgian PM De Wever announced a multi-year federal budget this morning, details of which are still unravelling. French lawmakers on the other hand have rejected a first draft of the 2026 budget.
News & Views
Rating Agency Moody’s on Friday upgraded Italy’s credit rating from Baa3 to Baa2 (stable outlook). The upgrade reflects a consistent track-record of political and policy stability which enhances the effectiveness of economic and fiscal reforms and investment implemented under the National Recovery and Resilience plan. The rating upgrade also points to the prospect of further policy actions supporting growth and fiscal consolidation beyond the plan’s deadline in August next year. With respect to the fiscal outlook, Moody’s indicates that tax collation has been improving, as tax revenue outpaced nominal GDP growth since 2021. In an environment of political and policy stability, the rating agency expect the government to be able to continue fiscal consolidation through revenue and expenditure measures. Rising primary surpluses are expected to support a gradual decline in the government debt ratio from 2027. Debt is expected to decline to just above 130% of GDP by 2034 from an estimated 136.5% for 2025. Even so, the agency still sees debt to remain high and debt affordability will gradually weaken as higher interest rates translate in higher refinancing costs.
According to the people familiar with the matter, the Reserve Bank of India (RBI) this morning intervened in the currency market. The action of the RBI came after a sharp decline of the Indian currency on Friday, pushing it to a new record low against the dollar near USD/INR 89.5. According to sources, the RBI sold dollars overseas and on the local market. The country’s trade deficit recently rose as exports to the US dropped sharply after the US imposed tariffs of 50% on the countries imports to the US. A further weakening of the rupee contains the risk of further capital outflows and over time raises inflationary risks via higher import prices.
Fifty Shades of Taxes
The week opens on a cautious note after last week’s Nvidia earnings didn’t really go according to plan. Swelling inventories and deferred payments raised concerns about the strength of Nvidia’s revenue and added to worries that AI spenders may simply be spending too much — in some cases by expanding debt that doesn’t even appear on their own books. So, the AI boom is turning into an accounting stress story due to some companies’ choice to do strange things on their books. And that could end in tears. The interconnected nature of the business and the circularity suggest that if one company fails to pay a bill, we could see a domino effect across the sector.
The nerves are calmer this morning, but not fully so. Alibaba in China jumped 5% after announcing that its Qwen 3 model attracted more than 10 million followers and could rival ChatGPT. The company will report earnings tomorrow. The Kospi made a recovery attempt at the weekly open, but most gains were given back as we approached the European open. Japanese markets are closed, so we can’t look at SoftBank to gauge how investors feel about the whole AI situation. At this point, it’s safe to say that AI will outlive any potential market meltdown. But the short term looks a bit fragile for our favourite tech bros.
The S&P 500 and Nasdaq futures are slightly in the green following a modest improvement in investor mood on Friday after NY Fed President John Williams jumped in and poured some cold water on the overheated market by bringing the possibility of another near-term cut back to the table. Everyone heard that as a December rate cut, of course. The US 2-year yield fell back to 3.50% and the probability of a December cut jumped to 70% — from below 29% earlier in the same week. Holy!
Other Fed members kept repeating that it would be better to wait before doing anything more, just in case the inflation monster wakes up and throws fireballs everywhere. But no — one man, one dove — outweighed all the other members who sounded worried about inflation, which is still near 3% in the US and well above the Federal Reserve’s (Fed) official target. In theory, the Fed should never have cut in September in the first place. Fun fact: we won’t even get the most critical inflation report before the Fed meets for the last time this year. So, they will just have to sit there and bet. They won’t decide — they will take a bet.
Meanwhile, consumer sentiment fell to the lowest levels on record in the US, even after Trump announced that he will lower tariffs on beef, tomatoes, coffee and bananas. The US dollar spent most of last week gaining ground against majors. The recovery was backed by a retreat in dovish Fed expectations before Williams’ dovish comments on Friday. The greenback is under pressure this morning, but the Fed cut probabilities have themselves become shaky, so I’d say the chance of a December cut is still a coin toss. And again, in theory, a no-cut would be the reasonable path — especially given that the Fed will stop QT in December.
But sterling bears won’t need help from dollar bulls to push Cable below 1.30 this week. Rachel Reeves could do that with grace on Wednesday when she announces the much-anticipated Autumn Budget — and potentially big tax hikes. At this point, no one knows what will come out of that Budget, but she might have to raise taxes by as much as £30bn. Disaster. We’ve been reading all week about the Fifty Shades of Taxes the Brits are facing — both at individual and company level. If I’m honest, I’m waiting for Season Two of the Mini-Budget crisis to unfold later this week if taxes don’t match market expectations.
On a more optimistic note, such large tax hikes would be deflationary and could convince the Bank of England (BoE) to cut rates as soon as December to clean up part of the mess. And if — by miracle — Rachel Reeves gets this right, Cable could rebound and close the year above 1.30. But there is a good chance that we will see agitated waters for sterling and gilts this week than the contrary. The UK needs a solid plan to survive the series of poor fiscal decisions and return to growth. Higher taxes are good for the short run, but they kill growth in the long run.
According to a Financial Times analysis, 3,790 company directors reported leaving the UK between October 2024 (when Reeves’ Budget hit) and July 2025, and a survey by Rathbones found that around 12% of SME owners said they are considering relocating either themselves or their business abroad because of tax concerns. Favourite destinations include the UAE, Spain and the US — of course. And given the market’s unwillingness to finance British debt, the larger the outflow of taxpayers, the bigger the budget hole, and the heavier the tax burden for those who stay. So, prepare a tissue box for Wednesday. There will be tears — and not happy ones.
Tensions Mount as the US Seeks to End War in Ukraine
In focus this week
Today in Germany, we receive the Ifo indicator for November. The PMI released on Friday surprised on the downside, although this mainly seems like an "adjustment" from very high numbers in the past months. Even after the decline the composite PMI is still at the highest level in one and a half years when excluding the October reading.
On Wednesday, we will keep an eye on the UK as Chancellor Reeves presents the Autumn budget. Gilts and GBP will be sensitive to how an inevitable fiscal tightening looks and whether the fiscal gap is plugged sufficiently. Markets soured on the UK when Reeves recently scrapped plans to hike the income tax rate.
On Thursday, we look for euro area credit growth data and Danish retail sales for October. Regarding retail sales, our Spending Monitor showed a 0.6% m/m decline in real retail spending in October, and we expect spending growth to remain muted.
Rounding off the week, we receive the flash estimates of inflation in Germany, France, Italy, and Spain which together will reveal almost entirely how inflation in the euro area fared ahead of the aggregate data next week.
Economic and market news
What happened overnight
In the Ukraine war, US Secretary of State Marco Rubio stated that peace talks in Geneva "showed meaningful progress" but declined to share details. On Sunday, US President Donald Trump urged Ukraine to accept the 28-point plan, blaming Ukraine and Europe for the lack of a truce.
What happened over the weekend
In the euro area, November PMIs were close to expectations with the composite PMI falling marginally to 52.4 from 52.5 in October (cons: 52.5). The manufacturing PMI declined to 49.7 from 50.0 (cons: 50.1) and the services PMI climbed to 53.1 from 53.0 (cons: 52.8). The price indices showed an uptick in input prices and marginal decline in output prices. Inflation remains under control and risk has shifted from inflation being too high to instead being too low. With growth still holding up, we expect the ECB to be on hold at 2.0% in the coming year despite inflation forecasted to fall below the 2% target.
The ECB's indicator of negotiated wages declined by more than expected to 1.9% y/y in Q3 (cons: 2.5 y/y) compared to 4.0% y/y in Q2 and 2.5% y/y in Q1. A faster-than-expected decline in wages is a downside risk to our outlook of unchanged ECB policy rates, as it would lower services inflation which is the main category holding overall inflation up.
In the US, New York Fed President John Williams said that he still saw "room for further adjustment", backing a cut at the next meeting in December. Markets are now pricing about a 60% likelihood of a rate cut in December. Meanwhile, Fed vice chair Philip Jefferson and Boston Fed President Susan Collins did not really comment on the near-term rate outlook and Dallas Fed President Logan reiterated her earlier view that she would find it difficult to cut rates in December.
November flash PMIs landed close to expectations. The manufacturing PMI declined to 51.9 from 52.5 in October and appeared weaker than the headline index suggests. The order-inventory balance turned sharply lower to 46.1 from 49.5 and all else equal, weaker order-inventory predicts weaker output growth as well. Services PMI on the other hand increased to 55.0 from 54.8 in October, with both new orders and price indices turning higher. Overall, the flash print was a mixed bag for the Fed, with some concerning signals surrounding the manufacturing growth momentum.
Equities: Equities stabilized on Friday after several unsuccessful attempts earlier in the week. The S&P 500 finally closed 1% higher, Russell 2000 gained a full 3%, while European Stoxx 600 edged 0.3% lower. Importantly, this was not a rebound led by last week's most-sold names. Instead, markets saw a selective rotation, with investors refraining from buying the dip in the most heavily sold AI names (or in Bitcoin for that matter, down -2% on Friday despite -20% over the last month). Rather, it was small caps and sectors such as materials, healthcare, and consumer discretionary that fared the best. Similarly, we are not seeing the rebound spread to the AI hardware region - Asia - this morning, although European and US futures are higher.
A selective rebound makes sense to us, as last week's selloff was unusual - not in magnitude, but in the fact that the drawdown in equities was not synchronized with other asset classes. While the S&P 500 is 4% off its highs, yields, copper prices, gold, and credit spreads are little changed. We interpret this as a sign that the November selloff is neither macro-driven nor liquidity related. As such, the fundamental read-across to equities outside the AI theme - such as European markets - should be limited.
Is this a buying opportunity then? In a sense, yes. We remain positive on equities on a 3-6 months horizon with a slight equity overweight stance. However, the fact that the equity selloff has not been mirrored in other asset classes also means that positioning support remain absent. Investors have not panicked into bonds - quite the opposite, according to November's fund manager survey, which showed extremely low cash levels. Our correction monitor, which tracks indicators such as the VIX, CTA hedge fund beta, or bull-bear spreads, is far from oversold conditions. As such, we are refraining from increasing the equity overweight further for now.
FI and FX: Dovish comments from Fed's dove Williams sent US rates lower - UST10y from 4.15% to 4.05% - and raised the probability of a December cut to 16bp from a 7bp low after the FOMC Minutes. It supported risk sentiment and lifted equities to a decent c. +1% close after a rough week. Equity futures are in green this morning, while Japan is closed for holiday. The USD's outperformance pulled EUR/USD toward 1.1500. EUR/SEK and EUR/NOK trade around 11.00 and 11.80, respectively.
EUR/USD Daily Outlook
Daily Pivots: (S1) 1.1485; (P) 1.1519; (R1) 1.1547; More…
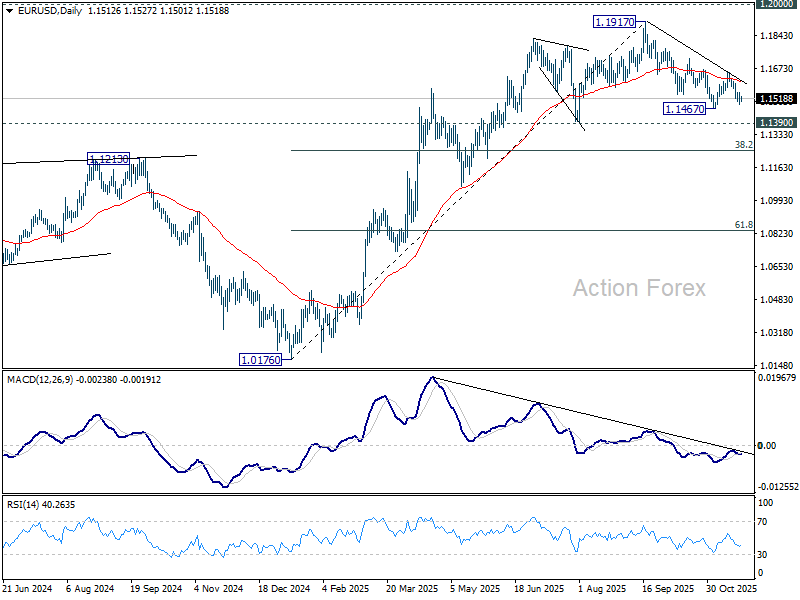
Intraday bias in EUR/USD remains mildly on the downside for 1.1467. Firm break there will resume the whole decline from 1.1917 high. Next targets are 1.1390, and then 38.2% retracement of 1.0176 to 1.1917 at 1.1252. On the upside, above 1.1551 minor resistance will turn intraday bias neutral. But risk will stay on the downside as long as 1.1655 resistance holds, in case of recovery.
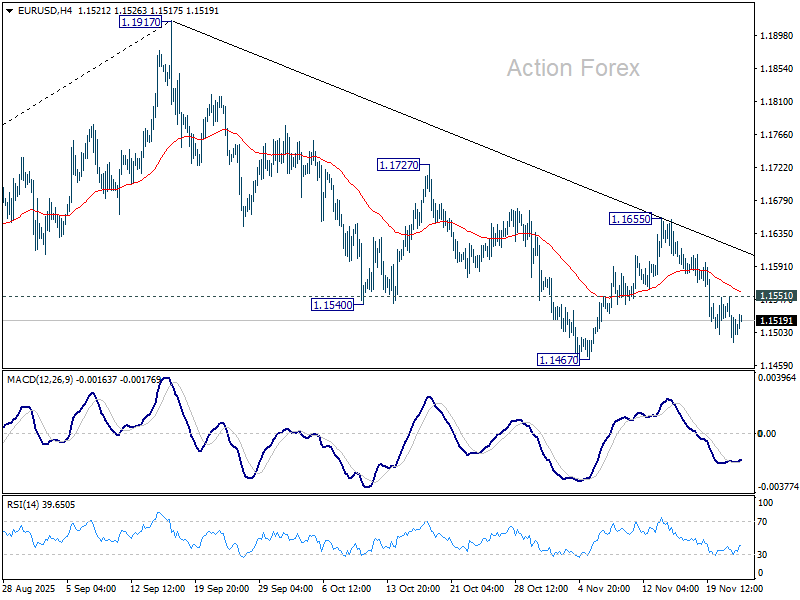
In the bigger picture, considering bearish divergence condition in D MACD, a medium term top is likely in place at 1.1917, just ahead of 1.2 key psychological level. As long as 55 W EMA (now at 1.1328) holds, the up trend from 0.9534 (2022 low) is still in favor to continue. Decisive break of 1.2000 will carry larger bullish implications. However, sustained trading below 55 W EMA will argue that rise from 0.9534 has completed as a three wave corrective bounce, and keep long term outlook bearish.
USD/JPY Daily Outlook
Daily Pivots: (S1) 155.90; (P) 156.72; (R1) 157.24; More...
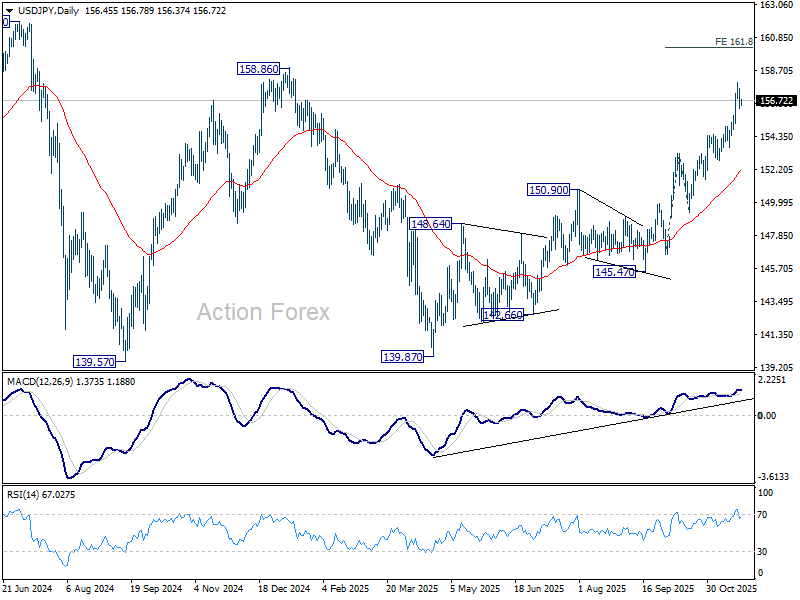
USD/JPY is staying in consolidations below 157.88 and intraday bias remains neutral. Downside of retreat should be contained by 154.47 resistance turned support to bring rebound. On the upside, break of 157.88 will target 161.8% projection of 146.58 to 153.26 from 149.37 at 160.17.
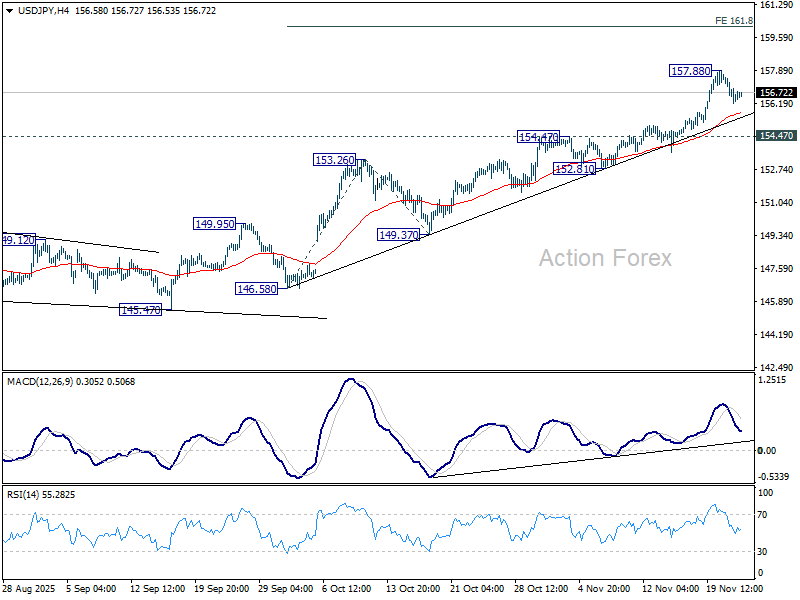
In the bigger picture, current development suggests that corrective pattern from 161.94 (2024 high) has completed with three waves at 139.87. Larger up trend from 102.58 (2021 low) could be ready to resume through 161.94 high. Decisive break of 158.85 structural resistance will solidify this bullish case and target 161.94 for confirmation. On the downside, break of 150.90 resistance turned support will dampen this bullish view and extend the corrective range pattern with another falling leg.
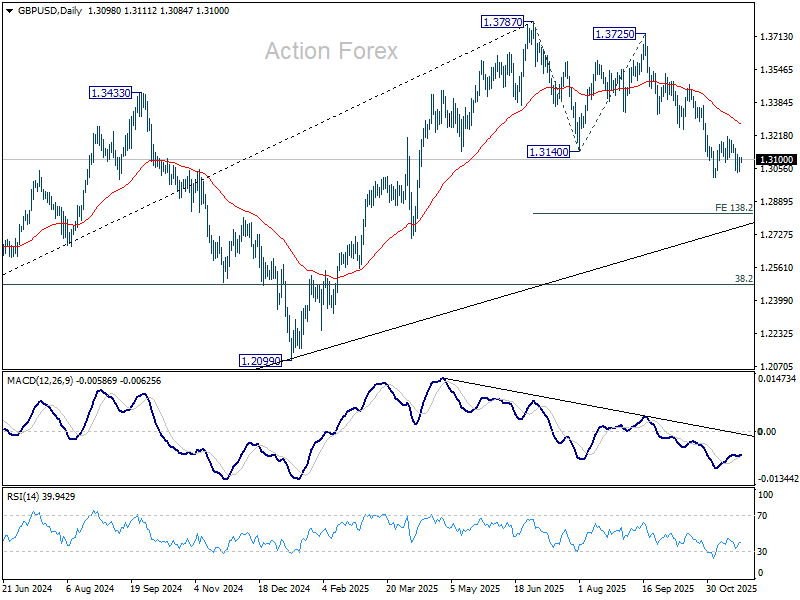
GBP/USD Daily Outlook
Daily Pivots: (S1) 1.3055; (P) 1.3083; (R1) 1.3126; More...
GBP/USD is still extending sideway trading above 1.3008 and intraday bias remains neutral. With 1.3247 support turned resistance intact, further decline is expected. Break of 1.3008 will resume the fall from 1.3725 to 138.2% projection of 1.3787 to 1.3140 from 1.3725 at 1.2831. Nevertheless, firm break of 1.3247 will suggest that fall from 1.3787 has completed as a corrective move already.
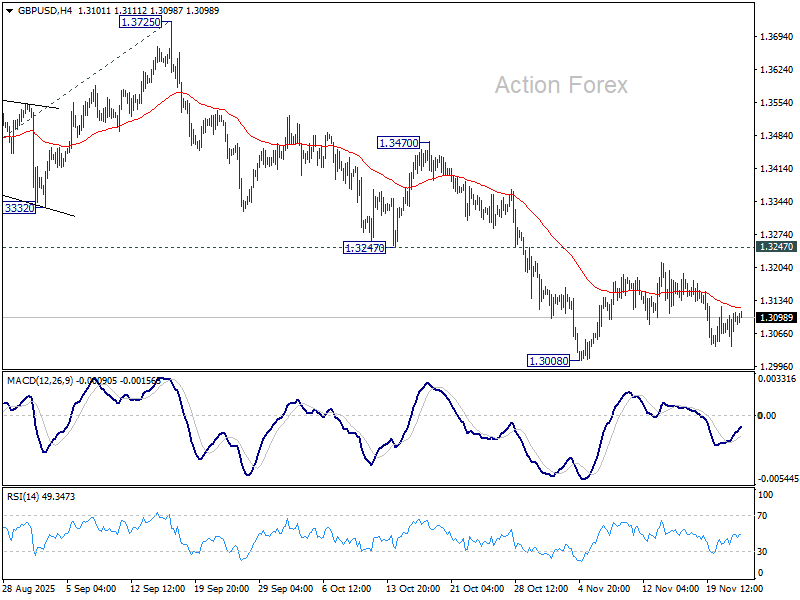
In the bigger picture, the break of 55 W EMA (now at 1.3184) is taken as the first sign that corrective rise from 1.0351 (2022 low) has completed. Decisive break of trend line support (now at 1.2760) will solidify this case and target 38.2% retracement of 1.0351 to 1.3787 at 1.2474 next. Meanwhile, in case of another rise, strong resistance should emerge below 1.4248 (2021 high) to cap upside to preserve the long term down trend.
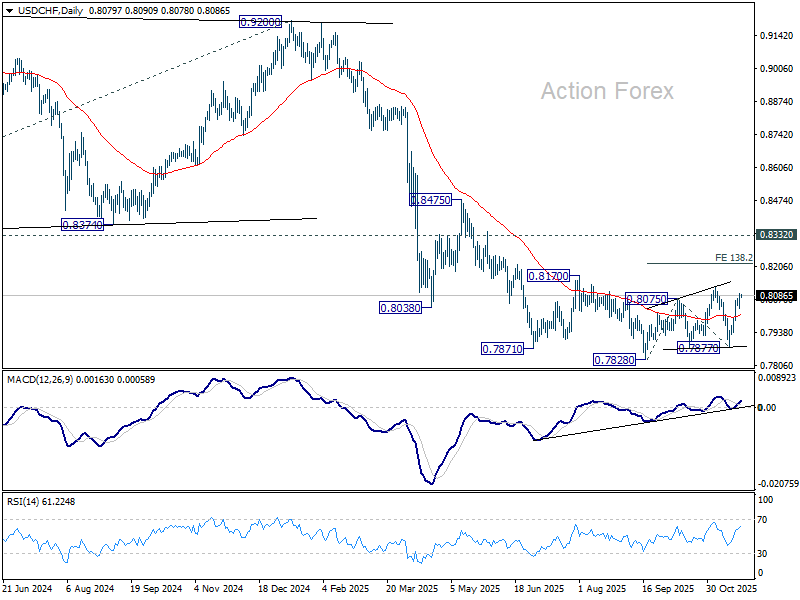
USD/CHF Daily Outlook
Daily Pivots: (S1) 0.8047; (P) 0.8073; (R1) 0.8110; More…
Intraday bias in USD/CHF stays mildly on the upside at this point. Corrective pattern from 0.7828 low is still extending. Break of 0.8123 will target 138.2% projection of 0.7828 to 0.8075 from 0.7877 at 0.8218. On the downside, below 0.8034 minor support will turn intraday bias neutral first.
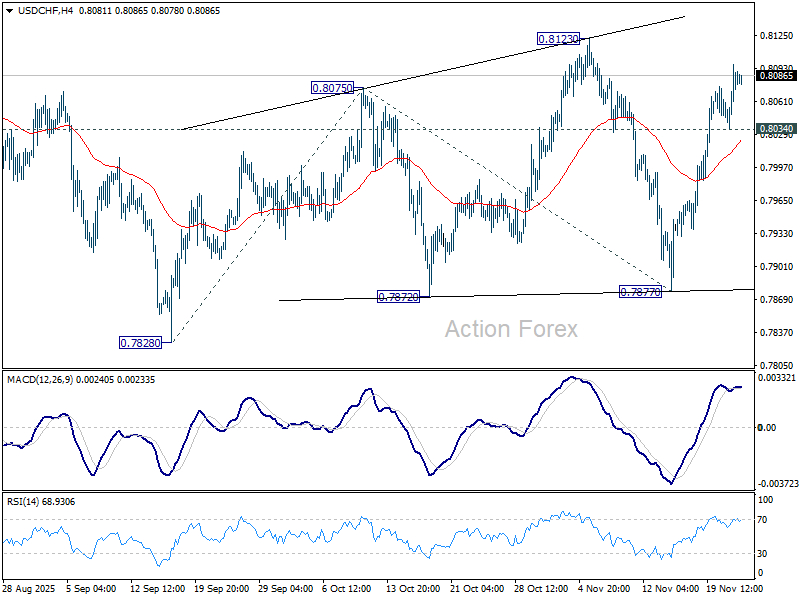
In the bigger picture, long term down trend from 1.0342 (2017 high) is still in progress. Next target is 100% projection of 1.0146 (2022 high) to 0.8332 from 0.9200 at 0.7382. In any case, outlook will stay bearish as long as 0.8332 support turned resistance holds (2023 low).
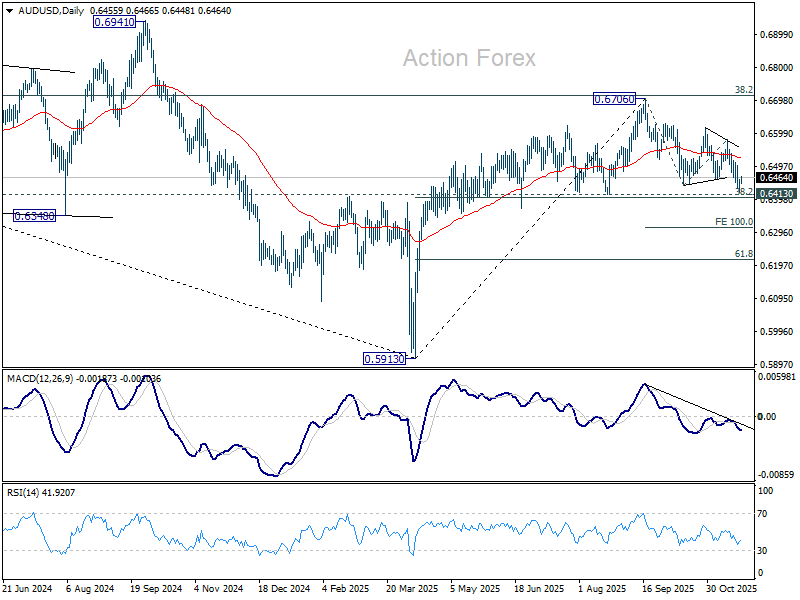
AUD/USD Daily Report
Daily Pivots: (S1) 0.6431; (P) 0.6446; (R1) 0.6471; More...
Intraday bias in AUD?USD is turned neutral first with current recovery. Further fall is expected as long as 0.6501 resistance holds. Decisive break of 0.6413 cluster (38.2% retracement of 0.5913 to 0.6706 at 0.6403) should confirm near term bearish reversal. Next target is 100% projection of 0.6706 to 0.6439 from 0.6579 at 0.6312. However, firm break of 0.6501 will turn bias back to the upside for stronger rebound.
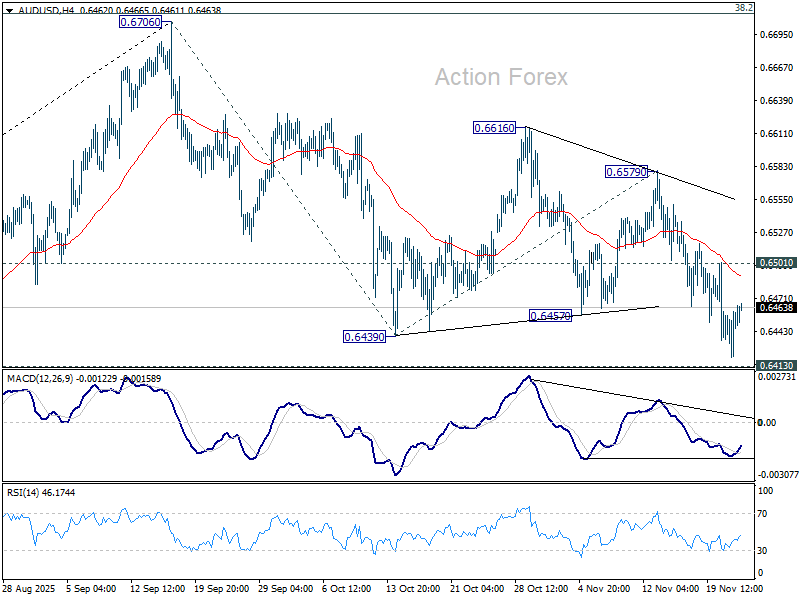
In the bigger picture, there is no clear sign that down trend from 0.8006 (2021 high) has completed. Rebound from 0.5913 is seen as a corrective move. Outlook will remain bearish as long as 38.2% retracement of 0.8006 to 0.5913 at 0.6713 holds. Break of 0.6413 support will suggest rejection by 0.6713 and solidify this bearish case. Nevertheless, considering bullish convergence condition in W MACD, sustained break of 0.6713 will be a strong sign of bullish trend reversal, and pave the way to 0.6941 structural resistance for confirmation.