Sample Category Title
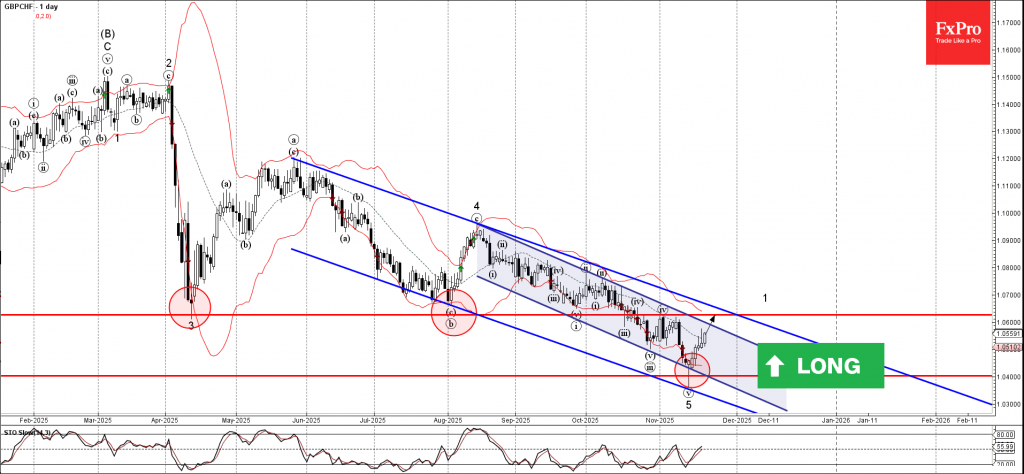
GBPCHF Wave Analysis
GBPCHF: ⬆️ Buy
- GBPCHF reversed from support level 1.0400
- Likely to rise to resistance level 1.0630
GBPCHF currency pair recently reversed from key support level 1.0400 intersecting with the two down channels from August and May and the lower daily Bollinger Band.
The upward reversal from the support level 1.0400 created the daily Japanese candlesticks reversal pattern Hammer Doji.
Given the strongly bearish Swiss franc sentiment seen across the FX markets today, GBPCHF currency pair can be expected to rise to the next resistance level 1.0630 (former strong support from April and August).
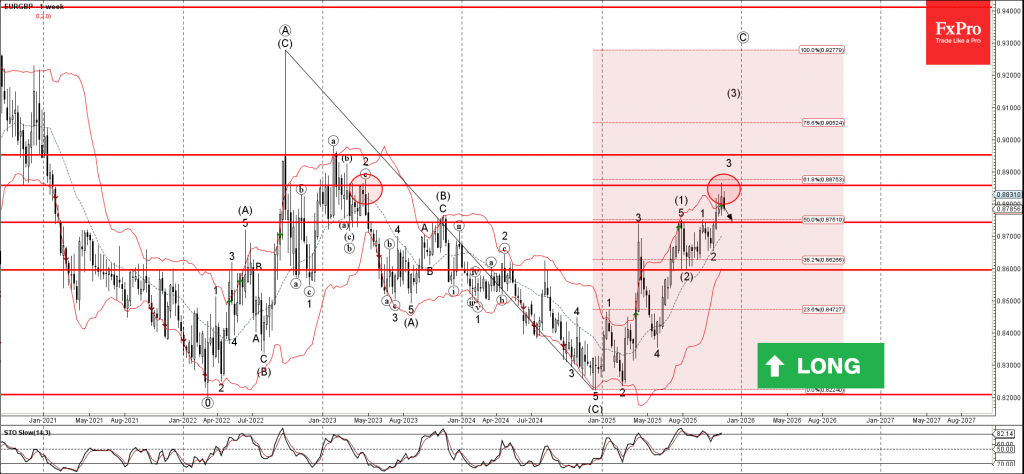
EURGBP Wave Analysis
EURGBP: ⬇️ Sell
- EURGBP reversed from resistance level 0.8860
- Likely to fall to support level 0.8740
EURGBP currency pair recently reversed from resistance area between the resistance level 0.8860 (former weekly pivot from the start of 2023) and the upper weekly Bollinger Band.
The downward reversal from the resistance level 0.8860 stopped the previous weekly impulse wave 3.
Given the strength of the resistance level 0.8860 and the overbought weekly Stochastic, EURGBP currency pair can be expected to fall to the next support level 0.8740 (former top of weekly waves (1), 1 and 3).
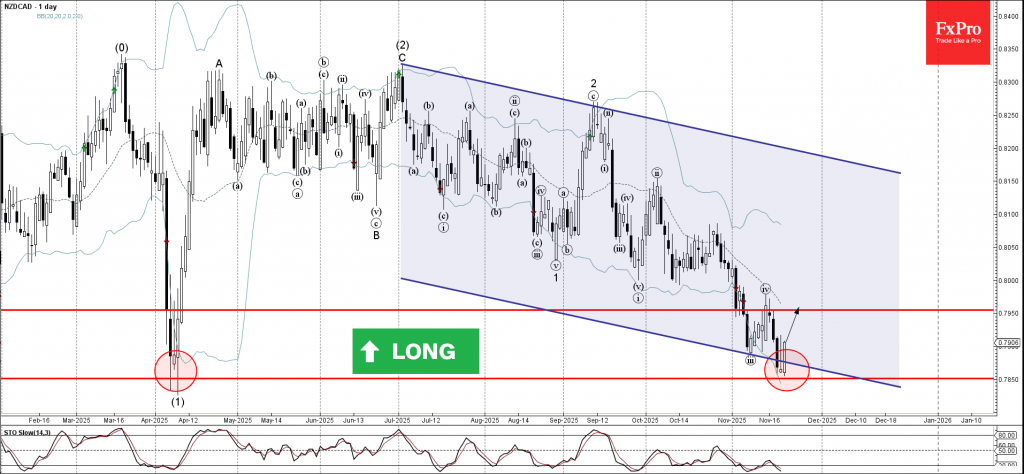
NZDCAD Wave Analysis
NZDCAD: ⬆️ Buy
- NZDCAD reversed from support area
- Likely to rise to resistance level 0.7950
NZDCAD currency pair recently reversed from support area between the powerful long-term support level 0.7850 (which reversed the price sharply in April), lower daily Bollinger Band and the support trendline of the daily down channel from July.
The upward reversal from this support area is currently forming the daily Japanese candlesticks reversal pattern Morning Star – strong buy signal form this currency pair.
Given the oversold daily Stochastic, NZDCAD currency pair can be expected to rise to the next resistance level 0.7950.
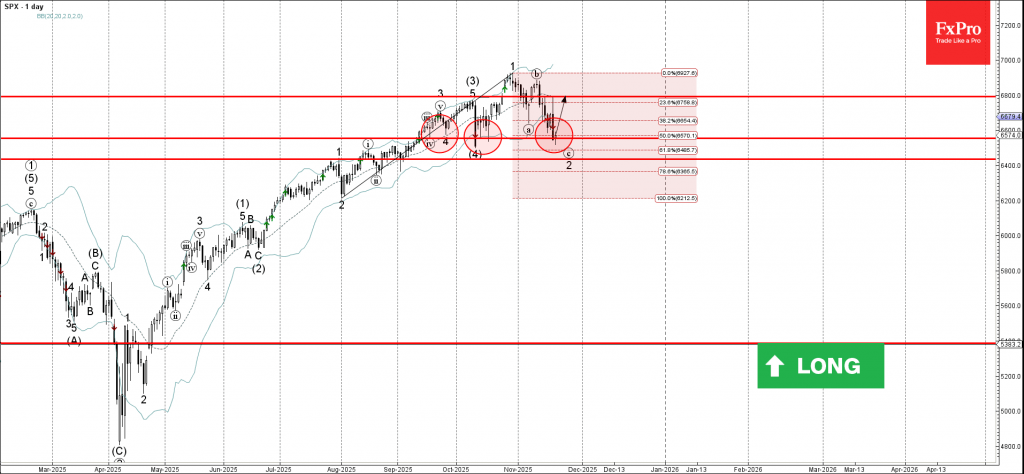
S&P 500 Wave Analysis
S&P 500: ⬆️ Buy
- S&P 500 index reversed from strong support level 6555.00
- Likely to rise to resistance level 6800.00
S&P 500 index recently reversed from support area between the strong support level 6555.00, lower daily Bollinger Band and the 50% Fibonacci correction of the upward impulse from August.
The upward reversal from the support level 6555.00 stopped the previous minor ABC correction 2 from the end of October.
Given the clear daily uptrend, S&P 500 index can be expected to rise to the next resistance level 6800.00 (former top of wave (3) from October).
Fed Messaging Chaos Nudges Dollar Higher, Not Higher Enough
Global markets closed last week on an uncertain footing. While bears appeared to have an upper hand, the control was never firmly gripped. Conviction was relatively thin as traders were reluctant to commit decisively. The overall impression was of markets still searching for a coherent theme to latch onto. Equities in major centers reflected the unease, struggling to hold early gains and ultimately turning lower as worries over stretched AI valuations resurfaced. Treasury yields pushed higher, only to reverse on Friday.
Part of the hesitation stems from the contradictory nature of last week’s information. The FOMC minutes were hawkish. The delayed September NFP report showed solid hiring. But then New York Fed President John Williams unexpectedly opened the door to another “near-term adjustment,” forcing traders to reprice December odds yet again. Markets were left without a clear policy narrative, and price action reflected that lack of anchor.
In the currency markets, Dollar ended the week broadly higher but not forcefully so. Canadian Dollar was the second best, while Sterling followed. Swiss Franc was the worst performer as traders unwound the gains following the US-Switzerland trade deal. Aussie was the second worst despite hawkish as dragged down by weaker risk-sentiment. Yen was pressured almost all the weak on BoJ expectations, but ended just at the third bottom thanks to a late rebound. Euro and Kiwi ended in middle ground.
Fed December Call Turns Into a High-Stakes Guesswork Exercise
If there was one theme dominating markets this week, it was the extraordinary uncertainty surrounding the Fed’s December meeting. Normally, by this stage of the cycle, traders would have a clear sense of whether policymakers were leaning toward easing or holding. Instead, expectations saw their sharpest whiplash in months.
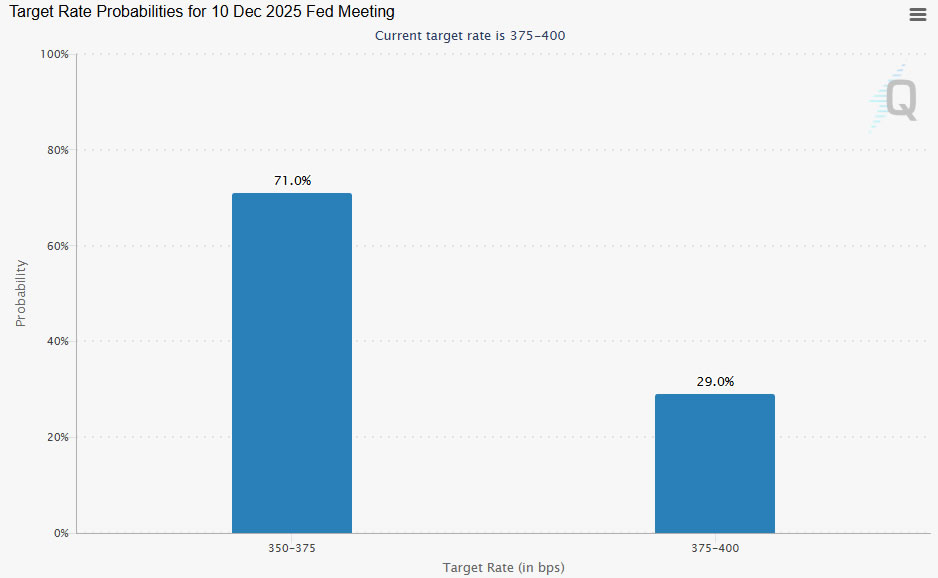
The release of the FOMC minutes was the first major shock. The document revealed that “many participants” believed it would be appropriate to hold rates steady for the remainder of the year, a stronger pushback than markets had anticipated. Combined with solid September job gains, this led futures traders to slash the odds of a December cut to around 35%, the lowest in weeks.
But the picture changed abruptly when New York Fed President John Williams—one of the most influential voices on the Committee—argued there was still room for a “near-term adjustment” to bring policy closer to neutral. Because he is a permanent voter, and not known as a political actor, his remarks carried significant weight. Markets rapidly repriced, with December cut odds surging back above 70%.
But this surge in confidence is only part of the story, because the Fed now lacks the data required to make an informed judgment. The delayed CPI and employment reports mean policymakers will enter the December 9–10 meeting without knowing how inflation behaved in November or how the labor market evolved. Their new forecasts must therefore rely on incomplete information—an almost unprecedented scenario for a decision of this magnitude.
This leaves policymakers in an unusually uncomfortable position. They must decide whether to take out another “insurance” cut in the dark or wait until they have fuller information. As a result, December’s meeting is shaping up to be one of the most unpredictable in recent memory. The Committee could reasonably justify either action, and market pricing may continue to swing sharply with every speech or secondary indicator. Until better data arrives in mid-December, uncertainty will remain the defining feature of Fed expectations.
AI Reversal Bruises Sentiment
The sharp swings in Fed expectations spilled directly into equity markets, where sentiment deteriorated noticeably. Optimism following Nvidia’s blockbuster earnings lasted only a matter of hours before the market staged its largest intraday reversal since April. Investors appeared eager to fade rallies rather than chase them.
This hesitation has been compounded by the shifting interest-rate backdrop. While John Williams’ comments gave equities a brief reprieve, the rate outlook didn't change. Even if the Fed does cut in December—the bar for further easing is becoming significantly higher. Two consecutive rate reductions earlier in the year do not guarantee an open-ended cycle,That prospect alone threatens the liquidity tailwind that has supported high-growth tech names. and policymakers have signaled a desire to proceed more cautiously from here.
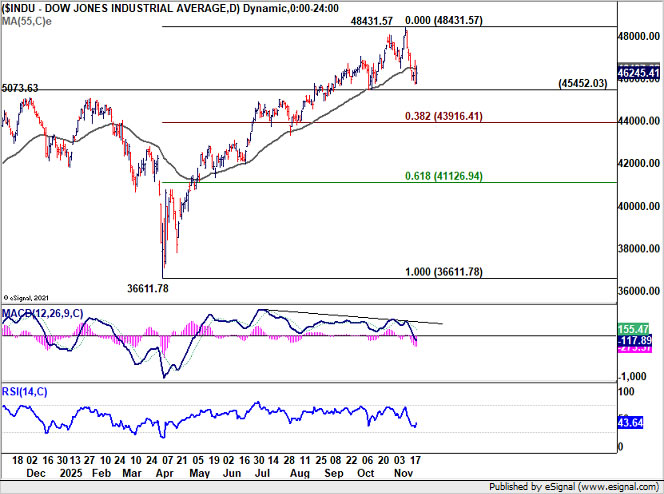
Technical conditions also argue for caution. DOW has broken below its 55 D EMA, with bearish divergence on D MACD raising the risk that a medium-term top has already formed at 48,431.57 earlier in the month. In the less bearish case, fall from 48,431.57 is merely correcting the rise from 36,611.78. But still, break of 45,452.03 support would bring deeper fall to 38.2% retracement of 36,611.78 to 48,431.57 at 43,916.41.
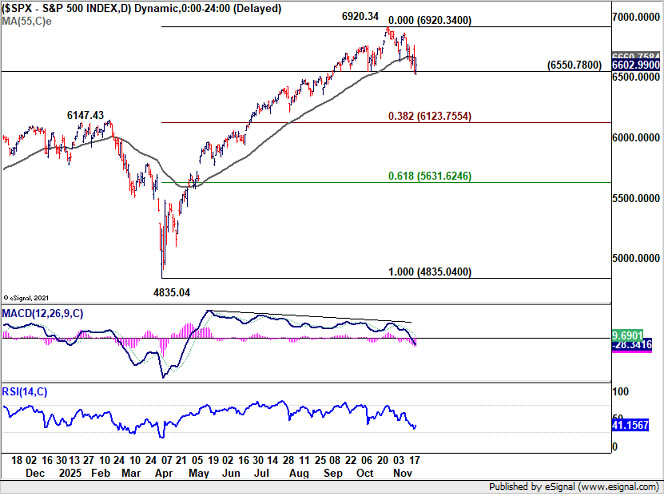
Similar signals are present across the S&P 500 and NASDAQ. A medium term top could be formed at 6,290.34 in S&P 500, with the close below 55 D EMA and bearish divergence condition in D MACD. Decisive break of 6,550.78 support will bring deeper fall to 38.2% retracement of 4,835.04 to 6,920.34 at 6,123.75.
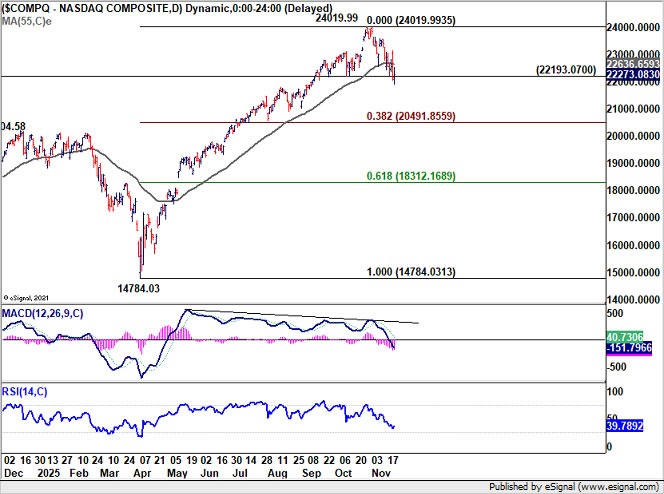
For NASDAQ, the fall from 24,019.99 is seen as a correction to the up trend from 14,784.03. Firm break of 22,193.07 support will pave the way to 38.2% retracement of 14,784.03 to 24,019.99 at 20,491.85.
Europe Turns Lower While Nikkei is an Outlier
European equity markets endured a difficult week too. Major benchmarks — including FTSE, DAX, and CAC — traded sharply lower
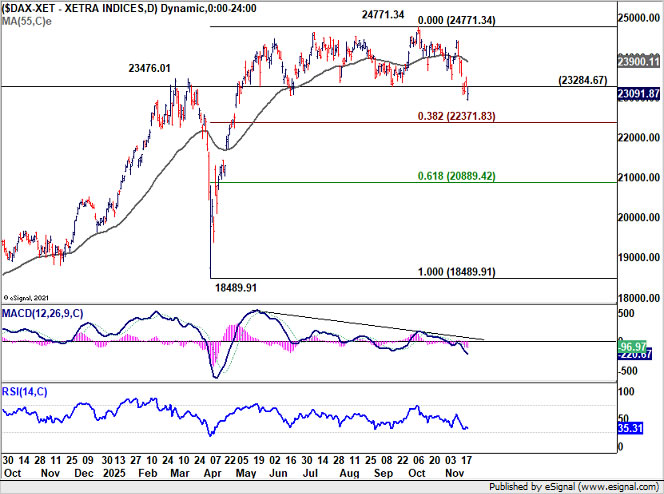
Germany’s DAX stands out as the most structurally vulnerable. The index broke decisively below 23,284 support following a bearish gap-down earlier in the week, signaling that a medium-term top has likely formed at 24,771.34. The minimum target for corretion should be 38.2% retracement of 18,489.91 to 24,771.34 at 23,371.83n. It would well extend to 61.8% retracement at 20,889.42 before finding a bottom.
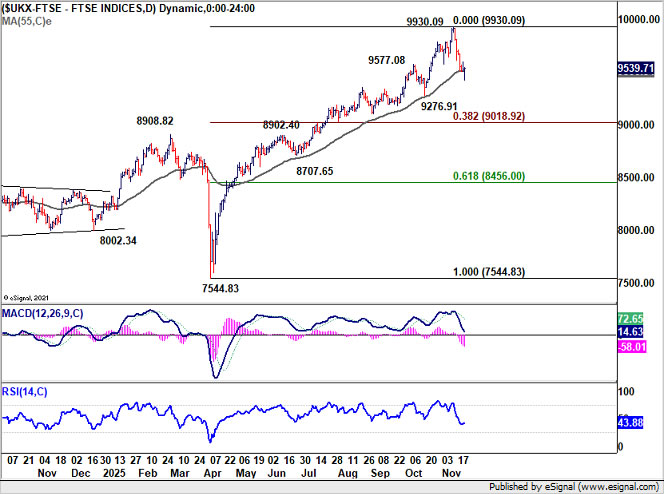
FTSE’s picture is marginally better, though still threatened. The index is clinging to its 55D EMA (now at 9,506.54), with the market awaiting clarity from next week’s Autumn Budget. Any sign of tax increases or reduced fiscal support could add significant downside pressure. Another selloff will align the outlook with the US markets, and suggests that FTSE is already in correction to the rise from 7,544.83. That would bring deeper fall to 38.2% retracement of 7,544.83 to 9,930.09 at 9,018.92.
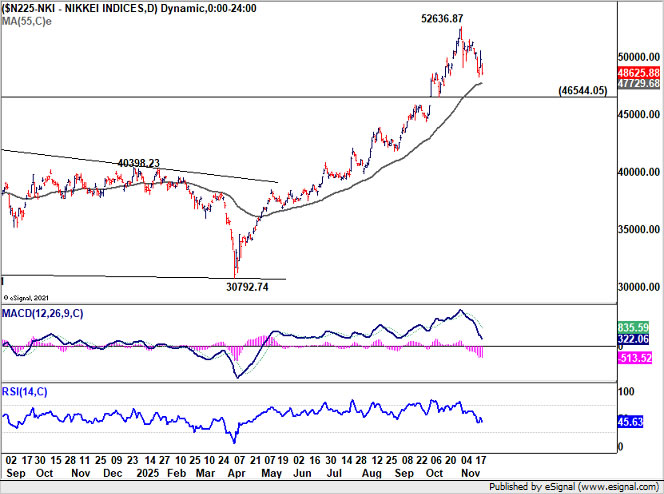
Across Asia, sentiment was equally fragile. Japan’s Nikkei gyrated lower in sympathy with global declines, but continues to display relative resilience. Sentiment was supported by expectations that the BoJ will avoid tightening in December and possibly even in January. Optimism over Japan’s JPY 17.7T stimulus package has also helped cushion downside risks, alongside Prime Minister Sanae Takaichi’s exceptionally strong approval ratings, which have restored a degree of political stability.
Still, Nikkei is not immune to global risk dynamics. The AI-led reversal in U.S. tech stocks has begun to cap upside momentum, and sustained break below its 55 Day EMA (now at 47,729.68) would signal that Japanese equities are also entering a deeper correction phase. Until then, the uptrend from 30,792.74 technically remains intact.
Dollar Index's Bounce from 96.21 Still in Force Despite Weak Momentum
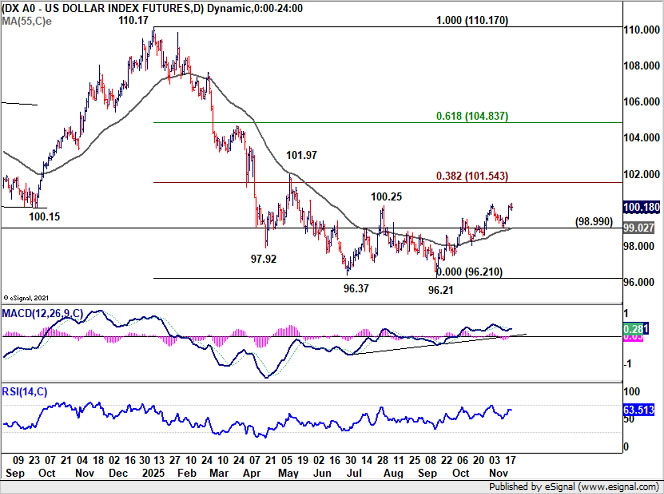
Dollar Index's rebound from 96.21 extended higher last week even though momentum is lacking. Outlook is unchanged that rise from 96.21 is viewed as a correction to the decline from 110.17 only. Hence, while further rise could be seen, strong resistance should emerge from 38.2% retracement of 110.17 to 96.21 at 101.54 to limit upside. Break of 98.99 support will argue that the corrective bounce has already completed.
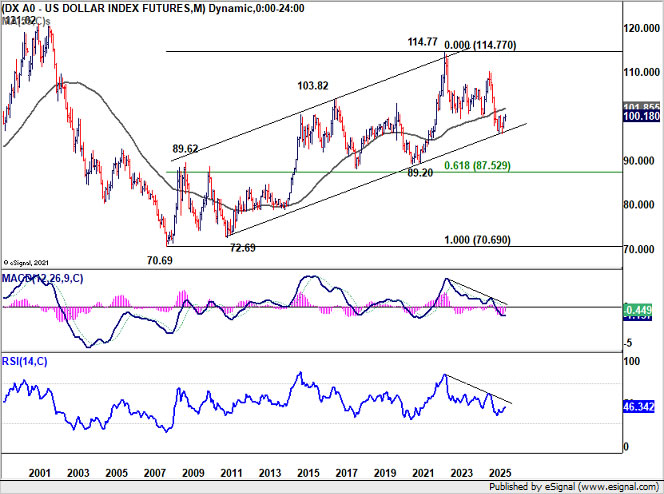
However, the long term picture should be emphasized again. Dollar index has just bounced off from a multi-decade channel floor that defined the up trend since 2008. Firm break of 101.54 could push Dollar Index through 55 M EMA (now at 101.85). That would raise the chance that whole down trend from 114.77 (2022 high) has completed as a three wave correction to 96.21. A sustained, extended medium term rally would then follow. This is not the base case for now, but it's plausible, in particular if risk aversion intensifies.
EUR/USD Weekly Outlook
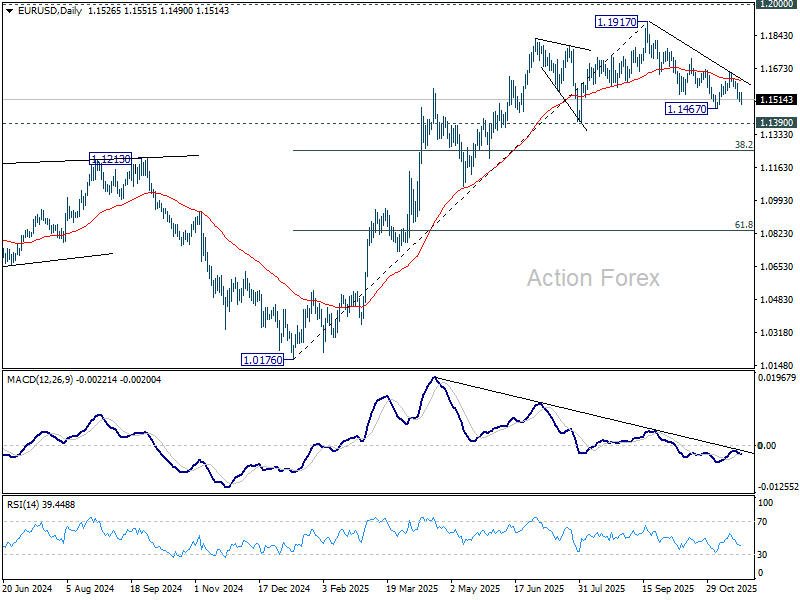
EUR/USD's extended decline last week suggests that rebound from 1.1467 has completed at 1.1655. More importantly fall from 1.1917 high is not complete. Initial bias stays on the downside this week for 1.1467 first. Firm break there will target 1.1390, and then 38.2% retracement of 1.0176 to 1.1917 at 1.1252. On the upside, above 1.1551 minor resistance will turn intraday bias neutral. But risk will stay on the downside as long as 1.1655 resistance holds, in case of recovery.
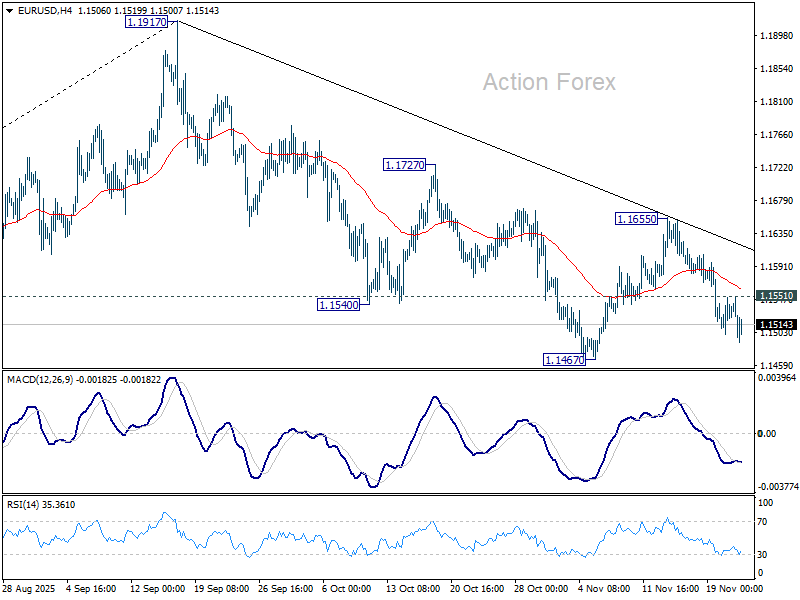
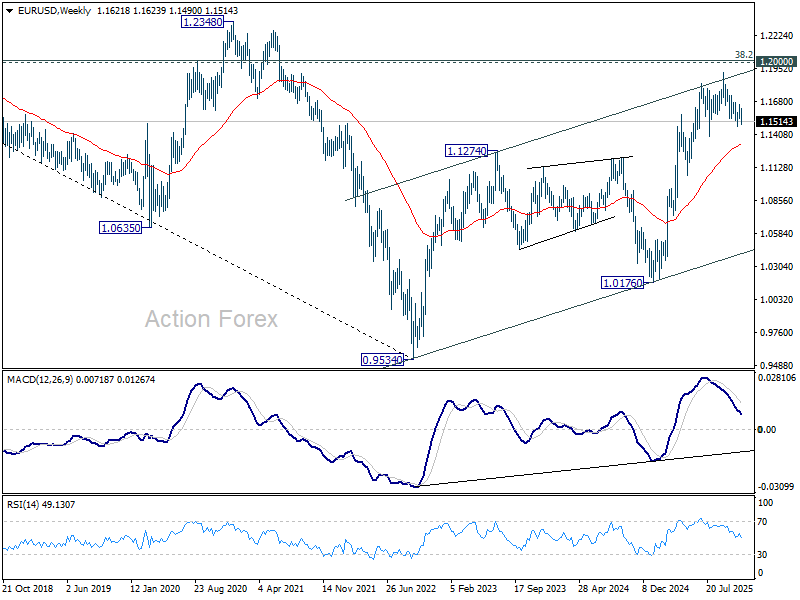
In the bigger picture, considering bearish divergence condition in D MACD, a medium term top is likely in place at 1.1917, just ahead of 1.2 key psychological level. As long as 55 W EMA (now at 1.1328) holds, the up trend from 0.9534 (2022 low) is still in favor to continue. Decisive break of 1.2000 will carry larger bullish implications. However, sustained trading below 55 W EMA will argue that rise from 0.9534 has completed as a three wave corrective bounce, and keep long term outlook bearish.
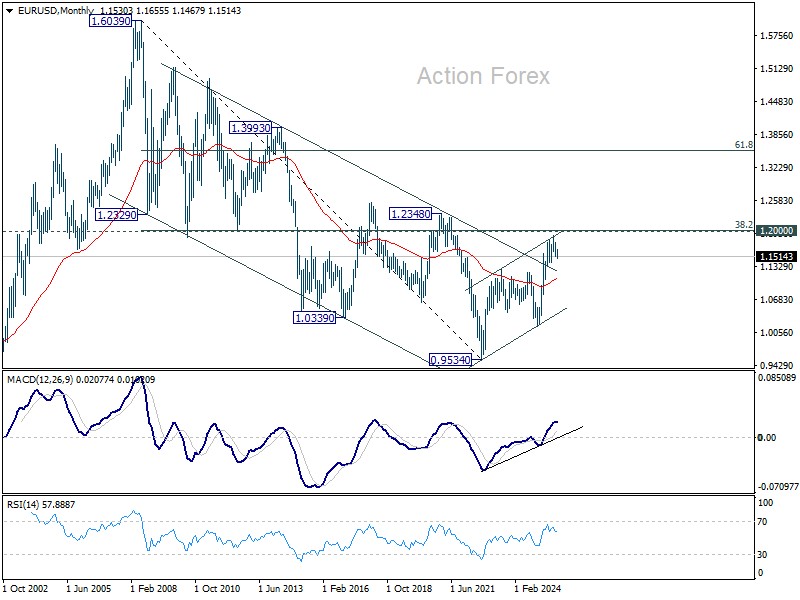
In the long term picture, 38.2% retracement of 1.6039 to 0.9534 at 1.2019, which is close to 1.2000 psychological level is the key for the outlook. Rejection by this level will keep the multi decade down trend from 1.6039 (2008 high) intact, and keep outlook neutral at best. However, decisive break of 1.2000/19, will suggest long term bullish trend reversal, and target 61.8% retracement at 1.3554.
EUR/USD Weekly Outlook
EUR/USD's extended decline last week suggests that rebound from 1.1467 has completed at 1.1655. More importantly fall from 1.1917 high is not complete. Initial bias stays on the downside this week for 1.1467 first. Firm break there will target 1.1390, and then 38.2% retracement of 1.0176 to 1.1917 at 1.1252. On the upside, above 1.1551 minor resistance will turn intraday bias neutral. But risk will stay on the downside as long as 1.1655 resistance holds, in case of recovery.
In the bigger picture, considering bearish divergence condition in D MACD, a medium term top is likely in place at 1.1917, just ahead of 1.2 key psychological level. As long as 55 W EMA (now at 1.1328) holds, the up trend from 0.9534 (2022 low) is still in favor to continue. Decisive break of 1.2000 will carry larger bullish implications. However, sustained trading below 55 W EMA will argue that rise from 0.9534 has completed as a three wave corrective bounce, and keep long term outlook bearish.
In the long term picture, 38.2% retracement of 1.6039 to 0.9534 at 1.2019, which is close to 1.2000 psychological level is the key for the outlook. Rejection by this level will keep the multi decade down trend from 1.6039 (2008 high) intact, and keep outlook neutral at best. However, decisive break of 1.2000/19, will suggest long term bullish trend reversal, and target 61.8% retracement at 1.3554.
USD/JPY Weekly Outlook
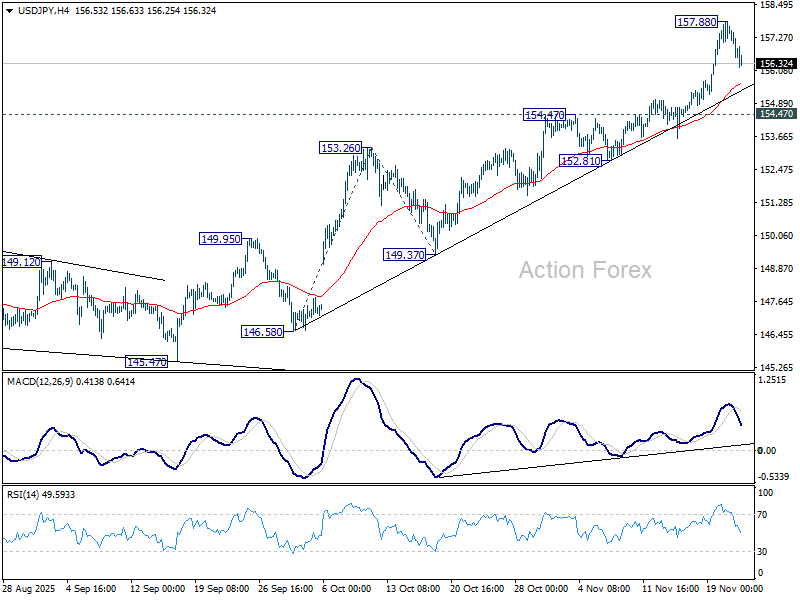
USD/JPY's rise from 139.87 contained last week and hit as high as 157.88 before retreating. Initial bias remains neutral this week first for consolidations. Downside should be contained by 154.47 resistance turned support to bring rebound. On the upside, break of 157.88 will target 161.8% projection of 146.58 to 153.26 from 149.37 at 160.17.
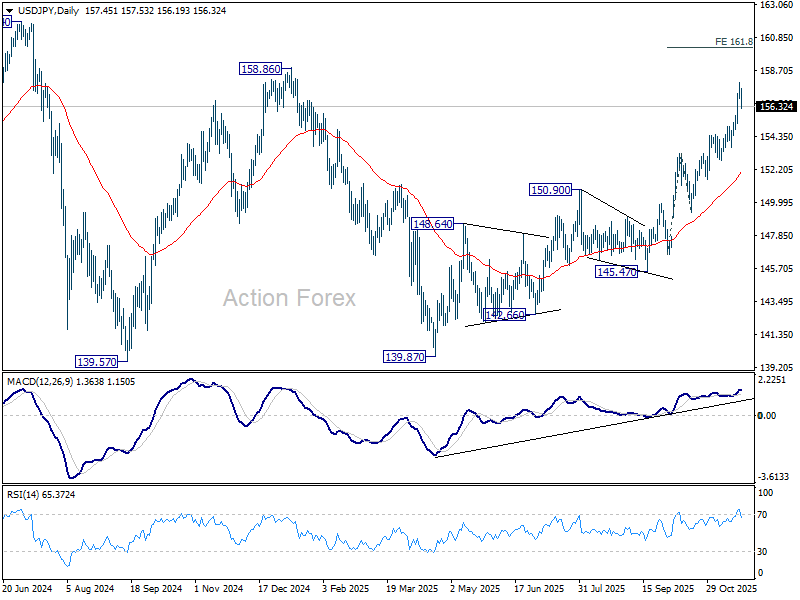
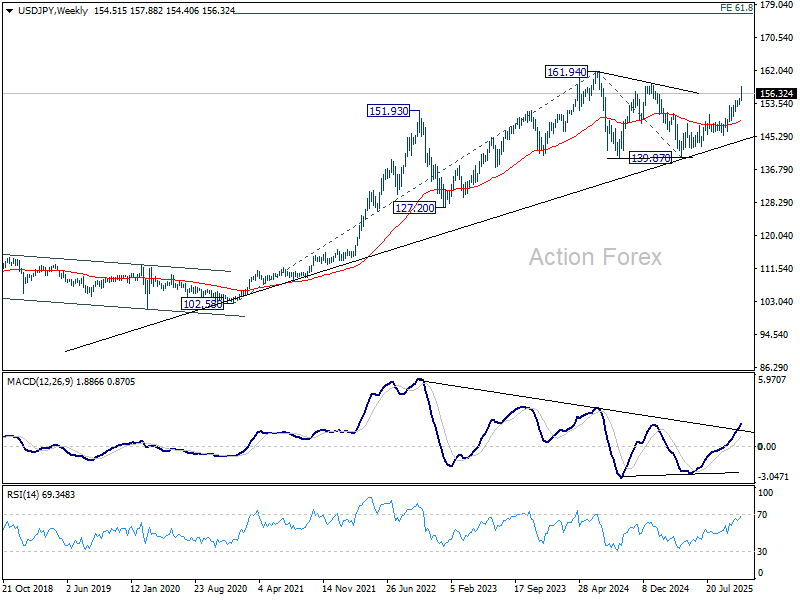
In the bigger picture, current development suggests that corrective pattern from 161.94 (2024 high) has completed with three waves at 139.87. Larger up trend from 102.58 (2021 low) could be ready to resume through 161.94 high. Decisive break of 158.85 structural resistance will solidify this bullish case and target 161.94 for confirmation. On the downside, break of 150.90 resistance turned support will dampen this bullish view and extend the corrective range pattern with another falling leg.
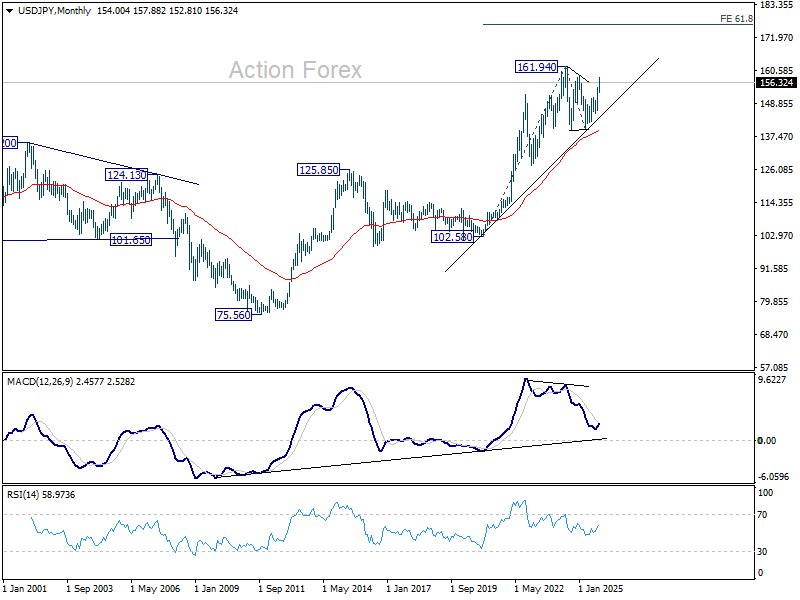
In the long term picture, up trend from 75.56 (2011 low) is still in progress and might be ready to resumption. Firm break of 161.94 will target 61.8% projection of 102.58 (2020 low) to 161.94 (2024 high) from 139.87 at 176.55 in the medium term.
GBP/USD Weekly Outlook
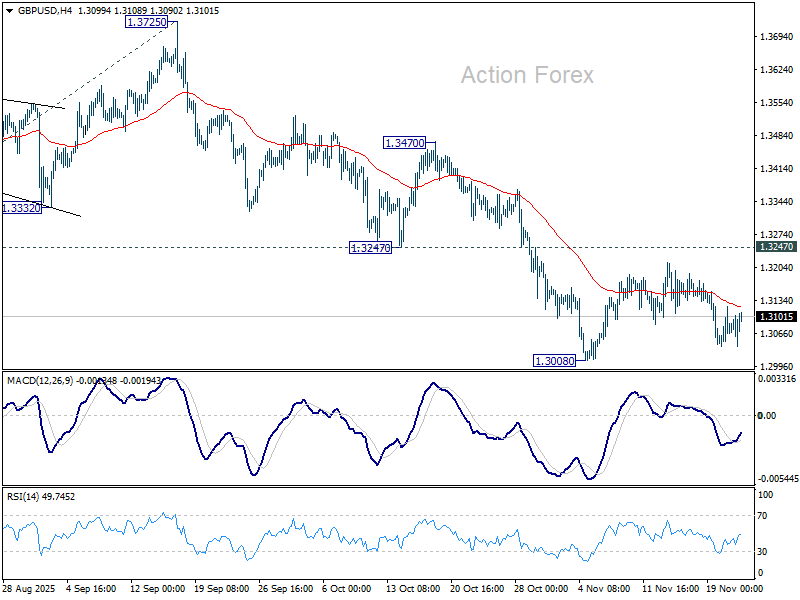
No change in GBP/USD's outlook as range trading continued above 1.3008 last week. Initial bias stays neutral this week first. With 1.3247 support turned resistance intact, further decline is expected. Break of 1.3008 will resume the fall from 1.3725 to 138.2% projection of 1.3787 to 1.3140 from 1.3725 at 1.2831. Nevertheless, firm break of 1.3247 will suggest that fall from 1.3787 has completed as a corrective move already.
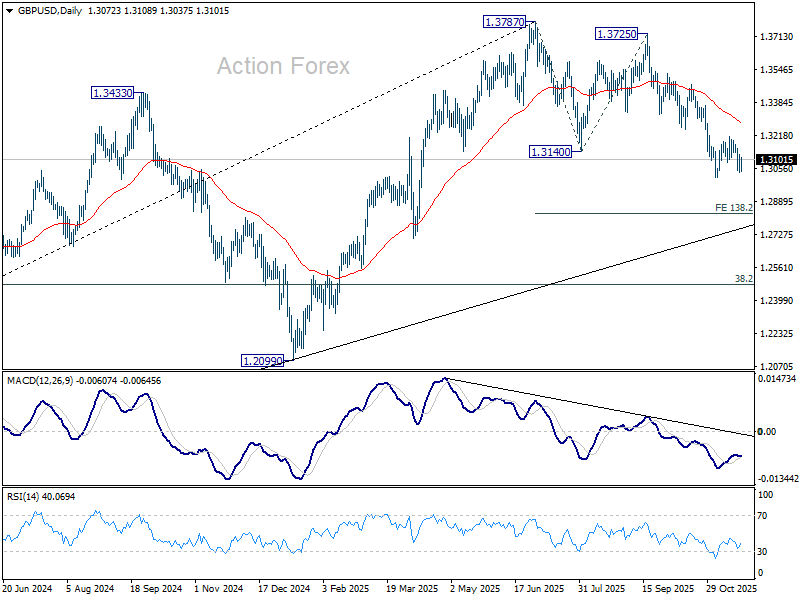
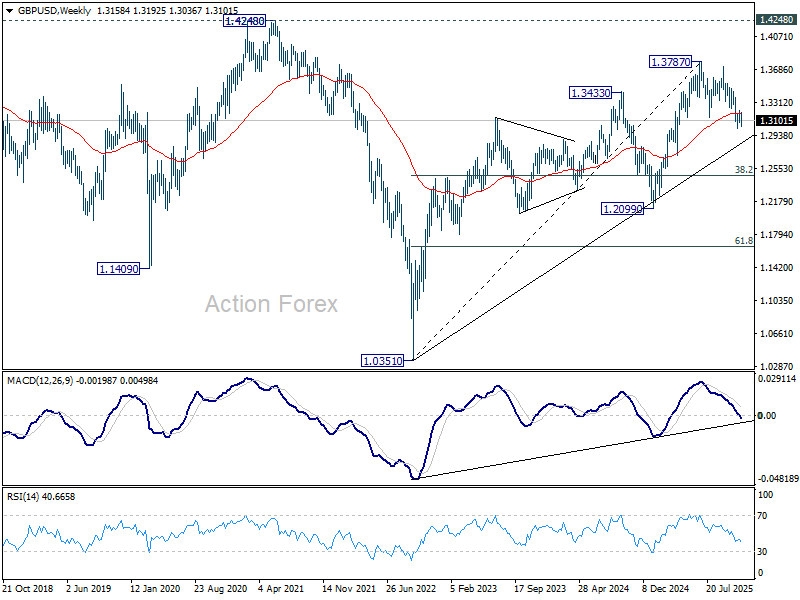
In the bigger picture, the break of 55 W EMA (now at 1.3184) is taken as the first sign that corrective rise from 1.0351 (2022 low) has completed. Decisive break of trend line support (now at 1.2760) will solidify this case and target 38.2% retracement of 1.0351 to 1.3787 at 1.2474 next. Meanwhile, in case of another rise, strong resistance should emerge below 1.4248 (2021 high) to cap upside to preserve the long term down trend.
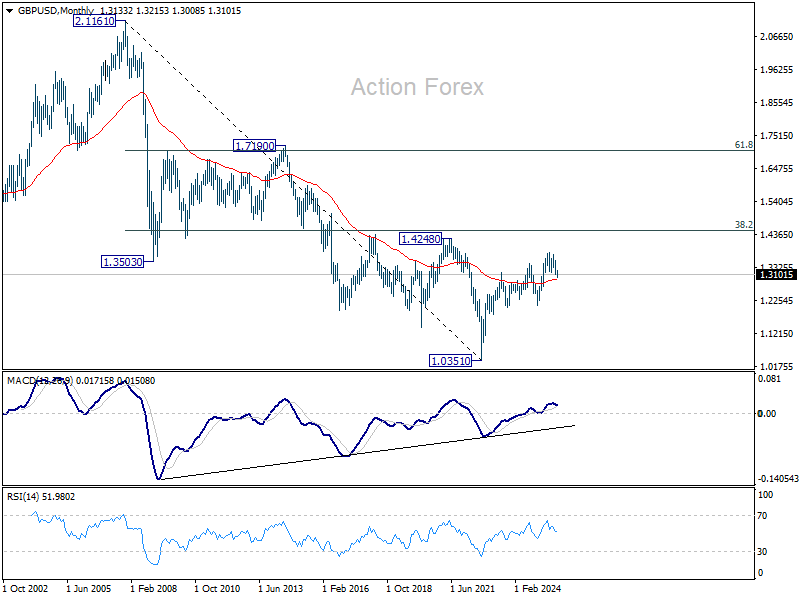
In the long term picture, as long as 1.4248/4480 resistance holds (38.2% retracement of 2.1161 to 1.0351 at 1.4480), the long term outlook will remain bearish. That is, price actions from 1.3051 are seen as a corrective pattern to down trend from 2.1161 (2007 high) only. Nevertheless, decisive break of 1.4248/4480 will be a strong sign of long term bullish reversal.
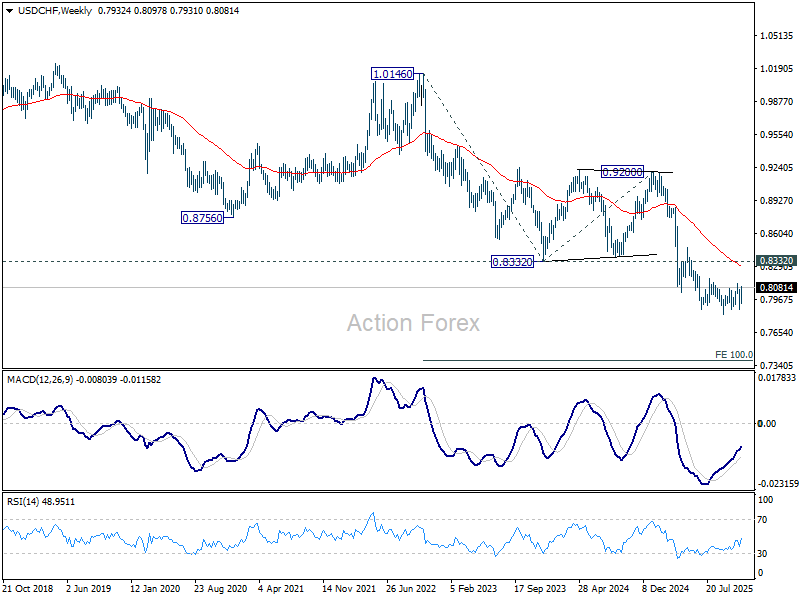
USD/CHF Weekly Outlook
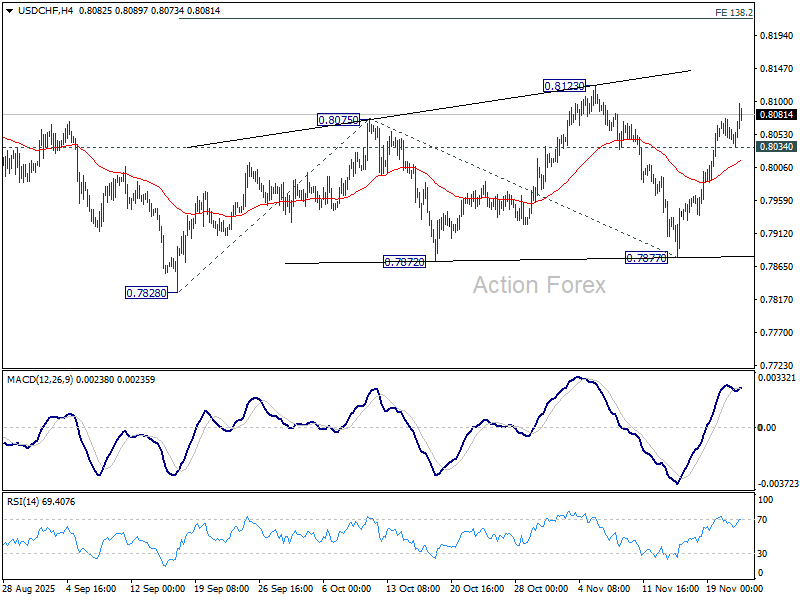
USD/CHF's strong rally last week dampened the original bearish view and suggests that corrective pattern from 0.7828 low is still extending. Initial bias is now on the upside this week for 0.8123 resistance. Firm break there will target 138.2% projection of 0.7828 to 0.8075 from 0.7877 at 0.8218. On the downside, below 0.8034 minor support will turn intraday bias neutral first.
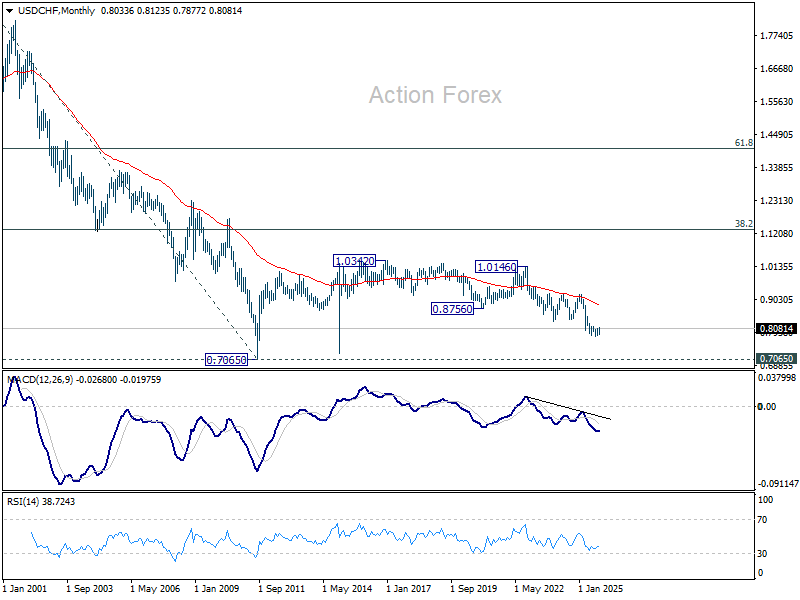
In the bigger picture, long term down trend from 1.0342 (2017 high) is still in progress. Next target is 100% projection of 1.0146 (2022 high) to 0.8332 from 0.9200 at 0.7382. In any case, outlook will stay bearish as long as 0.8332 support turned resistance holds (2023 low).
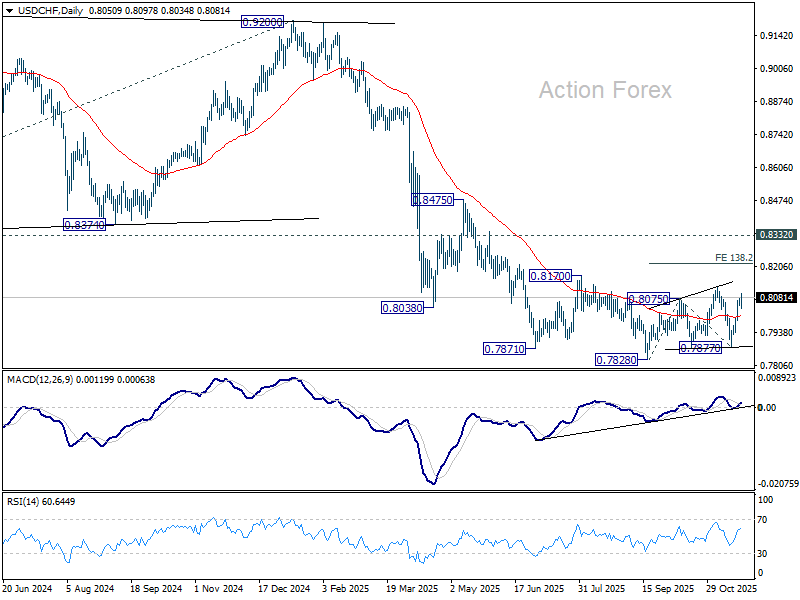
In the long term picture, price action from 0.7065 (2011 low) are seen as a corrective pattern to the multi-decade down trend from 1.8305 (2000 high). It's uncertain if the fall from 1.0342 is the second leg of the pattern, or resumption of the downtrend. But in either case, outlook will stay bearish as long as 0.8756 support turned resistance holds (2021 low). Retest of 0.7065 should be seen next.