
Sample Category Title
AUD/USD Stumbles Again—A Bigger Breakdown Could Be Near
Key Highlights
- AUD/USD started a fresh decline below 0.7120 and 0.7080.
- A bearish trend line is forming with resistance at 0.7065 on the 4-hour chart.
- Bitcoin started a consolidation phase above $60,000.
- Gold extended losses below $4,200 and tested $4,050.
AUD/USD Technical Analysis
The Aussie Dollar failed to stay above 0.7120 and declined against the US Dollar. AUD/USD traded below 0.7080 to enter a bearish zone.
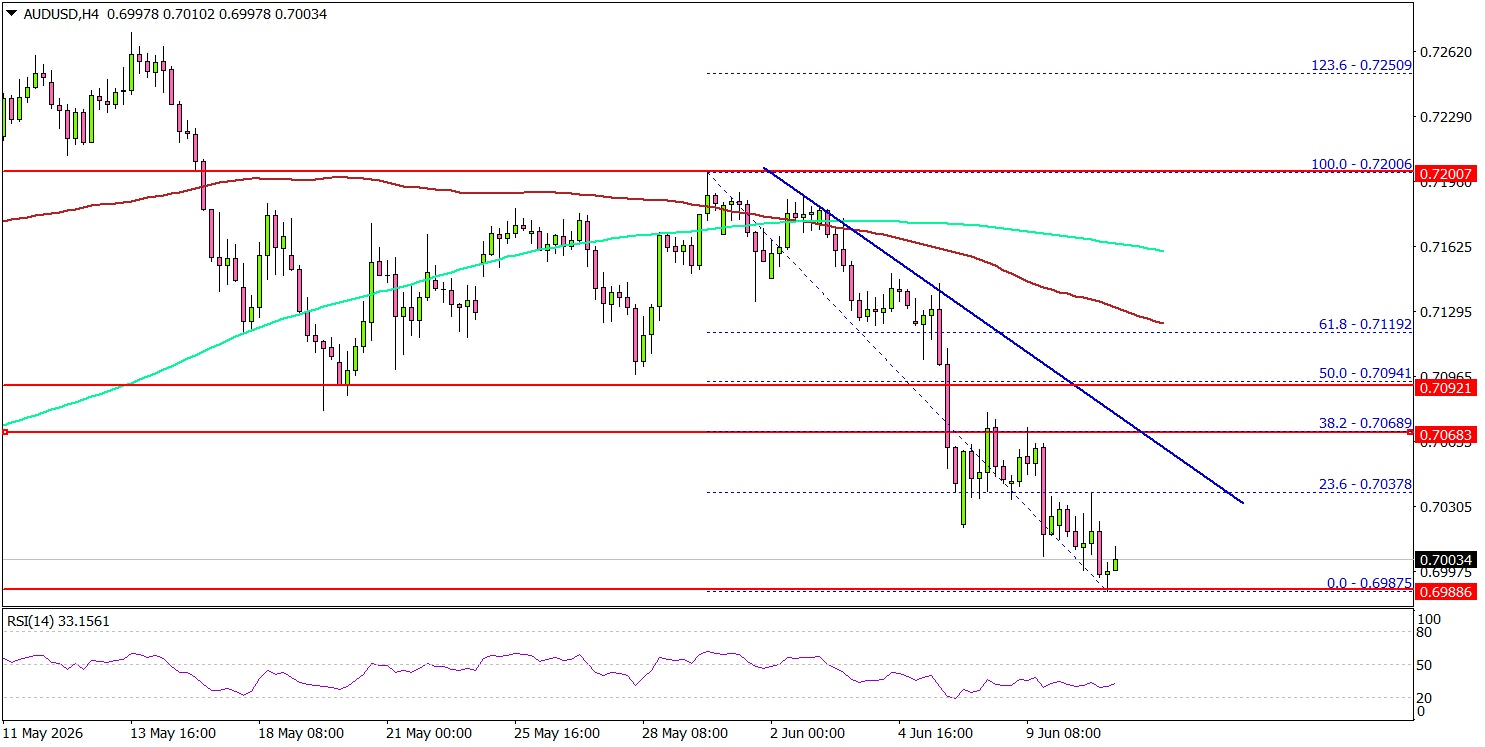
Looking at the 4-hour chart, the pair settled below the 0.7050 pivot level, the 100 simple moving average (red, 4-hour), and the 200 simple moving average (green, 4-hour). The pair even spiked below 0.7000. A low was formed at 0.6987, and the pair is now consolidating losses.
On the upside, an immediate resistance could be 0.7035. The next major resistance might be 0.7065. There is also a bearish trend line forming with resistance at 0.7065.
A close above 0.7065 could open doors for gains. The main hurdle for the bulls could be 0.7120 and the 100 simple moving average (red, 4-hour). If there is a close above 0.7120, the pair could rise toward the 0.7165 level.
Immediate support could be 0.6980. The first major support might be 0.6960. A close below 0.6960 could open the doors for a larger decline toward 0.6920. Any more losses might set the pace for a test of 0.6880.
Looking at Gold, there was a sharp decline below $4,250, and the bears might even aim for a move below $4,000.
Upcoming Key Economic Events:
- US Initial Jobless Claims - Forecast 219K, versus 225K previous.
- US Producer Price Index for May 2026 (MoM) – Forecast +0.7%, versus +1.4% previous.
- US Producer Price Index for May 2026 (YoY) – Forecast +6.4%, versus +6.0% previous.
Bitcoin (BTCUSD) Elliott Wave Count: Renewed Decline Approaches $41,400–52,200
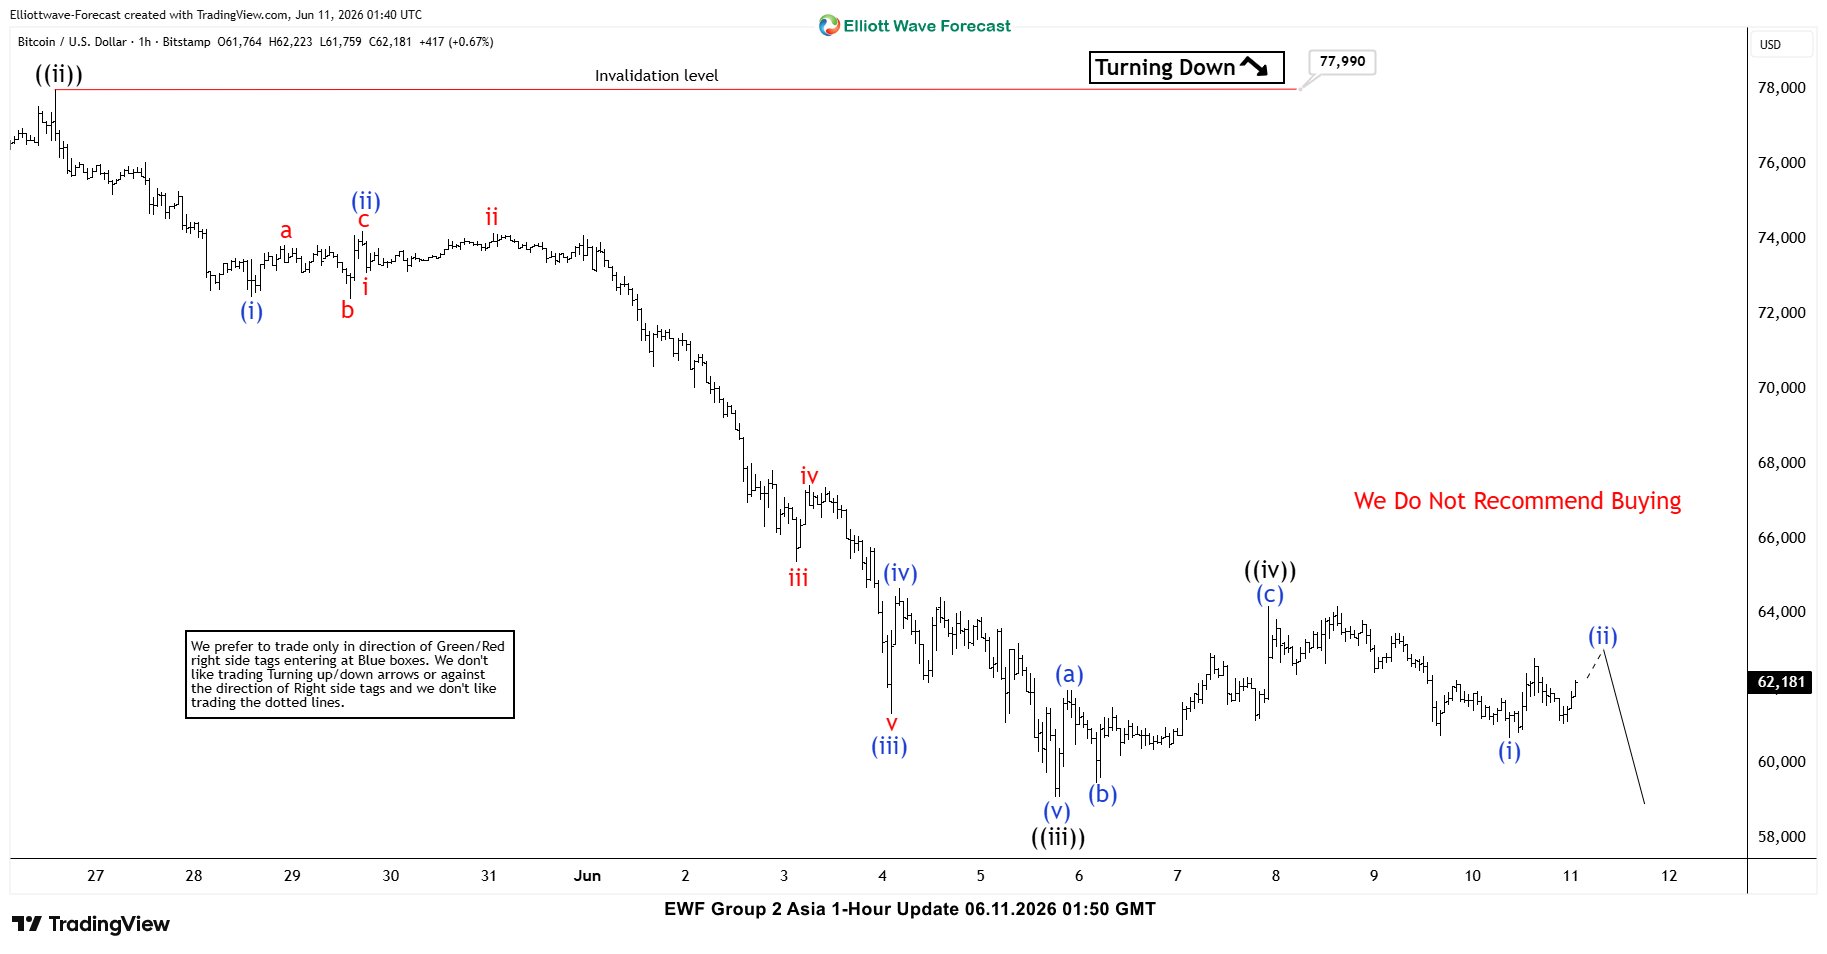
The short-term Elliott Wave structure from the May 6, 2026 peak is developing as a clear five-wave impulse. From the May 6 high, wave ((i)) concluded at $74,192, followed by a corrective rally in wave ((ii)) that terminated at $78,000. After this retracement, the cryptocurrency resumed its decline in wave ((iii)), which itself unfolded as a smaller degree impulse. Within this sequence, wave (i) ended at $72,462, while wave (ii) produced a modest rally that finished at $74,223.
The downward momentum continued as Bitcoin advanced into wave (iii), reaching $61,310 before a corrective rally in wave (iv) ended at $64,687. Subsequently, wave (v) drove prices lower to $59,104, completing the larger wave ((iii)). A rebound then materialized, and wave ((iv)) is proposed to have concluded at $64,197. From that level, the cryptocurrency has resumed its descent, reinforcing the broader bearish structure.
Near term analysis suggests that as long as the pivot at $78,000 remains intact, rallies are expected to fail. Such rallies are likely to unfold in corrective sequences of three or seven swings, ultimately leading to further downside pressure. A potential downside target is projected through the 100%–123.6% Fibonacci extension measured from the October 6, 2025 high. This extension aligns with the $41,400–$52,200 price zone, an area where notable support may emerge.
Bitcoin (BTCUSD) 60-Minute Elliott Wave Chart
BTCUSD Elliott Wave Video:
https://www.youtube.com/watch?v=IaUlbgopUBo
Gold Continues to Trend Lower and Pressure 2026 Low
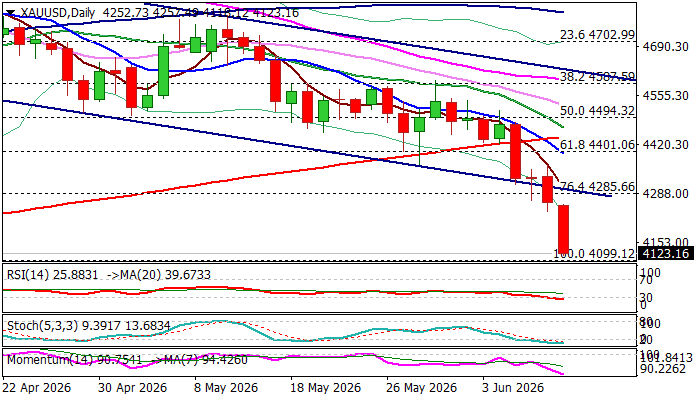
Gold hit the lowest in ten weeks on Wednesday, following fresh acceleration after breaking below the lower boundary of a bear-channel (which repeatedly contained attacks in few previous sessions).
Steep bear leg, the part of larger downtrend, extends into fourth straight day and eyes key support at $4099 (2026 low, posted on Mar 23).
The latest US economic data showed that inflation continues to rise, with markets already pricing 0.25% Fed rate hike in coming months, that is expected to continue to underpin dollar, along with solid US labor data (released last Friday).
The latest formation of 10/200DMA death cross contributes to signals from firmly bearish daily studies, which favors eventual attack at $4099 target, but bears may face headwinds here from oversold conditions.
In current situation, technical correction is likely to be limited (upticks to be ideally capped by broken channel support line) and provide better levels to re-enter bearish market, for probe through $4099 and attack at next strong supports at $4077 (Fibo 38.2% of $1616/$5598) and $4000 (psychological).
Res: 4236; 4285; 4303; 4366
Sup: 4099; 4077; 4000; 3928
GBPAUD Wave Analysis
GBPAUD: ⬆️ Buy
– GBPAUD broke the resistance area
– Likely to rise to resistance level 1.9200
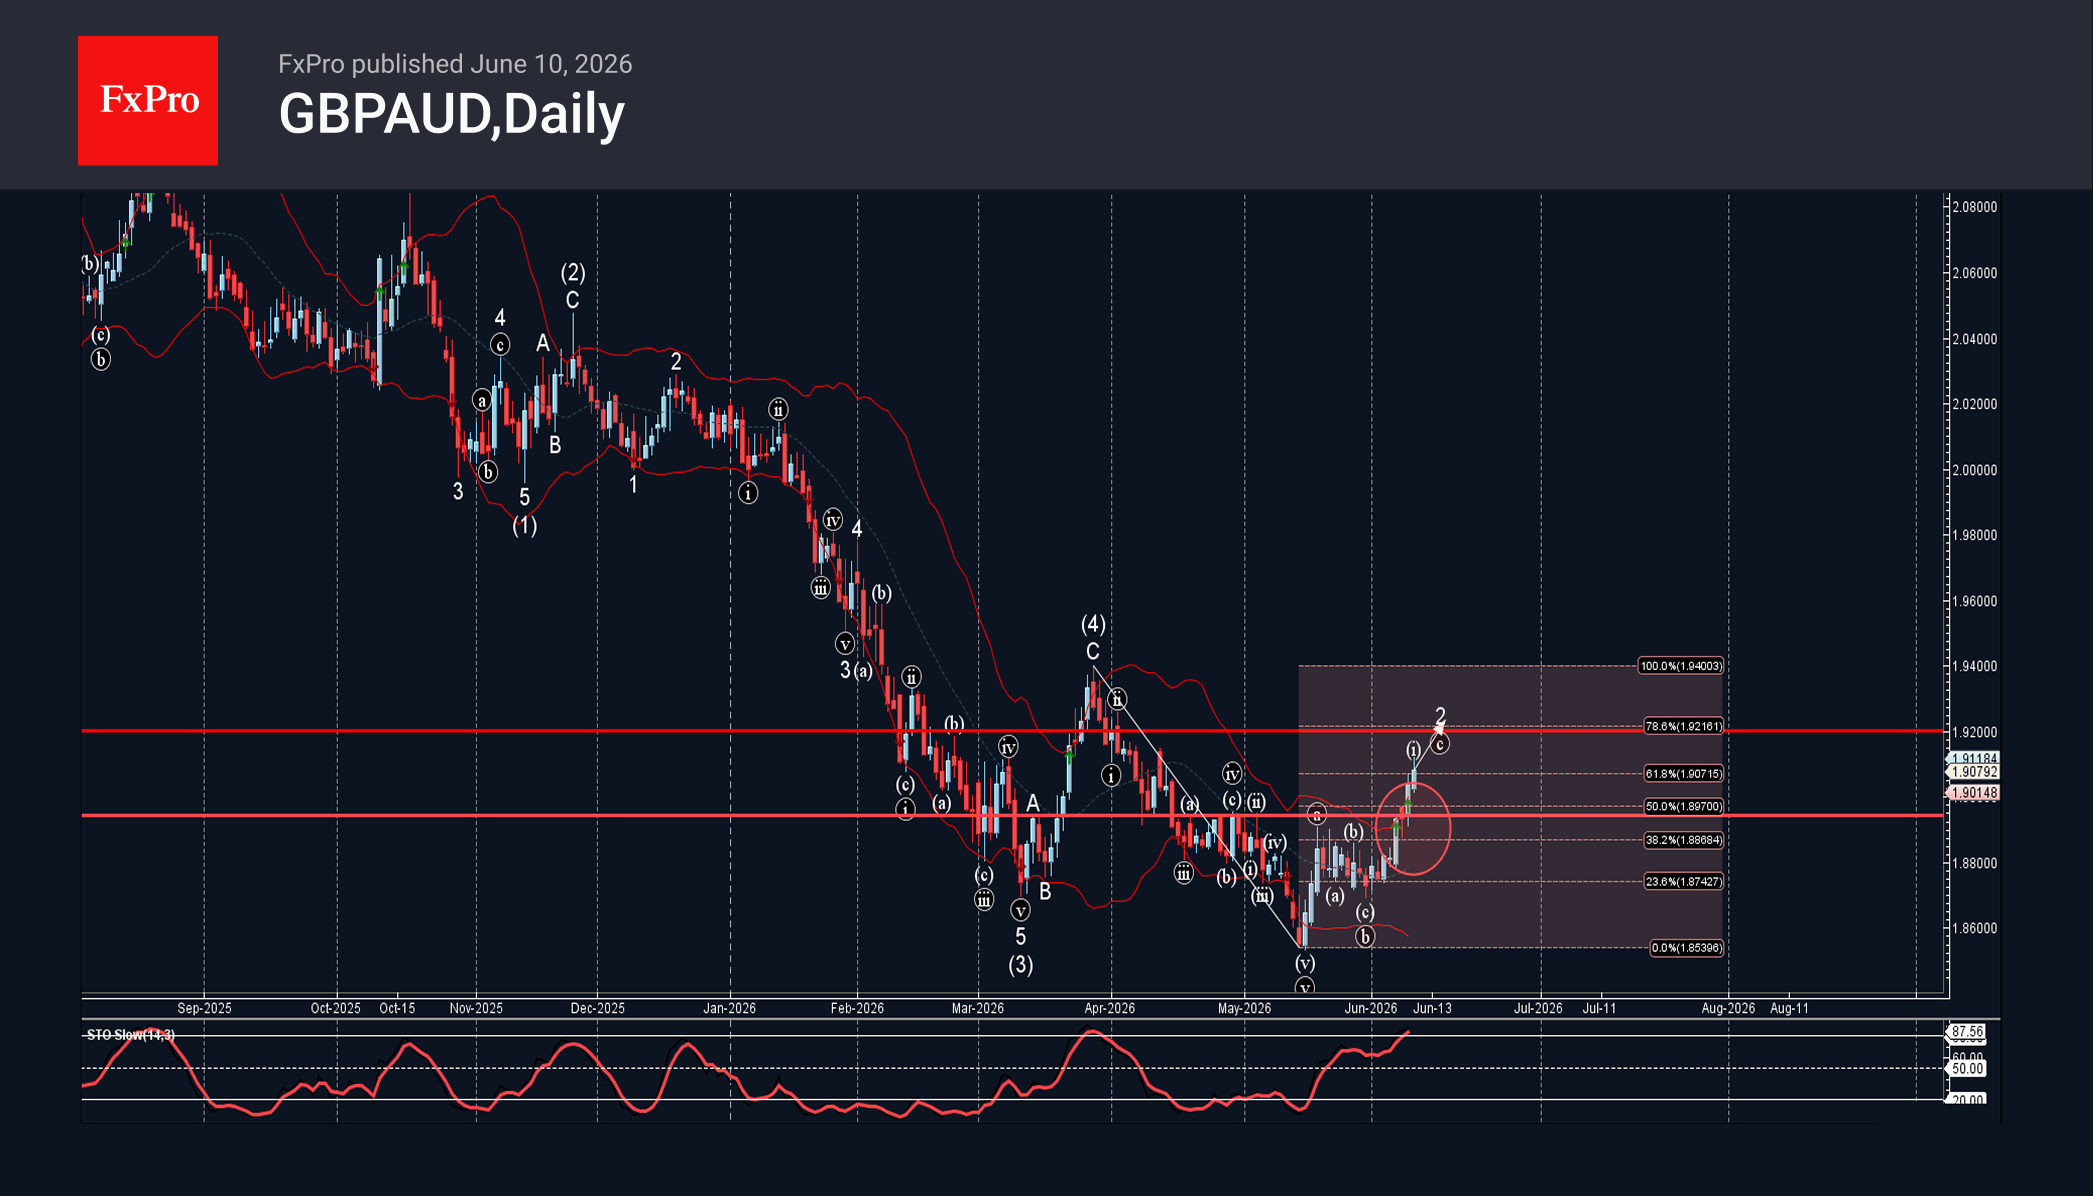
GBPAUD currency pair recently broke the resistance area between the resistance level 1.8940 (which has been reversing the price from April) and the 50% Fibonacci correction of the downward impulse from March.
The breakout of this resistance area accelerated the c-wave of the active ABC correction 2 from last month.
GBPAUD currency pair can be expected to rise to the next resistance level 1.9200, target price for the completion of the active ABC correction 2.
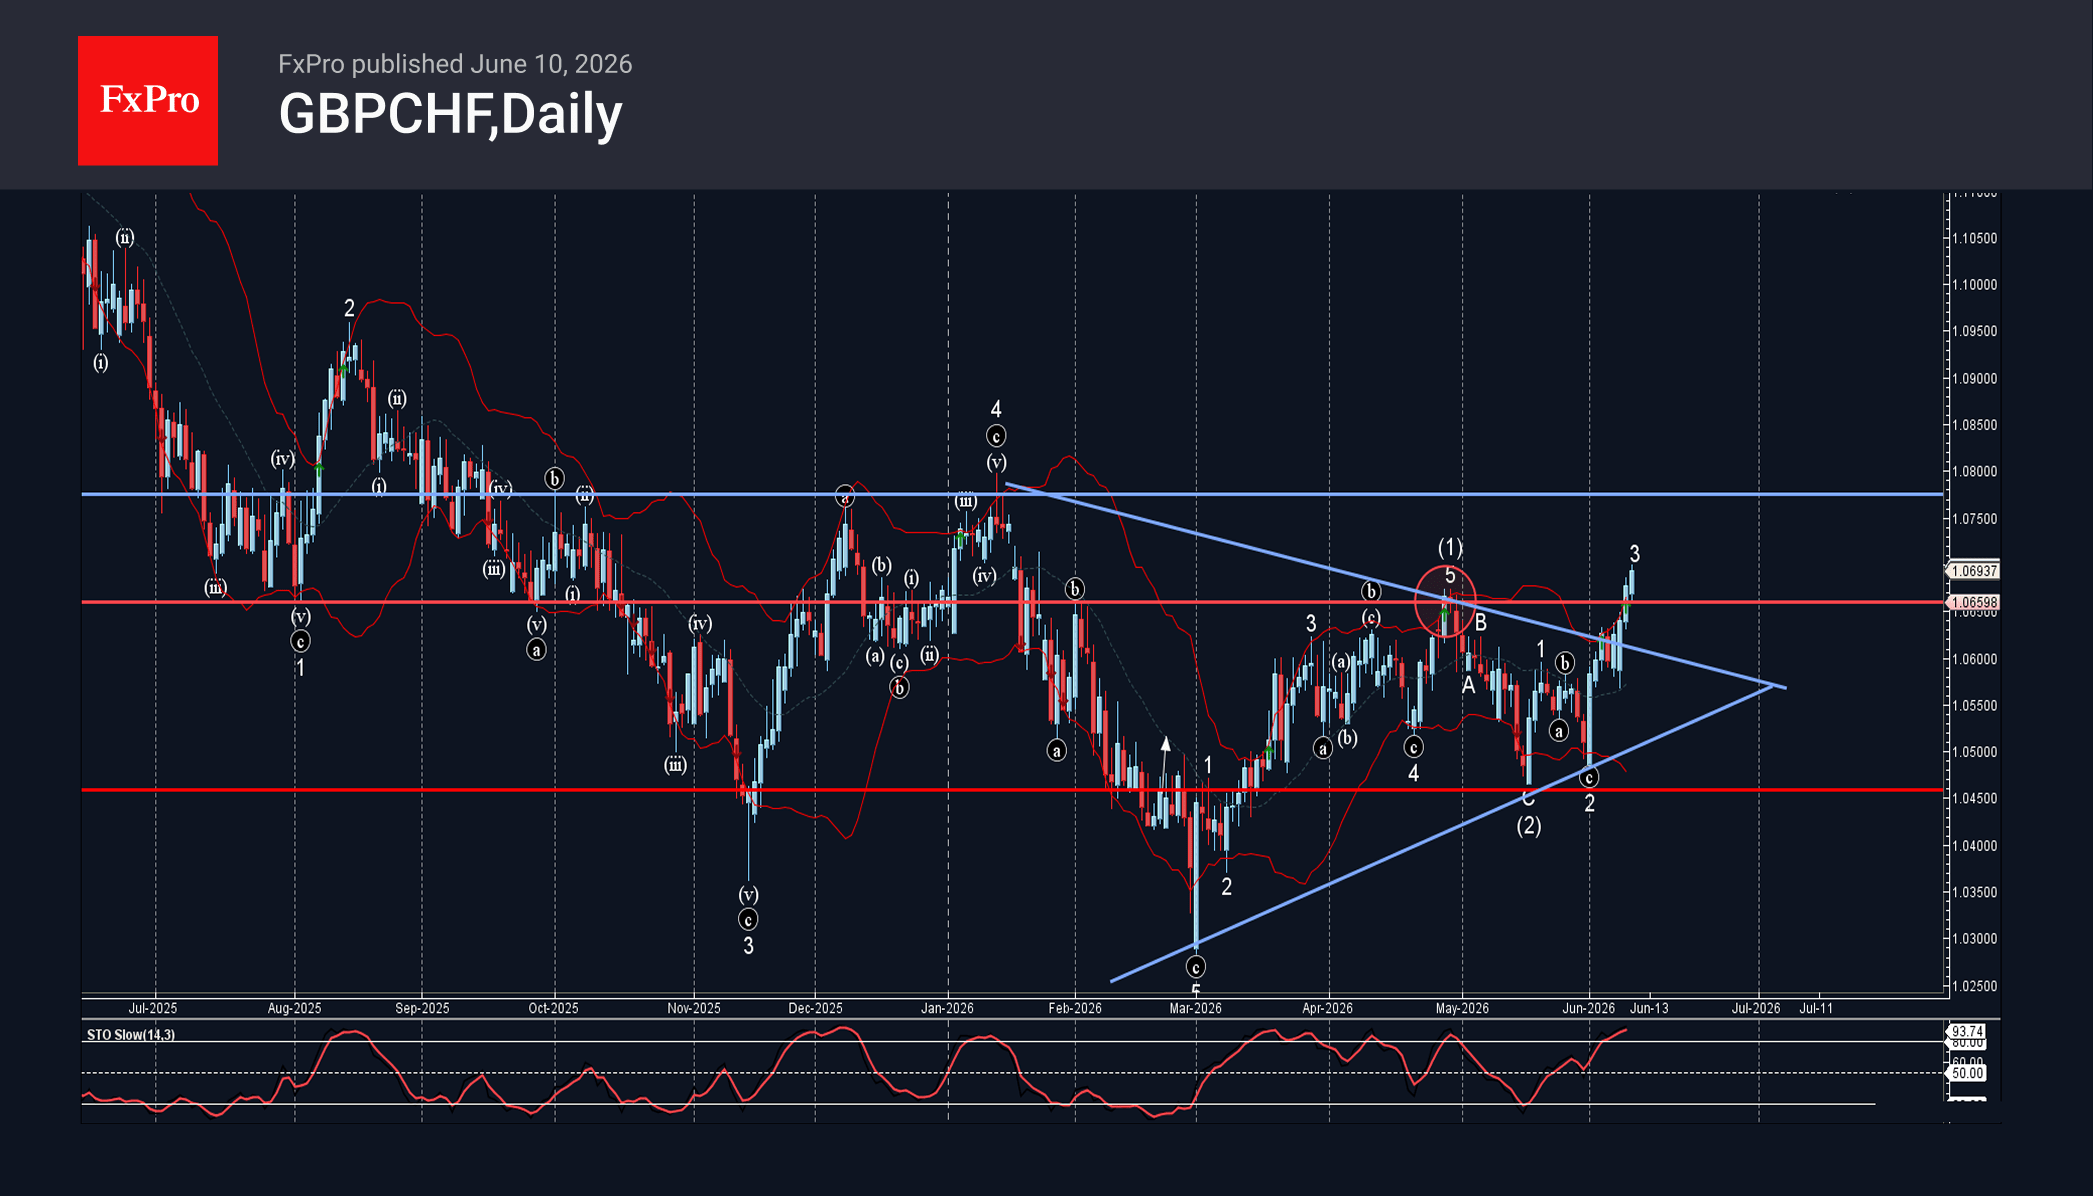
GBPCHF Wave Analysis
GBPCHF: ⬆️ Buy
– GBPCHF broke key resistance level 1.0660
– Likely to rise to resistance level 1.0775
GBPCHF currency pair recently broke above the key resistance level 1.0660 (which stopped the previous impulse wave (1) at the end of April).
The breakout of the resistance level 1.0660 was followed by the breakout of the daily Triangle from January.
Given the strong Swiss Franc sales seen today, GBPCHF currency pair can be expected to rise to the next resistance level 1.0775, which has been reversing the price from October.
Eco Data 6/11/26
| GMT | Ccy | Events | Act | Cons | Prev | Rev |
|---|---|---|---|---|---|---|
| 23:01 | GBP | RICS Housing Price Balance May | -35% | -32% | -34% | -35% |
| 23:50 | JPY | BSI Large Manufacturing Q2 | -1.8 | 4.2 | 3.8 | |
| 01:00 | AUD | Consumer Inflation Expectations Jun | 5.50% | 5.60% | ||
| 12:15 | EUR | ECB Deposit Rate | 2.25% | 2.25% | 2.00% | |
| 12:15 | EUR | ECB Main Refinancing Rate | 2.40% | 2.40% | 2.15% | |
| 12:15 | EUR | ECB Monetary Policy Statement | ||||
| 12:30 | CAD | Building Permits M/M Apr | -7.60% | -3.70% | 10.30% | 10.60% |
| 12:30 | USD | Initial Jobless Claims (Jun 5) | 229K | 225K | 225K | |
| 12:30 | USD | PPI M/M May | 1.10% | 0.70% | 1.40% | 1.10% |
| 12:30 | USD | PPI Y/Y May | 6.50% | 6.40% | 6.00% | 5.70% |
| 12:30 | USD | PPI Core M/M May | 0.40% | 0.50% | 1.00% | 0.70% |
| 12:30 | USD | PPI Core Y/Y May | 4.90% | 5.40% | 5.20% | 4.90% |
| 12:45 | EUR | ECB Press Conference | ||||
| 14:30 | USD | Natural Gas Storage (Jun 5) | 108B | 101B | 95B |
| 23:01 | GBP |
| RICS Housing Price Balance May | |
| Actual | -35% |
| Consensus | -32% |
| Previous | -34% |
| Revised | -35% |
| 23:50 | JPY |
| BSI Large Manufacturing Q2 | |
| Actual | -1.8 |
| Consensus | 4.2 |
| Previous | 3.8 |
| 01:00 | AUD |
| Consumer Inflation Expectations Jun | |
| Actual | 5.50% |
| Consensus | |
| Previous | 5.60% |
| 12:15 | EUR |
| ECB Deposit Rate | |
| Actual | 2.25% |
| Consensus | 2.25% |
| Previous | 2.00% |
| 12:15 | EUR |
| ECB Main Refinancing Rate | |
| Actual | 2.40% |
| Consensus | 2.40% |
| Previous | 2.15% |
| 12:15 | EUR |
| ECB Monetary Policy Statement | |
| Actual | |
| Consensus | |
| Previous | |
| 12:30 | CAD |
| Building Permits M/M Apr | |
| Actual | -7.60% |
| Consensus | -3.70% |
| Previous | 10.30% |
| Revised | 10.60% |
| 12:30 | USD |
| Initial Jobless Claims (Jun 5) | |
| Actual | 229K |
| Consensus | 225K |
| Previous | 225K |
| 12:30 | USD |
| PPI M/M May | |
| Actual | 1.10% |
| Consensus | 0.70% |
| Previous | 1.40% |
| Revised | 1.10% |
| 12:30 | USD |
| PPI Y/Y May | |
| Actual | 6.50% |
| Consensus | 6.40% |
| Previous | 6.00% |
| Revised | 5.70% |
| 12:30 | USD |
| PPI Core M/M May | |
| Actual | 0.40% |
| Consensus | 0.50% |
| Previous | 1.00% |
| Revised | 0.70% |
| 12:30 | USD |
| PPI Core Y/Y May | |
| Actual | 4.90% |
| Consensus | 5.40% |
| Previous | 5.20% |
| Revised | 4.90% |
| 12:45 | EUR |
| ECB Press Conference | |
| Actual | |
| Consensus | |
| Previous | |
| 14:30 | USD |
| Natural Gas Storage (Jun 5) | |
| Actual | 108B |
| Consensus | 101B |
| Previous | 95B |
Bank of Canada Holds, Signals Balancing Risks from Oil Prices and Trade
- The Bank of Canada (BoC) held its policy rate at 2.25%, noting that maintaining the current setting “balances” the competing risks of economic weakness and rising inflation.
- The opening statement pointed to the weaker growth backdrop. It noted that “GDP edged down 0.1% in the first quarter, weaker than expected at the time of the April Report,” with the economy expected to “remain in excess supply” despite an anticipated near-term rebound, as higher energy prices, global conflict, and trade uncertainty weigh on activity.
- The statement also noted that oil prices have been higher than assumed in April's Monetary Policy Report, likely nudging up the inflation outlook. However, it also noted that "there has been limited evidence of broad-based pass-through" from energy prices to inflation and that core inflation measures "have moved down to around 2% and the share of CPI components growing above 3% is close to its historical average".
- Importantly, in the Opening Statement the Bank emphasized policy flexibility, noting that “uncertainty is unusually elevated, and the risks could shift,” with Governing Council prepared to adjust as needed. It stated it could cut rates if U.S. trade restrictions weaken growth or potentially delivering “consecutive increases” if Middle East-related energy shocks lead to persistent, broad-based inflation.
Key Implications
- Another meeting, another hold. Growth to start the year came in materially lower than the Bank of Canada's last projections, showcasing just how much slack there is in the economy. This slack is expected to continue to help offset the inflation pressures coming from higher energy costs. Whether it is sufficient to prevent broader pass-through to core prices is likely to depend on just how long oil prices stay elevated.
- The outlook remains highly uncertain. Oil prices have come off their peaks but are still high as uncertainty about the course of the conflict in the Middle East persists. On the other hand, negotiations around the CUSMA review between Canada and the U.S. have yet to get started, casting a pall over trade prospects. Recent data suggest a second quarter bounce-back in growth, but one that is insufficient to absorb all of the excess capacity in the economy. Given the competing forces on inflation, we expect the Bank of Canada to stay on hold through the balance of the year.
Sunset Market Commentary
Markets
US May CPI inflation printed near consensus. Headline CPI rose by 0.5% M/M with the annual figure breaching the 4% mark for the first time since April 2023 (4.2% from 3.8%). Core inflation increased by 0.2% M/M (vs 0.3% consensus) while picking up from 2.8% Y/Y to 2.9% (highest since September of last year). Details showed energy prices rising by 3.9% M/M (23.5% Y/Y) with gasoline being the main culprit (+7% M/M & +40.5% Y/Y). Food price growth slowed to 0.2% M/M (3.1% Y/Y). Prices for services excluding energy increased by 0.3% M/M (3.4% Y/Y), primarily driven by shelter costs. Markets look at today’s numbers coming from last week’s strong growth/labour market data. The latter prompted further hawkish repositioning when it comes to this year’s Fed policy. From a momentum point of view, the lack of upward surprise today suggests that the current pricing should do going into next week’s FOMC meeting. A more neutral Fed stance is generally expected given the minor easing bias which still exists in the statement. Question remains whether new projections, both GDP/CPI and dot plot (if still released), make a stronger case for Fed action in coming months. Anyway, US Treasuries showcased some minor volatility around the time of the release with a minor strengthening bias. Daily changes on the US yield curve currently range between -0.4 bps (2-yr) and +1.3 bps (30-yr). EUR/USD oscillated between 1.1540 and 1.1560, but tries to regain some ground as the German/European yield curve bear flattens going into tomorrow’s ECB meeting. Yields add up to 3.5 bps at the front end of the curve. As the stalemate between the US and Iran drags on, the case builds for back-to-back action by the ECB. Recent fighting back and forth by both parties suggests that an interim deal isn’t in the pipe. The length of the conflict and energy shock suggests that applying just one 25 bps move looks silly and uncredible from a central bank point of view. Analysts point to the fact that significantly lower Chinese import volumes are currently the only thing standing in the way of oil prices returning north of $100/b.
News & Views
KBC Economics has revised up its forecast for the Czech policy rate from a status quo at 3.5% to two rate hikes towards 4% this year. A first move could come as soon as June. The revision is rooted in the extended disruption in the Strait of Hormuz, which is gradually feeding into higher energy prices. Natural gas in particular is a thorny issue with European storage levels at historically low levels (40%). Large household energy price resets at the start of next year and second-round effects (eg. food prices) loom with their impact peaking early 2027. Inflation could approach 4% by then. The underlying resilience of the Czech economy, underpinned by robust domestic demand, is a second key argument for the revised CNB outlook. The growth backdrop is accompanied by rapid expansion in investment lending and strong wage growth. KBC Economics considers inflation risks to have risen enough to justify a pre-emptive tightening response with a potential June move followed by another one in either August or November.
Norwegian headline inflation eased from 3.4% to 3.1% but the underlying gauge unexpectedly quickened to 3.4% - the joint-fastest since February 2025. The latter topped both analysts’ and the central bank’s own forecast. It cements another rate hike by the Norges Bank after having already raised the policy rate by 25 bps to 4.25% in May. The official March forecasts put the policy rate between 4.25% and 4.5% by the end of the year. Money markets assume the Norges Bank to pull the trigger again in September (95%). The policy meeting for next week is given an outside chance of just 25%. But then again, prior to the May gathering the market implied probability stood at no more than 50% as well. The Norwegian central bank’s Regional Network Survey is up for release tomorrow, serving as the final important input for next week’s policy meeting. The Norwegian krone after the CPI release recovered from a two-month low just north of EUR/NOK 11 to currently trade around 10.94.
BoC Holds Rates, Sees Energy Shock But Limited Inflation Pass-Through
The Bank of Canada left its overnight rate unchanged at 2.25% as expected. The accompanying statement revealed a central bank that is far less concerned about the recent rise in inflation than the headline numbers might suggest. While policymakers acknowledged that CPI inflation rose to 2.8% and is likely to hover around 3% in the near term, they repeatedly emphasized that higher energy prices are doing most of the work. In particular, BoC stressed that there has been "limited evidence of broad-based pass-through of higher energy prices to other consumer prices."
The Bank's assessment of the domestic economy remained cautious. It noted that first-quarter GDP contracted by 0.1%, housing activity declined, business investment remained weak and exports fell. While employment increased in May, policymakers pointed out that employment has been "little changed since the start of the year" and that the economy is expected to remain in "excess supply" even as growth resumes in the second quarter. Taken together, these comments suggest BoC still sees insufficient domestic demand pressure to justify tighter monetary policy.
That explains why policymakers are prepared to look through the current inflation surge. BoC explicitly stated that it is "continuing to look through the war's near-term impact on headline inflation" even though oil prices are now roughly USD 10 per barrel above the assumptions in its April forecasts. At the same time, the Bank delivered a warning that it "will not let higher energy prices become persistent inflation."
The message that BoC believes today's inflation problem is largely imported through energy markets rather than generated by the Canadian economy itself, but it remains ready to act if those pressures begin spreading more broadly.
Bank of Canada maintains policy rate at 2¼%
The Bank of Canada today held its target for the overnight rate at 2.25%, with the Bank Rate at 2.5% and the deposit rate at 2.20%.
The conflict in the Middle East is now in its fourth month. The resulting increases in energy prices and disruptions in global supply chains are weighing on global economic growth and pushing up inflation. At the same time, the US administration continues to propose new tariffs and trade policy uncertainty remains elevated.
In the United States, economic growth remains solid, supported by consumption and AI‑related investment. In the euro area, growth is subdued, with higher energy prices weighing on activity. China’s economic growth continues to be supported by strong exports.
Canadian financial conditions have loosened since the April Monetary Policy Report. Global equity markets have been buoyant and bond yields remain volatile. The Canadian dollar has weakened against the US dollar and other currencies.
In Canada, GDP edged down by 0.1% in the first quarter, weaker than expected at the time of the April MPR. Consumer spending grew 1.4% but government spending unexpectedly declined. Housing activity also declined and business investment remained weak. Exports fell while imports rose strongly as inventories were rebuilt. Employment was up in May, but looking through monthly volatility, employment in Canada is little changed since the start of the year. The unemployment rate continues to fluctuate in the 6 ½%-7% range with the most recent reading at 6.6% in May.
Recent data suggests that growth will resume in the second quarter but, even with some rebound, the economy is expected to remain in excess supply.
As expected, CPI inflation rose in April, reaching 2.8%. The increase reflects energy prices, both higher oil prices and the impact of the elimination of the consumer carbon tax falling out of the 12-month rate of inflation. So far, there has been limited evidence of broad-based pass-through of higher energy prices to other consumer prices. Measures of core inflation have moved down to around 2% and the share of CPI components growing above 3% is close to its historical average. Food price inflation moderated but remains high, and shelter inflation continued to slow. With global oil prices still elevated—roughly $10 a barrel above our April MPR assumptions—total inflation is expected to hover around 3% in the near term before easing gradually towards 2%.
Against this overall backdrop, Governing Council decided to maintain the policy rate at 2.25%. Economic activity in Canada has been weak and uncertainty about US trade policy persists. The conflict in the Middle East is ongoing and oil prices remain elevated. Governing Council is continuing to look through the war’s near-term impact on headline inflation, but will not let higher energy prices become persistent inflation. As the outlook evolves, we stand ready to respond as needed. The Bank is committed to maintaining Canadians’ confidence in price stability through this period of global upheaval.
Information note
The next scheduled date for announcing the overnight rate target is July 15, 2026. The Bank’s next MPR will be released at the same time.