
Sample Category Title
Euro Stabilises After Sell-Off as Markets Await US CPI and Bank of Canada Meeting
The euro is showing signs of a modest recovery following a sharp decline triggered by a strong US employment report and increased demand for safe-haven assets amid escalating geopolitical tensions in the Middle East. Robust Nonfarm Payrolls data confirmed the resilience of the US labour market, allowing the dollar to strengthen against most major peers and reinforcing expectations that the Federal Reserve will maintain a restrictive policy stance.
Investor attention today will be focused on the release of US inflation data. According to forecasts, annual consumer price growth may accelerate to 4.2% from 3.8% previously, while core inflation is expected to rise to 2.9% from 2.8%. Should the figures exceed expectations, markets may once again reassess the outlook for Federal Reserve rate cuts, providing additional support for the US dollar.
Another key event will be the Bank of Canada policy meeting. The central bank is widely expected to leave its benchmark interest rate unchanged at 2.25%, although market participants will be paying close attention to the accompanying statement and policymakers' comments regarding the future path of monetary policy. Any signals pointing towards further easing could weigh on the Canadian dollar and support gains in EUR/CAD.
EUR/USD
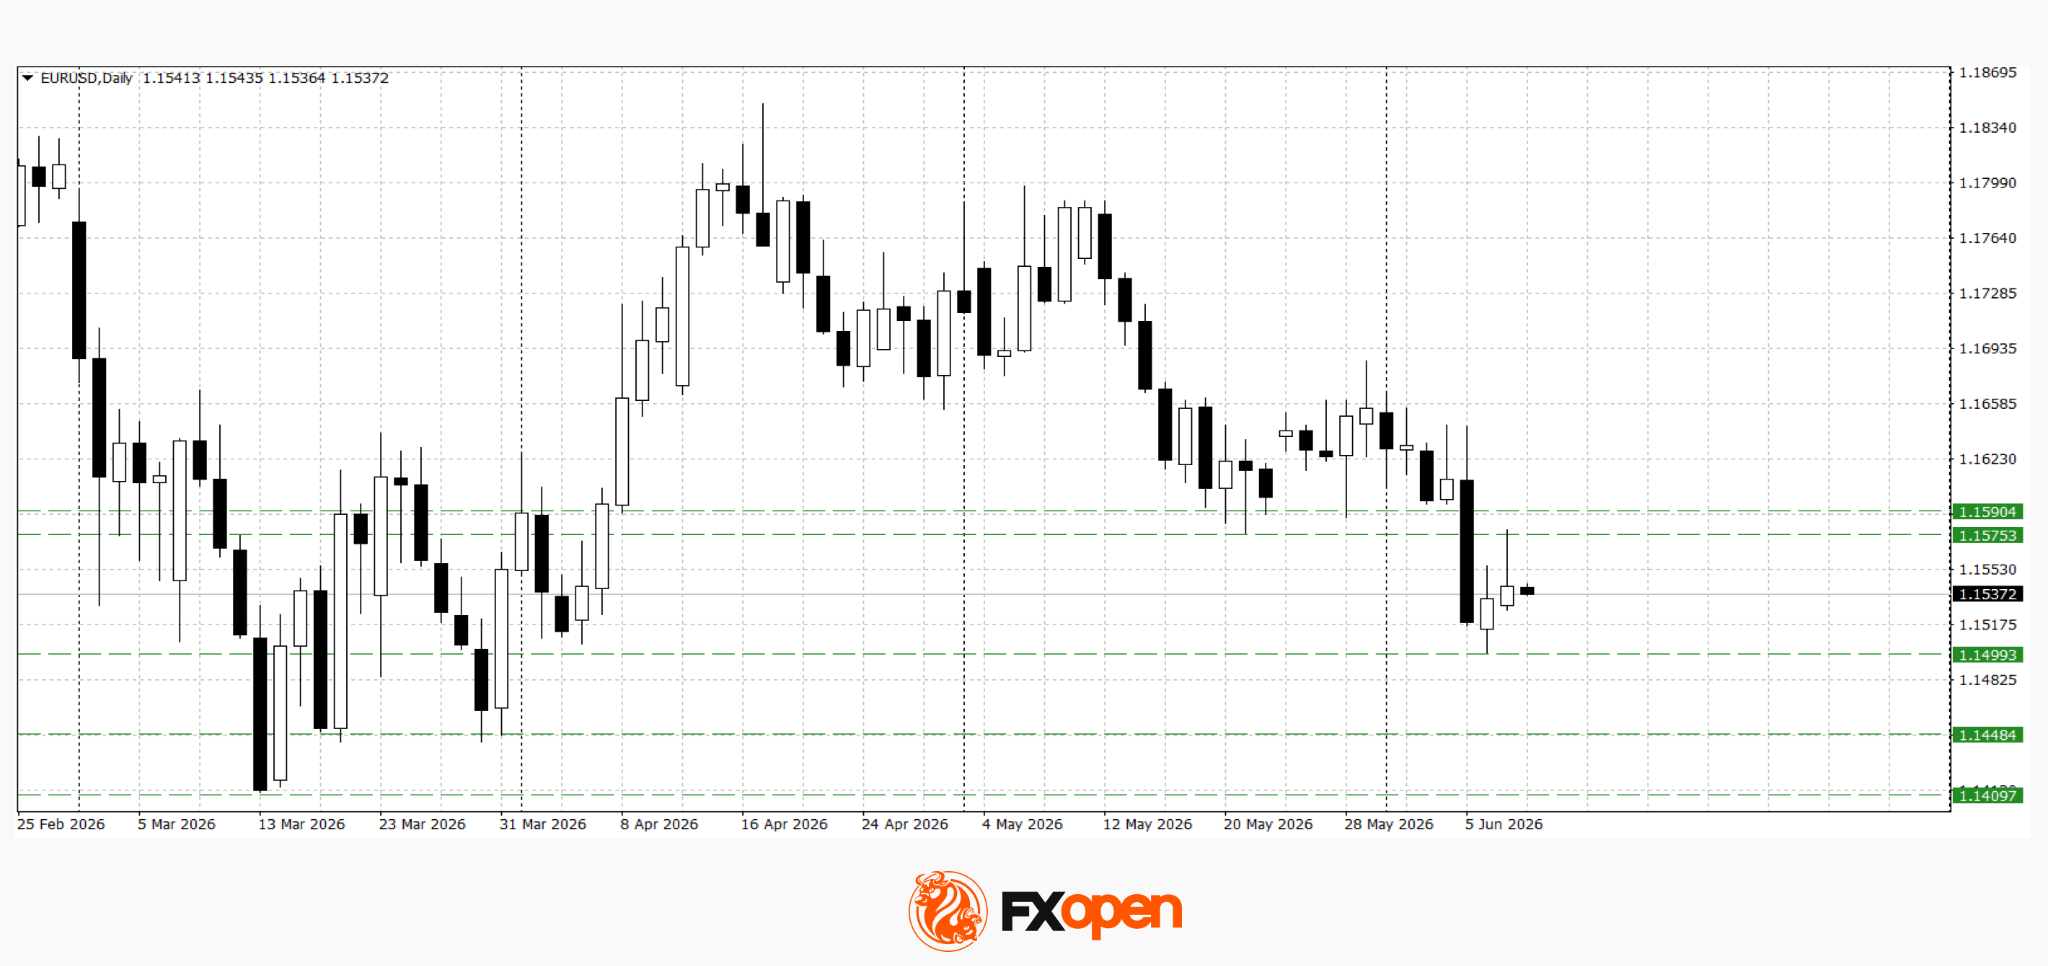
After breaking below the key support level at 1.1580 last week, EUR/USD buyers managed to push the pair back towards this area. Technical analysis suggests the pair may retest support near 1.1500. A break below this level followed by sustained trading underneath it could trigger a fresh bearish impulse, with initial downside targets in the 1.1400–1.1440 region. The bearish scenario would be invalidated by a decisive move back above 1.1580.
Key events for EUR/USD:
- Today at 12:30 (GMT+3): German 10-year government bond auction;
- Today at 15:30 (GMT+3): US Consumer Price Index (CPI);
- Tomorrow at 15:00 (GMT+3): Germany's seasonally unadjusted current account balance.
EUR/CAD
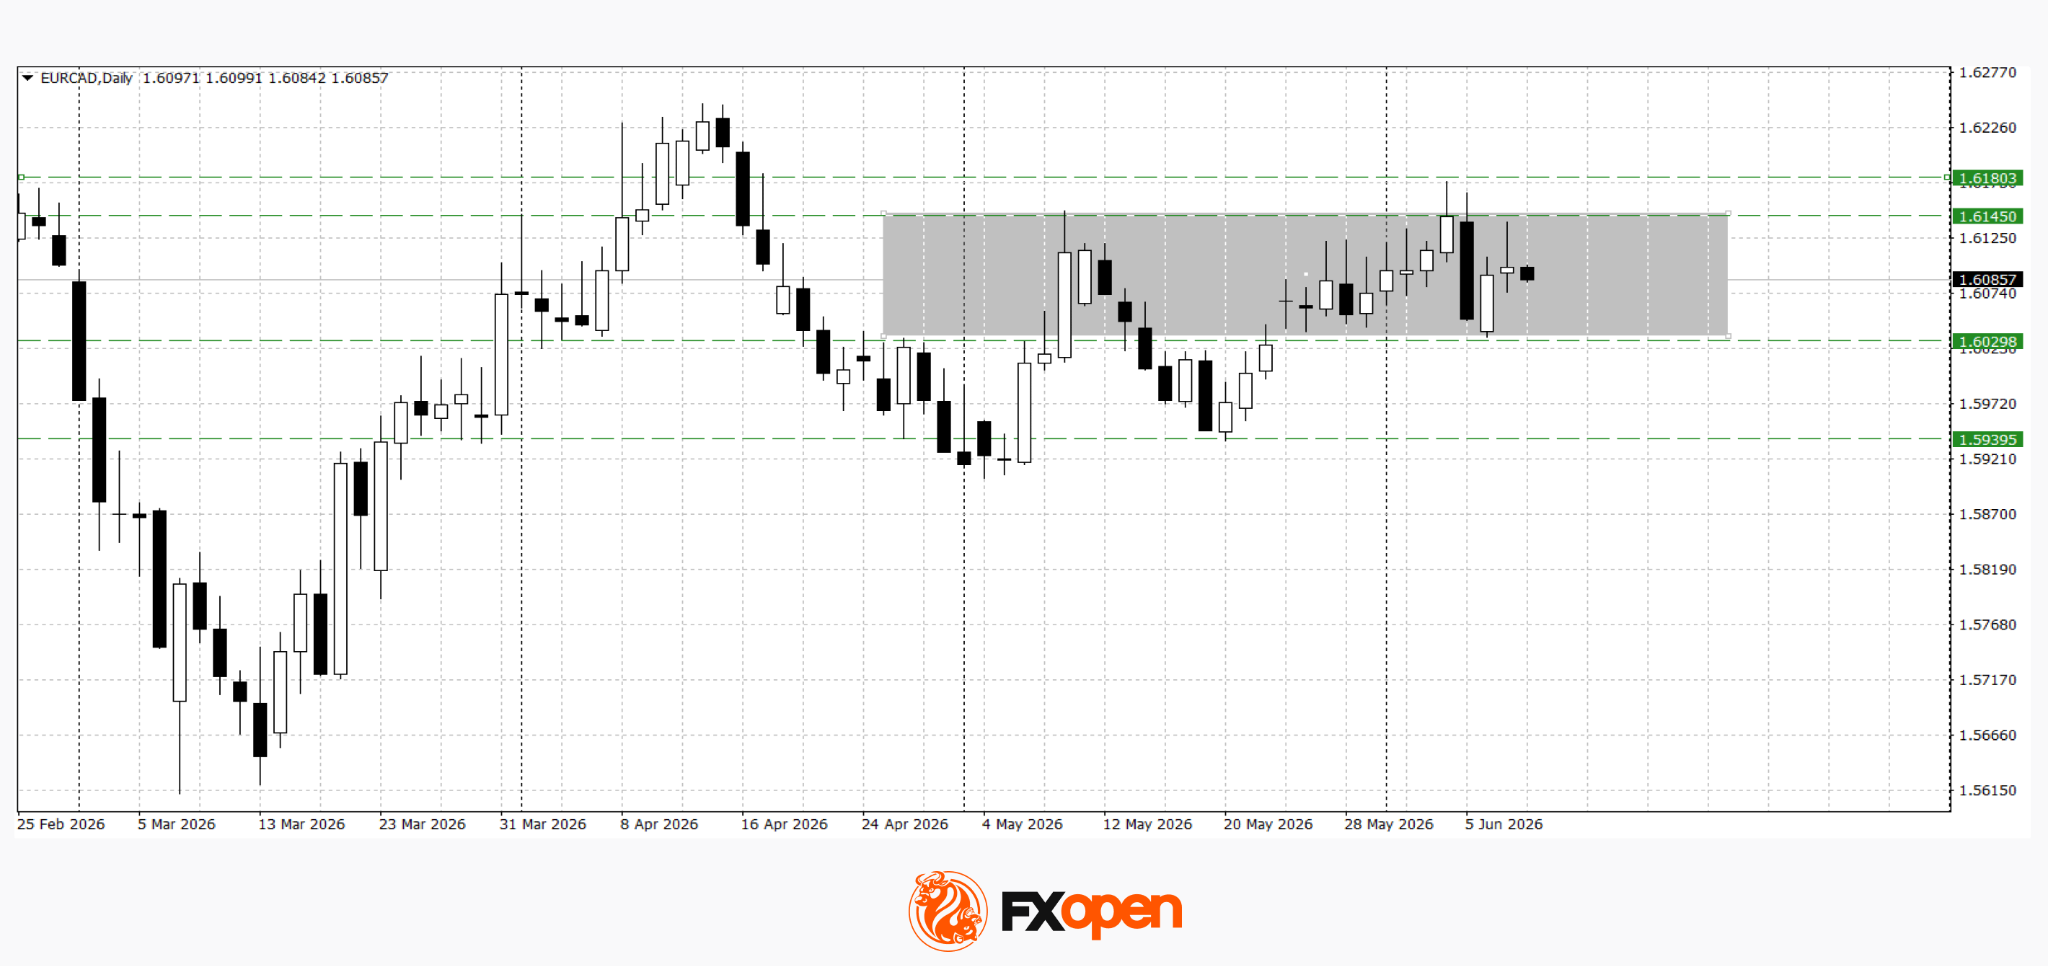
EUR/CAD is also undergoing a corrective recovery following its previous decline, although further direction will largely depend on the outcome of the Bank of Canada meeting and the market's reaction to US inflation data. Ahead of these releases, traders are likely to remain cautious, potentially encouraging consolidation around current levels.
Technical analysis points to range-bound trading within the 1.6030–1.6150 corridor. Price behaviour near these boundaries over the coming sessions may provide clearer signals regarding the pair's next directional move.
Key events for EUR/CAD:
- Today at 16:45 (GMT+3): Bank of Canada interest rate decision;
- Today at 17:30 (GMT+3): US crude oil inventories;
- Today at 17:30 (GMT+3): Bank of Canada press conference.
Trade over 50 forex markets 24 hours a day with FXOpen. Take advantage of low commissions, deep liquidity, and spreads from 0.0 pips (additional fees may apply). Open your FXOpen account now or learn more about trading forex with FXOpen.
This article represents the opinion of the Companies operating under the FXOpen brand only. It is not to be construed as an offer, solicitation, or recommendation with respect to products and services provided by the Companies operating under the FXOpen brand, nor is it to be considered financial advice.
Sunrise Market Commentary
Markets
Yesterday’s global market price action lacked a clear, unique narrative resulting in erratic-like trading throughout the session. Headlines on the conflict in the Middle-East/Iran again were far from consistent. President Trump announcing an end to (escalating) hostilities between Israel and Iran and hinting at a deal over the next days initially eased tensions. However, later in US dealings, headlines on the US responding to a reported Iran attack on a US helicopter once again illustrated the fragility of the ceasefire and persistent nervousness (and probably) mutual distrust on the way to a deal. This, together with lingering tech/AI uncertainty weighed on US equities. US indices closed mixed (Dow +0.17%, Nasdaq -0.97%) admittedly off the intraday lows, but the picture still looks fragile. (Nasdaq struggling not the fall below the 25.700 support area.) Interestingly, the headlines again had only limited impact on the oil price (Brent close near $91.5 p/b). In this context, the tentative risk-off also had no negative impact on bond markets. US yields even eased between 4.6 bps (5- & 10-y) and 3.9 bps (30-y). A $58 bln 3-y Treasury auction was ok, but with limited impact on the daily market dynamics. US eco data mostly were second tier (weak NFIB small business confidence), but with only limited impact on yield markets as they looked forward to today’s US CPI data. German yields in a similar move declined between 3.8 bps (2-y) and 0.2 bps (30-y). A mixed story for the dollar as well. After setting an intra-day low early in US dealings, the headlines on the helicopter incident and building risk-off reverted intraday USD-losses. DXY closed marginally lower in a daily perspective near 99.9. EUR/USD gained marginally, but off the intraday highs (close 1.1543). The yen struggles with USD/JPY holding a tight range north of USD/JPY 160.
Major Asian equity indices (Japan, China, Japan and South Korea) mostly trade in negative territory, but there are exceptions (Australia, India,…). US yields gain 1-2 bps. The dollar also eases slightly (DXY 99.9, EUR/USD 1.155). Aside from (often noisy) headlines on the developments in the Iran conflict, the market focus is on US May CPI inflation data. Consensus sees headline inflation at 0.5% M/M and 4.2 Y/Y and core at 0.3% M/M and 2.9% Y/Y, in line with our KBC model nowcast. A combination of last week’s strong US activity data and inflation moving even further away from the Fed inflation target probably will keep the debate on Fed tightening alive. In this context, a big negative surprise is probably needed to backtrack on the rise in US yields. In theory, this also should favour the dollar, especially if it would coincide with a more fragile risk sentiment (US triggering a global tightening of financial conditions?) Later today, a $39 bln 10-y US Treasury auction will be an interesting pointer for investor appetite for US bond with longer maturities.
News & Views
Chinese inflation came in below expectations in May with headline price pressures matching April’s 1.2% instead of accelerating to 1.3%. A core gauge decelerated to 1.1% from 1.2%. It marks a stark contrast with rising producer price inflation. May PPI shot up from 2.8% to 3.9%, the quickest since July 2022. Details showed intensifying pressures in mining, raw materials and manufacturing (i.e. the early stages of the supply chain), revealing the impact coming from the Iran war. But weak domestic demand is preventing companies from pass-through to the end-consumer, resulting in a muted CPI print. The latter was also heavily supported by gasoline prices (up 23.5% y/y) and travel prices (4.3%). Bloomberg calculated that without those, May CPI would have risen by just 0.5%. Food prices fell 1.7% and services inflation eased from 0.9% to 0.8%.
The Energy Information Administration (EIA) is projecting further record in US power consumption in 2026 and 2027 after already hitting its second straight annual record high in 2025. The surge is in large part driven by data centers dedicated to AI and cryptocurrency, the agency said. The EIA expects that the electricity demand increase in the commercial sector will cause it to outpace residential demand in 2026 in what would be the first time ever. The EIA also said that the share of power generation from coal will slide from 17% last year to 16% and 15% in 2026 and 2027. Natural gas’ share is expected to hold at 40% in 2026-2027, the same as in 2025. Renewable energy generation meanwhile will rise from 24% last year to 27% in 2027. Nuclear power fills the remaining gap (18%).
Why US CPI and Pce Inflation Figures Diverge
US PCE inflation has outstripped CPI inflation in recent months (in contrast to historical trends). This was especially the case for core inflation. The divergence is caused by important weight differences between PCE and CPI inflation. As CPI measures price changes directly paid for by consumers, housing and vehicle prices have a higher weight in CPI inflation. In contrast to CPI inflation, PCE inflation is broader and measures price changes of goods and services consumed (though not necessarily directly paid) by consumers. Items such as medical care services, financial services and software thus have higher weights. Especially the latter has seen high price rises in recent months. Looking ahead, core CPI & PCE inflation could continue to diverge as rent inflation is expected to moderate while software prices could accelerate further.
How high is US inflation? The answer to this question depends on who you ask. Consumers and market participants will typically refer to CPI inflation figures. This inflation gauge is used for inflation-linked contracts and for cost-of-living adjustment to reprice a.o. wages and social security adjustments. In contrast, policy makers, in particular the Federal Reserve, look at PCE inflation. To fulfill one part of its dual mandate, i.e. the price stability mandate, the Fed aims for PCE inflation to be around 2% over the longer run.
Methodological differences
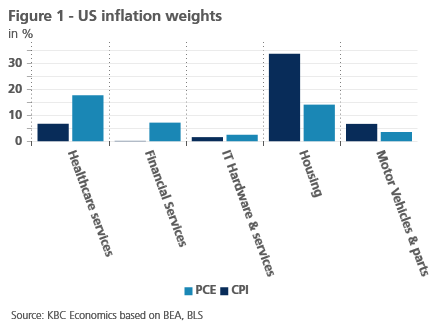
There are important methodological differences between PCE and CPI inflation. CPI inflation measures average changes in prices directly paid by urban consumers. In contrast, PCE inflation measures price changes of goods and services consumed (though not necessarily directly paid) by consumers (both urban and rural ones). That is an important difference and results in important weight differences between PCE and CPI. Healthcare, which is often paid for by employers or by the government, has a much higher weight in PCE than CPI (see figure 1). The same is true for financial services, where CPI only includes out-of-pocket fees and commissions, while PCE also includes imputed costs for financial intermediation. Software also has a higher weight in the PCE, as many software subscriptions used by consumers are paid for by employers (e.g. Microsoft 365 subscriptions). In contrast, in the CPI index, goods and services that are directly paid for by consumers (e.g. rent and automobiles) carry a higher weight.
It is also important to note that the CPI calculations are mostly based on household surveys and retail price sampling (i.e. the Consumer Expenditure Survey), while the PCE relies more on business surveys and administrative data. This causes some underweights in the CPI basket as consumers frequently underestimate what they pay for certain items (e.g. software subscriptions).
Another important methodological difference is that CPI weights are only adjusted annually, while PCE weights are adjusted dynamically (based on consumer spending data) and thus change at every release. When the price of an item rises fast, customers tend to spend less on it, which lowers its weight in their spending basket. Given its dynamic weight adjustments, the PCE better captures this effect.
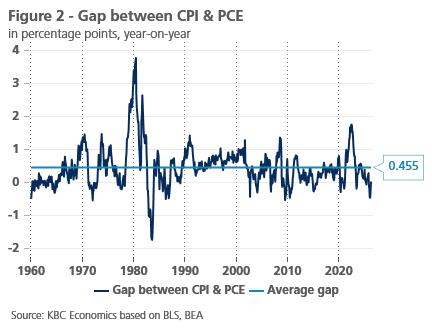
Partly because of this reason, PCE inflation tends to be lower than CPI inflation historically (see figure 2). Another reason is the rapid rise in housing costs, which far outstripped overall inflation in recent decades.
PCE outstripped CPI recently
Yet more recently, PCE inflation outstripped CPI inflation (see figure 3). In February, PCE inflation was 0.46 percentage point higher than CPI inflation. That gap disappeared in the next two months as both CPI & PCE inflation reached 3.8% in April. However, core PCE (at 3.3%) remained far higher than core CPI (at 2.7%). Indeed, the main reason why headline CPI caught up with headline PCE inflation was the sharp rise in energy inflation (which has a higher weight in CPI inflation).
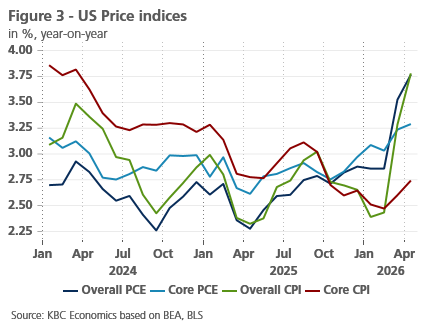
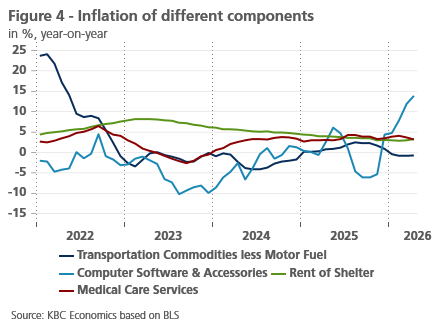
So why is core PCE so much higher? The explanation again lies in weight differences. Some components with higher weight in PCE have accelerated recently. Software prices in particular have accelerated significantly, because of the current AI boom. In contrast, vehicle prices and rent (whose CPI weight is higher) have decelerated in recent years (see figure 4).
Will the divergence last?
Whether PCE inflation continues to outstrip CPI inflation is highly dependent on the war in Iran. Were the conflict to end soon (as indicated by oil futures), we can expect energy prices to drop. This would push CPI inflation down faster than PCE inflation. A longer closure of the Strait would have the opposite effect.
For core inflation, we can expect the divergence to last in the coming months. The AI boom seems to continue unabated, pushing up prices for IT-related items. Meanwhile, shelter inflation (by far the largest CPI component) is likely to moderate further in the months ahead as indicated by market rents. Higher vehicle prices (as indicated by forward-looking indicators) could provide some compensation, but are unlikely to close the gap.
Inflation Releases to Take Centre Stage as Central Bank Meetings Loom
In focus today
Focus today will be on inflation releases from the US, Norway and Denmark. These figures will set the tone ahead of the ECB monetary policy meeting tomorrow, as well as the Norges Bank and Fed decisions next week.
In the US, we forecast headline inflation at 0.6% m/m SA (4.3% y/y), slightly above consensus, and core at 0.3% m/m SA (2.9% y/y), in line with consensus. After the recent repricing higher in Treasury yields on the back of strong labour market data, an upside surprise could further strengthen the case for a Fed tightening bias.
In Norway, we expect core inflation to rise moderately to 3.3% y/y in May (April: 3.2%, cons.: 3.2%), in line with the Norges Bank's March MPR-estimate. If our forecast is correct, it should be completely neutral for the market expectations. In light of Norges Bank's determination to bring down inflation and inflation expectations, we must assume that the threshold for reacting to upside surprises is much lower than on the downside.
In Denmark, we expect an increase in May inflation figures to 1.9% y/y from 1.4% y/y in April, driven mainly by higher electricity prices and normalisation of summer house inflation. We will watch food prices closely after what appears to have been an extensive retail price war in May, and we have pencilled in flat food prices in a month that usually sees increases.
In Sweden, several interesting data points are released at 08:00 CET today. The April GDP indicator follows a strong March (+1.9% m/m), after weak January and February prints (-0.4% and -0.6% m/m). Household consumption is particularly important given key role households are expected to play in the Swedish recovery. Based on the historical relationship with retail sales, household consumption is expected to have increased in April. We also receive industrial order data but, given recent volatility, we place greater weight on the PVI production data also published today.
In line with consensus and market pricing, we expect Bank of Canada to leave policy rates unchanged at the interim monetary policy decision today. We expect a relatively neutral, wait-and-see stance amid the central bank facing continued uncertainty with regard to US-trade relations and the war in Iran at a point in time when domestic releases have painted a mildly disinflationary picture for the domestic economy.
Economic and market news
What happened overnight
In China, PPI increased 3.9% y/y in May (cons.: 3.8% y/y, April: 2.8%), marking a third consecutive monthly increase to its highest level since July 2022. The increase in PPI underline that China is becoming an inflationary force after three years of exporting deflation. CPI came in at 1.2% y/y (cons.: 1.3%, April: 1.2%), driven by rising gasoline and services prices. Food prices continued to drag, falling 1.7% y/y.
In the Israel-Iran war, Iran's Revolutionary Guards struck a US base in Jordan and 21 other Gulf targets in retaliation for US attacks near the Strait of Hormuz, which were themselves triggered by the alleged downing of a US helicopter. The escalation raises serious doubts over a peace deal and keep energy markets on edge.
What happened yesterday
In oil space, Brent crude briefly went below USD 90/bbl yesterday as US energy secretary Wright signalled that traffic through the strait of Hormuz was increasing. Oil prices later retraced to about USD 92/bbl and remain around this level this morning.
In Denmark, April foreign trade data showed total exports of goods and services rising 0.4% m/m SA (March: 8.6%), driven primarily by higher services exports. Imports fell slightly by 0.4% m/m SA (March: 4.0%), reflecting a drop in goods imports. Additionally, industrial production declined 1.1% in May, a sharp reversal from the revised 8.3% increase in April. Industrial production remains one of the more reliable indicators for GDP growth in Denmark.
In the US, the NFIB small business optimism index for May slipped to 95.3 (April: 95.9), the lowest level in more than a year. Firms reported rising uncertainty, with job openings and hiring plans falling notably to their lowest levels in six years.
Equities: Major equity indices were dragged lower yesterday, led by tech, which have had a rough spell since Friday down about 7%, despite the slight rebound on Monday. Global equities finished down 0.2%, having been almost 1.8% lower earlier in the day, in a significant roller-coaster session. Tech was the primary source of weakness, joined only by the energy sector, which was weighed down by lower oil prices. Asian markets traded lower overnight, with South Korea among the weakest performers. US equity futures are also pointing lower this morning.
FI and FX: Risk sentiment takes a hit as US and Iran conducts tit-for-tat escalation over the last 24 hours. Despite this, EUR/USD sits steady in the mid-1.15's and Brent crude edges closer to USD90/bbl. This morning brings interesting data releases out of both Norway and Sweden, with potential implications for the Scandi currencies. But the hottest release of the day is the US CPI, where we expect a slightly above-consensus print. Together with potential further escalation in the Middle East, this will likely set the today.
Silver (XAGUSD) Elliott Wave View: $61.02 Level Holds Key to Potential Bearish Extension
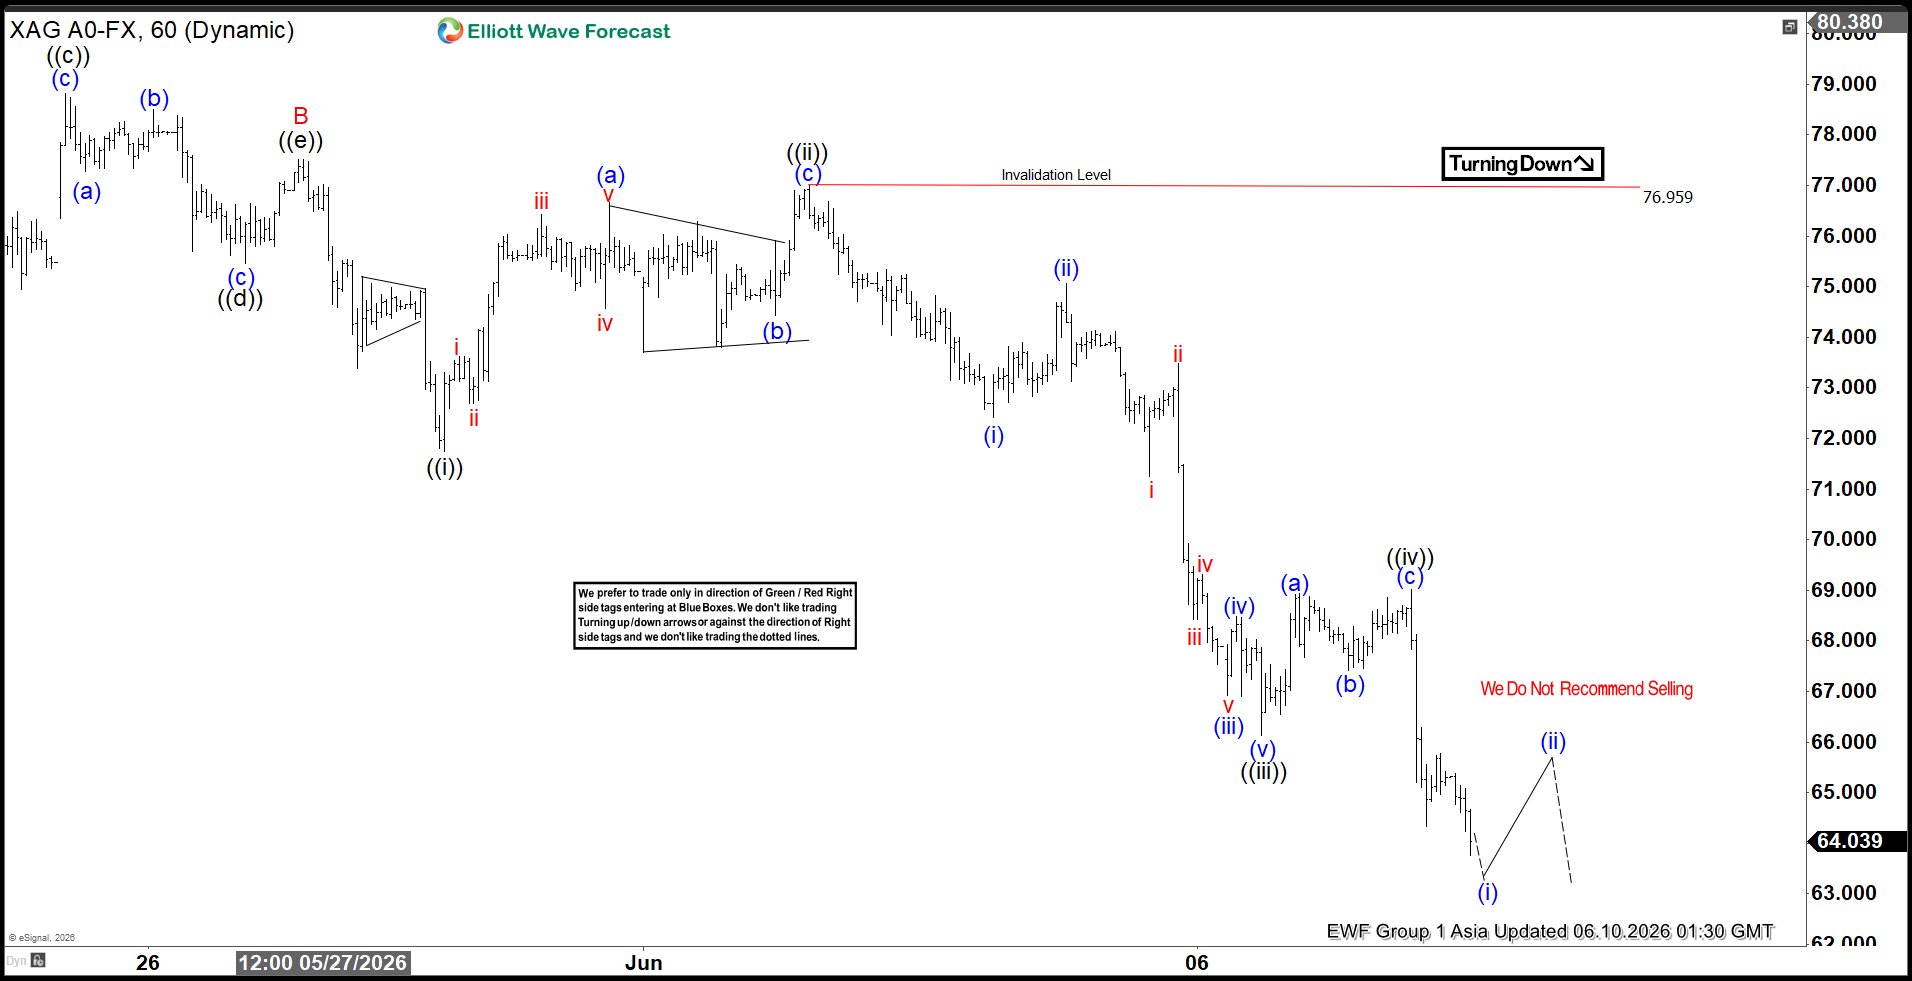
Silver (XAGUSD) is approaching a decisive test as price nears the March 23, 2026 low at $61.02. A break beneath this level could trigger a deeper decline, potentially extending toward the 100% measured move from the January 29, 2026 all‑time high. If the sequence unfolds without truncation, the projected target may reach as low as $38.70.
The decline from the March 2, 2026 high is developing as a double three corrective pattern. Wave ((W)) concluded at $61.02, while wave ((X)) terminated at $89.37. The subsequent wave ((Y)) is unfolding as another double three of lesser degree. From the peak of wave ((X)), wave A ended at $73.81, followed by a rally in wave B that reached $77.51. The market is now extending lower in wave C of (W), which is forming as a five‑wave impulse.
On the hourly chart, wave ((i)) of C ended at $71.75, while wave ((ii)) retraced higher to $77. Wave ((iii)) then drove price down to $66.13, and wave ((iv)) is proposed complete at $69.02. Near term, while price remains below $76.96, rallies are expected to fail in either three or seven swings. This structure suggests that silver retains considerable downside risk, with corrective rallies offering limited relief before the metal resumes lower.
Spot Silver (XAGUSD) 60-Minute Elliott Wave Chart
XAGUSD Elliott Wave Video:
https://www.youtube.com/watch?v=x6QIrOp6aBk
Asia Open: Tech Rout and Geopolitical Volatility Ignite Risk-Off
Key takeaways
- Technology stocks remain under pressure as the AI trade undergoes a valuation reset. Semiconductor shares led another volatile session, with investors rotating capital away from existing tech winners amid concerns over stretched valuations and a growing pipeline of mega-sized IPOs, including SpaceX and OpenAI.
- Geopolitical uncertainty continues to drive market sentiment. Renewed US-Iran tensions following President Trump’s comments reinforced concerns over energy security and global supply chains, keeping investors highly sensitive to geopolitical headlines.
- Central banks are increasingly focused on financial stability and currency defence. Bank Indonesia’s surprise rate hike and reports of a potential Bank of Japan taper pause highlight policymakers’ growing willingness to intervene amid mounting pressure on currencies and sovereign bond markets.
- Chart of the day: Gold (XAU/USD) looking to extend further potential losses below $4,100 with key short-term resistance at $4,268/285.
Chart of the day - Gold (XAU/USD) eyeing a bearish breakdown below $4,100
Fig. 1: Gold (XAU/USD) minor trend as of 10 Jun 2026 (Source: TradingView). The information presented is historical information, and past performance is not indicative of future performance.
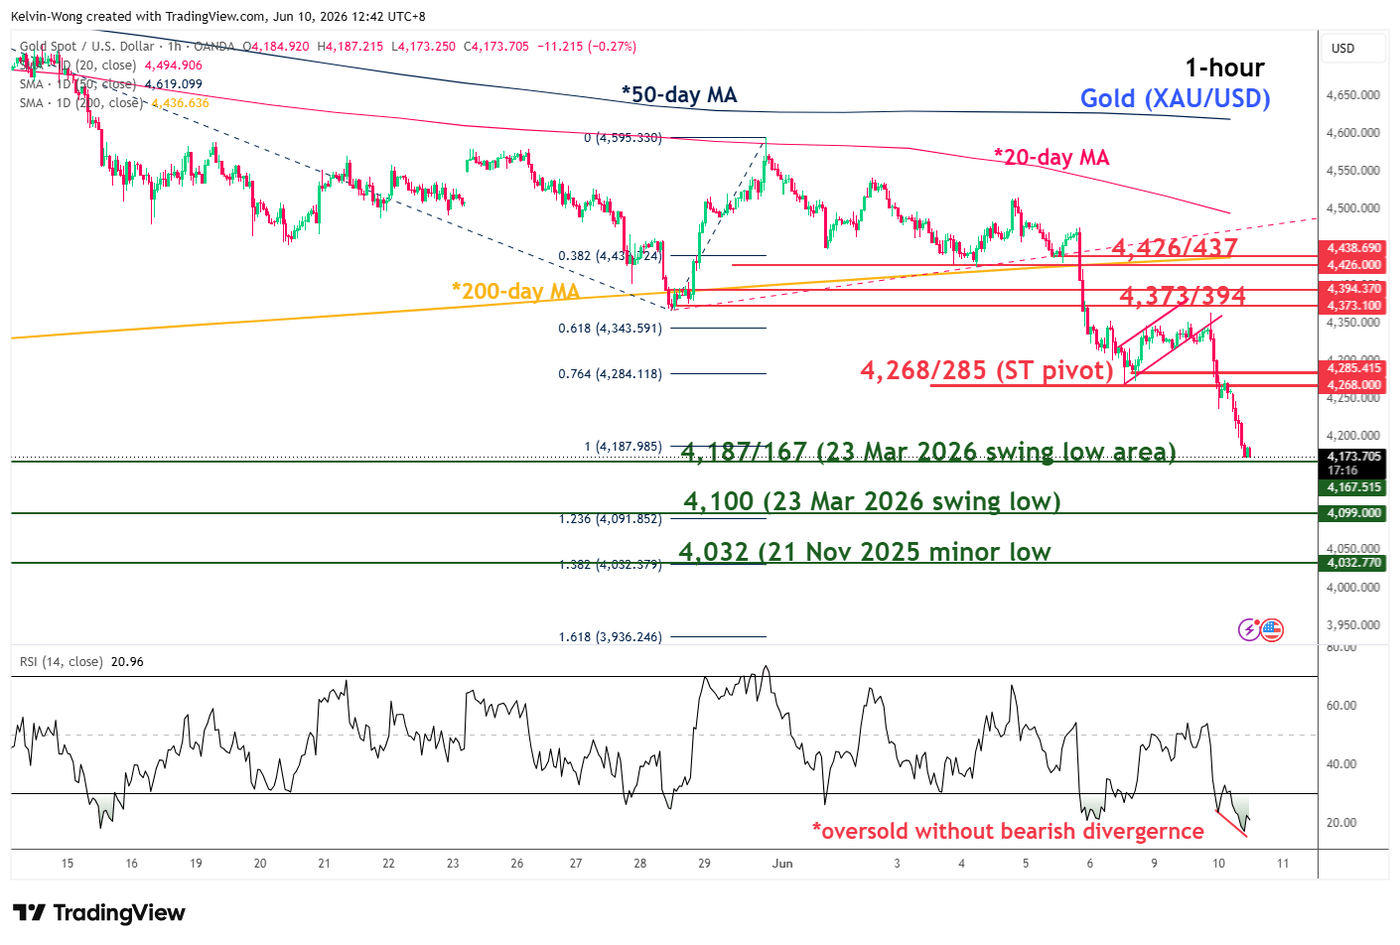
Gold (XAU/USD) has extended its losses by 2% in today’s Asia session to trade at an intraday level of $4,174, just a whisker away from the 23 March 2026 medium-term swing low of $4,100. Given that the price action of gold (XAU/USD) is firmly entrenched below the 20-day, 50-day, and 200-day moving averages, its medium-term downtrend from the 29 January 2026 all-time high remains intact (see Fig. 1).
Watch the $4,268/285 key short-term pivotal resistance to hold, as it maintains the ongoing minor bearish impulsive down move sequence, exposing the next intermediate supports at $4,187/167 and $4,100. Breaking below $4,100 may see a further deceleration towards $4,032 next in the first step.
However, a clearance with an hourly close above $4,285 negates the bearish tone, opening the door for another minor corrective rebound to retest the next intermediate resistance at $4,373/394 in the first instance.
Top macro headlines
- Global tech rout intensifies as chipmakers tumble 9%: A heavy wave of selling battered technology sectors worldwide on Tuesday. The semiconductor gauge (SOX), which had initially attempted a fragile bounce, fell 9% intraday before trimming losses to 1.9% at the close on Tuesday, dragging the Nasdaq 100 down 1.1% and erasing prior efforts to scale back toward recent peaks.
- US-Iran friction spikes over helicopter strike: Hopes for a quick resolution to Middle East geopolitical conflicts faded after U.S. President Donald Trump publicly declared that the United States must actively respond to an Iranian attack on an American helicopter. The comments triggered immediate volatility across commodities and energy equities.
- Mega-cap tech IPO pipeline crowds public liquidity: Capital desks note that extreme equity volatility is being exacerbated by a massive pipeline of new tech listings. Following news that SpaceX’s landmark initial public offering is drawing extensive institutional oversubscription, OpenAI has formally filed a confidential U.S. IPO registration, aiming to chase rivals Anthropic and SpaceX toward historic multi-billion- and trillion-dollar public valuations.
- Bank of Indonesia taps emergency controls via surprise hike: In regional foreign exchange management, Bank Indonesia delivered an unannounced, surprise interest rate hike early Tuesday. The emergency monetary intervention successfully arrested a historic slide in the Indonesian Rupiah, triggering a strong short-covering bounce. The IDR extended its gains in today’s Asia session by 0.8% to trade at 17,990 per US dollar.
- Bank of Japan reportedly mulls taper pause: Fixed-income desks reacted aggressively to circulating reports that the Bank of Japan is actively considering a temporary pause or deceleration of its previously signalled bond-buying taper. The news triggered an immediate localised rally in Japanese Government Bonds (JGBs), the 10-year JGB yield dipped by 3 bps on Tuesday to close at 2.68%, still holding above its 50-day moving average at around 2.55%.
Key macro themes
- The great funding drainage and valuation recalibration: The intensifying rotation out of richly priced technology names is evolving beyond a simple narrative shift. Institutional desks are increasingly highlighting a fundamental funding dilemma across global equities. With SpaceX seeking a massive $75 billion capital raise, Anthropic progressing through its listing path, and OpenAI targeting a public valuation of up to $1 trillion, large institutional allocators are being forced to trim existing liquid technology winners to make way for these massive generational private-market entries. This liquidity drain is actively structuring a ceiling on near-term public tech momentum.
- Geopolitical spillover into supply chain assets: Global markets continue to trade within a hyper-reactive geopolitical premium structure. While temporary halts in direct Israel-Iran strikes initially gave risk assets a brief window to capture a "dip-buying" bounce early in the Asian session, the subsequent U.S. rhetoric surrounding direct Iranian operations quickly reinforced the fragile baseline of global energy networks and shipping routes. The resulting cross-asset landscape remains structurally pinned to headlines, preventing standard macroeconomic or corporate fundamentals from asserting sustained price authority.
- Central banks locked in maximum-smoothing interventions: Emerging and developed monetary authorities across the Asia-Pacific region are navigating severe ceilings on currency depreciation. The surprise interest rate action out of Jakarta and the tactical JGB policy floating from Tokyo demonstrate that regional policymakers have reached structural boundaries where the absolute defence of financial stability supersedes long-term tightening blueprints. This interventionist posture is keeping sovereign yield curves highly compressed and prone to violent intraday gaps.
Global markets impact (last 24 hours)
Equities: The S&P 500 closed down 0.3%, while the tech-concentrated Nasdaq 100 plunged 1.1% as semiconductor giants lost 1.9%. The Dow Jones Industrial Average finished slightly higher, with a meagre 0.2% gain on Tuesday, insulated by a deep institutional rotation into defensive, value-oriented blue chips. In today’s Asia session, the S&P 500 and Nasdaq 100 E-mini futures extended their losses by 0.3% and 0.4%.
Fixed Income: U.S. sovereign debt caught a mild haven bid on the back of Trump’s Middle East remarks, pushing the benchmark 10-year Treasury yield down 5 bps to 4.52%, still above its 20-day moving average at 4.52%, ahead of today’s highly watched US CPI release.
FX: The US Dollar Index finished little changed. The euro remained stable at $1.1544, while the British pound climbed 0.3% to finish at $1.3379. The Japanese yen grinded lower by 0.1% towards the prior intervention zone, closing at 160.36 per US dollar. The risk-sensitive Aussie continued its descent by 0.3% to hit a 2-month low of 0.7028 against the greenback.
Commodities: WTI crude oil slumped 2.8% to close at $88.71/bbl, paring its sharpest intraday drop late in the session amid geopolitical updates. Safe-haven liquidation hit precious metals, pushing spot gold down 1.6% to settle at $4,260/oz.
Asia Pacific impact
- Equity rebound thwarted by US tech contagion: While Asian indices like Japan's Nikkei 225 bounced 2.2% on Tuesday, overnight weakness in US technology stocks triggered a negative feedback loop into Asian bourses today. Almost a sea of red at the start of today’s Asia session; Nikkei 225 (-1.9%), KOSPI (-5.1%), Hang Seng Index (-1.1%), China A50 (-0.3%), CSI 300 (-1%), and STI (-1%), while Australia’s ASX 200 managed to buck the trend with a minor gain of 0.1%.
- Indonesian rupiah rebounds on shock rate action: The Indonesian Rupiah emerged as a top regional outperformer, rallying sharply against the U.S. dollar after Bank Indonesia executed a surprise, emergency rate hike to defend its capital account against persistent capital flight and ongoing emerging market macro pressures.
- JGBs catch a wave of re-buying capital: Japanese Government Bonds rallied aggressively, driving domestic yields lower following formal reports indicating that the Bank of Japan is actively leaning toward a pause in its sovereign bond-purchase tapering program to stave off broader debt network illiquidity.
Top 5 events to watch today
- US Core Inflation Rate (May) - 8:30 pm SGT (consensus: 2.9% y/y Apr: 2.8% y/y) Impact: All asset classes
- BoC Interest Rate Decision - 9:45 pm SGT (consensus: 2.25%/unchanged) Impact: USD/CAD, CAD crosses
- EIA Weekly Crude Oil Inventories Report -10.30 pm SGT Impact: WTI and Brent crude
- SpaceX Pre-IPO Bookbuilding Adjustments Impact: US stock indices
- US-Iran developments over peace deal negotiations Impact: All asset classes
Gold Approaches Make-or-Break $4,000 Zone as US-Iran Tensions Escalate
Gold's selloff accelerated again as fresh headlines from the Middle East suggest the US and Iran are moving further away from a peace deal rather than closer to one. With the Strait of Hormuz still constrained and energy markets facing prolonged disruption, investors continue to focus on the inflation fallout. Persistent fears of higher-for-longer interest rates have pushed Gold toward the critical $4,000 support zone. It is now make-or-break time for the metal.
The United States launched targeted airstrikes against Iran after the downing of a US Army Apache helicopter over the Strait of Hormuz, marking a significant escalation in the conflict and further reducing the likelihood of a near-term US-Iran agreement. Yet oil prices have remained surprisingly contained, with Brent holding around the $92-$93 area rather than surging back toward $100. Oil, markets appear to be treating the situation as an extension of an existing "status quo" rather than the start of a new crisis.
What investors have not accepted is the inflation fallout. Every additional week of disruption keeps energy prices elevated and reinforces expectations that central banks will need to maintain restrictive policy settings for longer. That is the force driving Gold lower. The market focused on what the conflict means for inflation, interest rates and yields.
The technical damage has been substantial. Gold has already reached 100% projection of 4,773.50 to 4,366.22 from 4,595.14 at 4,187.86 on downward acceleration. With 4,366.22 now firmly acting as resistance, sellers remain in control and the next downside target stands at 161.8% projection at 3,936.16 . Momentum suggests that a test of the key $4,000 area is no longer a question of if, but when.
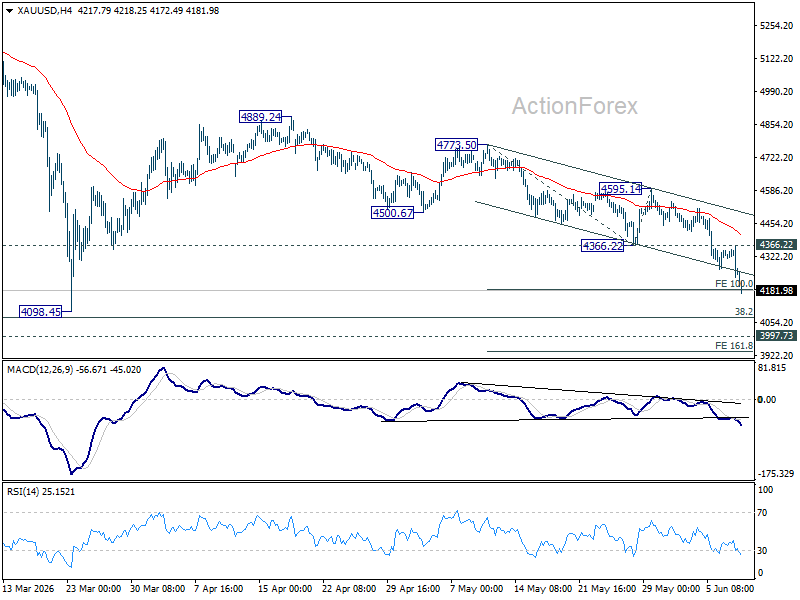
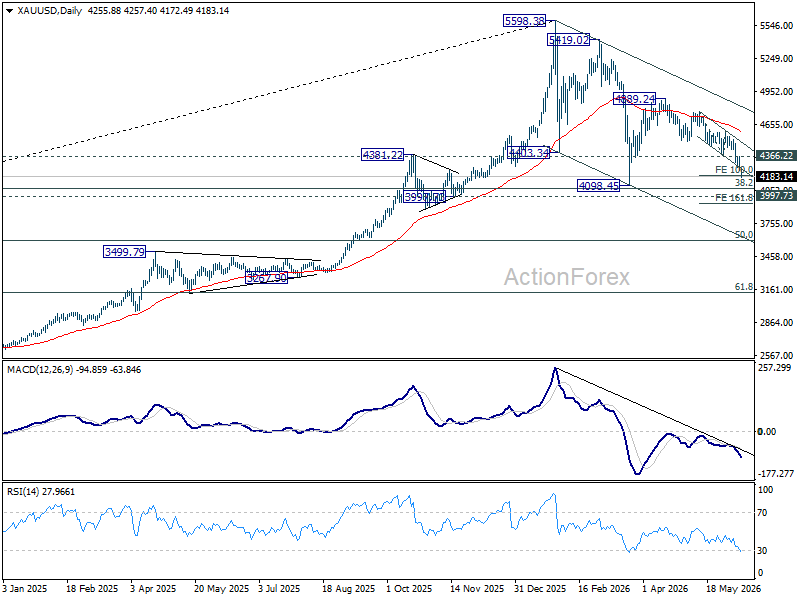
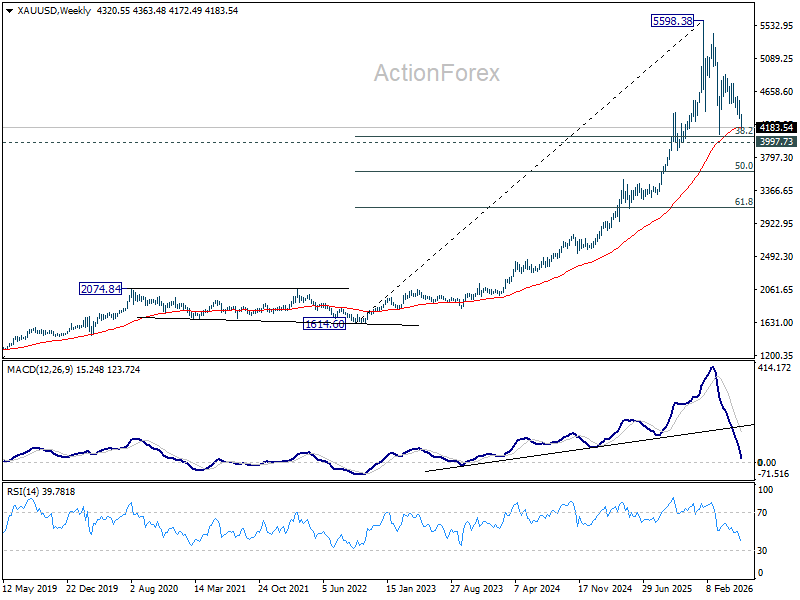
That is where the story becomes interesting. The area around $4,000 is not just another psychological level. It is one of the most heavily reinforced support zones on the chart. The March low sits at 4,098.45. There is 38.2% retracement of 1,614.60 (2022 low) to 5,598.38 at 4,076.57. Structural support comes in at 3,997.73. Together, they form a cluster that is likely to attract intense attention from both buyers and sellers.
The critical question is whether the current macro environment is strong enough to force a sustained break lower. While markets are increasingly pricing tightening from ECB and potentially Fed, the broader economy is showing signs of slowing. This is not a replay of 2022 when central banks were forced into an aggressive inflation-fighting campaign. It is a stagflationary environment where policymakers have limited room to keep raising rates before growth begins to buckle.
Unless the global economy is heading into a much more aggressive tightening cycle than currently anticipated, $4,000 should ultimately hold as the floor of this correction.
If $4,000 fails decisively, however, the narrative changes completely. The market would no longer be debating how deep the correction becomes. It would be debating whether the entire uptrend from the 2022 lows is undergoing a major reversal, with 50% retracement of 1,614.60 to 5,598.38 at 3,606.49 emerging as the next major downside objective.
China CPI unchanged at 1.2%, PPI Climbs to Highest Since 2022
China's consumer inflation remained steady in May even as producer price pressures continued to build. CPI held unchanged at 1.2% yoy, falling slightly short of expectations for a 1.3% yoy increase, while core CPI edged down from 1.2% yoy to 1.1% yoy. The data suggest that despite rising costs at the factory gate, underlying consumer demand remains relatively restrained.
A major factor holding down consumer inflation was food prices, which fell -1.7% yoy. Pork prices, a key component of China's food basket, plunged -16.1% yoy, offsetting broader inflationary pressures elsewhere in the economy. The softer core CPI reading also indicates that businesses are still facing challenges passing higher costs on to consumers, despite stronger economic activity and improving trade performance in recent months.
In contrast, producer prices accelerated sharply from 2.8% yoy to 3.9% yoy, matching expectations and reaching their highest level since July 2022. The National Bureau of Statistics attributed the increase to higher commodity prices and stronger demand in selected industries.
The energy shock linked to disruptions in global oil markets has played a major role in lifting China's factory-gate inflation, helping PPI return to positive territory in March for the first time since September 2022.
| Indicator | April | May | Forecast |
|---|---|---|---|
| CPI Y/Y | 1.2% | 1.2% | 1.3% |
| Core CPI Y/Y | 1.2% | 1.1% | |
| PPI Y/Y | 2.8% | 3.9% | 3.9% |
| PPI M/M | 1.7% | 0.5% |
Japan Producer Inflation Jumps to 6.3% as Energy Shock Drives Costs Higher
Japan's producer prices accelerated sharply in May, with PPI rising from 5.3% yoy to 6.3% yoy, well above expectations of 5.5% yoy and marking the fastest annual increase since March 2023. On a monthly basis, wholesale prices rose 0.9%, following a revised 2.8% gain in April. The data highlight how the Middle East energy shock is increasingly feeding into upstream inflation pressures across the Japanese economy.
The latest increase was driven primarily by higher prices for nonferrous metals, chemicals and petroleum products as the effective closure of the Strait of Hormuz pushed up crude oil and naphtha costs. The surge in import prices was even more striking. Japan's yen-based import price index jumped 25.5% yoy in May, accelerating from 21.0% yoy in April and recording its strongest increase since November 2022.
At the same time, strong overseas demand for AI-related semiconductors continued to provide an important offset. Export prices climbed 20.6% yoy in May, supported by robust shipments of technology products. While the surge in export earnings helps cushion the deterioration in Japan's terms of trade, the broader picture remains one of mounting inflation pressure.
| Indicator | April | May | Forecast |
|---|---|---|---|
| PPI Y/Y | 5.3% | 6.3% | 5.5% |
| PPI M/M | 2.8%* | 0.9% | N/A |
Hotter US Inflation Numbers Could Further Bolster Fed Hike Bets
- Middle East tensions keep inflation risks elevated.
- Fed hike fully priced in by year end amid strong NFP report.
- US CPI data on Wednesday (12:30 GMT) to enter the spotlight.
- Further acceleration in inflation could drive the dollar higher.
Middle East Tensions and NFP Data Bolster Fed Hike Bets
With tensions in the Middle East escalating once again over the weekend, hopes vanished that the Strait of Hormuz will reopen at some point soon, giving room to heightened inflation concerns as oil prices opened this week with a positive gap. Although it pulled back following headlines that Iran ended its military operations against Israel, the pullback was far from reflecting hope about permanent ceasefire soon. After all, Iranian officials warned that they would resume hostilities if attacks against Lebanon continue.
On Sunday, Iran fired missiles at Israeli military targets in retaliation for Israel’s attacks on Lebanon. Israel responded by attacking Iran, defying US President Trump’s call for restrain. The new hostilities came on top of a robust US jobs report on Friday, keeping inflation fears elevated and allowing investors to bring forward their Fed rate hike bets.
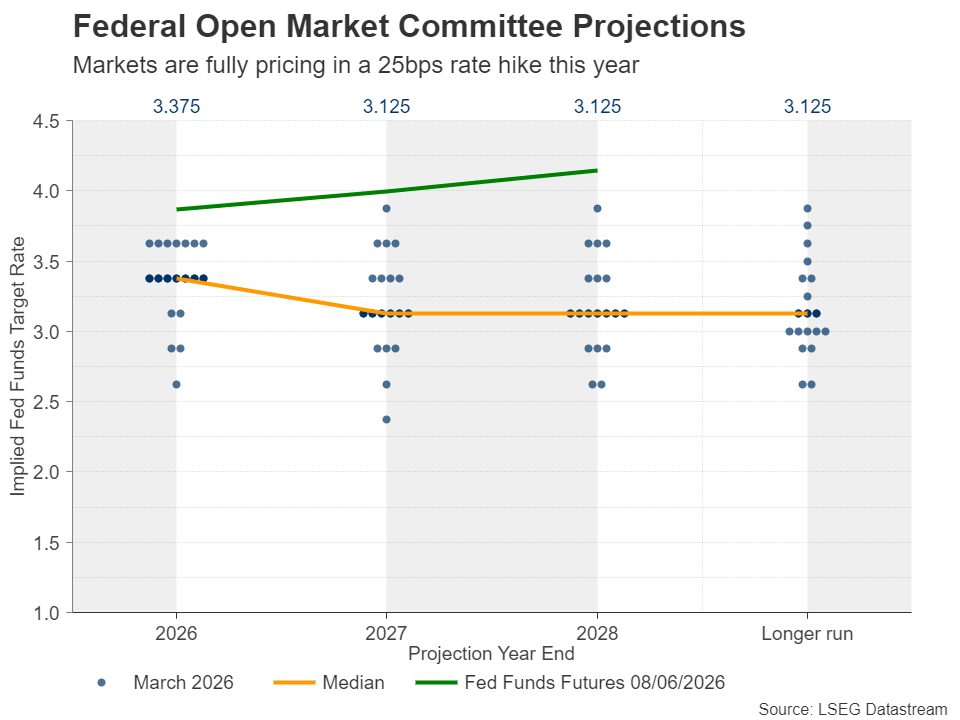
According to Fed funds futures, a quarter-point rate hike is now fully priced in for this year, the probability of it being delivered in September resting close to 50%. With the upcoming meeting being the first of the new Chair, Kevin Warsh, it is unlikely that the Fed will press the hike button before September. After all, Warsh was appointed by US President Trump, on the premise that he holds a less hawkish view than his predecessor Jerome Powell.
US CPI and PPI Data Could Reveal Further Acceleration
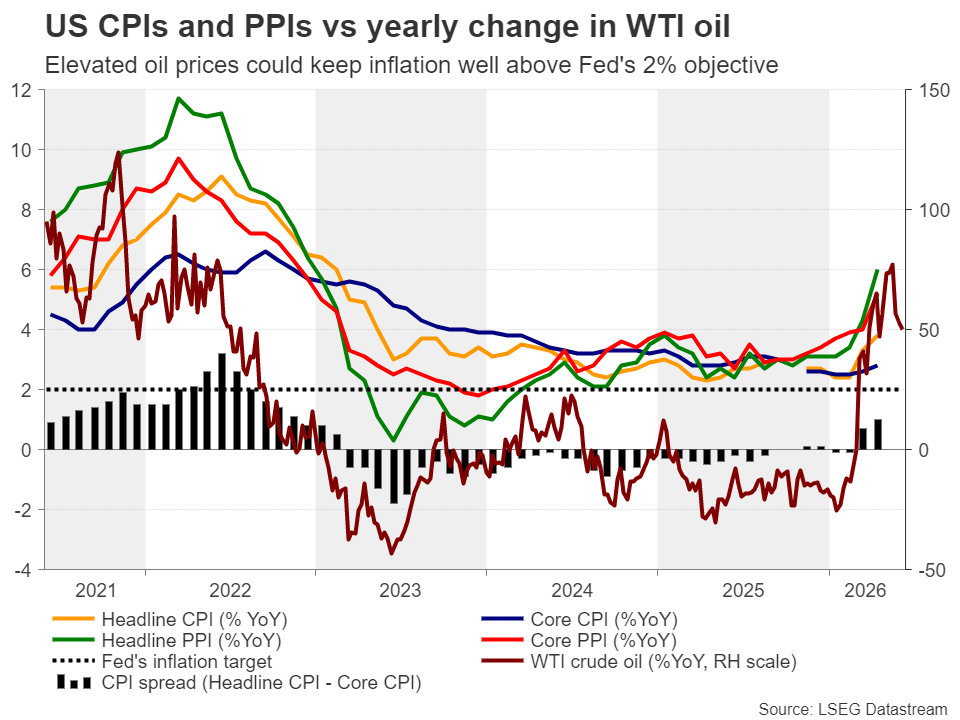
On Wednesday, the spotlight is likely to turn to the US CPI data for May, while on Thursday, the PPI figures will be released. In April, the headline CPI rate accelerated to 3.8% y/y from 3.3% amid the surge in oil prices due to the Middle East tensions, and although the rise in the core rate was smaller, the headline PPI rate surged to 6%. This means that products that were produced in April were set to arrive on store shelves at higher prices over the following months.
What’s more, although the year-on-year rate of change of WTI crude oil declined lately, it is hovering at April levels, which leaves little room for a material slowdown in inflation. All this poses upside risks to this week’s data. Indeed, the forecasts point to further acceleration, with the headline CPI rate expected to climb to 4.2% y/y from 3.8%, and the core to tick up to 2.9% y/y from 2.8%.
Another month of hotter-than-expected prints could drive the probability of a September hike higher, thereby pushing Treasury yields higher and adding more fuel to the dollar’s engines. At the same time, gold could extend its slide as the opportunity cost for holding the precious metal increases.
Euro/Dollar Rebounds, but Outlook Remains Bearish
From a technical standpoint, euro/dollar tumbled on Friday following the better-than-expected NFP report, breaking below the 1.1585 barrier and hitting support near the 1.1505 zone. Although the pair is now recovering, the short-term outlook remains negative.
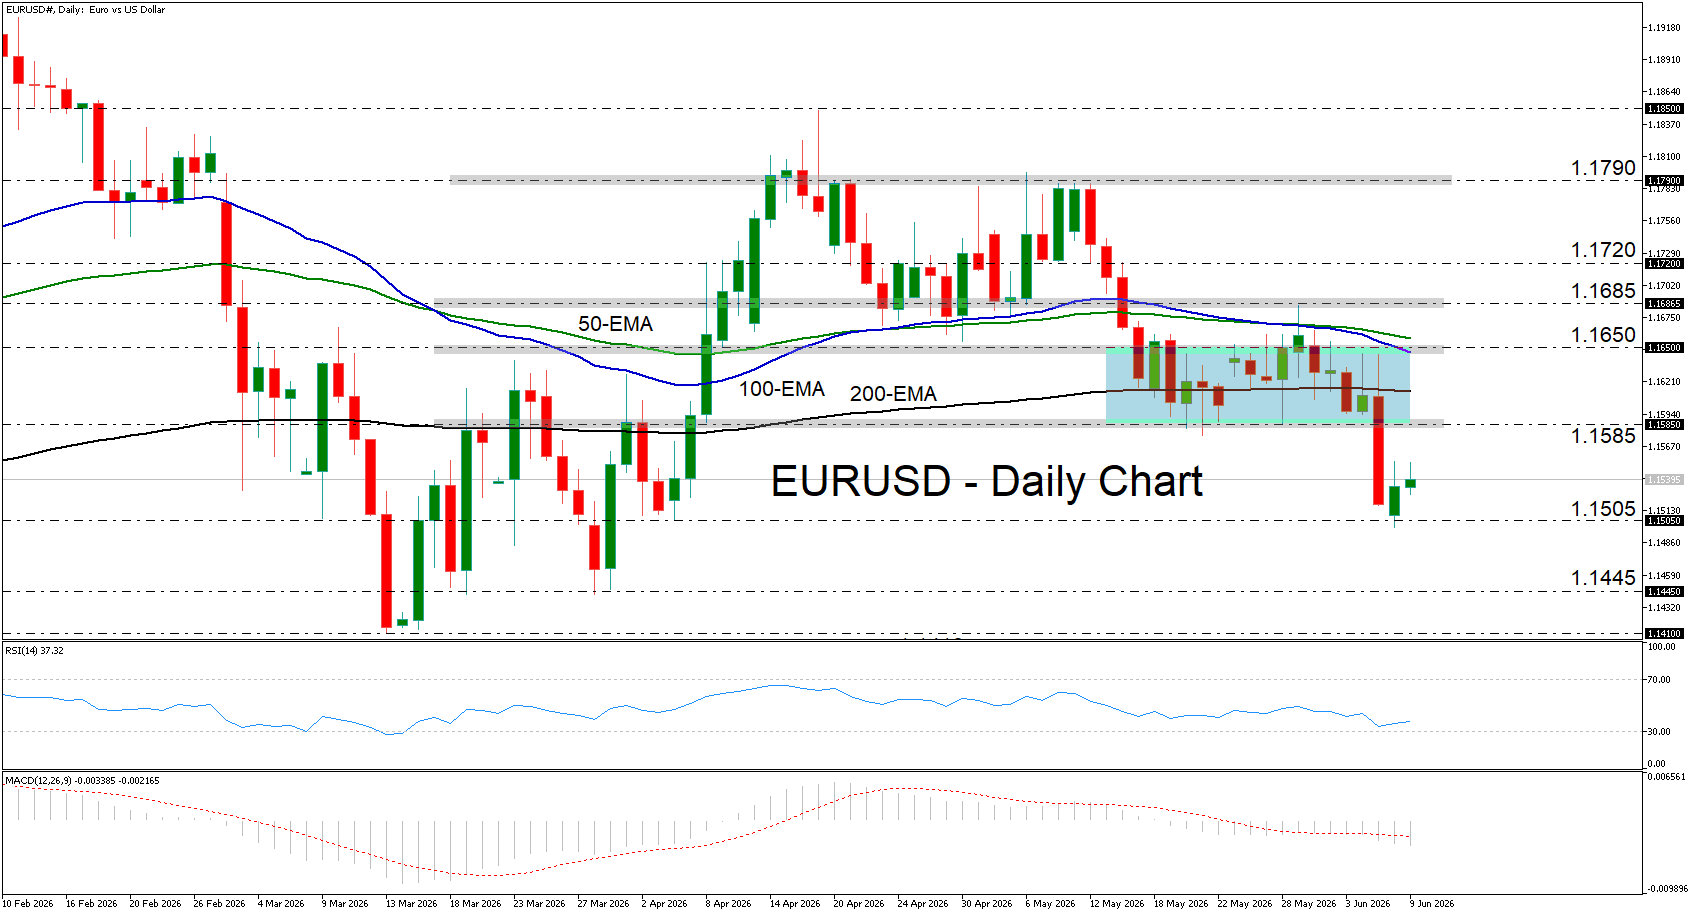
Even if the rebound stretches a bit more, the bears could re-charge from near the 1.1585 zone and shoot for another text near 1.1505. A break lower could set the stage for declines towards the 1.1445 area, marked by the lows of March 30 and 31. On the upside, a clear close above 1.1585 could signal the pair’s return within a sideways range, while a decisive move above 1.1650 may shift the outlook to bullish.