Sample Category Title
Traders Take Profits Ahead of High-Stakes US CPI, Sterling Jumps on Strong Consumer Spending
Global markets showed signs of stabilization today, but conviction remained notably absent as investors positioned cautiously ahead of Wednesday's pivotal US CPI report. Technology shares rebounded strongly across Japan and South Korea, oil prices eased, and Dollar softened. Yet the moves appeared driven more by profit-taking and position adjustment than by a decisive shift in sentiment.
The recovery in technology stocks was particularly notable given last week's sharp AI-driven selloff. However, the rebound may not be as reassuring as headline price action suggests. Market flow data indicate that while technology shares have rallied for two consecutive sessions, institutional investors continue to build net short positions across US and Asian technology sectors. That pattern points more toward short covering and profit-taking rather than the return of meaningful long-term buying interest.
Part of the improvement in sentiment also came from softer oil prices. Brent crude extended its retreat as US President Donald Trump again suggested that a deal to end the conflict with Iran could be reached within "two or three days." Markets welcomed the possibility of progress, but the reaction remained measured. Traders appear reluctant to fully embrace a de-escalation narrative given the repeated delays and setbacks that have characterized negotiations in recent months.
The result is a market that is neither fully risk-on nor risk-off. Instead, investors appear content to reduce exposure and wait for clearer signals from inflation data. Following last week's stronger-than-expected US nonfarm payrolls report, attention has shifted almost entirely toward inflation and whether rising energy costs are beginning to feed more broadly into consumer prices. A stronger CPI reading would likely reinforce expectations of additional Fed tightening, with implications for yields, Dollar and risk assets.
One notable exception to the generally cautious tone was Sterling. The Pound gained support after the BRC Retail Sales Monitor delivered a major upside surprise. UK retail sales rose 3.7% year-on-year in May, far exceeding expectations for a 0.6% increase and sharply reversing April's -3.4% decline. While favorable weather and holiday spending contributed to the rebound, the data also suggested consumers remain more resilient than many had expected despite elevated borrowing costs and energy prices.
That resilience carries important policy implications. If consumer demand remains firm while inflation pressures persist, the case for another Bank of England rate hike later this year could strengthen considerably. For now, Sterling's outperformance reflects growing confidence that the UK economy may be proving more resistant to higher rates than previously assumed.
In currency markets, New Zealand Dollar led gains for the week, followed by Sterling and Euro. Dollar is the weakest performer, with Yen and Swiss Franc also under pressure. The mixed ranking underscores the broader theme of selective positioning rather than a unified market view, a dynamic that could change rapidly once the US inflation data are released.
Oil Traders Are Betting on Peace; The Clock Is Betting on $150 Crude
Oil prices suggest traders still expect diplomacy to prevail. But beneath the surface, governments and businesses have been relying on strategic reserves and inventory drawdowns to offset supply disruptions from the Strait of Hormuz. Those buffers are finite, and the next few weeks could determine whether Brent continues falling—or begins a march toward $150. Read More.
Silver's $70 Breakdown May Have Changed Everything
Silver's slide below $70 may be more important than the selloff itself. A level viewed as a structural floor supported by supply deficits and industrial demand has now broken, raising the possibility that $70 could become a new ceiling. The next rebound may reveal whether investors are buying the dip—or using rallies to exit positions. Read More.
China Exports Surge 19.4% as US Trade Truce and Tech Demand Fuel Growth
China's trade sector delivered another upside surprise in May. Exports surged nearly 20%, led by booming technology shipments, rising vehicle exports and a sharp rebound in trade with the US. Strong import growth and record purchases from South Korea also point to resilient manufacturing activity across Asia. Read More.
Australian Consumer Sentiment Falls Back Near Record Lows as Cost-of-Living Pressures Intensify
The pressure on Australian households is intensifying. Consumer confidence fell back near historic lows in June as cost-of-living concerns returned "with a vengeance", highlighting the growing economic toll of higher prices and interest rates. Read More.
Australia NAB Business Confidence Lifts From Deep Lows as RBA Tightening Bites
The worst fears about the energy shock have not materialized. Australia's latest NAB survey showed improving business confidence, steady activity and a sharp slowdown in cost and price growth, offering signs that RBA tightening is having the desired effect. Read More.
GBP/JPY Daily Outlook
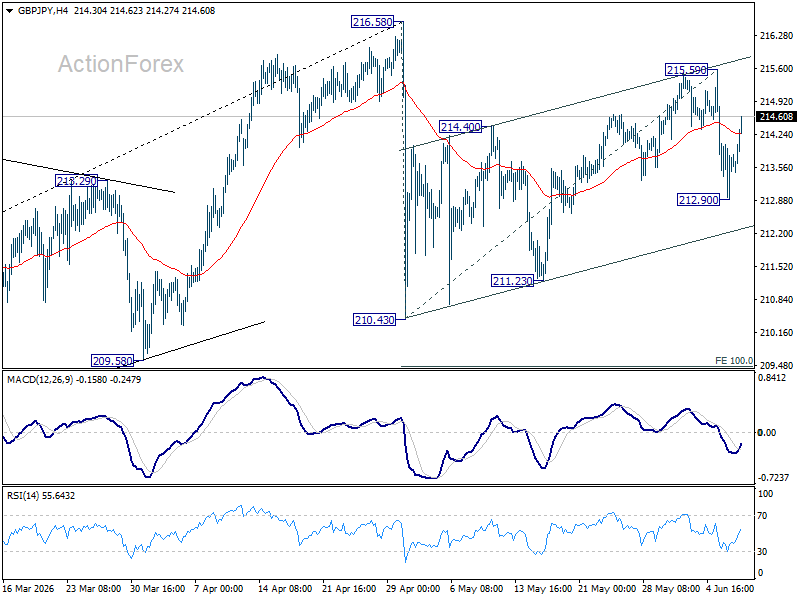
Intraday bias in GBP/JPY is turned neutral with current recovery. Risk will stay mildly on the downside as long as 215.59 resistance holds. Below 212.90 will target 210.43/211.23 support zone. However, firm break of 215.59 will resume the rebound from 210.43 to retest 216.58 high instead.
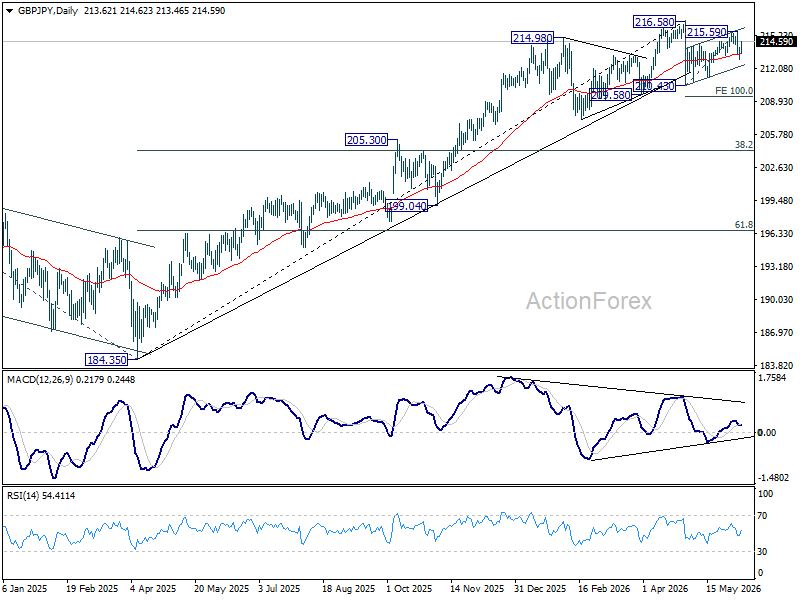
In the bigger picture, there is no clear sign of trend reversal yet. The long term up trend could still extend to 61.8% projection of 148.93 (2022 low) to 208.09 (2024 high) from 184.35 at 220.90 on resumption. However, sustained break of 55 W EMA (now at 206.77) will argue that it's already in medium term down trend for 184.35 support.
Crypto Market Rebounds from Its Worst Oversold Conditions Since 2020
Market Overview
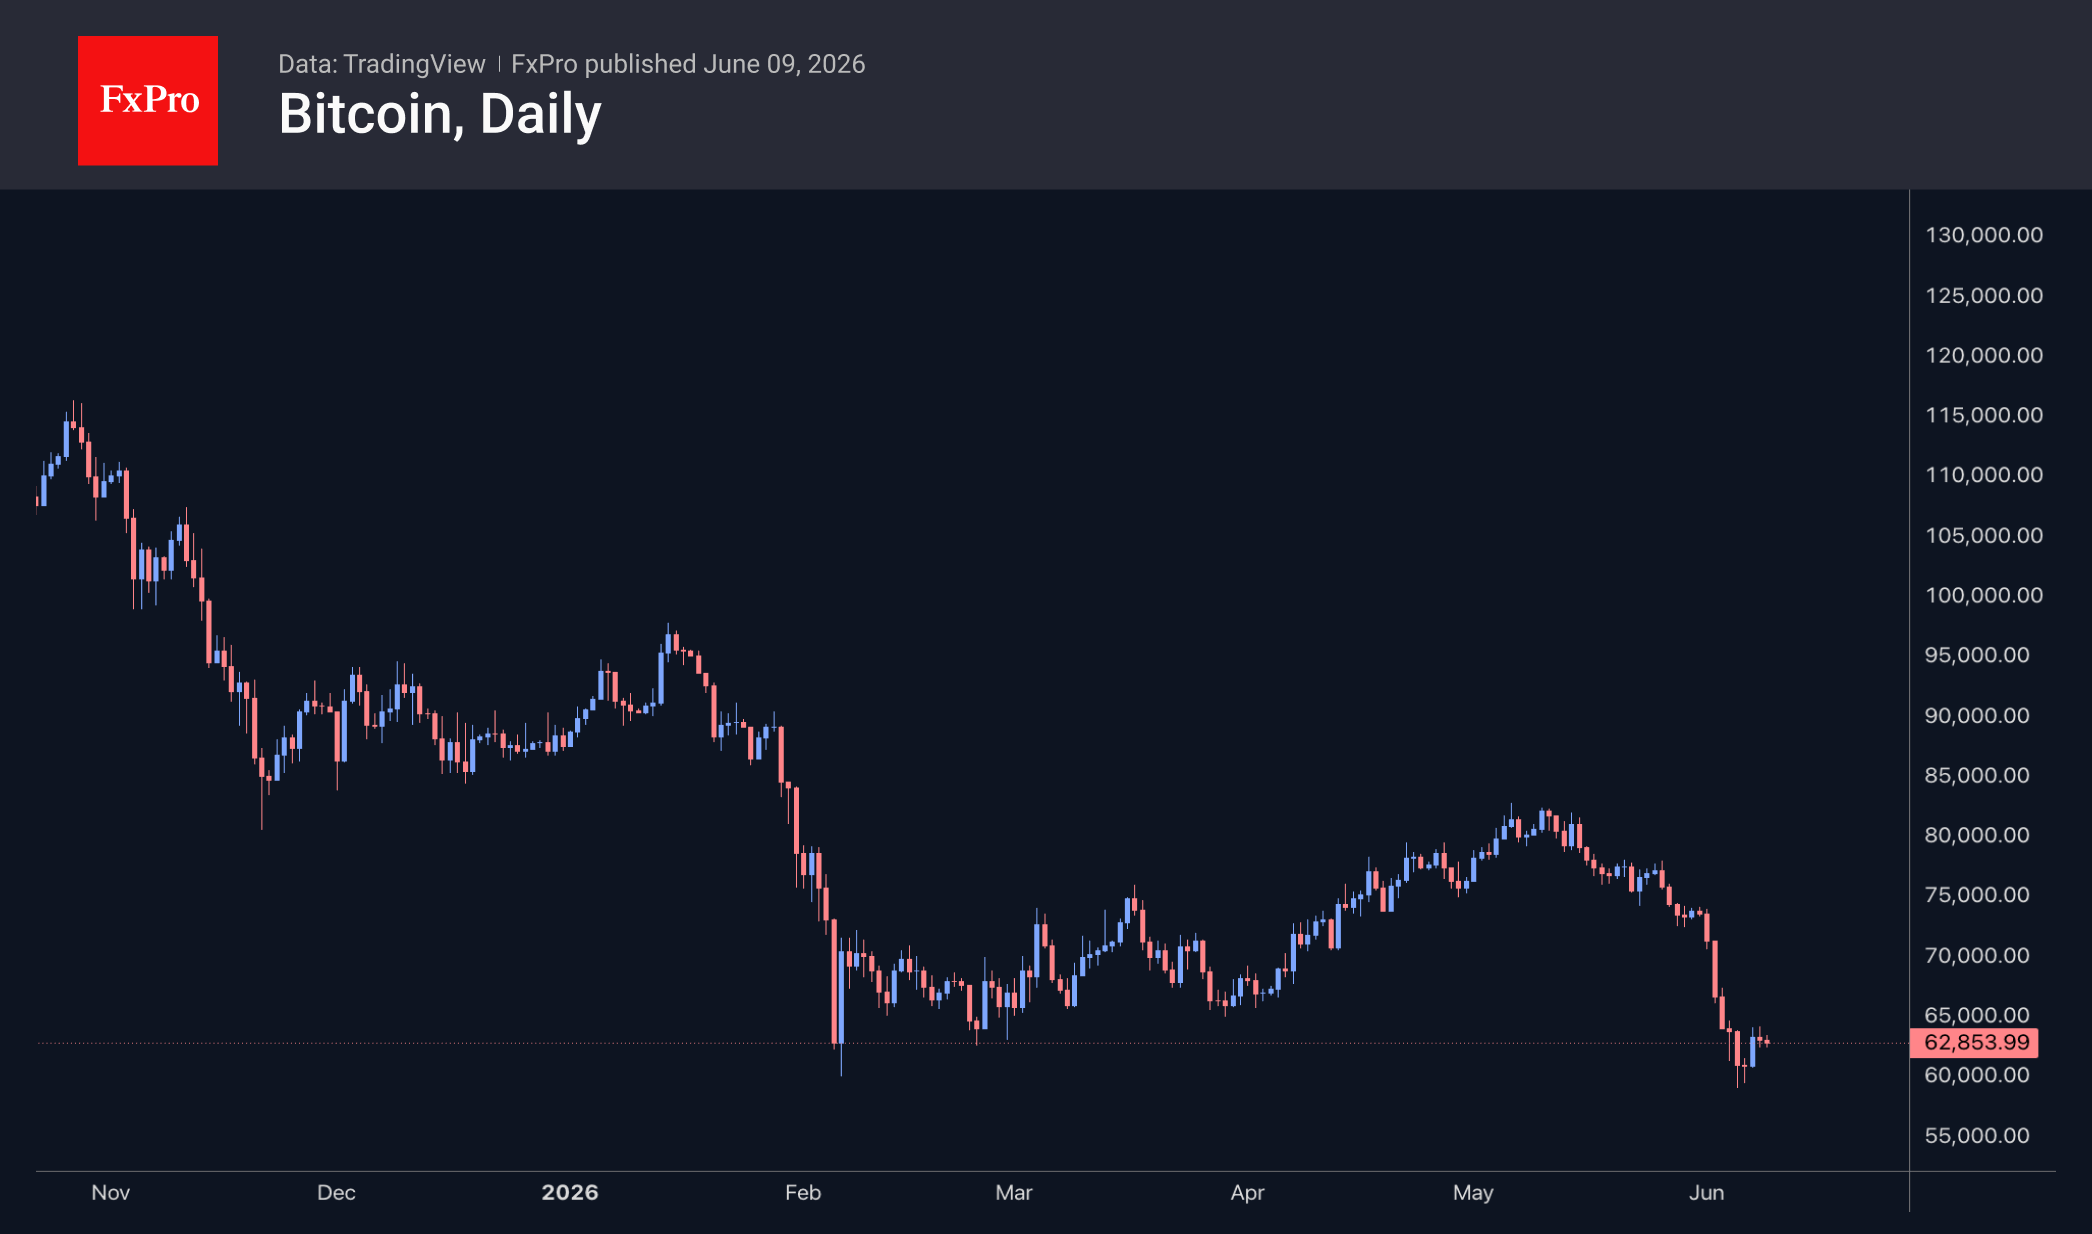
The crypto market capitalisation has risen by 1.3% over the past 24 hours to $2.18 trillion. With no fresh downward momentum, bears are taking profits, while some investors view the situation as a good opportunity for long-term positions. On daily timeframes, the RSI is recovering and entering neutral territory after the most severe oversold conditions since 2020. Among the top-performing coins of the day were BAT (+13%), NEAR (+7%) and ZEC (+6.5%). The underperformers were BCH (-6.1%), TRX (-0.6%) and UNI (+0.2%).
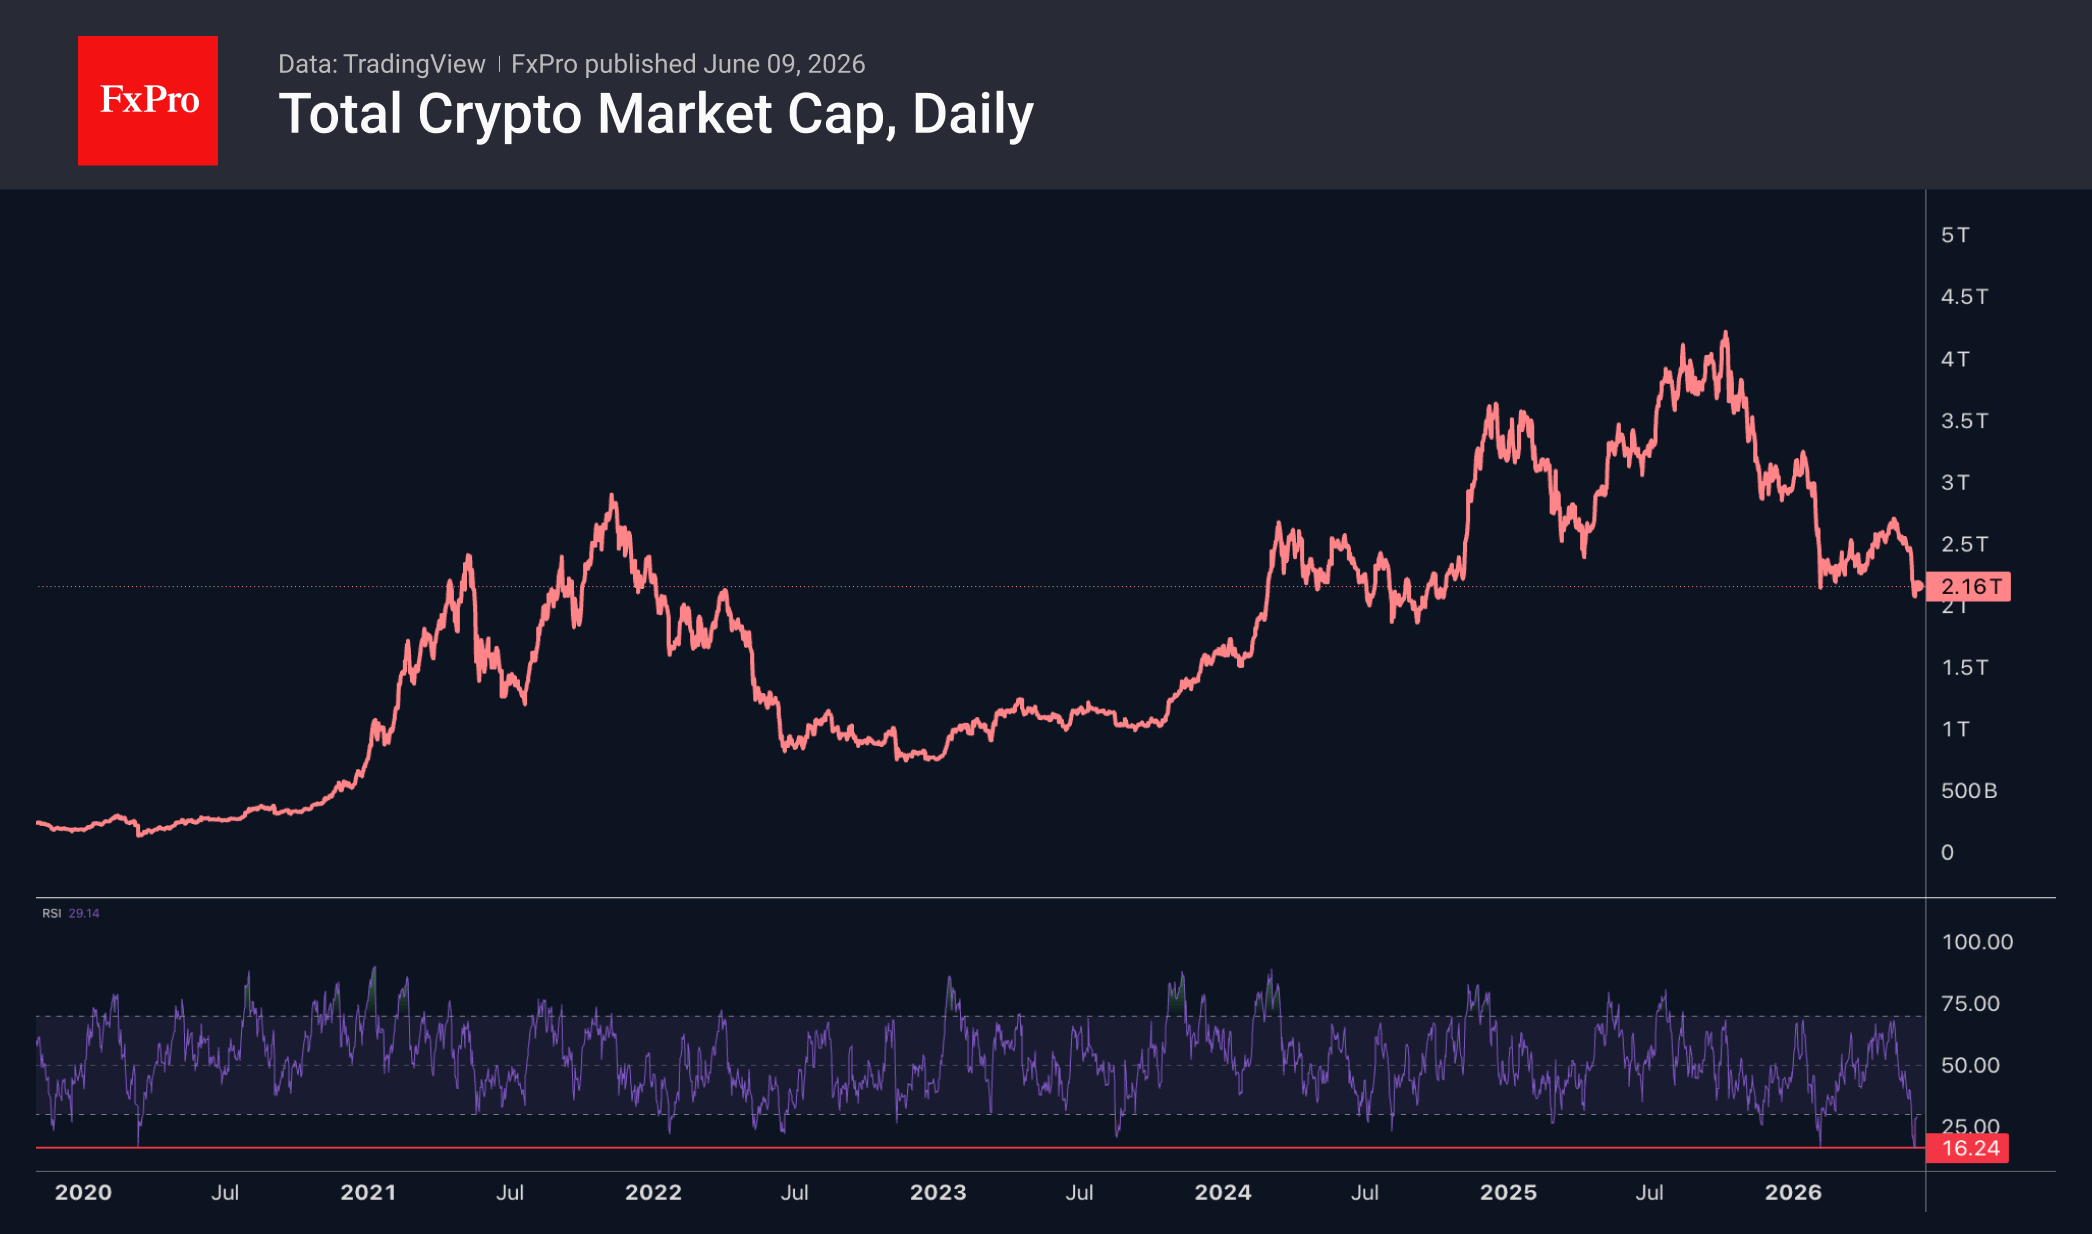
Bitcoin rebounded to $63.2K, moving away from Friday’s lows of $59K. Technically, a recovery up to $68K could be viewed as a rebound from the downward momentum seen between 11 May and 5 June. On the other hand, a sustained rebound over this period would confirm a bounce off the 200-week moving average and bring the leading cryptocurrency out of oversold territory, which would be a different narrative altogether. It is quite possible that this situation will be a very close analogy to 2020, when a couple of months of recovery from the last slump were followed by four months of sideways movement and a subsequent boom.
News Background
Bitcoin is experiencing its first-ever drop in hash rate due to economic reasons, Elektron Energy notes. From its record high in September 2025, the network’s computing power has fallen by approximately 25%.
A ‘changing of the guard’ has occurred in the crypto market, with the leaders of key segments giving way to a new generation of participants. The main areas of development will be decentralised finance (DeFi), the tokenisation of real-world assets (RWA) and stablecoins, while blockchain systems will interact more closely with AI, Bitwise predicts.
By selling shares, Strategy purchased an additional 1,550 BTC last week for $101.3 million at an average price of $65.3K per coin. A week earlier, the company sold 32 BTC for the first time since 2022. Strategy now holds 845,256 BTC, purchased for $64 billion at an average price of $75.7K per Bitcoin.
Over the past week, BitMine increased its reserves by 126,971 ETH, marking its largest purchase since the start of the year. BitMine’s reserves exceeded 5.54 million ETH, accounting for 4.59% of the Ethereum supply. The company has stepped up its purchases of the altcoin following its price decline.
Tether’s USDT stablecoin briefly overtook Ethereum to take second place by market capitalisation, notes JAN3 founder Samson Mow. Bloomberg strategist Mike McGlone expects USDT could even overtake Bitcoin in terms of capitalisation should Bitcoin experience a sharp decline.
EUR/USD Daily Outlook
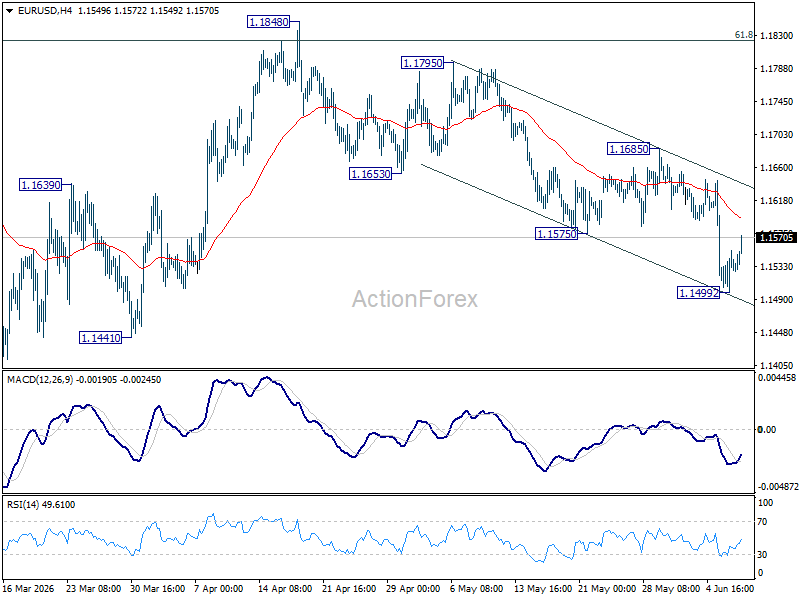
EUR/USD recovered just ahead of near term falling channel floor and intraday bias is turned neutral first. Some consolidations could be seen, but risk will stay on the downside as long as 1.1685 resistance holds. Break of 1.4992 will resume the fall from 1.1848 to retest 1.1408 low next.
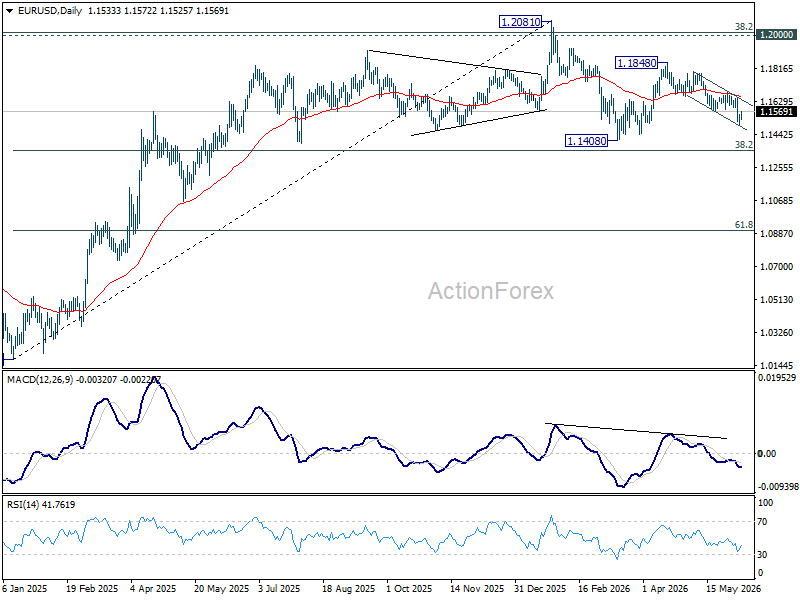
In the bigger picture, the strong support from 38.2% retracement of 1.0176 to 1.2081 at 1.1353 suggests that the pullback from 1.2081 is more likely a corrective move. Strong support was also found in 55 W EMA (now at 1.1547). Focus is back on 1.2 key cluster resistance level. Decisive break there will carry long term bullish implications. Nevertheless, break of 1.1408 support will revive the case of medium term bearish trend reversal.
USD/JPY Daily Outlook
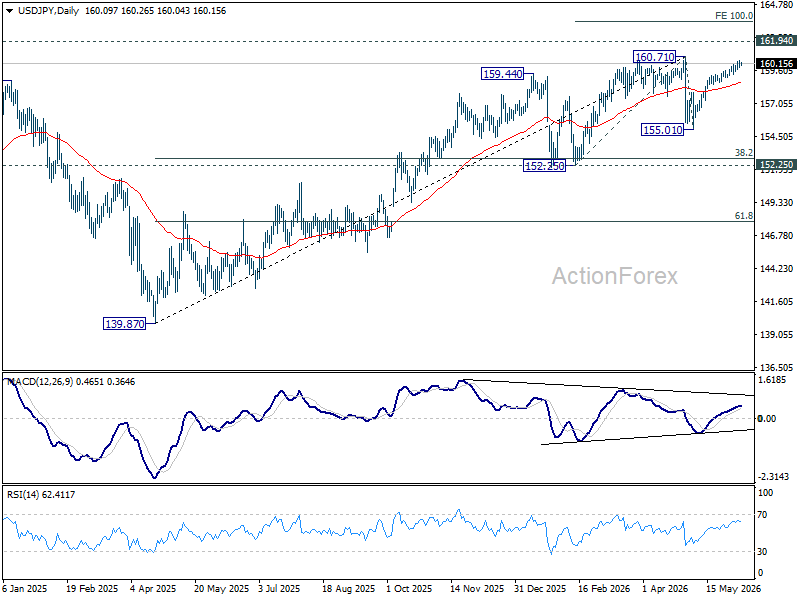
Further rise could still be seen in USD/JPY. But strong resistance is still expected from 160.71. Break of 159.08 will turn bias back to the downside the extend the corrective pattern from 160.71 with the third leg. However, decisive break of 160.71 will confirm up trend resumption. That should push USD/JPY through 161.94 to 100% projection of 152.25 to 160.71 from 155.01 at 163.47 next.
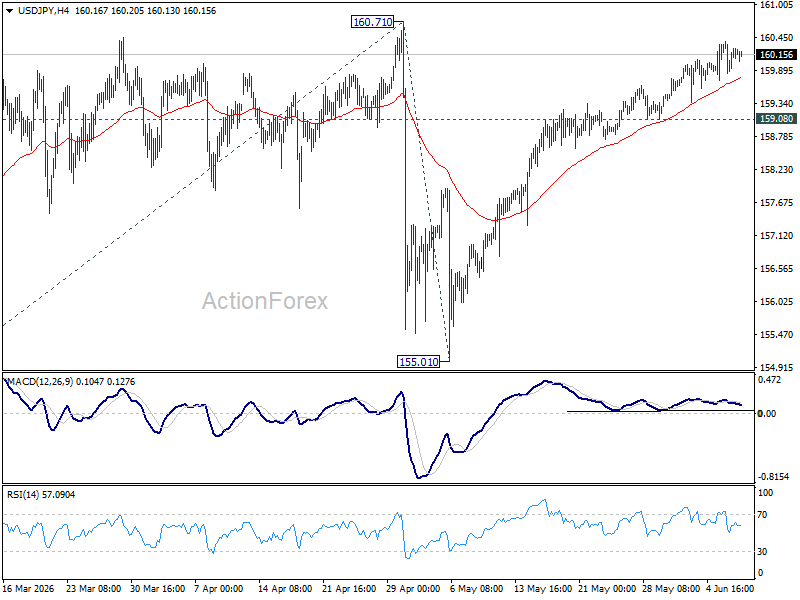
In the bigger picture, for now, corrective pattern from 161.94 (2024 high) is still seen as completed at 139.87. Rise from there is seen as resuming the long term up trend. So, break of 161.94 is expected at a later stage to resume the long term up trend. However, sustained break of 55 W EMA (now at 154.93) will dampen this view and bring deeper fall back towards 139.87 to extend the pattern from 161.94.
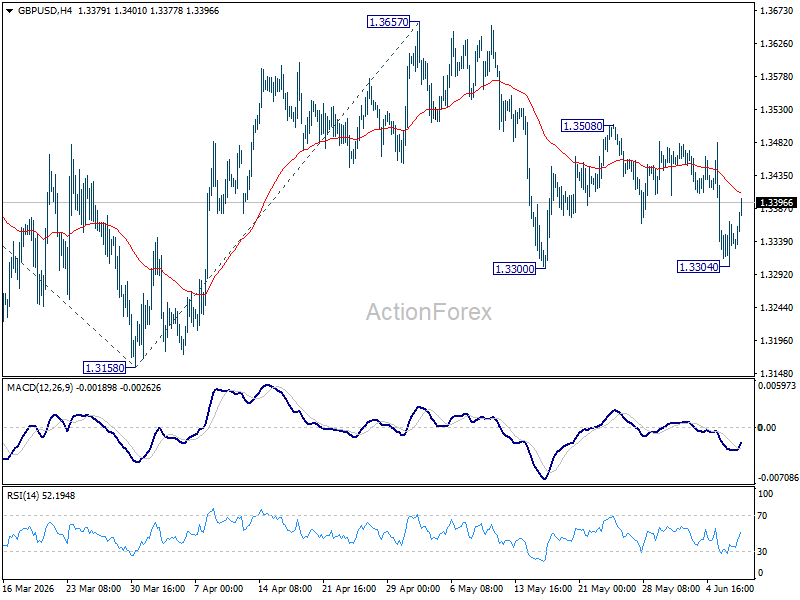
GBP/USD Daily Outlook
GBP/USD recovered ahead of 1.3300 support as sideway trading continues. Intraday bias remains neutral first. On the downside, break of 1.3300 will target a retest on 1.3158. Firm break there will extend the whole fall from 1.3867 to 100% projection of 1.3867 to 1.3158 from 1.3657 at 1.2948. For now, risk is mildly on the downside as long as 1.3508 resistance holds, in case of recovery.
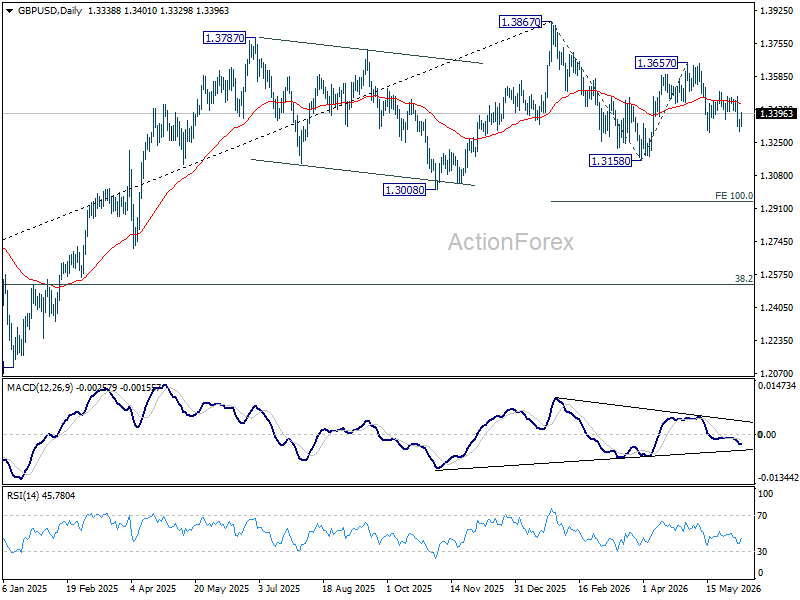
In the bigger picture, price actions from 1.3867 are a corrective pattern within the broader up trend from 1.0351 (2022 low). With 1.3008 support intact, medium term bullishness is maintained and break of 1.3867 is in favor for a later stage, towards 1.4248 key resistance (2021 high). However, firm break of 1.3008 will at least bring deeper fall to 38.2% retracement of 1.0351 to 1.3867 at 1.2524, with increased risk of bearish reversal.
USD/CHF Daily Outlook
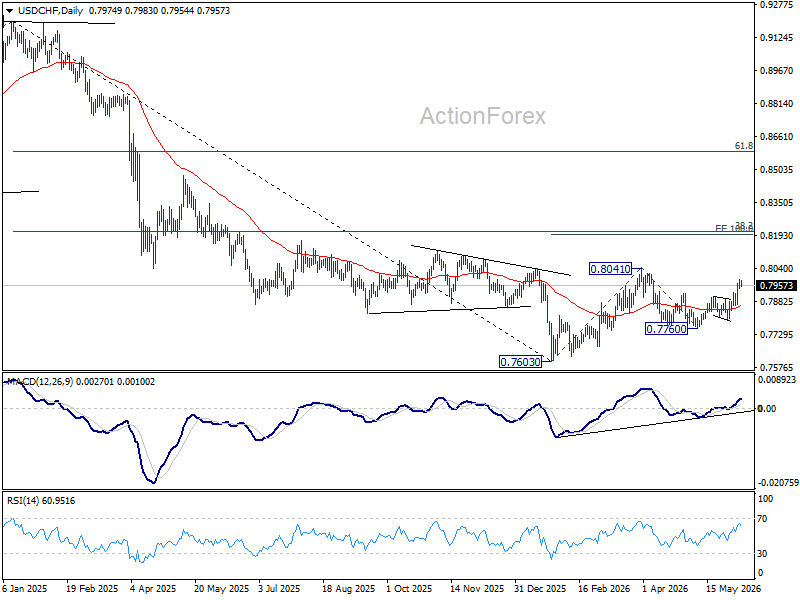
Intraday bias in USD/CHF is turned neutral first and some consolidations could be seen below 0.7986 temporary top. Risk will stay on the upside as long as 0.7867 minor support holds. Above 0.7986 will resume the rally from 0.7760 to retest 0.8041 high.
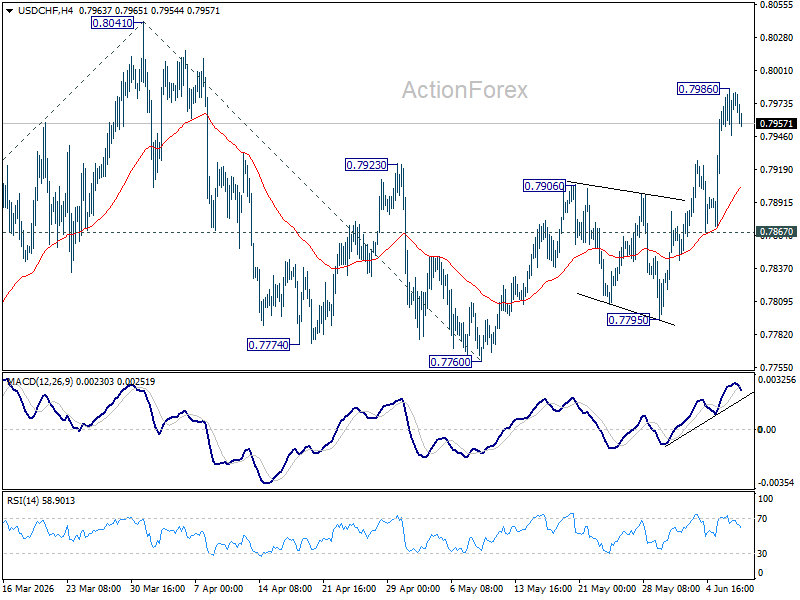
In the bigger picture, while a medium term bottom was formed at 0.7603, it's still early to call for bullish trend reversal. As long as 38.2% retracement of 0.9200 (2025 high) to 0.7603 at 0.8213 holds, the larger down trend could still continue through 0.7603 at a later stage. However, firm break of 0.7603 will argue that the trend has reversed and turn focus to 0.8332 support turned resistance (2023 low) for confirmation.
AUD/USD Daily Report
Intraday bias in AUD/USD is turned neutral first with current recovery, and some consolidations could be seen. Risk will stay on the downside as long as 0.7200 resistance holds. Below 0.7022 will resume the fall from 0.7277 to 100% projection of 0.7277 to 0.7076 from 0.7200 at 0.6999. Firm break there will target 161.8% projection at 0.6875.
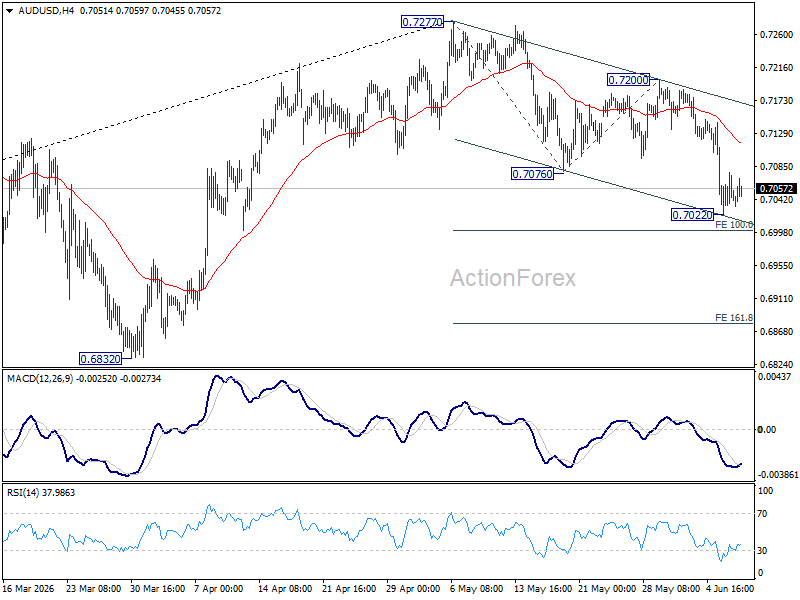
In the bigger picture, considering bearish divergence condition in D MACD, a medium term top could be formed at 0.7277 after failing to sustain above 61.8% retracement o f0.8006 (2021 high) to 0.5913 (2024 low) at 0.7206). Deeper fall could be seen to 38.2% retracement of 5913 to 0.7277 at 0.6756 as a correction. But strong support should be seen there to bring rebound. Consolidations would continue below 0.7277 for a while.

USD/CAD Daily Outlook
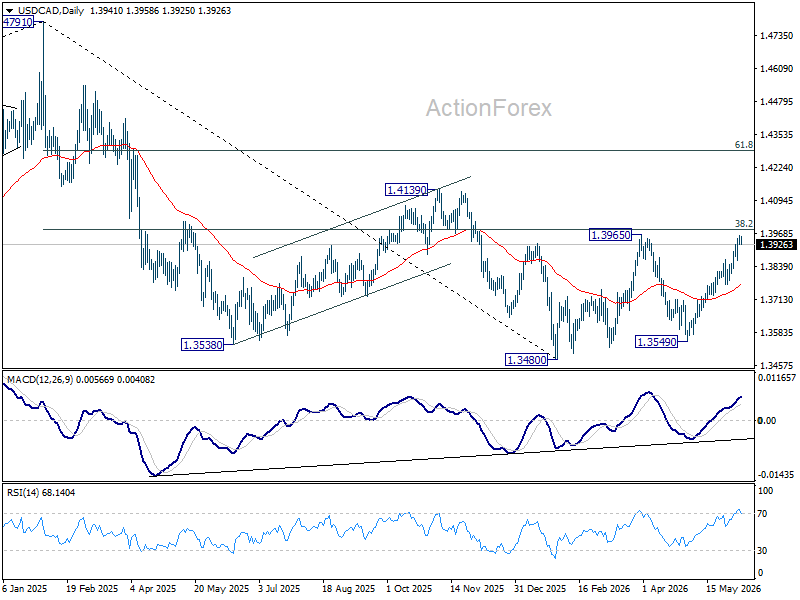
Intraday bias in USD/CAD is turned neutral with current retreat. Further rise is expected as long as 1.3769 support holds.. Above 1.3960 will target 38.2% retracement of 1.4791 to 1.3480 at 1.3981. Decisive break there will carry larger bullish implications and target 61.8% retracement at 1.4290 next.
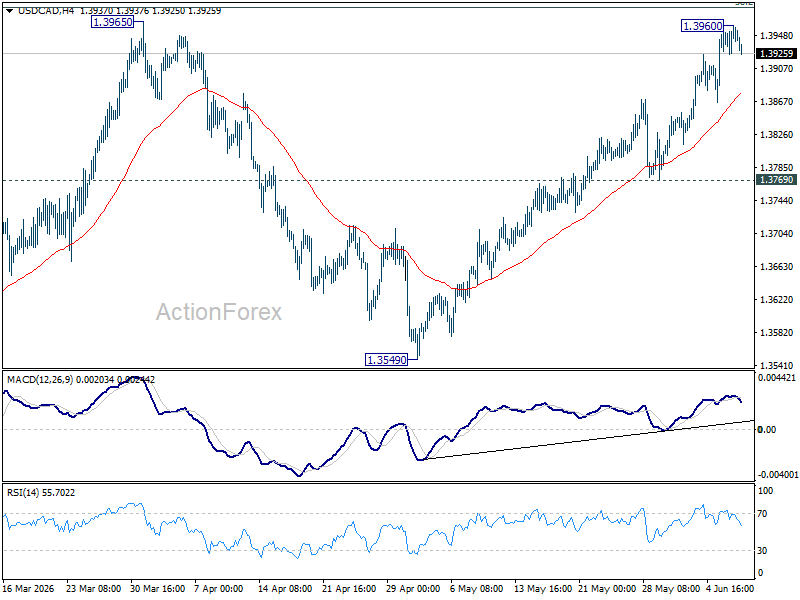
In the bigger picture, price actions from 1.4791 are seen as a corrective pattern to the whole up trend from 1.2005 (2021 low). Rejection by 38.2% retracement of 1.4791 to 1.3480 at 1.3981 will keep the decline intact, and bring another fall through 1.3480 at a later stage. However, firm break of 1.3981 will argue that the decline has completed, and set up further rise back to retest 1.4791 instead.
GBP/JPY Daily Outlook
Intraday bias in GBP/JPY is turned neutral with current recovery. Risk will stay mildly on the downside as long as 215.59 resistance holds. Below 212.90 will target 210.43/211.23 support zone. However, firm break of 215.59 will resume the rebound from 210.43 to retest 216.58 high instead.
In the bigger picture, there is no clear sign of trend reversal yet. The long term up trend could still extend to 61.8% projection of 148.93 (2022 low) to 208.09 (2024 high) from 184.35 at 220.90 on resumption. However, sustained break of 55 W EMA (now at 206.77) will argue that it's already in medium term down trend for 184.35 support.
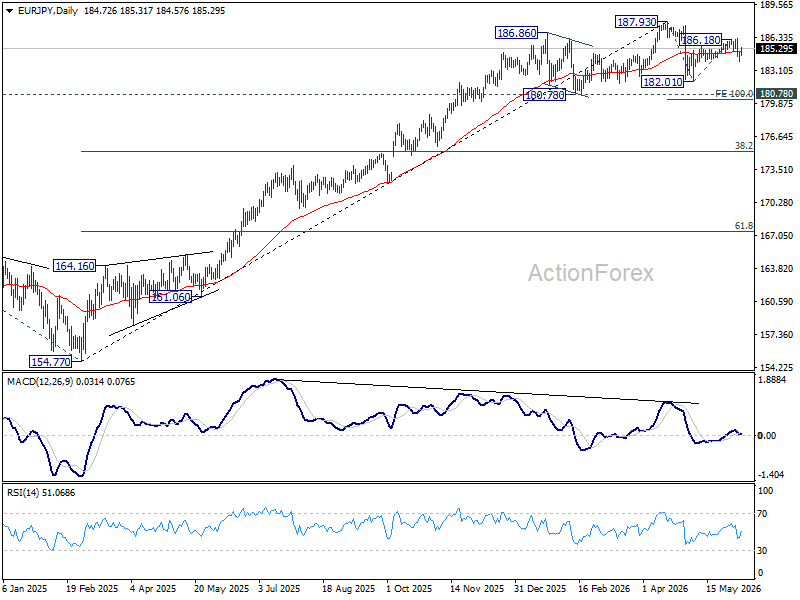
EUR/JPY Daily Outlook
Intraday bias in EUR/JPY is turned neutral first with current recovery. Risk will stay mildly on the downside as long as 186.18 resistance holds. Below 183.95 will bring retest of 182.01 support first. However, firm break of 186.18 will resume the rebound from 182.01 to retest 187.93 high instead.
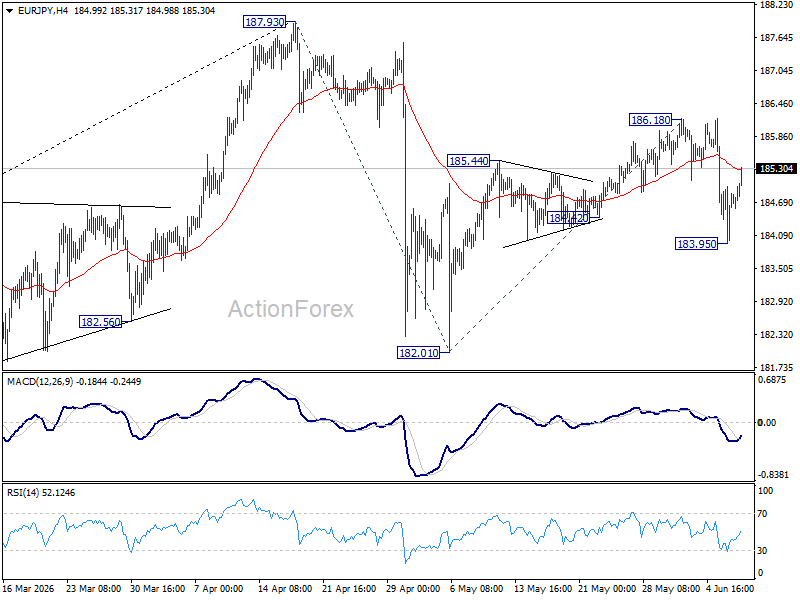
In the bigger picture, there is no sign of reversal yet. Uptrend from 114.42 (2020 low) is still expected to resume at a later stage to 78.6% projection of 124.37 (2022 low) to 175.41 (2025 high) from 154.77 at 194.88. However, sustained break of 55 W EMA (now at 178.95) will argue that it's already in a medium term down trend to 175.41 resistance turned support and below.