Sample Category Title
EUR/JPY Daily Outlook
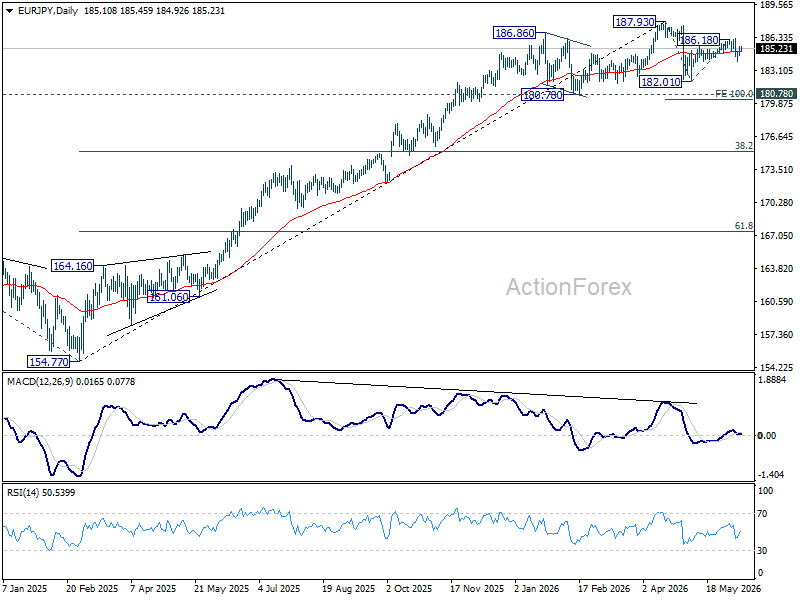
Intraday bias in EUR/JPY remains neutral and risk stay mildly on the downside as long as 186.18 resistance holds. Below 183.95 will bring retest of 182.01 support first. However, firm break of 186.18 will resume the rebound from 182.01 to retest 187.93 high instead.
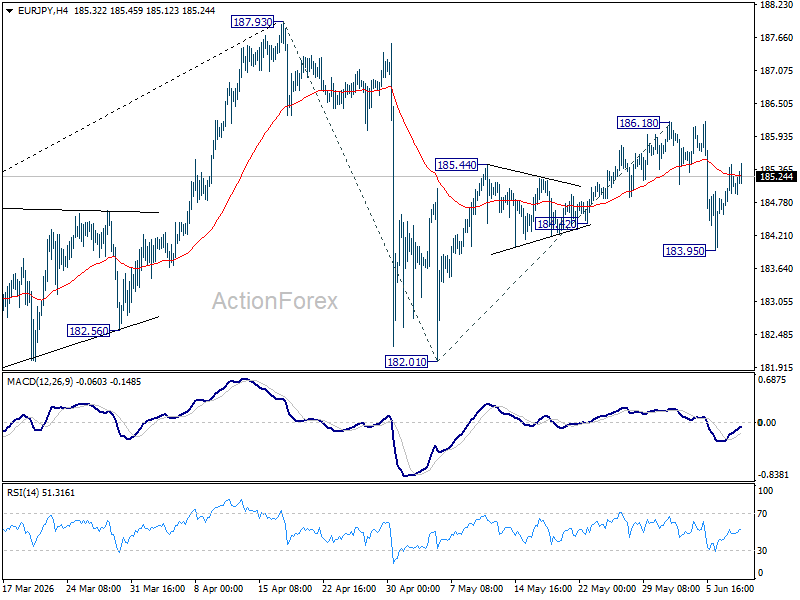
In the bigger picture, there is no sign of reversal yet. Uptrend from 114.42 (2020 low) is still expected to resume at a later stage to 78.6% projection of 124.37 (2022 low) to 175.41 (2025 high) from 154.77 at 194.88. However, sustained break of 55 W EMA (now at 178.95) will argue that it's already in a medium term down trend to 175.41 resistance turned support and below.
EUR/GBP Daily Outlook
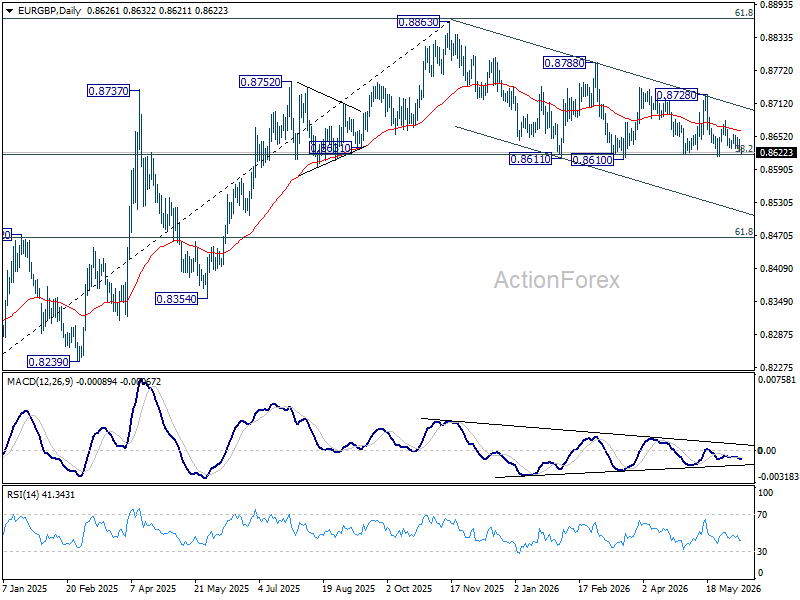
No change in EUR/GBP's outlook as sideway trading continues. Intraday bias remains neutral at this point. On the downside, decisive break of 0.8610 support will revive the case of bearish trend reversal. On the upside, break of 0.8728 resistance will bring stronger rally back towards 0.8740 resistance.
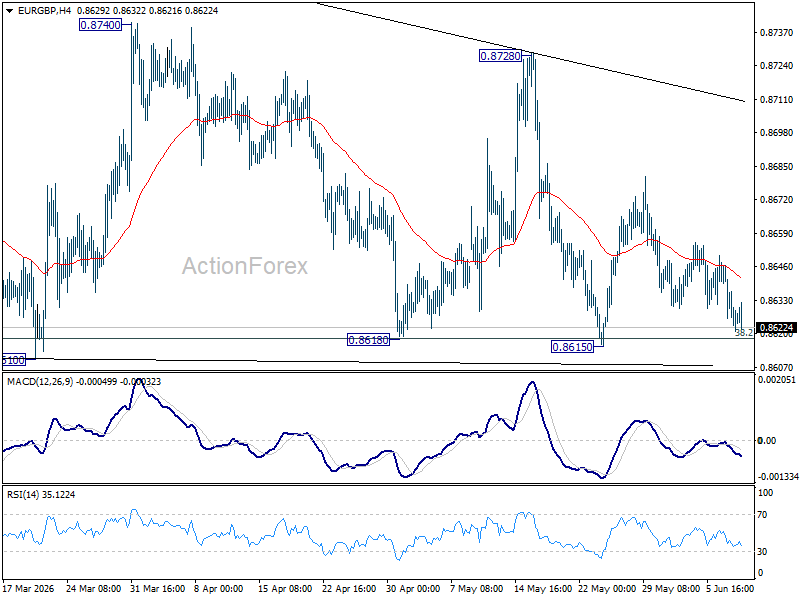
In the bigger picture, focus is staying on 38.2% retracement of 0.8821 to 0.8863 at 0.8618. Strong rebound from there will retain medium term bullishness. Rise from 0.8221 should resume through 0.8863 at a later stage. Nevertheless, sustained break of 0.8618 will confirm that whole rise from 0.8221 has completed at 0.8863. Deeper decline should then be seen to 61.8% retracement at 0.8466 at least.
EUR/AUD Daily Outlook
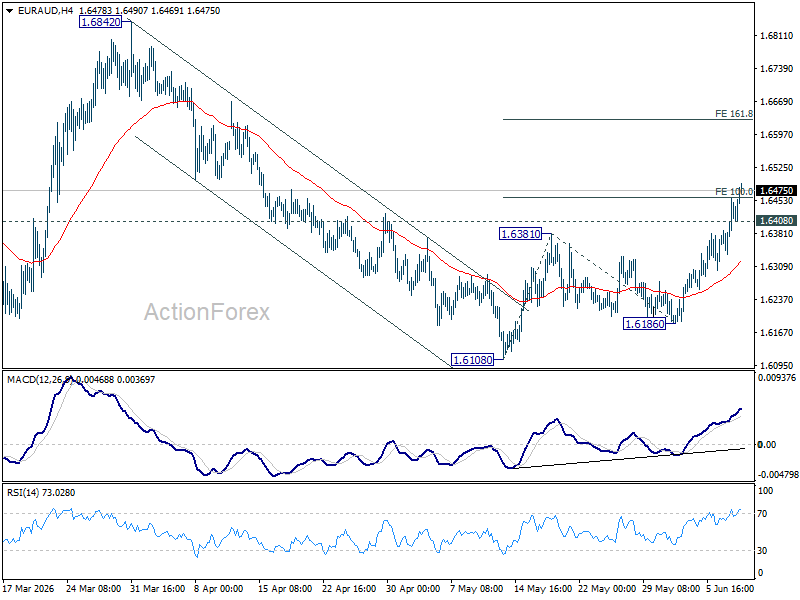
EUR/AUD's rally continues today and broke 100% projection of 1.6108 to 1.6381 from 1.6186 at 1.6459. Intraday bias remains on the upside for 161.8% projection at 1.6628 next. On the downside, below 1.6480 minor support will turn bias neutral and bring consolidations first.
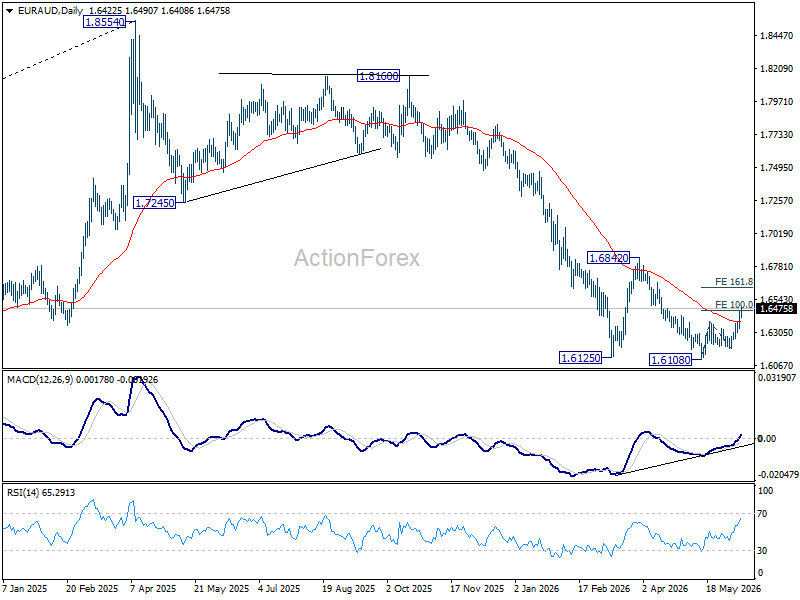
In the bigger picture, outlook will stay bearish as long as 1.6842 resistance holds. Fall from 1.8554 (2025 high) is expected to continue to 61.8% retracement of 1.4281 to 1.8554 at 1.5913. Decisive break there will pave the way back to 1.4281 (2022 low). However, firm break of 1.6842 should confirm medium term bottoming, and bring stronger rally.
EUR/CHF Daily Outlook
EUR/CHF's rise from 0.9094 is still in progress today and intraday bias remains on the upside. Further rally should be seen to 0.9264 resistance first. Firm break there will resume the rise from 0.8979 to 100% projection of 0.8979 to 0.9264 from 0.9094 at 0.9379. On the downside, below 0.9190 minor support will turn intraday bias neutral again.
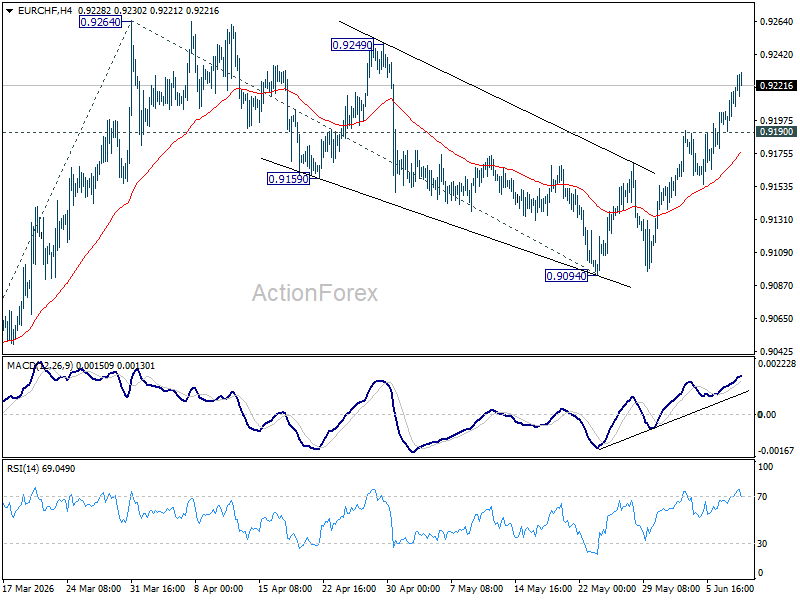
In the bigger picture, as long as 0.9394 resistance holds, down trend from 0.9928 (2024 high) should still be in progress. Firm break of 0.8979 will confirm down trend resumption. However, decisive break of 0.9394 will be an important sign of medium term bullish reversal.
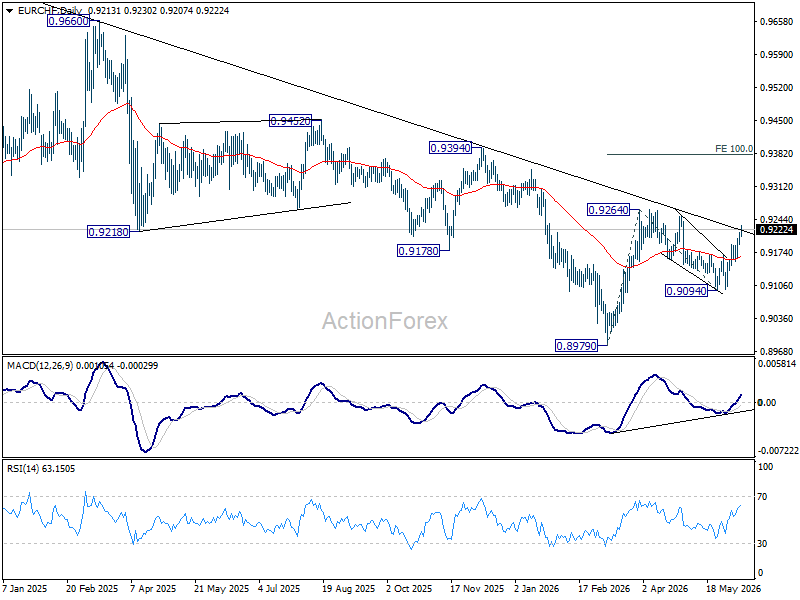
Chart Alert: USD/JPY Advances Toward the Next 161.60/95 Key Intervention Levels
Key takeaways
- USD/JPY remains supported by a widening US-Japan yield differential. Markets are increasingly pricing a more hawkish Federal Reserve, with rising expectations of a Fed rate hike later in 2026, while the Bank of Japan appears likely to slow or pause its bond tapering programme despite an expected rate increase next week.
- The pair is approaching a key intervention zone near 160.40–160.70. Japanese authorities have already spent a record amount defending the yen earlier this year, making this area a critical level where renewed verbal or direct intervention risks may emerge.
- Technical momentum remains constructive in the near term. USD/JPY continues to trade within both a medium-term ascending wedge and a shorter-term rising channel, with momentum indicators remaining supportive of a further advance toward the 160.65, 161.14/20, and 161.60/95 resistance levels.
The US CPI shock and a hawkish Fed
The market enters today’s US CPI print, facing building macro headwinds and energy shocks stemming from the ongoing Middle East conflict. Following a complete evaporation of Fed rate-cut bets for 2026, the market is aggressively positioned for a bear-flattening yield curve environment under Fed Chair Kevin Warsh. With futures now pricing in a 61% probability of a 25-bps hike in October, an upside surprise in today’s CPI, potentially pushing inflation to multi-year highs, will solidify the higher-for-longer regime and maintain structural upward pressure on the greenback.
BoJ’s balancing act - The June rate hike vs. bond taper pause
Next week (June 15-16), the Bank of Japan is widely expected to shift its narrative toward becoming an active “inflation fighter”. Aggregated polls show nearly 94% of economists expect Governor Ueda to deliver a 25-basis-point hike, lifting the short-term policy rate to 1.00% from 0.75%, a level last seen in 1995. This hawkish tilt is directly responsive to the persistent inflationary impulses generated by the US-Iran war.
Crucially, to mitigate political friction with Prime Minister Sanae Takaichi and stabilise a volatile sovereign bond market where the 10-year Japanese Government Bond (JGB) yield has recently hit a 30-year high of 2.8%, the BoJ is leaning towards pausing or slowing its bond-purchase taper next fiscal year.
By freezing further monthly purchase reductions (potentially keeping them steady near 2.1 trillion yen), the central bank hopes to cap the blowout of debt-servicing costs before yields breach the painful 3% threshold.
The 2-year US Treasury/JGB yield spread is widening
Fig. 1: 2-YR & 10-YR US Treasuries/JGBs yield spreads as of 10 Jun 2026 (Source: TradingView). The information presented is historical information, and past performance is not indicative of future performance.
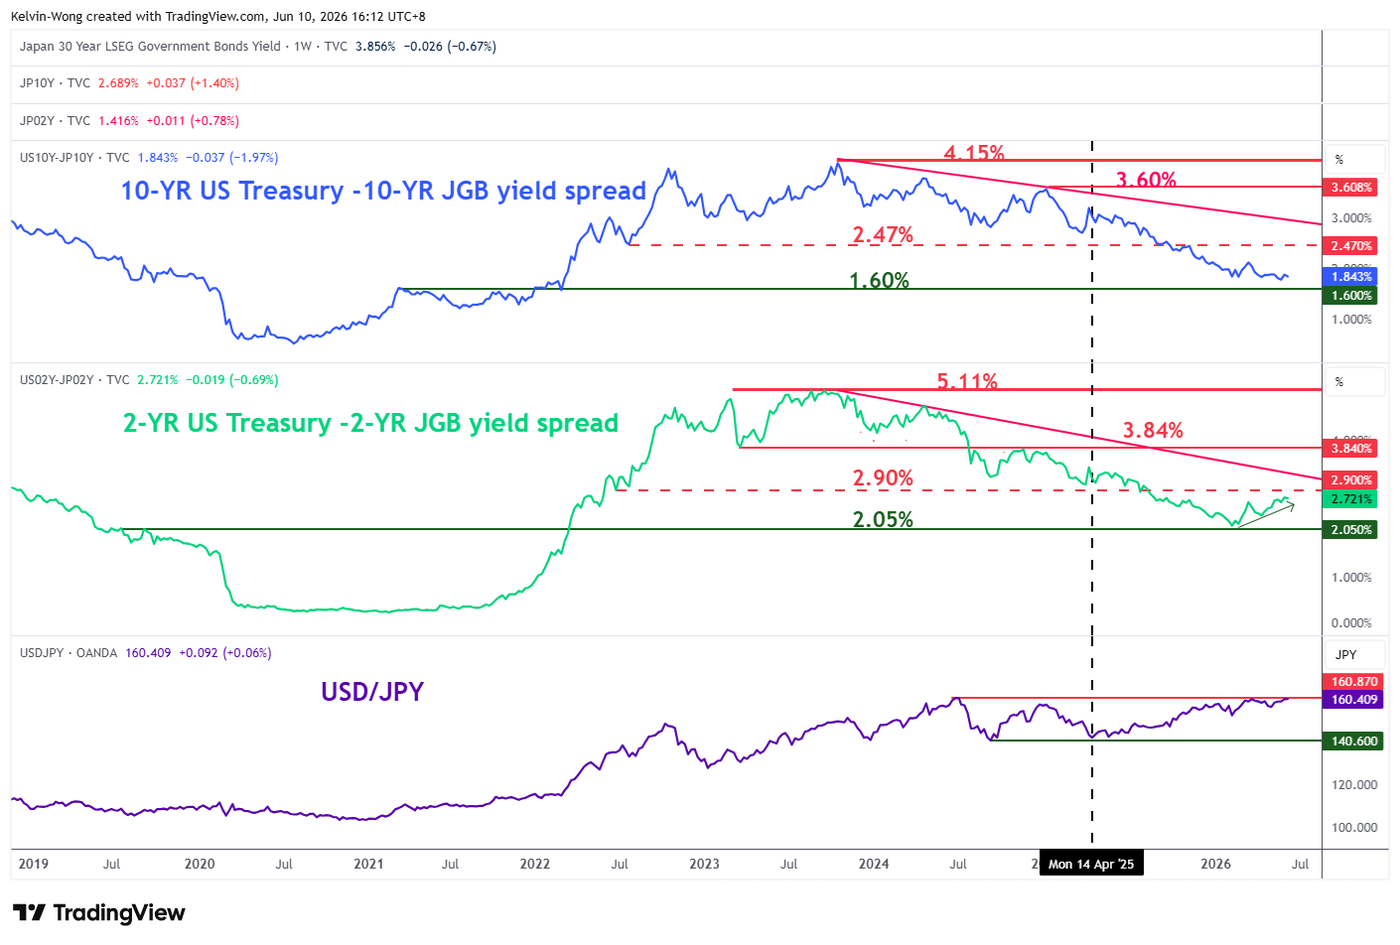
The shorter-term yield spread between the 2-year US Treasury and the Japanese Government Bond (JGB) has started to widen since hitting a 4-year low of 2.12% earlier in February 2026, which is also just a whisker above a major support of 2.05% (see Fig. 1).
The spread of the 2-year US Treasury-JGB yield has rebounded by 60 basis points to 2.72% as of Wednesday, 9 June 2026, which implies that the US Federal Reserve is adopting a more hawkish monetary policy stance over the Bank of Japan, in turn putting downside pressure on the Japanese yen as it flirts around the prior intervention area of 160.40/70, where Vice Finance Minister Mimura, in charge of foreign exchange issued a “final verbal warning” to speculators on 30 April 2026 before actual intervention took place on the same day.
Japanese authorities have spent a record $ 74.1 billion in the latest round of FX intervention to buy yen between 30 April 2026 and 6 May 2026, according to Finance Ministry data.
Let’s now unpack the short-term trajectory (1 to 3 days) of the USD/JPY from a technical analysis perspective.
Grinding up towards “Ascending Wedge” upper boundary at 160.60/95
Fig. 2: USD/JPY medium-term trend as of 10 Jun 2026 (Source: TradingView). The information presented is historical information, and past performance is not indicative of future performance.
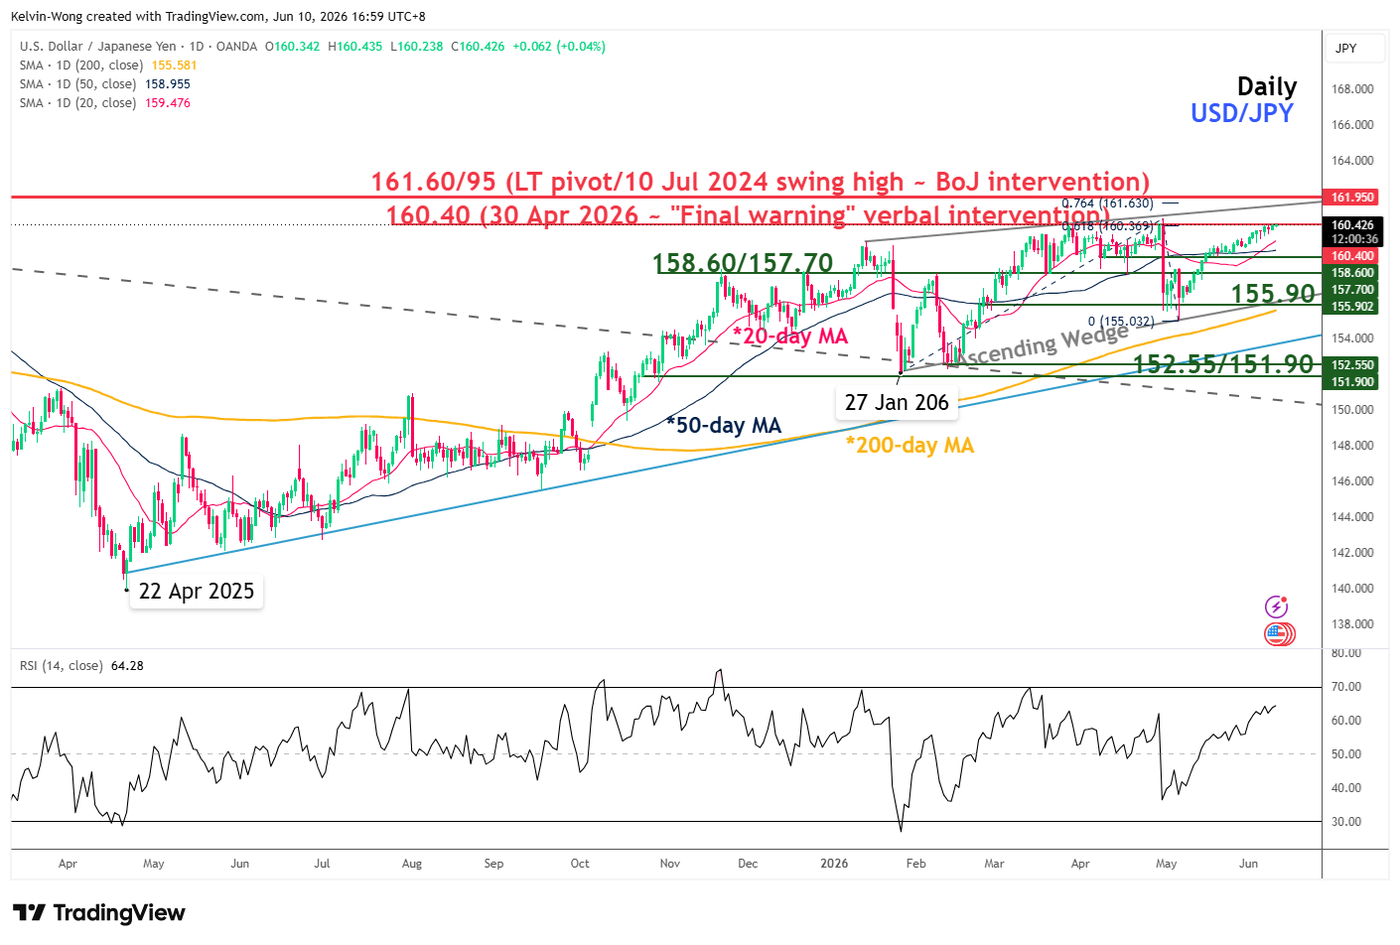
Fig. 3: USD/JPY minor trend as of 10 Jun 2026 (Source: TradingView). The information presented is historical information, and past performance is not indicative of future performance.
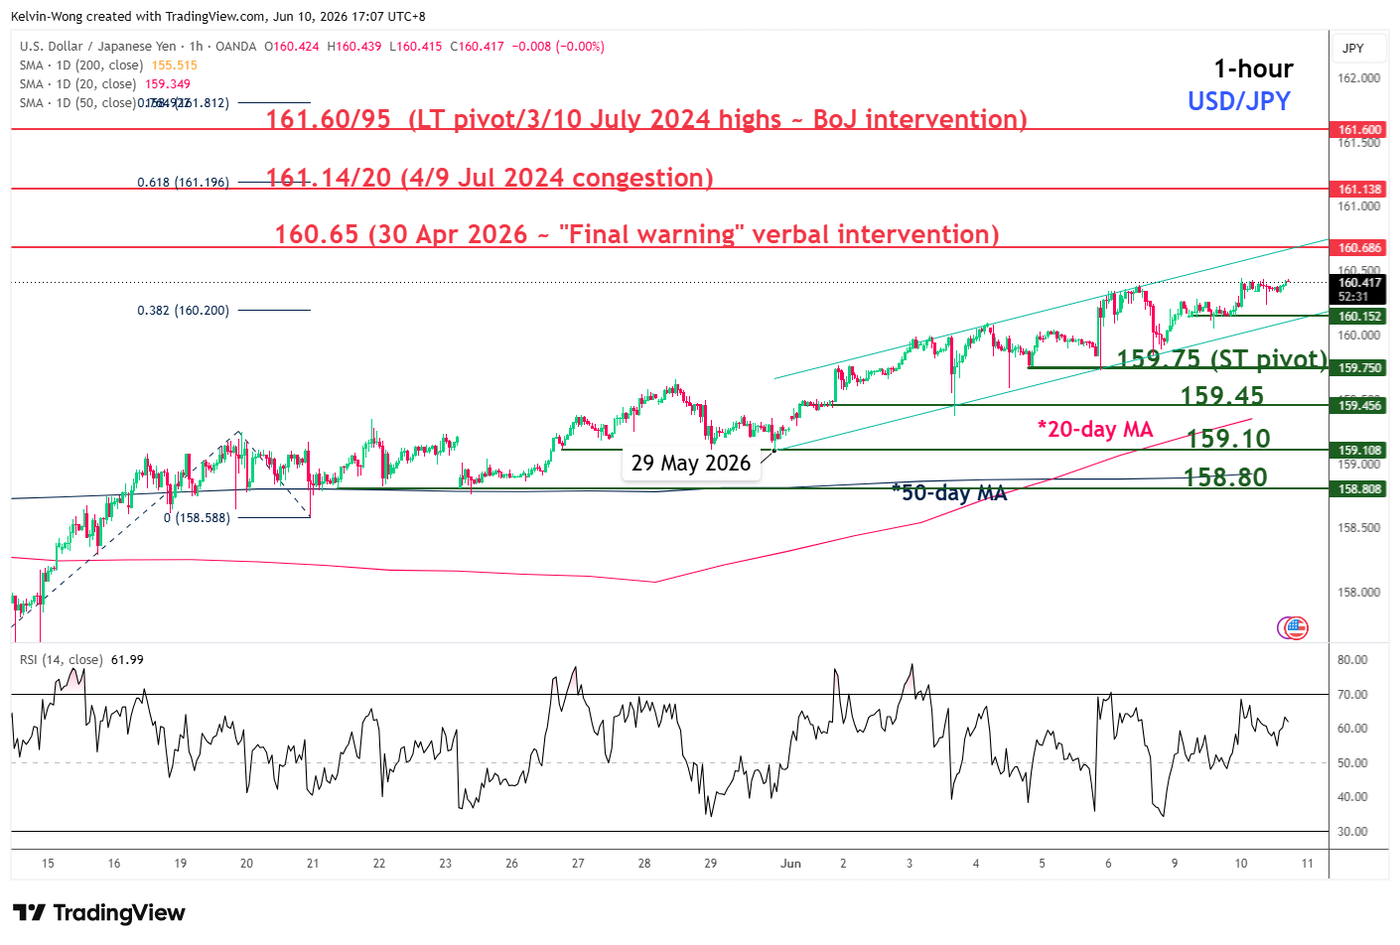
Trend bias: Minor uptrend with key short-term support pivotal at 159.75.
Resistances: 160.65 (30 Apr 2026 high), 161.14/20 (4/9 Jul 2024 congestion & Fibonacci extension), 161.60/95 (long-term pivot) (see Fig. 3).
Next supports: 159.45 (1/3 Jun 2026 congestion & 20-day MA), 159.10 (29 May 2026 low), 158.80 (21/25 May 2026 low & 50-day MA).
Key elements to support the short-term bullish bias on USD/JPY
- Price actions of the USD/JPY have been oscillating within a medium-term “Ascending Wedge” configuration since the 27 January 2026 low, with its upper boundary coming in at 161.60/95 (see Fig.2).
- The recent minor uptrend phase remains intact, as price action in USD/JPY continues to evolve within a minor ascending channel in place from the 29 May 2026 low at 159.10 (see Fig. 3).
- The hourly RSI momentum indicator remains short-term bullish, holding above the 50 level (see Fig. 3).
Oil: Escalation Is No Reason for a Rally
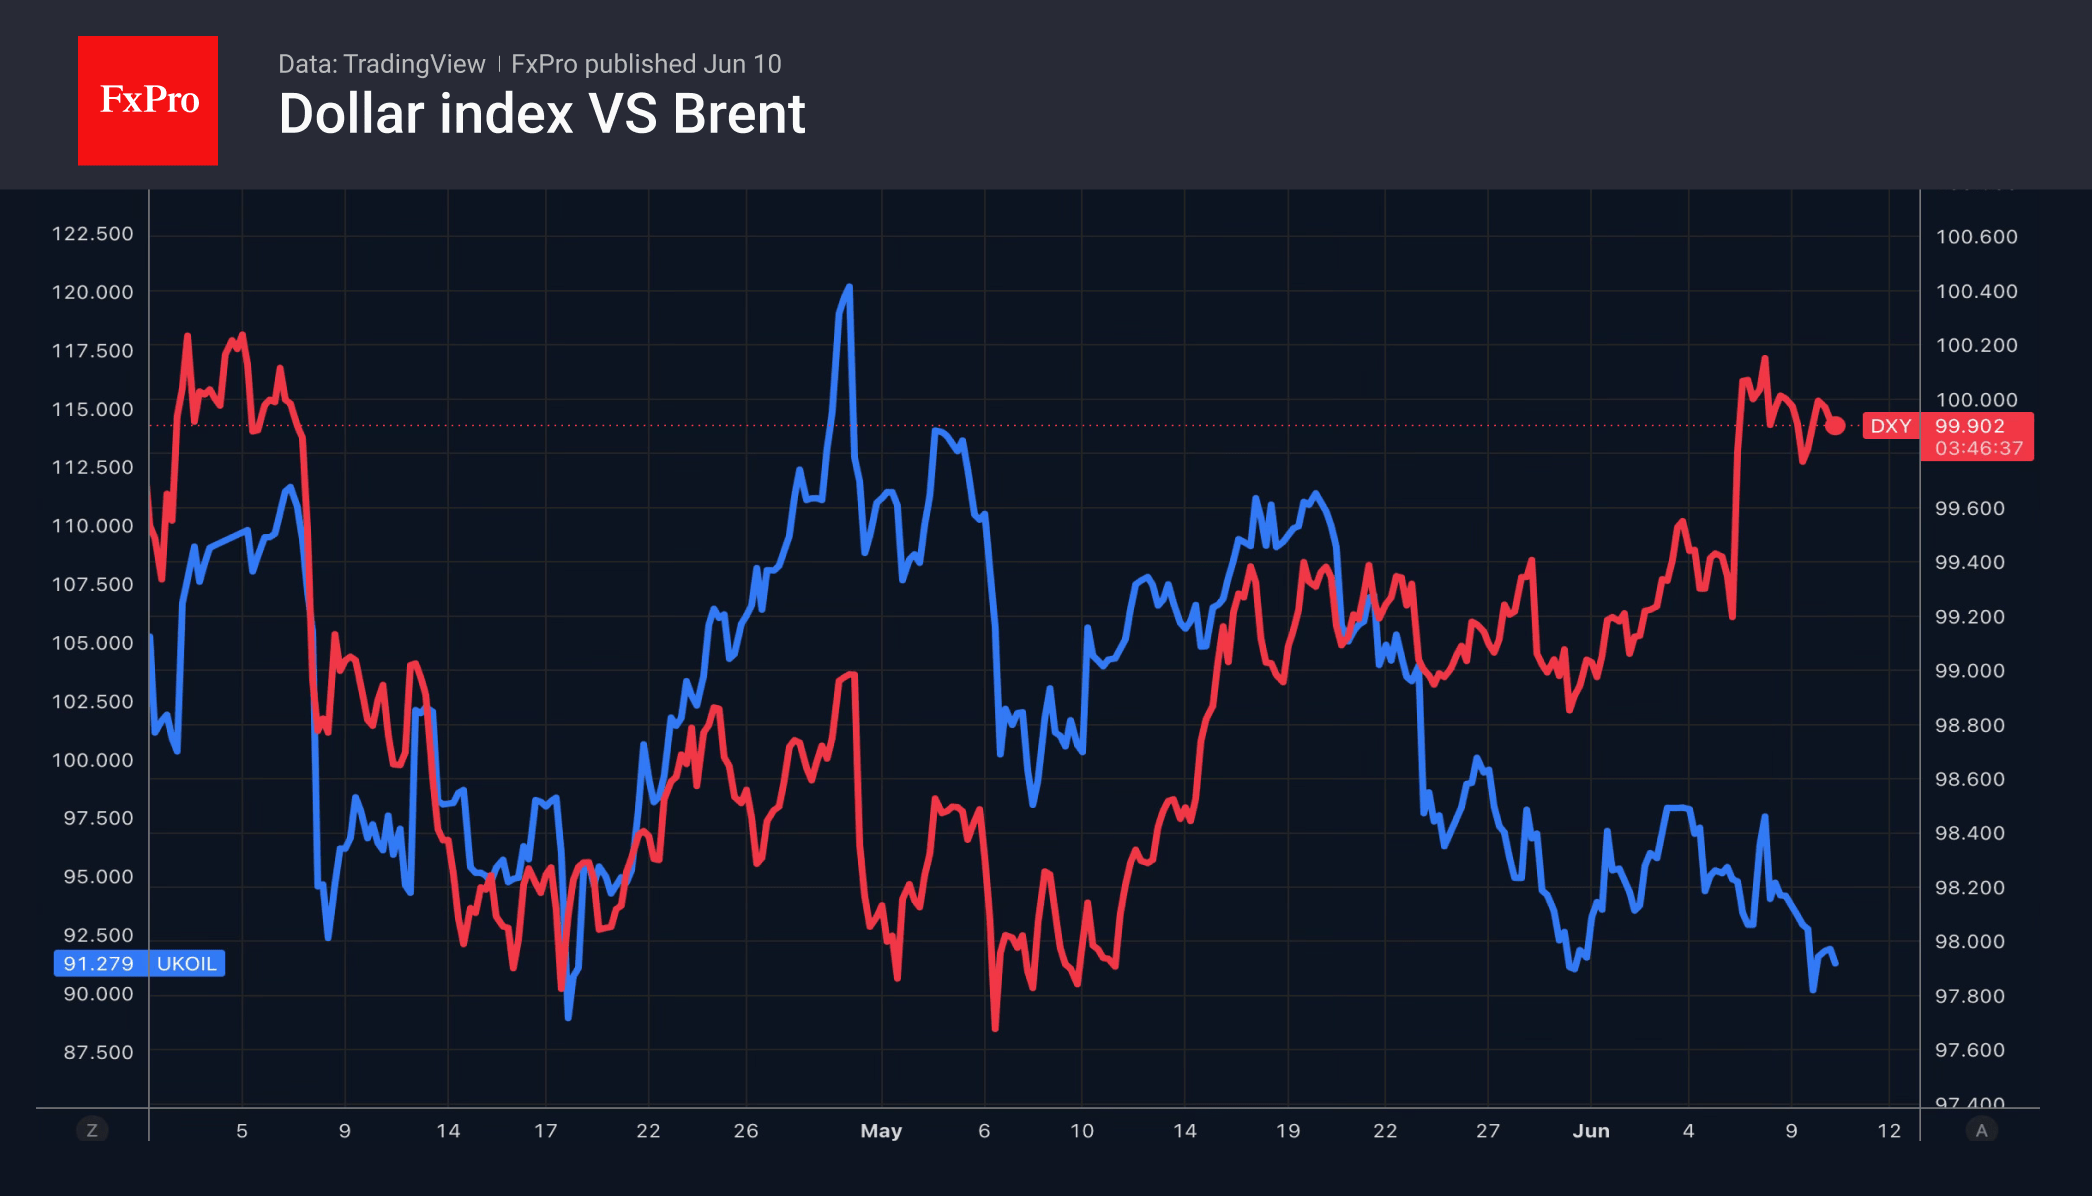
- The escalation in the Middle East has not led to a rise in Brent prices.
- The US dollar has been unable to capitalise on the favourable oil situation.
The US dollar has recorded modest gains amid the recent escalation of the conflict in the Middle East, while oil prices have fallen. This is typical behaviour during a relatively smooth reassessment of monetary policy prospects, rather than a nervous reaction to geopolitical events. A barrel of Brent crude is trading around $91, close to the lower end of the range over the past three months, despite clear signs of global stockpile depletion.
According to S&P Global Energy research, 500 million barrels are needed to replenish oil stocks outside the Persian Gulf. In other words, to return stocks to February levels by the end of the year, a surplus of 1 million barrels per day is required.
However, the market is paying more attention to the balance than to stocks. Brent is trading 30% above pre-conflict levels in the Middle East. At the same time, high prices are reducing global demand. China is a clear example, with oil imports falling to 7.8 million bpd in May, the lowest level in eight years. By comparison, the average for 2025 was almost 4 million bpd higher.
Coupled with record US energy exports, Saudi Arabia’s price cuts for its customers, and the resumption of supplies from Kuwait to Asia, these developments point to the oil market having adapted in recent weeks. Without this, oil would have been set to rise amid a 9.12-million-barrel decline in commercial stocks over the week and eight consecutive weeks of declines.
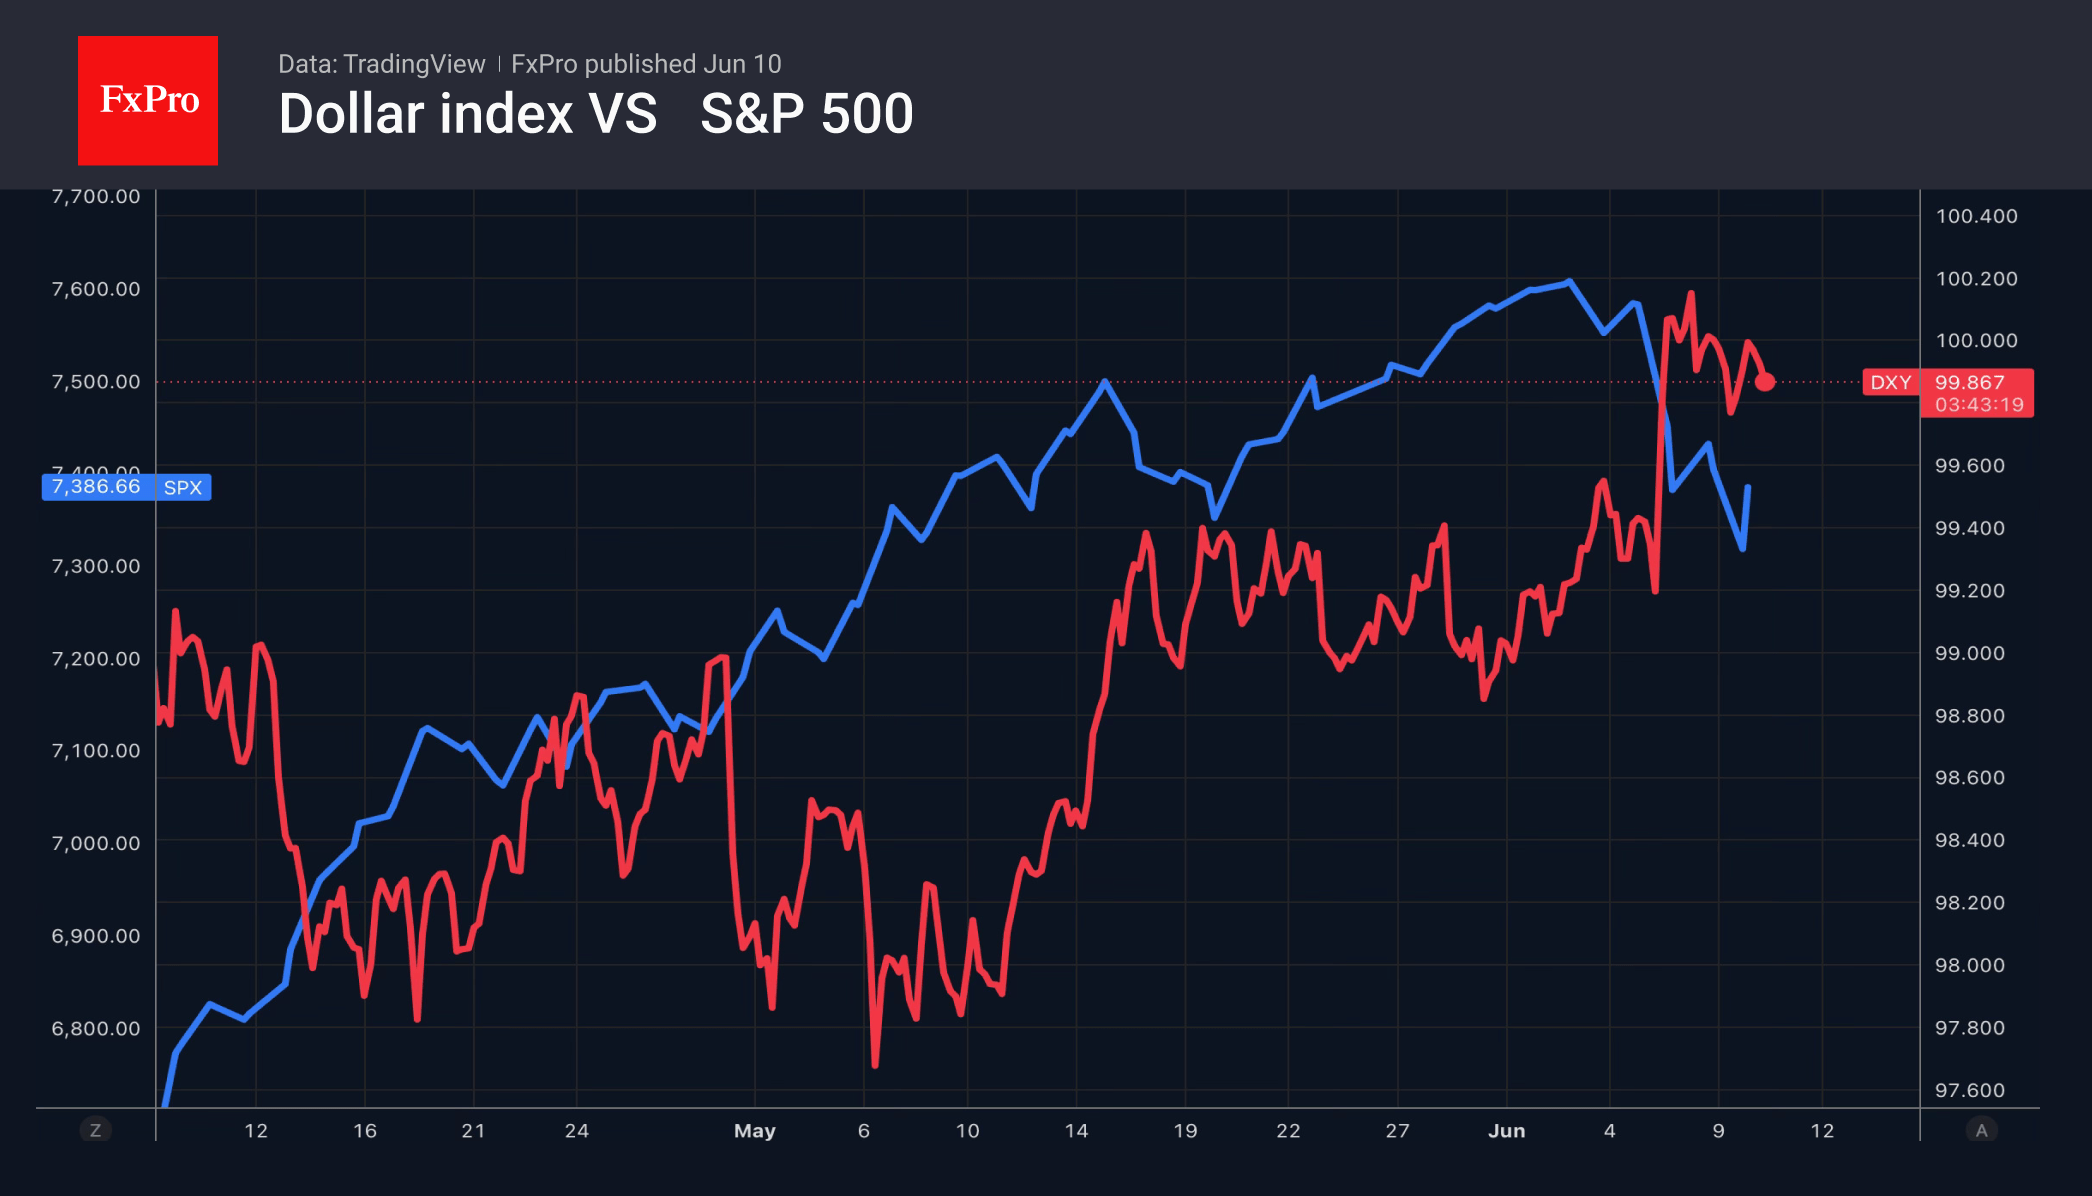
Without oil support, the US dollar is currently out of its depth. Neither the high demand for safe-haven assets nor the decline in global risk appetite—evident in the sell-off in equities and gold—is supporting the greenback. Fears that inflation will surge to three-year highs in May are fuelling rumours of a Fed rate hike and triggering sell-offs in tech stocks and the S&P 500.
Could inflation figures help the US dollar? Only if there are clear signs of accelerating price growth that even Warsh cannot ignore.
Bitcoin’s 200-Week Ma: History Points to an 11-Month Wait
Market Overview
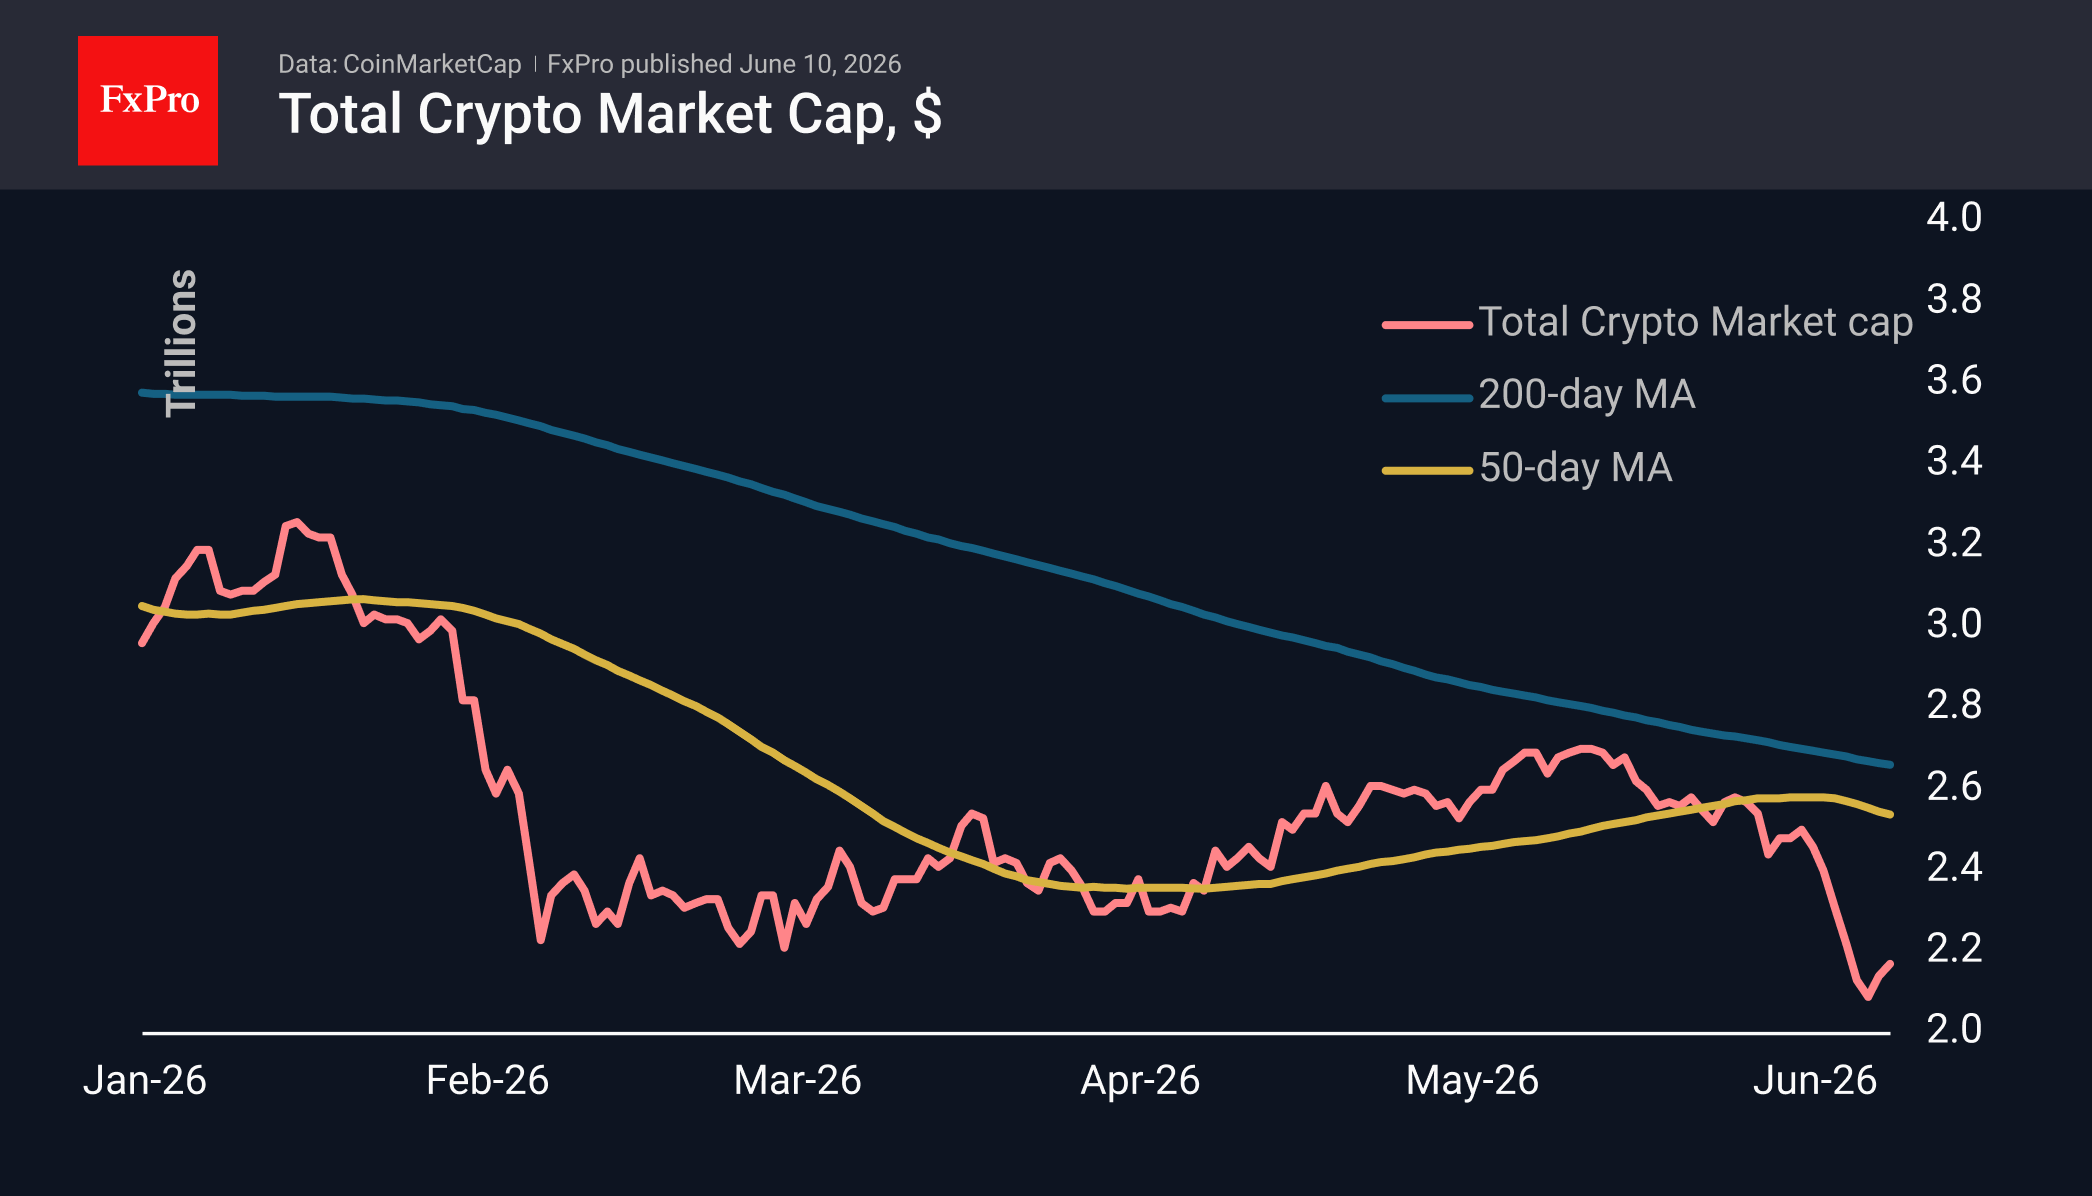
The crypto market capitalisation has fallen by 2.7% to $2.12T, failing to establish a sustainable growth trajectory. At the time of writing, the market has not yet reached Friday’s lows, but it is quite possible that it will test this support level again before the end of the day as the rebound momentum fades. The top coins that fell the most over the day were Stellar (-7.9%), Dash (-7.6%) and Zcash (-7.3%), while SushiSwap (+0.7%), Cosmos (+0.7%) and Immutable (+0.5%) outperformed the market with minimal gains.
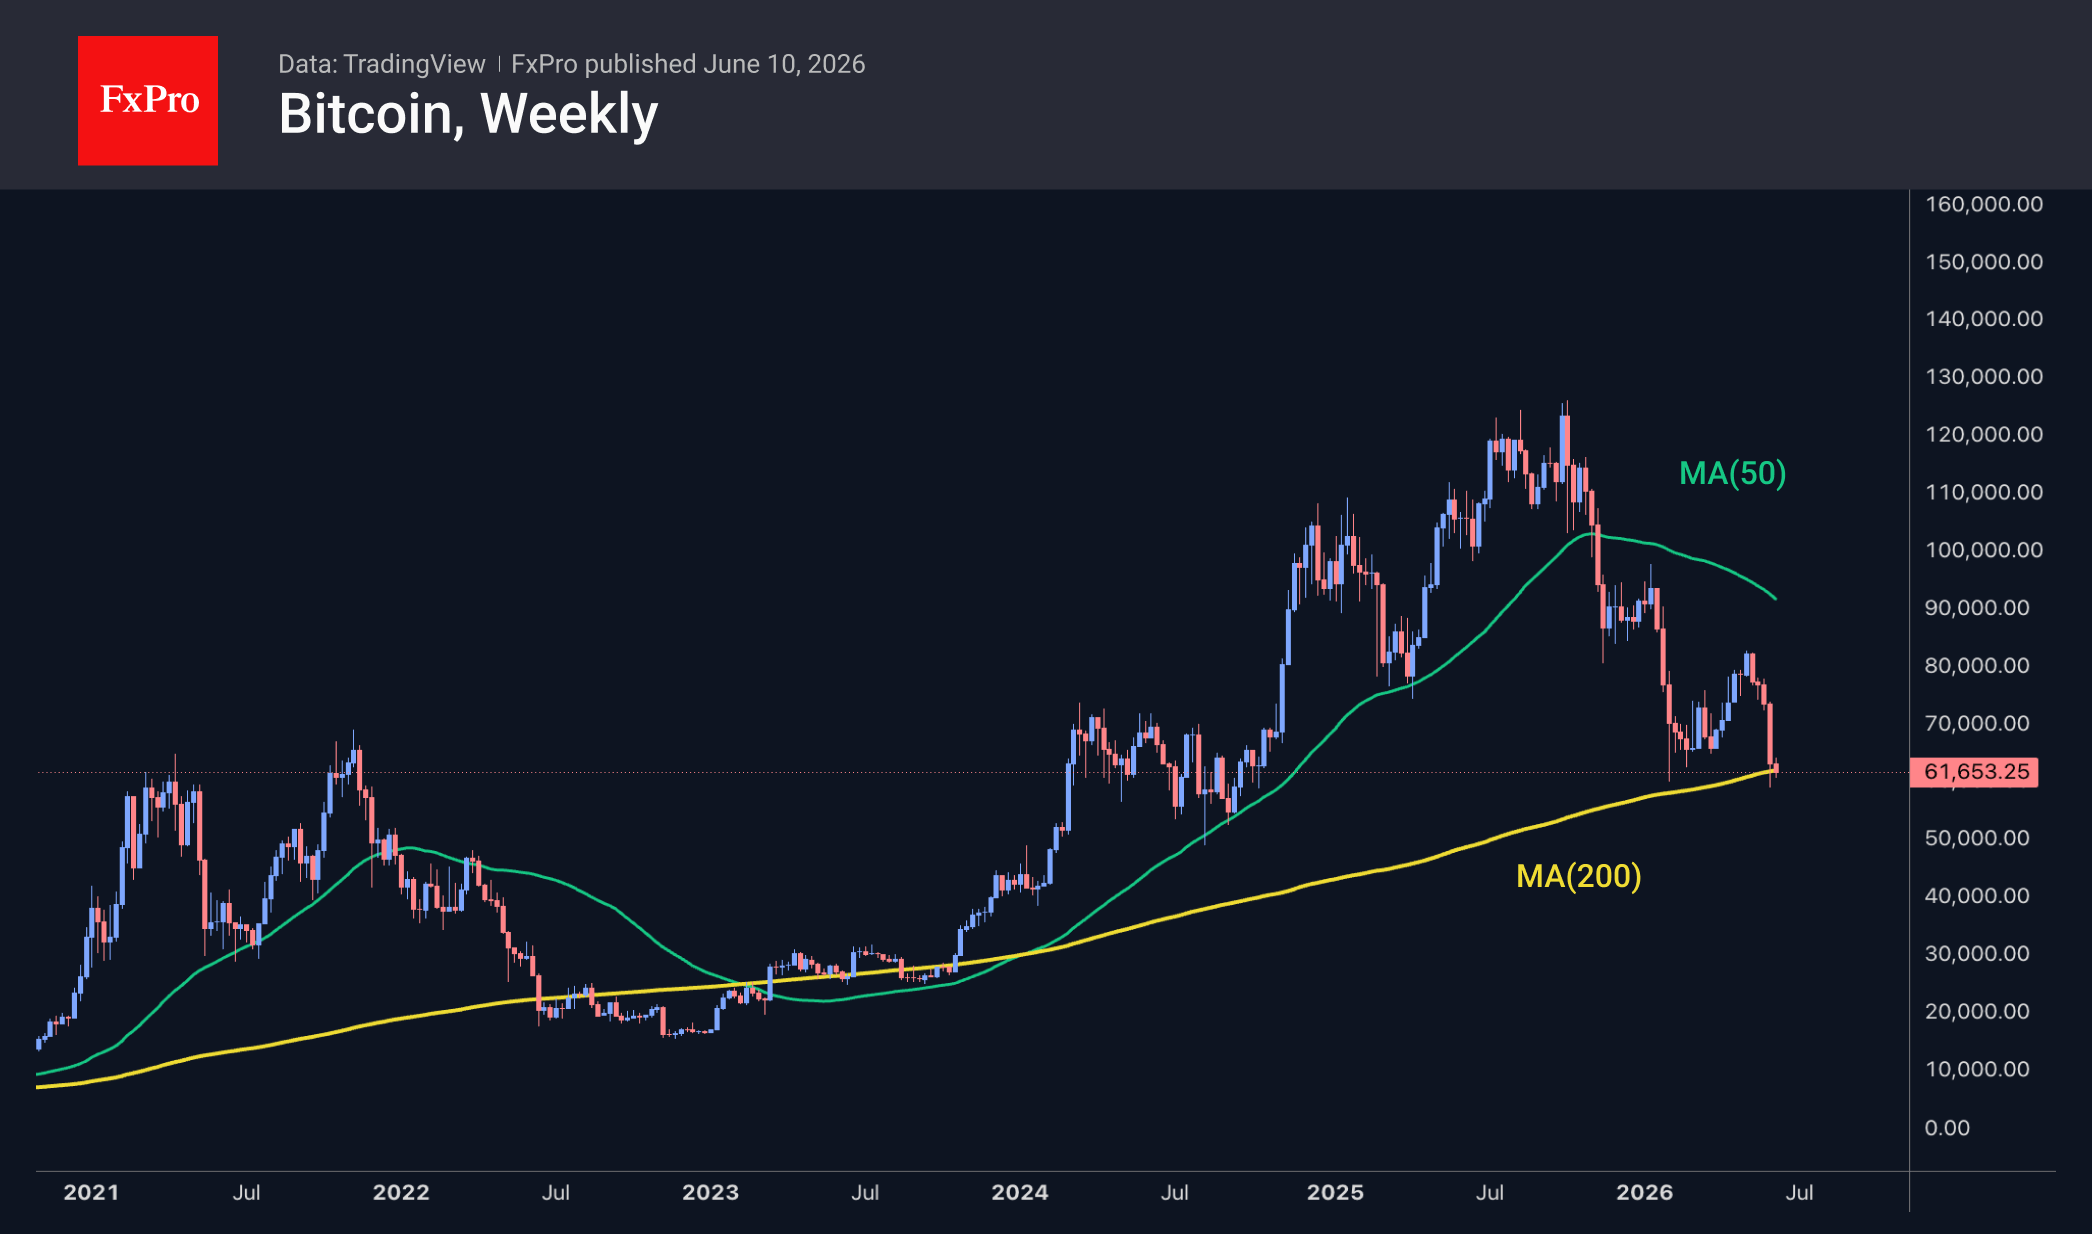
Bitcoin fell below the $61K level again on Tuesday amid a renewed decline in stock indices. This was followed by a slight rebound and current price stabilisation near $61.5K. It appears that a sell-on-rally trend is prevailing in the leading cryptocurrency. The history of the 200-week moving average over the last 11 years (prior to this, the market had not dipped below it) shows that the average time spent near it is almost 11 months, suggesting a very long bear market. The exception was the Covid crash in March 2020, as the subsequent policy of easy central bank money and spending restrictions led to a rapid price recovery. As markets expect interest rate hikes, we should not count on a short-term rebound until there is a global extreme shock.
News Background
CryptoQuant has observed an increase in inflows to Bitcoin exchanges of coins that have been dormant for between three months and a year. Such activity by medium-term investors could create additional selling pressure and hinder the recovery.
The recent decline in BTC was driven by spot market selling rather than speculative activity in the derivatives market, according to 10X Research, which expects a short-term recovery in Bitcoin by the end of the week.
Two key factors will influence Bitcoin in the second half of the year: Strategy’s ability to fund $1.7 billion in dividend payments and the passage of the US CLARITY bill on stablecoin yields, according to JPMorgan. CLARITY could not only clarify the regulatory framework for the US crypto market but also bolster confidence in the crypto industry and support the inflow of corporate capital.
Major US financial firms view Bitcoin’s recent drop to $60K as a good opportunity to replenish their reserves, rather than a cause for concern, according to Coinbase. They view Bitcoin as a long-term asset worth accumulating.
Strategy shareholders have approved a change to the dividend payment schedule for STRC preference shares. Instead of monthly payments, the company will pay dividends twice a month, in half-payments. Strategy CEO Fong Le believes this should stabilise the value of the shares, increase liquidity and boost demand for them.
AUD/USD Faces 0.70 Breakdown If US Core CPI Tops 3%
AUD/USD is sitting on the edge of a cliff, and US inflation data may determine whether it falls.
Global markets have struggled to regain their footing after last week's selloff. Attempts to revive the AI trade have faded quickly, while concerns over persistent inflation and renewed US-Iran tensions continue to weigh on sentiment. The combination has created a fragile environment where investors are increasingly focused on one question: is inflation becoming a bigger problem again in the US?
Today's CPI report could provide the answer. Markets already expect headline inflation to jump from 3.8% to 4.2%, with core CPI rising from 2.8% to 2.9%. But the number that matters most may be 3%. If core inflation pushes above that threshold, investors could be forced to seriously consider the possibility that Fed would return tightening. Following last week's strong payrolls report, policymakers have little reason to worry about labor-market weakness. Inflation is now the main story.
That matters because the market's triple threat remains fully intact. AI valuation concerns continue to hang over equities. The Middle East conflict continues to threaten energy markets and inflation. And stronger inflation would reinforce higher-for-longer interest-rate expectations. Together, these forces create a difficult environment for risk-sensitive currencies.
Australian Dollar sits near the center of that storm. Traditionally, Aussie struggles when risk appetite deteriorates and Dollar strengthens. But the currency faces an additional challenge this time. Earlier this year, investors aggressively priced further RBA tightening as inflation remained stubbornly high. That narrative is now being reassessed.
The RBA has already delivered three consecutive rate hikes, taking the cash rate to 4.35%. Yet recent economic data have become noticeably softer. Employment indicators have weakened, consumer spending has lost momentum, and confidence measures remain subdued. While another hike later this year cannot be ruled out, the market is becoming increasingly skeptical that policymakers will need to do much more.
That shift is already visible. Major Australian banks including CBA and NAB now believe the tightening cycle is over, expecting rates to remain at 4.35% through the end of next year. This repricing has removed an important source of support for Aussie.
The problem is not that RBA has become dovish. Rather, markets previously expected far more tightening than now appears likely. As those expectations unwind, Australian Dollar has struggled to maintain upward momentum.
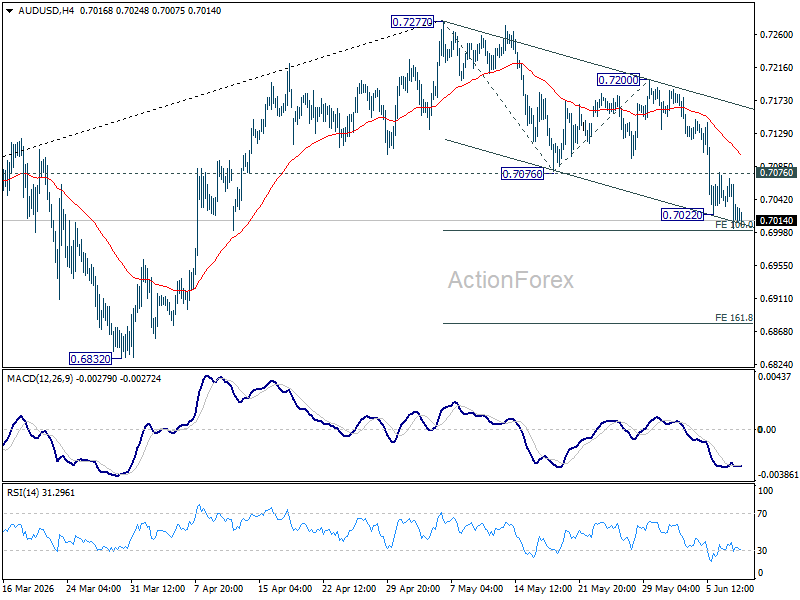
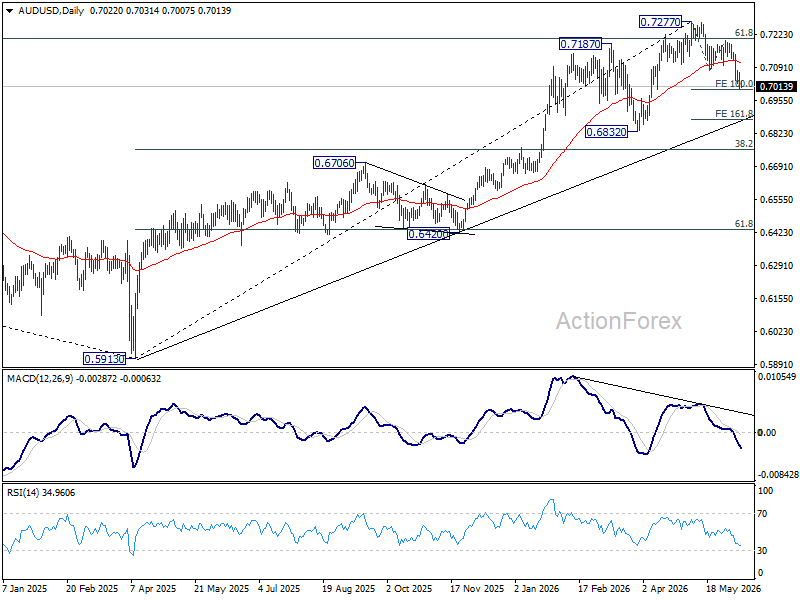
Technically, AUD/USD's fall from 0.7277 resumed after brief consolidations and intraday bias is back on the downside. Immediate focus is now on 100% projection of 0.7277 to 0.7076 from 0.7200 at 0.6999. Firm break there could prompt downside acceleration and target 161.8% projection at 0.6875, or even further to 0.6832 structural support before finding a bottom.
The market is already nervous. A hotter inflation reading could be the catalyst that turns caution into outright risk aversion—and AUD/USD into one of its clearest casualties.
Gold (XAU/USD) Faces Persistent Selling Pressure
Gold (XAU/USD) fell to 4,174 USD per troy ounce on Wednesday, reaching its lowest level since late March.
Pressure on the precious metal intensified following a new escalation of tensions in the Middle East. The US launched strikes against Iranian targets after reports that an American helicopter had been shot down. This latest development has once again raised doubts about the durability of the current truce and the prospects for a broader peace agreement.
Another key factor remains the situation surrounding the Strait of Hormuz. Ongoing disruptions to shipping through the region continue to constrain energy supplies and support elevated oil prices. These disruptions, in turn, are fuelling concerns that inflationary pressures across the global economy may persist for longer than expected.
Higher energy costs are prompting investors to reassess the monetary policy outlook for major central banks. Markets are increasingly pricing in a prolonged period of elevated interest rates and are no longer ruling out additional policy tightening if inflation remains stubbornly high.
Investor focus is now on upcoming US inflation data, which could provide important clues regarding the Federal Reserve’s next steps. The US dollar is also receiving support from strong labour market figures, which have reinforced expectations that the Fed could consider another interest rate increase before the end of the year.
As a result, the outlook for Gold (XAU/USD) remains broadly bearish.
Technical Analysis
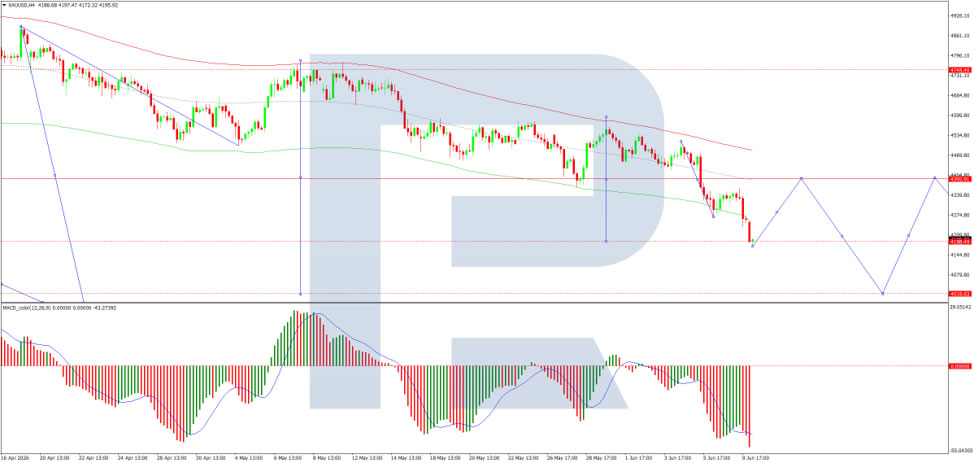
On the H4 chart, XAU/USD is trading within a consolidation range around the 4,393 USD level before breaking lower and extending its decline to 4,175 USD. A corrective rebound towards 4,390 USD is possible in the near term, after which the market may resume its decline towards 4,238 USD, with scope for a further move to 4,088 USD.
The MACD indicator confirms the prevailing bearish momentum. Its signal line remains below the centre line and continues to point firmly downwards, although early signs of a potential reversal are emerging.
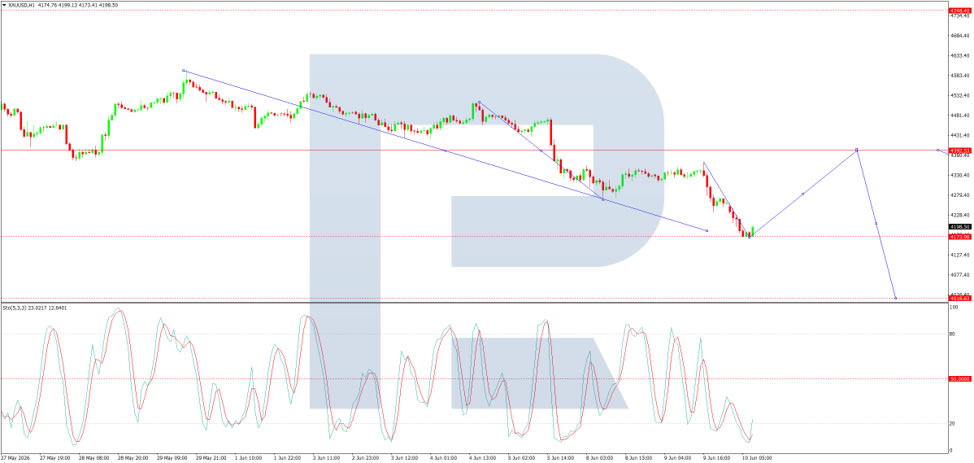
On the H1 chart, the market broke below the 4,270 USD level and moved lower towards 4,175 USD. A corrective recovery towards 4,329 USD, as a retest from below, is possible before another decline towards 4,088 USD. After that, a broader rebound towards 4,390 USD may develop.
The Stochastic oscillator supports this scenario. Its signal line remains below the 20 level but is beginning to turn upwards towards 80, indicating that a short-term corrective recovery may be gathering momentum.
Conclusion
Gold remains under significant pressure as geopolitical tensions, elevated energy prices, and expectations of prolonged restrictive monetary policy continue to support the US dollar. While technical indicators suggest a short-term corrective rebound, the broader outlook remains bearish unless market sentiment or inflation expectations change materially.
Bitcoin $BTCUSD Elliott Wave Analysis: Forecasting the Path
Hello traders. In this technical article we’re going to look at the Elliott Wave charts of Bitcoin (BTCUSD) published in members area of the website. As our members know, we have been calling for the decline in BTCUSD since last year. The crypto market has continued to trade lower as expected. The main target area has not been reached yet, and we believe further downside may be seen in the coming days.
In this discussion, we will break down the Elliott Wave forecast and present the target zone.
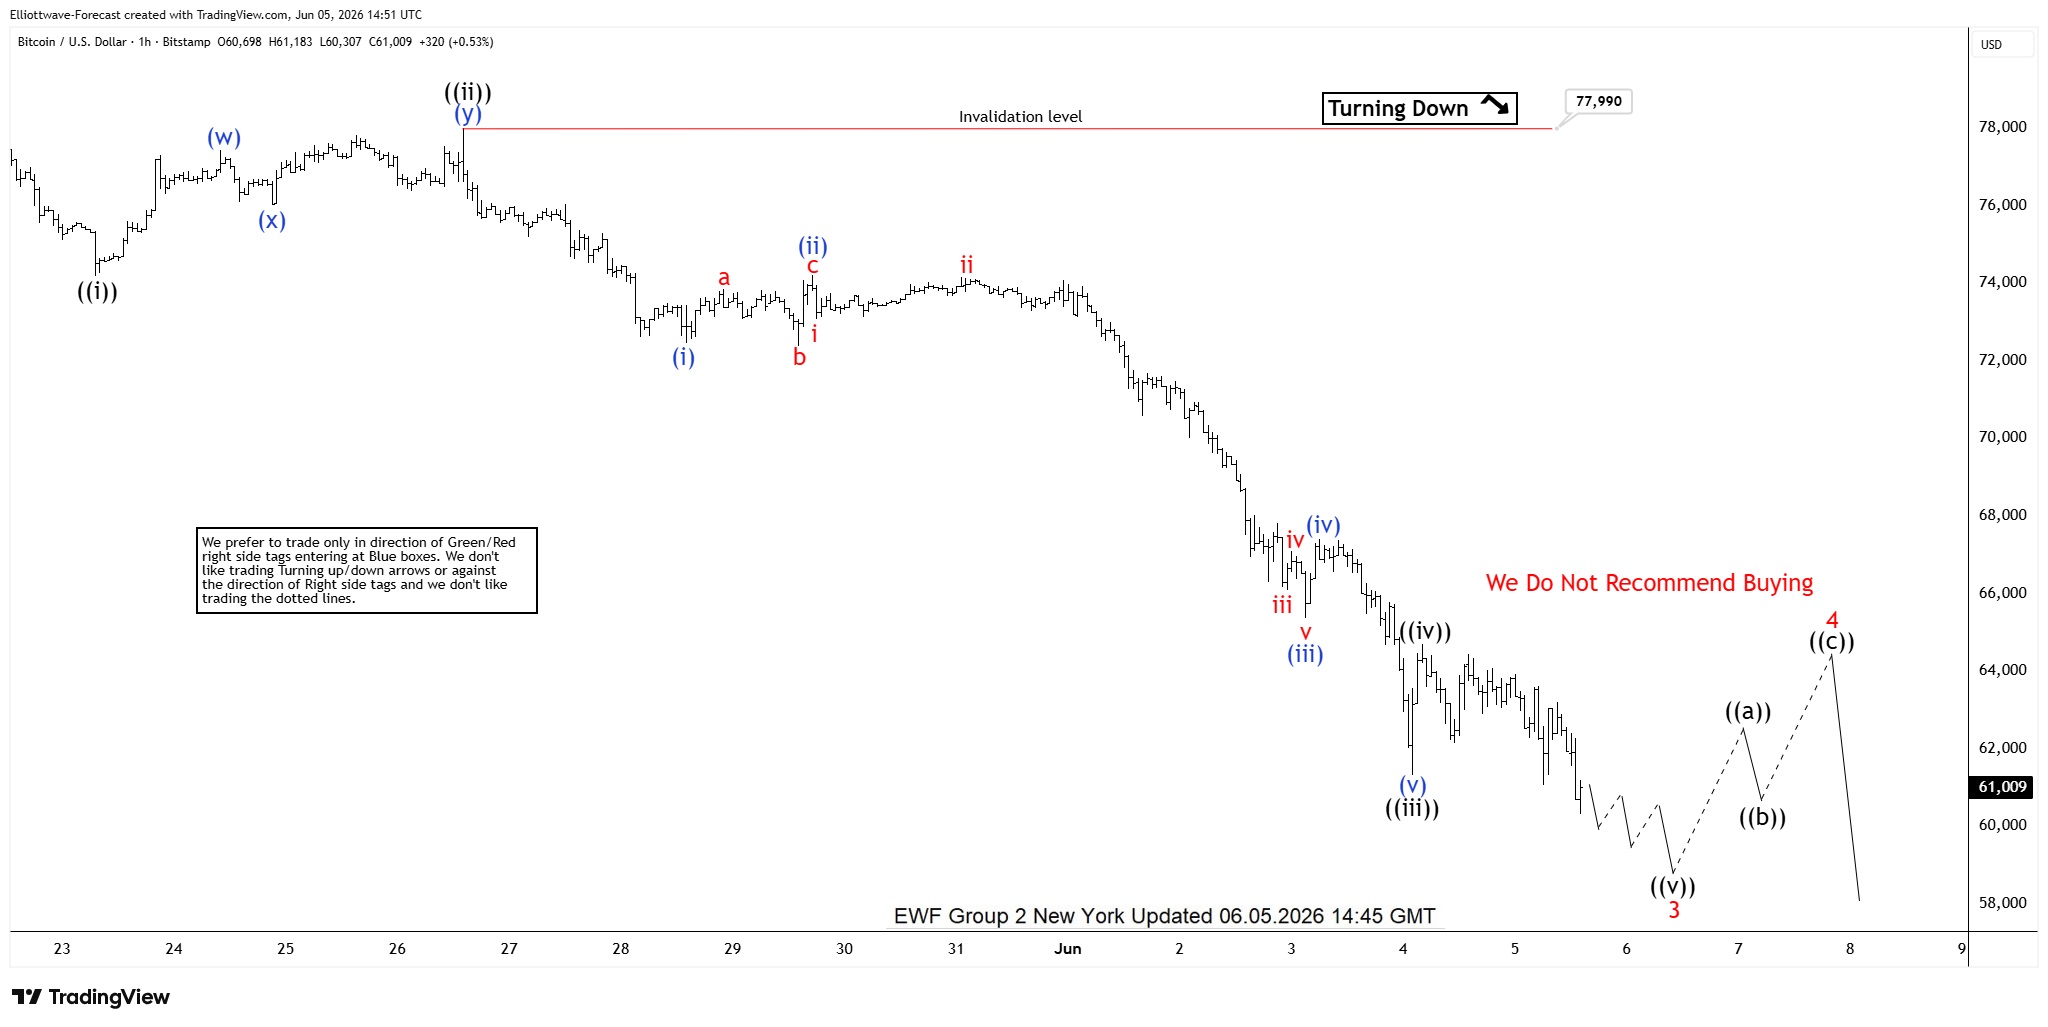
BTCUSD Elliott Wave 1 Hour Chart 06.05.2026
The current view suggests Bitcoin is developing impulsive bearish sequences, with wave ((v)) of wave 3 (red) nearing completion.
As our members know, the typical target area for wave ((v)) is projected using the 1.236–1.618 inverse Fibonacci extension of wave ((iv)). In this case, that zone comes in at 60,555–55,992. From this area, we expect a corrective three-wave bounce before the downside trend resumes.
Did you know ? 90% of traders fail because they don’t understand market patterns. Are you in the top 10%? Test yourself with this advanced Elliott Wave Test
Official trading strategy on How to trade 3, 7, or 11 swing and equal leg is explained in details in Educational Video, available for members viewing inside the membership area.
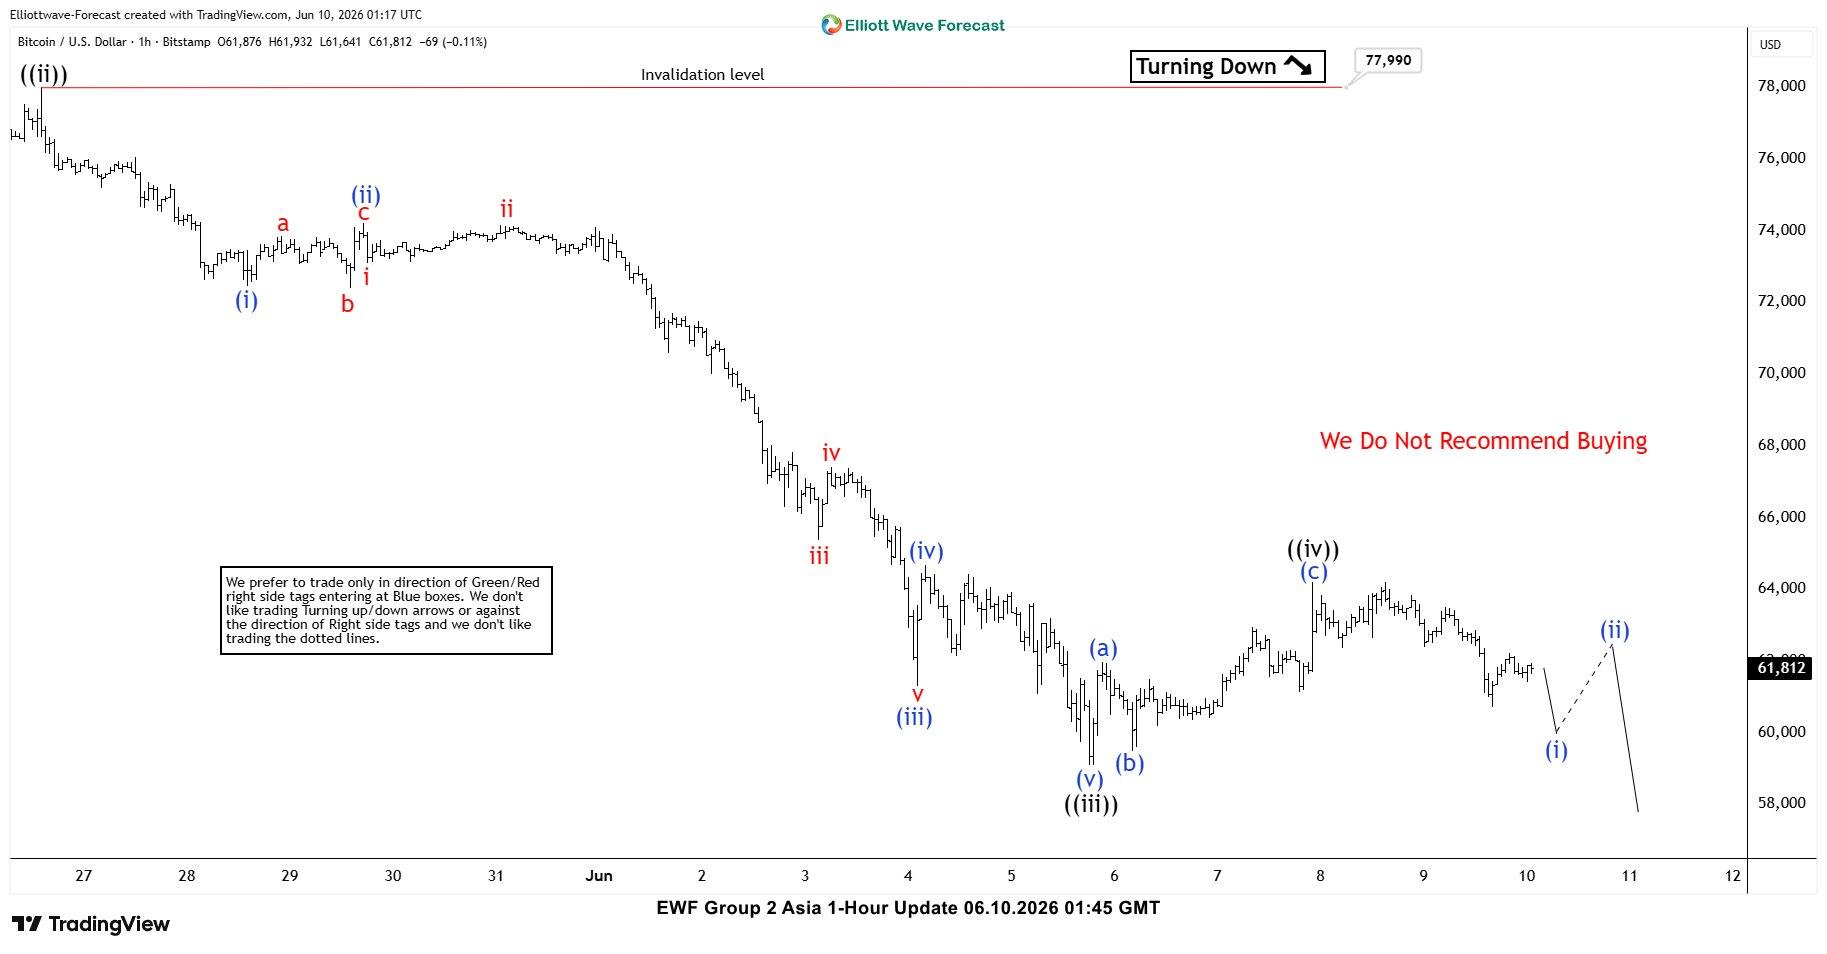
BTCUSD Elliott Wave 1 Hour Chart 06.10.2026
Bitcoin found buyers in the 60,555–55,992 area and made a three-wave bounce as expected. The overall view remains unchanged, with only a minor adjustment in wave counting.
At this stage, we consider wave ((iv)) completed at 64,200. While price remains below that high, we expect further downside within wave ((v)).
We will use the same approach to project the wave ((v)) target zone, based on the 1.236–1.618 inverse Fibonacci extension of wave ((iv)), which comes in at 58,020–56,080.
Important note: Our analysis is not based on Elliott Wave in isolation. We perform detailed higher-time-frame cycle analysis, which shows an incomplete market structure. This is one of the key drivers of price action, along with correlation analysis and broader market context.
We also teach our members in live analysis sessions how to identify incomplete bullish and bearish sequences. Even a 14-day trial, is enough to noticeably improve your trading analysis and forecasting approach.
Keep in mind that market is dynamic and presented view could have changed in the mean time. You can check most recent charts with target levels in the membership area of the site. Best instruments to trade are those having incomplete bullish or bearish swings sequences. We put them in Sequence Report and best among them are shown in the Live Trading Room