
Sample Category Title
EUR/USD: ECB Meeting and Interest Rate Expectations
On 11 June, the ECB is holding the second day of its Governing Council meeting. The interest rate decision will be announced at 14:15 CET, followed by a press conference by Christine Lagarde at 14:45 CET. Markets are focused on the possibility of a 25-basis-point rate increase to 2.25%.
The case for further tightening is supported by accelerating inflation in the euro area, driven in part by higher energy prices resulting from geopolitical tensions in the Middle East. At its 30 April meeting, the ECB paused its policy cycle but indicated that June would be an important point for reassessing the outlook. Labour market resilience and signs of second-round inflation effects have strengthened the arguments in favour of tighter policy. The tone of the press conference could shape market expectations for interest rates through the remainder of the year.
Technical Picture
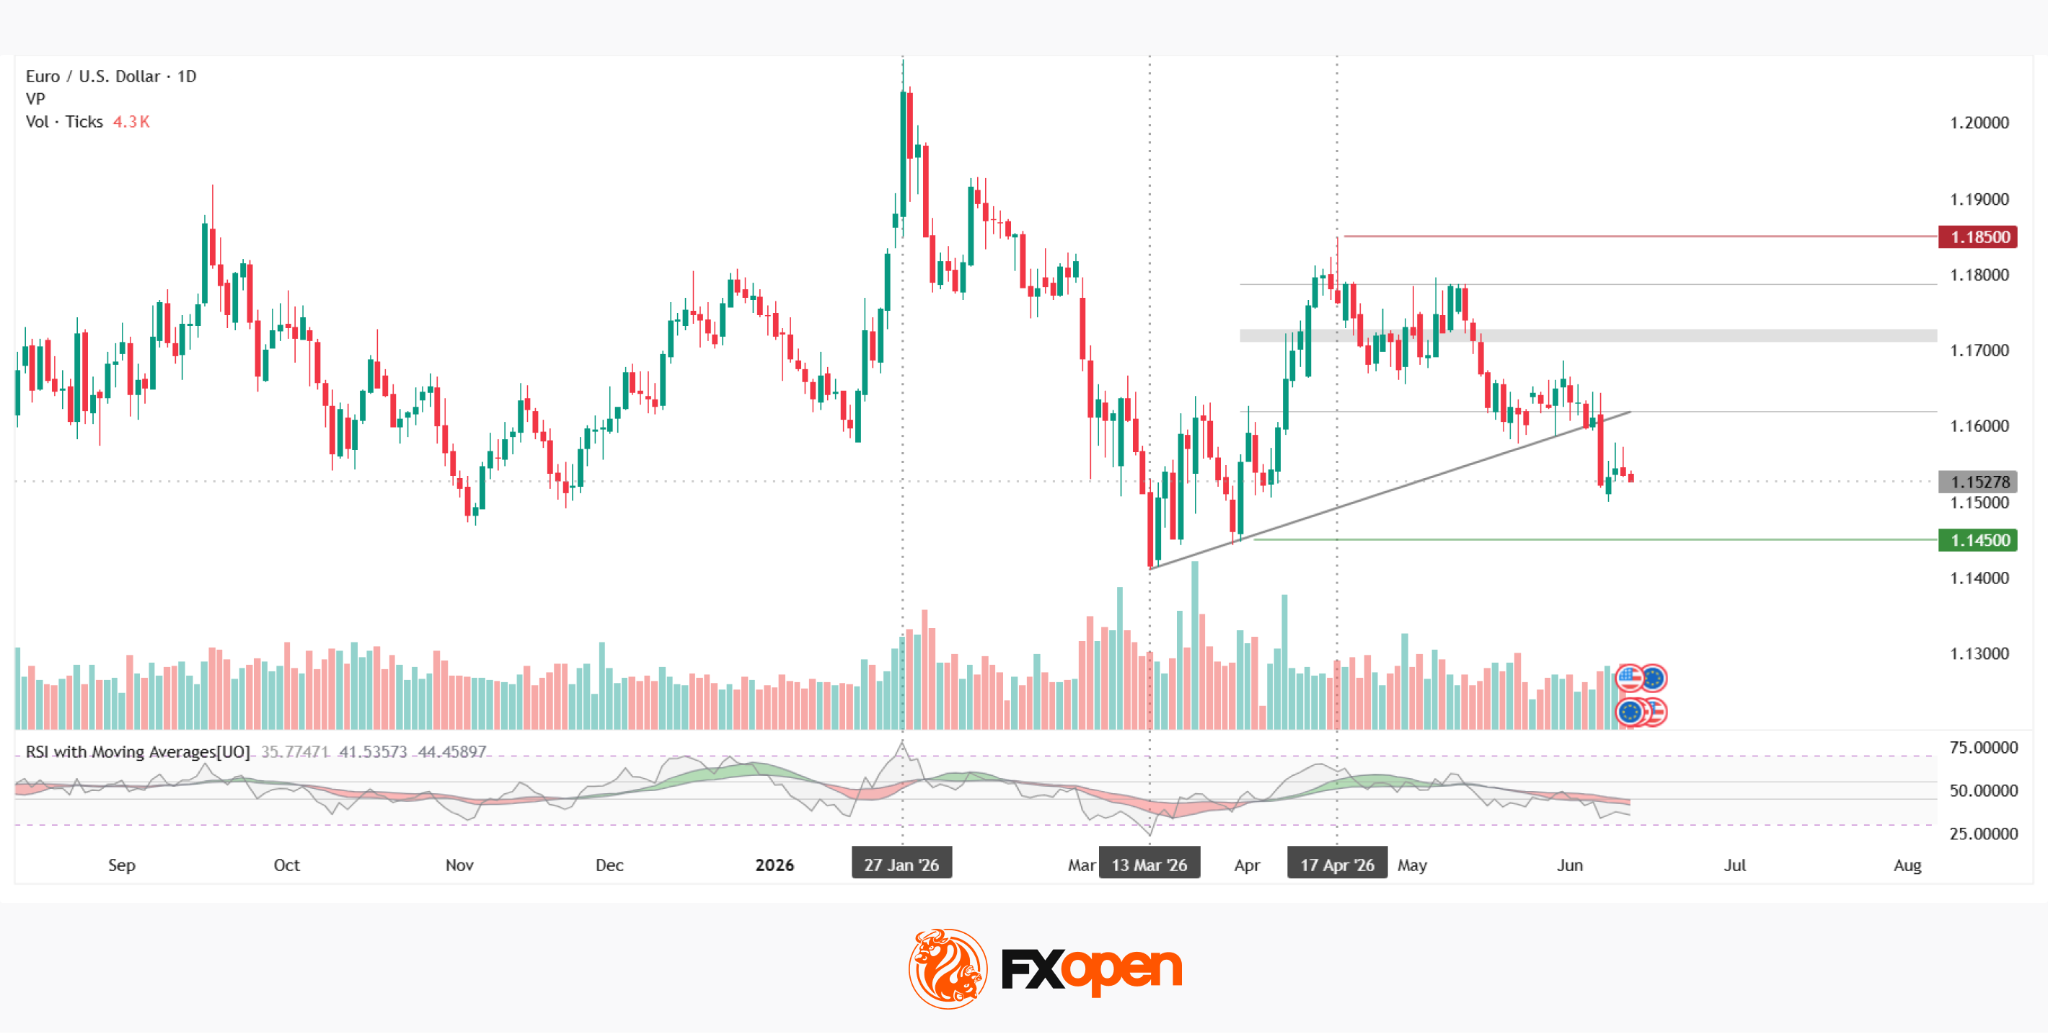
Following a peak near 1.2000 in January, EUR/USD formed a downward move towards the March lows around 1.1400 on the daily chart. An ascending trendline drawn from the March lows is currently being tested from above, with price attempting to break below it.
At the same time, the pair is trading beneath the lower boundary of the current volume profile at 1.1620, which may indicate increasing selling pressure in this area. Should the price remain below the trendline, the next downside reference point could be the green support level around 1.1450.
The red resistance zone is located near 1.1850. If the market reverses higher and manages to overcome both the point of control (POC) at 1.1720 and the upper boundary of the profile at 1.1790, this area could become the next target for buyers.
RSI + MAs currently shows readings of 35, 41 and 44. All three lines remain below the neutral 50 level, while the moving averages continue to point lower.
Key Takeaways
The outcome of the ECB press conference on 11 June may determine whether the current attempt to break the corrective trend develops into a sustained move or ends with a return to the point of control (POC) area. For now, RSI + MAs remains firmly in bearish territory.
Trade over 50 forex markets 24 hours a day with FXOpen. Take advantage of low commissions, deep liquidity, and spreads from 0.0 pips (additional fees may apply). Open your FXOpen account now or learn more about trading forex with FXOpen.
This article represents the opinion of the Companies operating under the FXOpen brand only. It is not to be construed as an offer, solicitation, or recommendation with respect to products and services provided by the Companies operating under the FXOpen brand, nor is it to be considered financial advice.
ECB Hike Expected With Focus on Signals
In focus today
As the main event of the week in Europe, we expect the ECB to hike the deposit rate by 25bp to 2.25%, in line with consensus and markets. With the June hike fully priced in by markets, all focus during the press conference will be on signals. We expect Lagarde to keep full optionality on the future policy rate path, including a potential summer hike, but without pre-committing. Looking ahead, we forecast a final 25bp hike in Q3, bringing the deposit rate to 2.50%. For details see ECB Preview - And so, the hiking begins, 4 June.
In Norway, we expect the Regional Survey to confirm the impression of a weaker growth outlook and lower capacity utilization, including a drop in the indicator of labour shortage. If proven right, the probability of a rate hike next week should probably remain well below 50%.
The full batch of May inflation figures is released in Sweden today. Since the flash estimate last week showed a sizeable upside surprise in core inflation (0.5% vs 0.2% expected), driven mainly by services, the risk profile for coming prints has shifted to the upside. Today's release also includes the official series for CPIF ex energy with constant taxes, requested by the Riksbank. This new measure will be key for assessing underlying inflation pressures and the policy outlook, depending on how persistent the strength in services inflation is.
The US releases May PPI in the afternoon. Markets expect PPI to increase 0.7% m/m SA, moderating from the 1.4% m/m SA recorded in April, though upward pressure is expected to persist. On a yearly basis, markets expect PPI to tick up further to 6.4% y/y (April: 6.0%).
The Central Bank of Turkey releases its rate decision, where markets expect them to leave the 1W repo rate unchanged at 37.0% for the third consecutive meeting.
Economic and market news
What happened overnight
In the Iran-war, Iran's Revolutionary Guard declared the Strait of Hormuz closed and threatened to target any vessel attempting to transit, reporting that two ships were fired upon, although US Central Command said commercial traffic "was continuing to transit in and out of the Strait". While the US launched new strikes on Iranian military assets inside Iran, Iran claimed drone and missile attacks on multiple US bases in Kuwait, Bahrain and Jordan. Oil prices rose on the news, with Brent crude almost at USD 95/bbl.
For the US-Mexico-Canada agreement, Donald Trump has signalled he is "not looking to renew" the agreement at its 1 July review deadline, raising the prospect of annual renegotiations rather than a 16-year extension. He argued the US "doesn't need" imports from Canada or Mexico and should run trade surpluses with both. Major US carmakers are heavily exposed to the deal given continent-wide supply chains, while the US also imports fertiliser and energy, including oil and electricity, from Canada.
What happened yesterday
In the US, May CPI came in broadly as expected, with headline inflation at 0.6% m/m SA (4.2% y/y) but core slightly softer at 0.2% m/m SA (2.9% y/y). Under the surface, health care lifted core, while most other categories, including food, looked relatively soft. Wage growth was around 3.4% in May, below headline inflation, implying that consumers' purchasing power has declined over the past year. Overall, the data does not yet point to a broad-based pass-through of higher input costs to consumers. The print should ease immediate inflation concerns, arguing against an urgent need to accelerate the hiking pace.
In Norway, core inflation came in at 3.4% y/y in May (cons.: 3.3%, Norges Bank forecast: 3.3%), thereby surprising to the topside. The print does increase the probability of a June hike, although "unchanged" remains our base case amid the inflation details on domestic components turning soft. Headline inflation printed at 3.1% y/y (Norges Bank forecast: 3.3%), though it is the core measure that is the most important for the near-term monetary policy outlook.
In Denmark, May inflation printed in line with our expectations at 1.9% y/y (April: 1.4%), driven mainly by a 7.6% y/y increase in electricity prices and normalisation of summer house inflation. Petrol prices increased 4.8% m/m, while diesel declined 2.9% m/m, however both remain well above last year's levels. The largest surprise was food, which fell 1.3% m/m and now sits 0.3% below last year's level, reflecting an intensifying supermarket price war.
In Sweden, GDP increased 0.5% m/m in April, above expectations and confirming strong momentum after the robust March print (1.9% m/m). At the same time, the entire monthly GDP series was revised up markedly. As a result, the level of GDP is now clearly higher than in the Riksbank's latest forecast, which should support a higher rate path at the upcoming meeting. Household consumption, which is expected to play a key role in Swedish recovery, declined 0.8% m/m in April, but preliminary figures indicate a 0.7% m/m rebound in May.
In Canada, the Bank of Canada left its policy rate unchanged at 2.25% at the interim policy meeting today. They reiterated their preparedness to act if short-term effects from the war persists despite weak growth.
The Bank of Japan announced that Governor Kazuo Ueda has been admitted to hospital for medical treatment and will not take part in the 15-16 June policy meeting. Deputy Governor Ryozo Himino will oversee the rate decision in his absence, while Deputy Governor Shinichi Uchida will conduct the press conference afterwards. According to the Bank of Japan, Ueda is expected to attend the 30-31 July policy meeting.
Equities: Global risk appetite was weak again yesterday, with a sharp decline across major equity indices, with global equities down 1.3%. The S&P 500 declined 1.6%, while the Nasdaq fell 2.0%. Russell 2000 declined 1.1%. The rotation within equity was a classic defensive rotation on a risk off with min vol and value outperforming peers. Defensive sectors rose with the exception of health care. The materials and industrials were among the weakest performers, yet the much in-focus tech sector also dropped markedly. Unlike Tuesday, this was a semis-led tech decline. This morning, Asian markets are in the red, reflecting the tone set by US markets yesterday. US equity futures are marginally higher.
FI and FX: Trump grew tired of waiting for his 'deal' and has ordered new strikes against "multiple" targets in Iran overnight. In an interview following the strikes, Trump also added that the attacks would continue should a deal not be reached today. According to state-run TV in Iran, the Strait of Hormuz has been completely closed in response. Despite this escalation, price action through the night has been relatively modest although Brent crude is moving higher. Yields were torn between two directions yesterday, pulled higher by rising oil prices and lower by the modest downside surprise in US core CPI. NOK/SEK rose above parity again, as the NOK found support in higher oil prices whereas the SEK suffered from poor risk sentiment.
Trump’s Iran Strike Threat and Tech Rout Spark Stagflation
Key takeaways
- Stagflation fears returned sharply as President Trump’s threat of hard strikes on Iran pushed WTI crude back above US$90, while hot US CPI data reinforced expectations of a higher-for-longer Federal Reserve policy stance.
- Technology and AI-linked equities remain under heavy pressure as the S&P 500 and Nasdaq 100 sold off, weighed down by stretched valuations, semiconductor weakness, and concerns that mega tech IPOs may drain liquidity from public markets.
- Asia Pacific markets opened weaker amid global risk-off sentiment, with tech-heavy indices such as South Korea’s KOSPI and Taiwan’s TAIEX leading losses, while regional currencies remained under stress near multi-year lows.
- Chart of the day: Dow Jones (DJIA) rotation play evaporated; potential transition to a medium-term downtrend phase, with key short-term resistance at 50,390/540.
Chart of the day - Dow Jones (DJIA)’s in transit towards a medium-term downtrend
Fig. 1: US Wall Street 30 minor trend as of 11 Jun 2026 (Source: TradingView). The information presented is historical information, and past performance is not indicative of future performance.
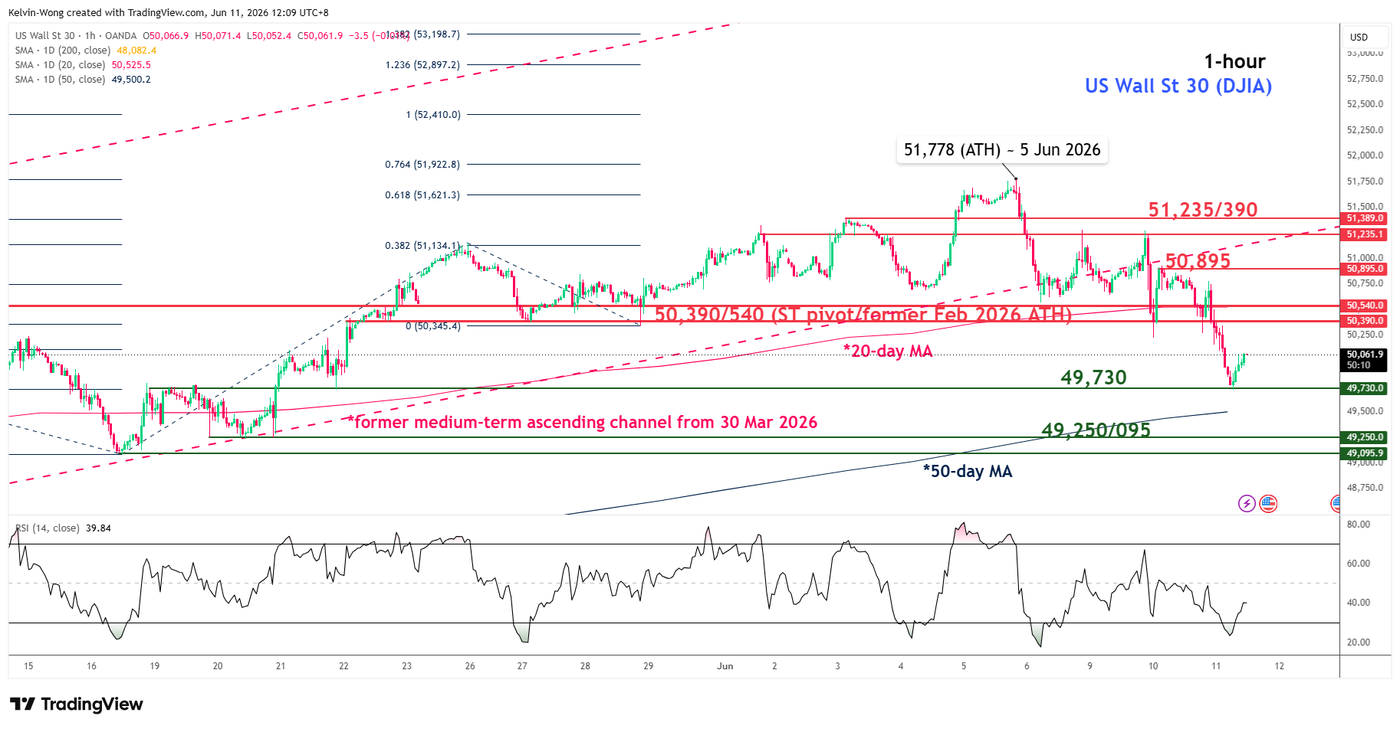
The earlier outperformance of the Dow Jones Industrial Average on Tuesday, 9 June, which eked out a 0.2% gain amid steep losses in the tech-heavy Nasdaq 100, has evaporated.
The last price action of the US Wall Street 30 CFD (a proxy for the DJIA E-mini futures) plummeted 1.9% on Wednesday, 11 June, and broke below its 20-day moving average, with a daily close below it (see Fig. 1).
Prior to the bearish breakdown of its 20-day moving average, the US Wall Street 30 CFD has breached below the medium-term ascending channel support from its 30 March 2026 low on Tuesday. These observations suggest the medium-term uptrend phase from 30 March 2026 has been demagaed, and it is now transiting into a potential medium-term downtrend phase.
Watch the 50,390/540 key short-term pivotal resistance for further potential weakness towards the next intermediate supports at 49,730 and 49,250/095 in the near-term.
On the flip side, a clearance and an hourly close above 50,540 invalidates the minor bearish bias scenario for a corrective rebound for a retest on the next intermediate resistance at 50,895.
Top macro headlines
- Trump threatens hard strikes on Iran, crude rebounds past $90: Geopolitical tensions erupted into a volatile escalation on Wednesday after U.S. President Donald Trump warned that the U.S. will be “attacking them, attacking them very hard.” The aggressive stance followed overnight strikes that damaged a fragile two-month truce, prompting West Texas Intermediate (WTI) crude to surge by more than 3% back above $90 as hopes for a quick resolution faded.
- Wall Street rout wipes out weekly advances as megacaps slump: Equity markets experienced a broad liquidation as the S&P 500 tumbled 1.6%, wiping out this week’s gains. Risk-off sentiment intensified as major technology firms and a closely watched semiconductor gauge (SOX) slid 3.6%, adding to anxieties over stretched AI valuations.
- US CPI jumped to almost a 3-year high, reinforced hawkish rate vibes: The U.S. Labour Department released a red-hot consumer price index data that showed an increase of 4.2% y/y in May, its highest level since April 2023, threatening sticky, energy-driven inflation and renewed fears of an emergency Federal Reserve interest rate hike before year-end.
- AI Capital demands are raising concerns about an institutional liquidity drain: Wall Street strategists are signalling alarm about an unprecedented wave of equity supply from private tech giants looking to fund AI ambitions. Capital allocators note that mega-cap private listings, including SpaceX’s fixed $135/share offering and Anthropic’s confidential IPO tracking, are forcing funds to dump liquid public equities to build necessary cash reserves.
- Amazon’s expansion of its shipping service targets major trucking routes: Shares of several large transportation and logistics companies plunged on Wednesday. The aggressive drop came immediately after Amazon.com Inc. announced a sweeping expansion of its proprietary internal shipping network, directly rattling the commercial freight sector.
Key macro themes
- The return of the stagflation dilemma: The core structural narrative guiding global macro desks shifted violently away from a “soft landing” and straight back toward stagflation risk. While consumer price metrics print near-stable levels, the persistence of an energy supply crunch amid direct military friction across the Middle East keeps input costs highly elevated. If the Strait of Hormuz shipping corridor faces prolonged or indefinite disruptions, oil-driven price pressures will override corporate margin resilience, forcing global central banks to lean toward hawkish policies despite weakening economic output.
- The AI funding bottleneck and private Issuance pressures: An underlying undercurrent to the weakness in public technology markets is a massive, looming structural drain of institutional capital. A flood of major private corporations seeking public capital to fund intensive infrastructure requirements threatens to crowd out standard secondary-market liquidity. As capital allocators clear the deck for multi-billion and near-trillion-dollar valuations across private artificial intelligence and defence aerospace firms, existing public tech listings are facing a persistent ceiling on structural bids.
- Cross-asset volatility inversion: As standard multi-asset insurance models begin to fray, correlations across traditionally inverse asset classes are breaking down. Bond market volatility metrics remain structurally elevated near multi-decade highs, driven by shifting policy outlooks in Tokyo, Frankfurt, and Washington. Rather than serving as an organic buffer, fixed income has become an active vector of volatility, driving stock market risk premiums significantly higher year-to-date.
Global markets impact (last 24 hours)
Equities: The S&P 500 lost 1.6%, and the technology-heavy Nasdaq 100 declined 2% as hardware and semiconductor names underperformed, while the Dow Jones Industrial Average dropped 1.9% amid weakness in consumer retail and logistics. In Europe, the STOXX 600 retreated amid concerns about industrial vulnerabilities.
In today’s Asia opening session, the S&P 500 and Nasdaq 100 E-mini futures staged a relief bounce of 0.2% and 0.4% respectively after US Central Command declared that military strikes on Iranian targets have been “completed’.
Fixed Income: Sovereign bonds posted modest losses as safe-haven bids failed to fully offset hawkish rate-hike fears. The yield on the benchmark 10-year U.S. Treasury note advanced 4 basis points to settle near 4.55%. Internationally, Germany’s 10-year Bund yield advanced 3 basis points to 3.08%, and the UK’s 10-year Gilt yield climbed 3 basis points to 4.95%.
FX: The US Dollar Index traded almost unchanged on Wednesday as market participants await the ECB’s new monetary policy guidance today after fully pricing in a 25 bps hike for today’s policy meeting. The euro traded flat at 1.1535, and the British pound rested virtually unchanged at $1.3368.
The Japanese yen inched up by 0.1%, hovering around 160.50 per dollar, just a whisker below the 30 April 2026 high of 160.73 that triggered intervention from Japanese authorities. The worst performer was the risk-sensitive AUD, which fell 0.4% to a 2-month low of 0.7000 per dollar.
Commodities: Energy-dominated resource complexes, with WTI crude jumping 3.5% to settle at $91.84/bbl on Trump’s geopolitical remarks. Conversely, spot gold collapsed 4.4% to trade at $4,072/oz as non-yielding safe-havens buckled under the higher-for-longer assumption of global sovereign yields.
Asia Pacific impact
- Equity indices retest key support levels: Driven lower by deep overnight liquidation across New York tech megacaps, regional APAC benchmarks tracked heavy downside on Thursday, Asia opening session. Speculative positioning in tech-concentrated hubs such as South Korea’s KOSPI (-2.4%) and Taiwan’s benchmark TAIEX (-2.3%) came under intense pressure amid declines in local semiconductor companies. Intraday losses were seen in other bourses: Nikkei 225 (-1.5%), Hang Seng Index (-1.4%), China A50 (-0.3%), CSI 300 (-0.4%), ASX 200 (-0.3%), and STI (-0.5%).
- Regional currencies hit 17-year lows: Underlying currency defence limits remain under extreme stress across Asia. The South Korean Won continued to trade near a severe 17-year low of 1,530 against the greenback, prompting localised currency stability committees to keep maximum alert flags raised.
- Indonesian Rupiah anchors following emergency actions: Following a surprise emergency interest rate hike implemented during the prior session by Bank Indonesia to insulate the local capital account from global capital flight, the Indonesian Rupiah showed tentative signs of consolidation, holding its hard floor against the U.S. Dollar as it rebounded for the consecutive session from its record low of 18,180 printed on Monday, 8 June 2026.
Top 5 events to watch today
- ECB Interest Rate Decision - 8:15 pm SGT (consensus: 25 bps hike) Impact: EUR, EUR crosses, DAX, Bunds
- US PPI (May) - 8:30 pm SGT (consensus: 5.4% y/y, Apr: 5.2% y/y) Impact: USD, US Treasuries, US stock indices, Gold
- US Weekly Initial Jobless Claims - 8.30 pm SGT Impact: USD, shorter-term US Treasuries, US stock indices
- ECB Press Conference - 8:45 pm SGT Impact: EUR, EUR crosses, DAX, Bunds
- US - Iran ceasefire agreement Impact: All asset classes
Trump, Iran and Hormuz: Brent Oil’s Double Bottom Could Be the Real Warning.
Financial markets continue to behave as though diplomacy will ultimately prevail in the Middle East. That assumption is becoming increasingly difficult to justify. Over the past 48 hours, the conflict has escalated dramatically following the downing of a US military helicopter off the coast of Oman, triggering direct military exchanges between Washington and Tehran and drawing multiple Gulf states into the confrontation. Yet despite the deteriorating geopolitical backdrop, Brent crude remains well below $100 psychological level. The oil market is still pricing eventual de-escalation. The chart, however, may be starting to challenge that view.
The latest escalation began when a US Army Apache helicopter was shot down near the Strait of Hormuz. US President Donald Trump responded by ordering strikes against Iranian coastal surveillance radars and air defense systems. Iran's Revolutionary Guard retaliated with large-scale ballistic missile and drone attacks targeting US military assets across the region. Kuwait activated air defenses to intercept aerial threats over key military facilities, while Bahrain sounded air raid sirens as Iranian attacks targeted locations linked to the US Fifth Fleet. The conflict is no longer confined to a direct US-Iran confrontation. Regional actors are increasingly being pulled into the crossfire.
The political backdrop has deteriorated just as rapidly. Trump accused Tehran of deliberately delaying negotiations over a permanent extension of the ceasefire framework and insisted the United States, not Iran, effectively controls the Strait of Hormuz. Iran's top military command responded by formally declaring the Strait closed to oil tankers and commercial shipping, warning that vessels attempting passage could be fired upon. If enforced, such a move would represent the most serious threat to global energy flows in decades.
Yet Brent crude has not responded in a manner consistent with that risk. Prices remain far below the March peak near $120 and continue to trade as though traders expect some form of diplomatic intervention before inventories become critically depleted. That restraint suggests markets still believe the closure will prove temporary or that military and political pressure will eventually force a reopening of the waterway.
Technically, while Brent crude extended the rebound from this week's low at 89.57, the rally is so far refrained and capped by 55 4H EMA (now at 94.89). So bias will stay mildly on the downside. However, sustained break of the EMA will put 98.99 cluster resistance in focus (38.2% retracement of 115.30 to 89.57 at 99.40). Decisive break there will complete a double bottom pattern (89.93, 89.57) and indicate near term bullish reversal. That would set up further rise to 61.8% retracement at 105.47 at least.
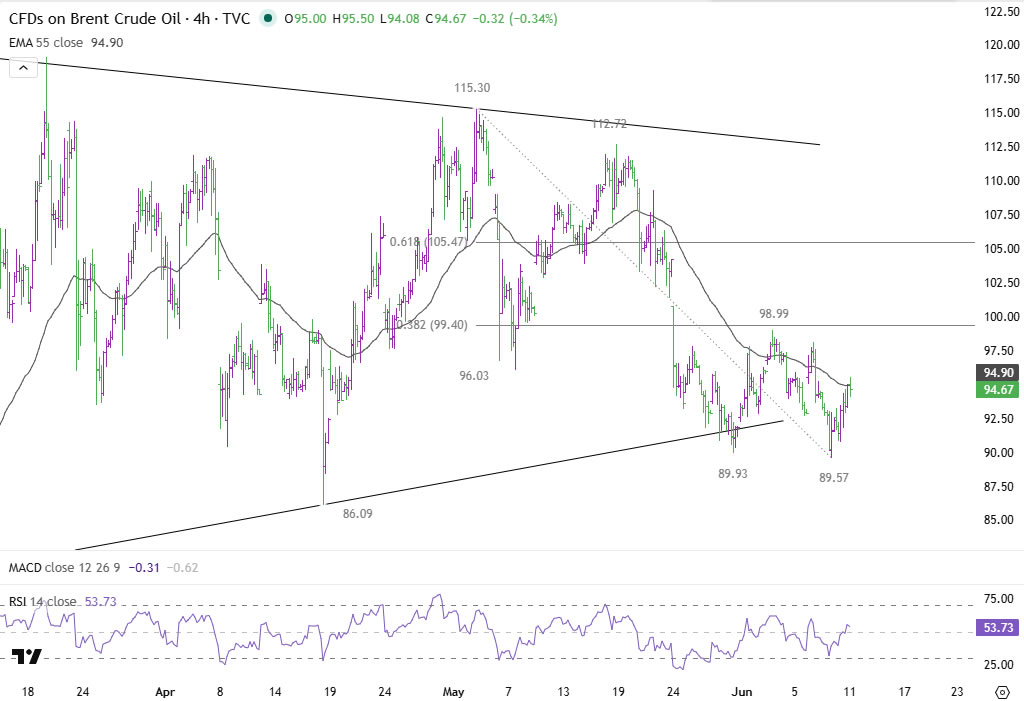
The importance of that possibility extends well beyond the oil market. A confirmed double bottom would signal that traders are beginning to price a longer-lasting disruption to energy supplies. That would have direct implications for inflation expectations, central bank policy and global risk sentiment. Markets have spent weeks assuming diplomacy will eventually restore stability. Brent's chart may soon reveal whether that confidence is justified.
AUD/USD Stumbles Again—A Bigger Breakdown Could Be Near
Key Highlights
- AUD/USD started a fresh decline below 0.7120 and 0.7080.
- A bearish trend line is forming with resistance at 0.7065 on the 4-hour chart.
- Bitcoin started a consolidation phase above $60,000.
- Gold extended losses below $4,200 and tested $4,050.
AUD/USD Technical Analysis
The Aussie Dollar failed to stay above 0.7120 and declined against the US Dollar. AUD/USD traded below 0.7080 to enter a bearish zone.
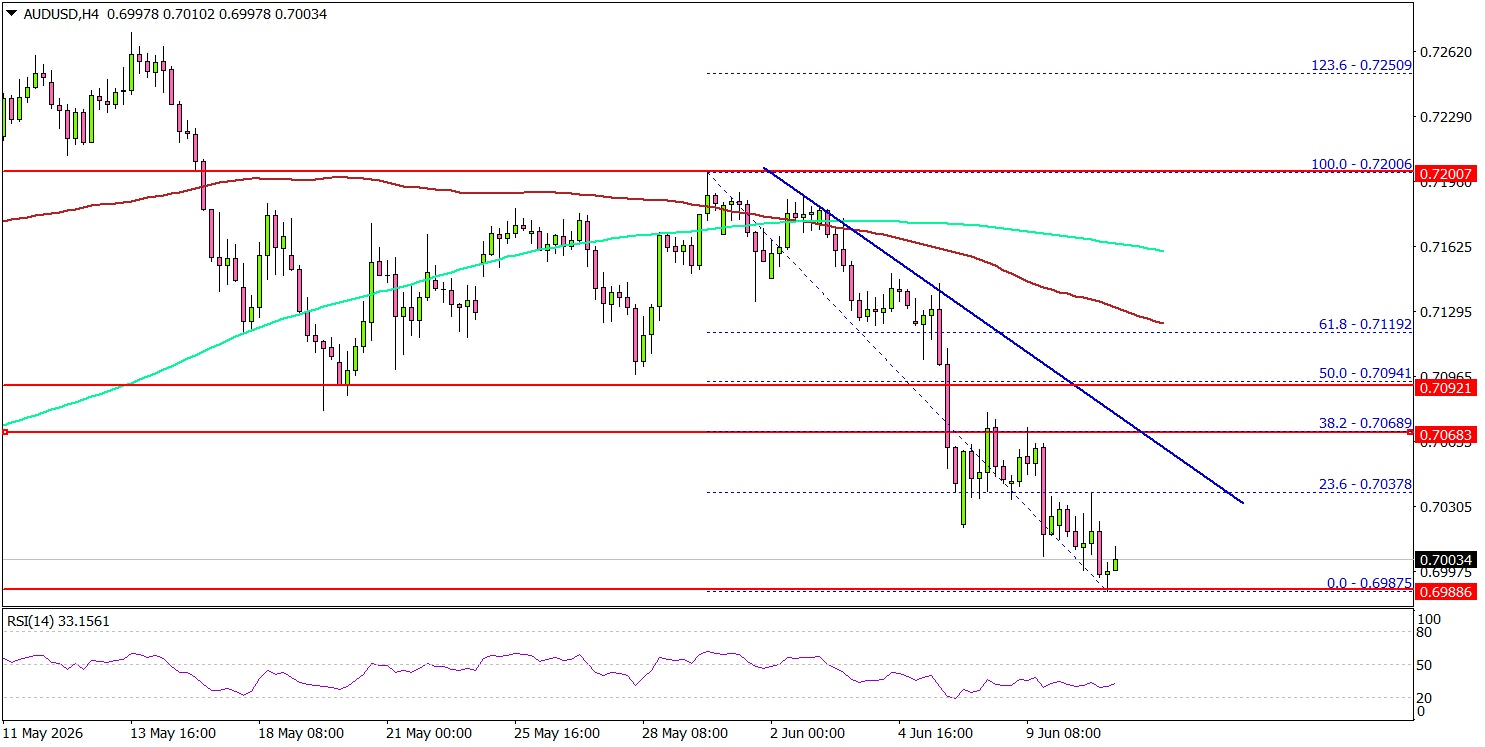
Looking at the 4-hour chart, the pair settled below the 0.7050 pivot level, the 100 simple moving average (red, 4-hour), and the 200 simple moving average (green, 4-hour). The pair even spiked below 0.7000. A low was formed at 0.6987, and the pair is now consolidating losses.
On the upside, an immediate resistance could be 0.7035. The next major resistance might be 0.7065. There is also a bearish trend line forming with resistance at 0.7065.
A close above 0.7065 could open doors for gains. The main hurdle for the bulls could be 0.7120 and the 100 simple moving average (red, 4-hour). If there is a close above 0.7120, the pair could rise toward the 0.7165 level.
Immediate support could be 0.6980. The first major support might be 0.6960. A close below 0.6960 could open the doors for a larger decline toward 0.6920. Any more losses might set the pace for a test of 0.6880.
Looking at Gold, there was a sharp decline below $4,250, and the bears might even aim for a move below $4,000.
Upcoming Key Economic Events:
- US Initial Jobless Claims - Forecast 219K, versus 225K previous.
- US Producer Price Index for May 2026 (MoM) – Forecast +0.7%, versus +1.4% previous.
- US Producer Price Index for May 2026 (YoY) – Forecast +6.4%, versus +6.0% previous.
Bitcoin (BTCUSD) Elliott Wave Count: Renewed Decline Approaches $41,400–52,200
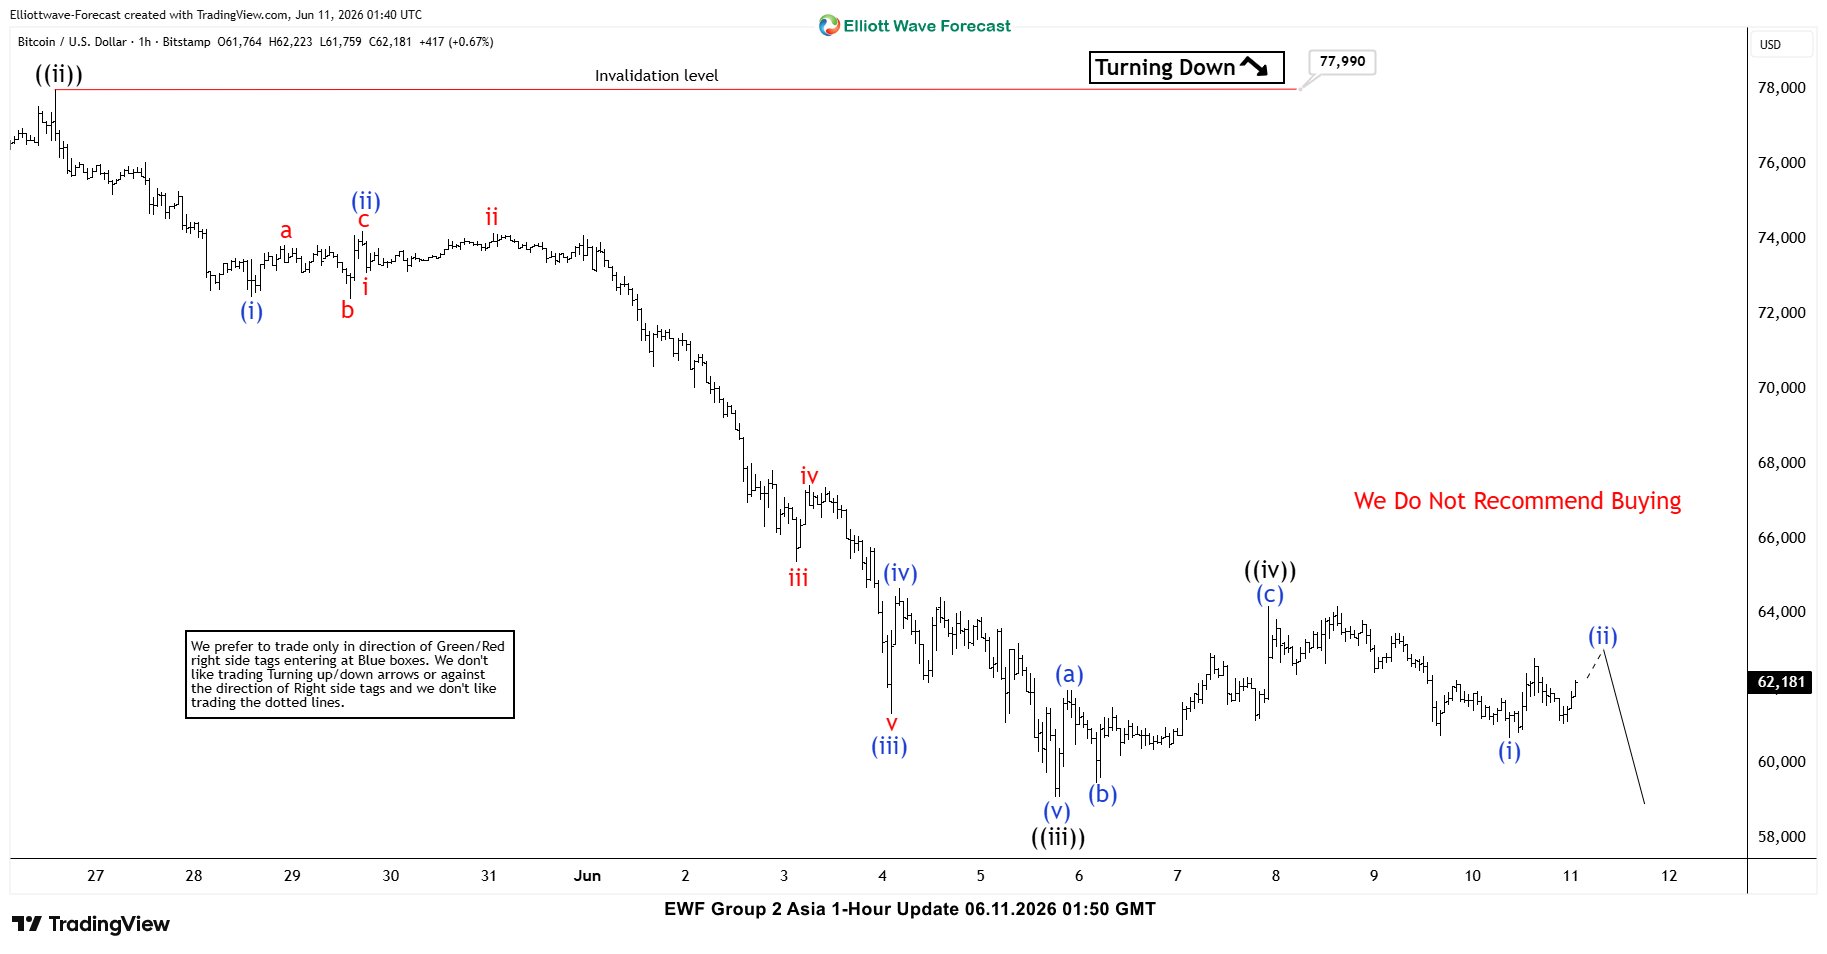
The short-term Elliott Wave structure from the May 6, 2026 peak is developing as a clear five-wave impulse. From the May 6 high, wave ((i)) concluded at $74,192, followed by a corrective rally in wave ((ii)) that terminated at $78,000. After this retracement, the cryptocurrency resumed its decline in wave ((iii)), which itself unfolded as a smaller degree impulse. Within this sequence, wave (i) ended at $72,462, while wave (ii) produced a modest rally that finished at $74,223.
The downward momentum continued as Bitcoin advanced into wave (iii), reaching $61,310 before a corrective rally in wave (iv) ended at $64,687. Subsequently, wave (v) drove prices lower to $59,104, completing the larger wave ((iii)). A rebound then materialized, and wave ((iv)) is proposed to have concluded at $64,197. From that level, the cryptocurrency has resumed its descent, reinforcing the broader bearish structure.
Near term analysis suggests that as long as the pivot at $78,000 remains intact, rallies are expected to fail. Such rallies are likely to unfold in corrective sequences of three or seven swings, ultimately leading to further downside pressure. A potential downside target is projected through the 100%–123.6% Fibonacci extension measured from the October 6, 2025 high. This extension aligns with the $41,400–$52,200 price zone, an area where notable support may emerge.
Bitcoin (BTCUSD) 60-Minute Elliott Wave Chart
BTCUSD Elliott Wave Video:
https://www.youtube.com/watch?v=IaUlbgopUBo
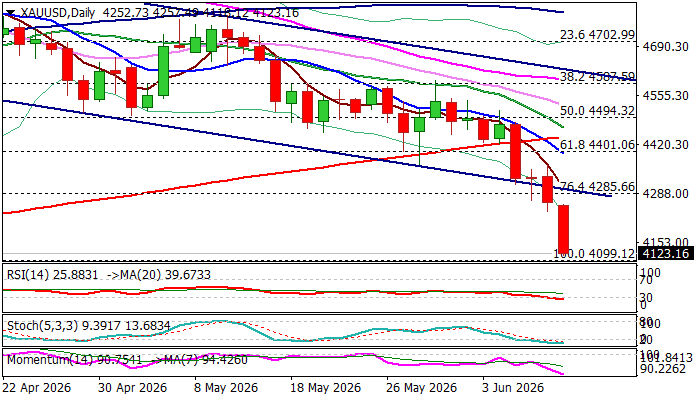
Gold Continues to Trend Lower and Pressure 2026 Low
Gold hit the lowest in ten weeks on Wednesday, following fresh acceleration after breaking below the lower boundary of a bear-channel (which repeatedly contained attacks in few previous sessions).
Steep bear leg, the part of larger downtrend, extends into fourth straight day and eyes key support at $4099 (2026 low, posted on Mar 23).
The latest US economic data showed that inflation continues to rise, with markets already pricing 0.25% Fed rate hike in coming months, that is expected to continue to underpin dollar, along with solid US labor data (released last Friday).
The latest formation of 10/200DMA death cross contributes to signals from firmly bearish daily studies, which favors eventual attack at $4099 target, but bears may face headwinds here from oversold conditions.
In current situation, technical correction is likely to be limited (upticks to be ideally capped by broken channel support line) and provide better levels to re-enter bearish market, for probe through $4099 and attack at next strong supports at $4077 (Fibo 38.2% of $1616/$5598) and $4000 (psychological).
Res: 4236; 4285; 4303; 4366
Sup: 4099; 4077; 4000; 3928
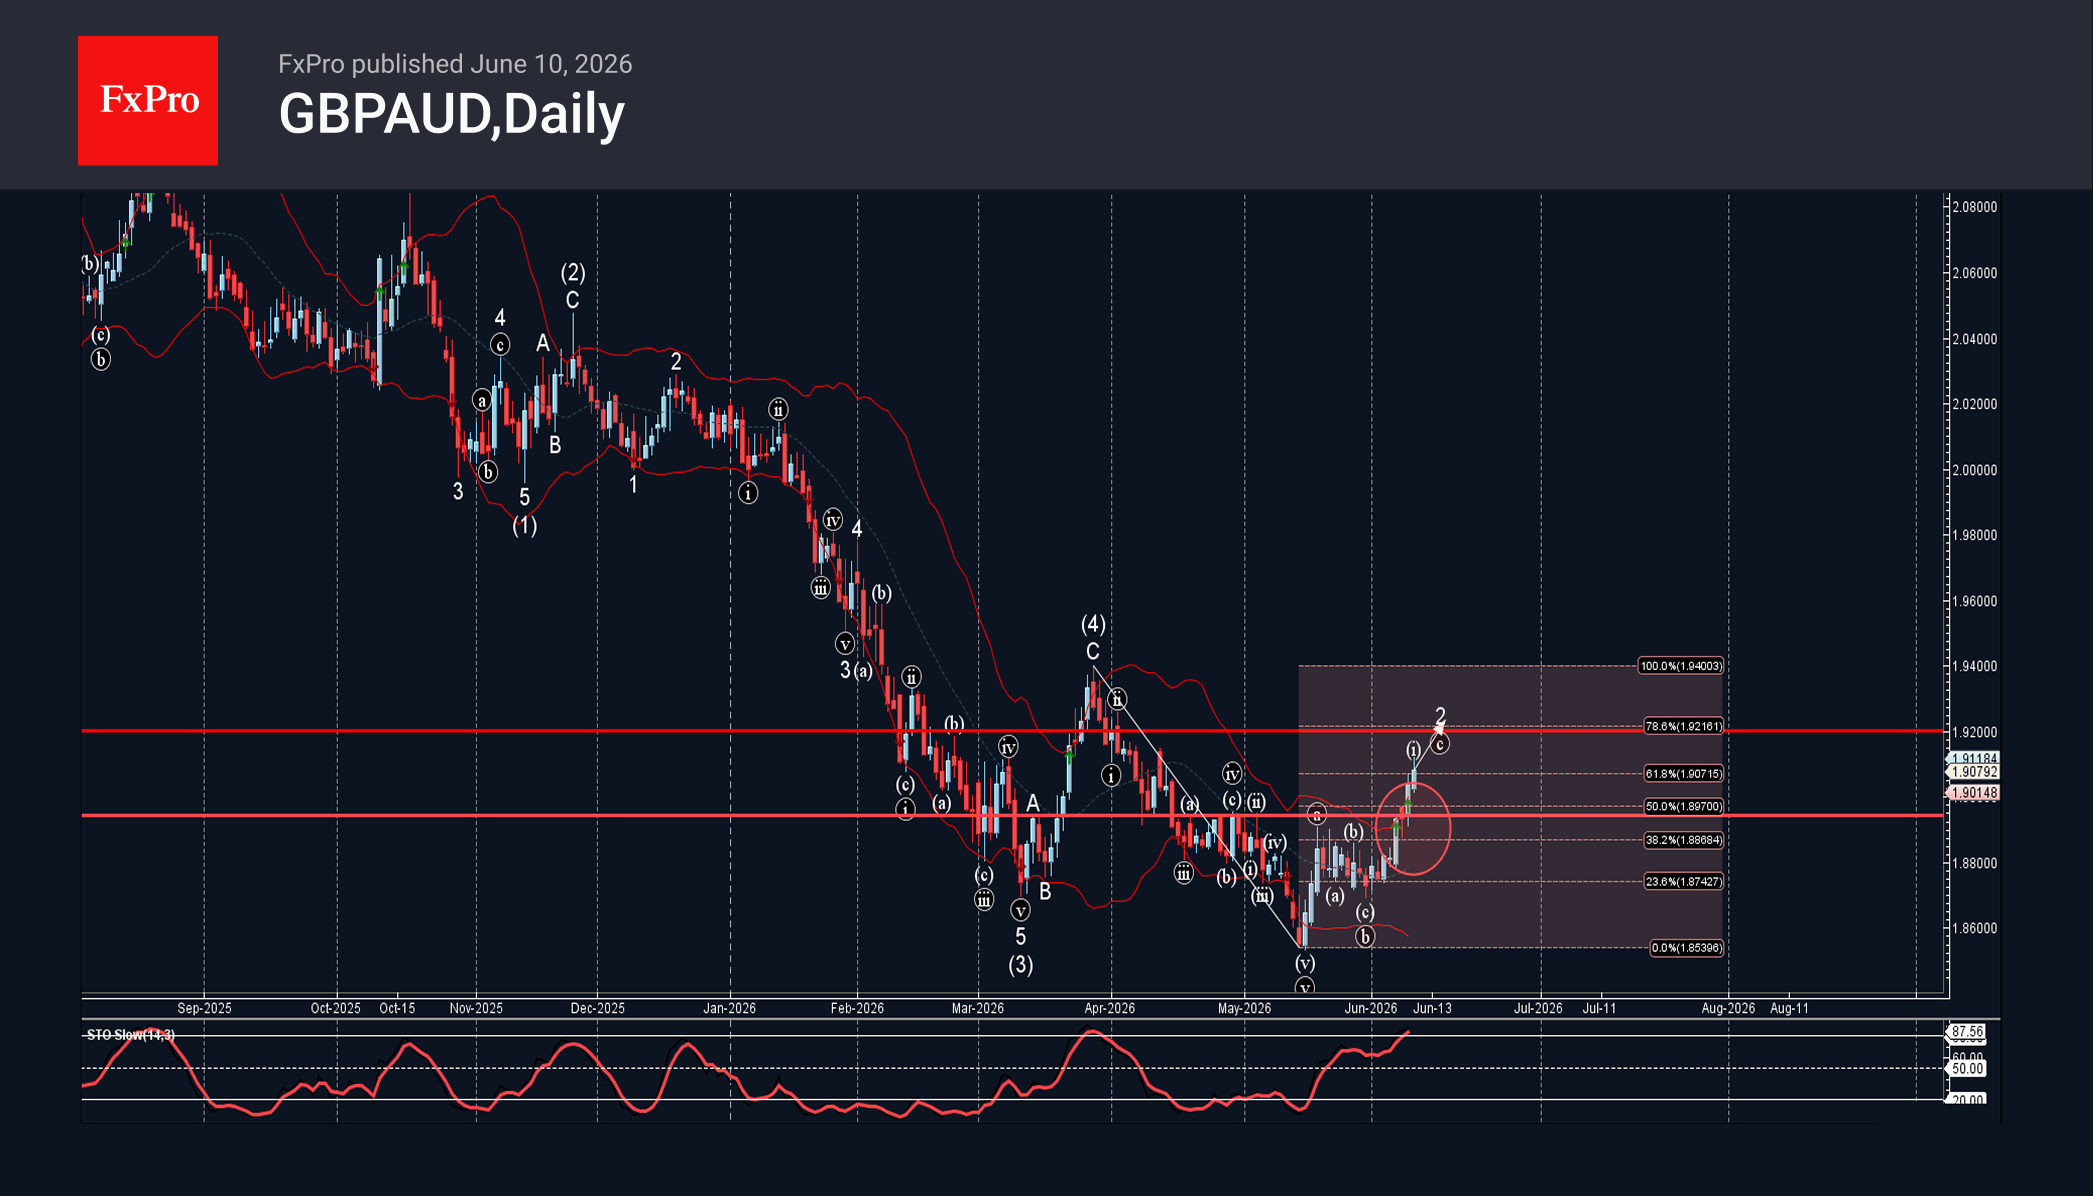
GBPAUD Wave Analysis
GBPAUD: ⬆️ Buy
– GBPAUD broke the resistance area
– Likely to rise to resistance level 1.9200
GBPAUD currency pair recently broke the resistance area between the resistance level 1.8940 (which has been reversing the price from April) and the 50% Fibonacci correction of the downward impulse from March.
The breakout of this resistance area accelerated the c-wave of the active ABC correction 2 from last month.
GBPAUD currency pair can be expected to rise to the next resistance level 1.9200, target price for the completion of the active ABC correction 2.
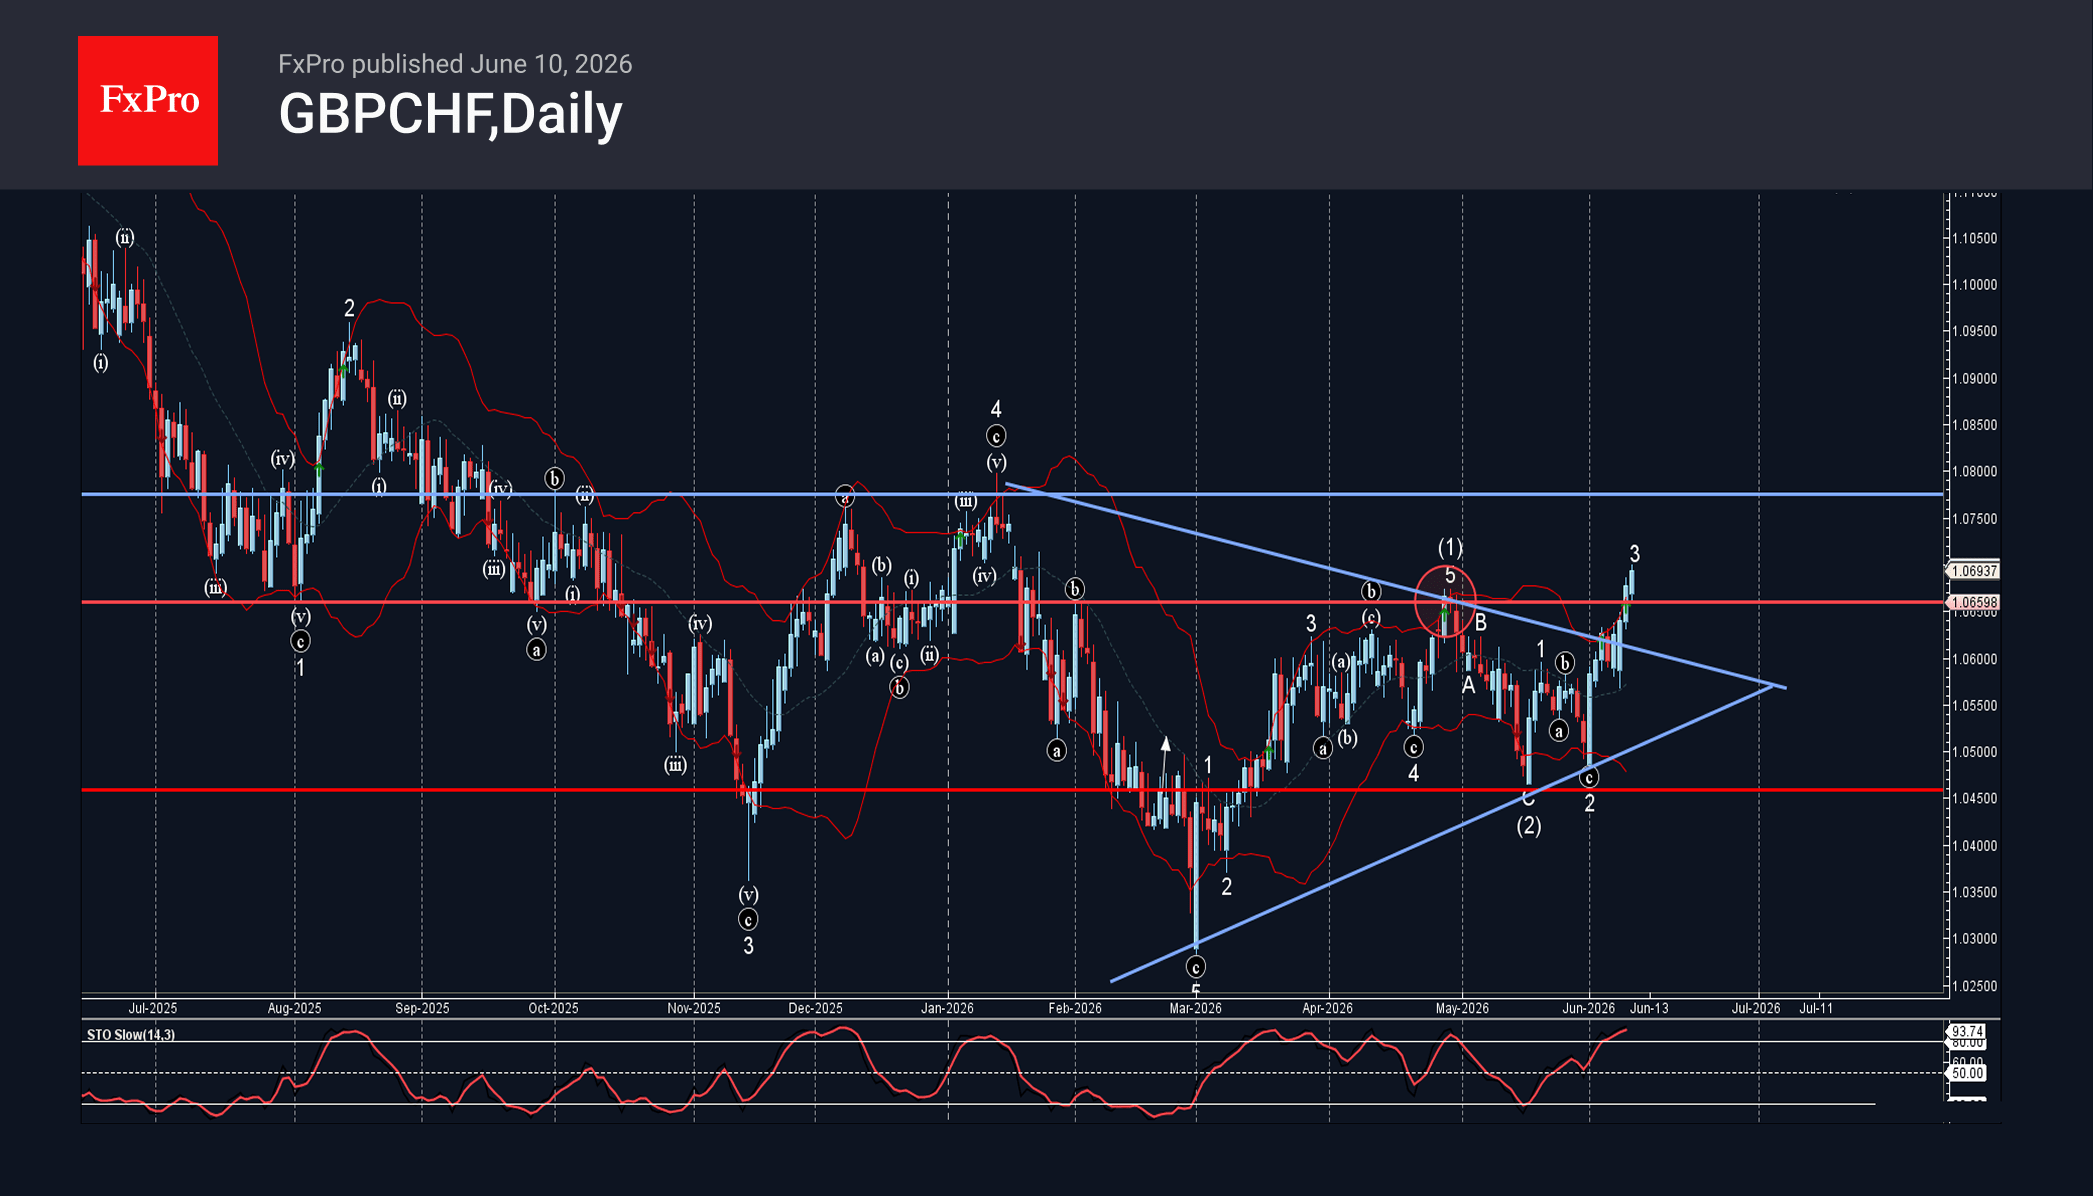
GBPCHF Wave Analysis
GBPCHF: ⬆️ Buy
– GBPCHF broke key resistance level 1.0660
– Likely to rise to resistance level 1.0775
GBPCHF currency pair recently broke above the key resistance level 1.0660 (which stopped the previous impulse wave (1) at the end of April).
The breakout of the resistance level 1.0660 was followed by the breakout of the daily Triangle from January.
Given the strong Swiss Franc sales seen today, GBPCHF currency pair can be expected to rise to the next resistance level 1.0775, which has been reversing the price from October.
Eco Data 6/11/26
| GMT | Ccy | Events | Act | Cons | Prev | Rev |
|---|---|---|---|---|---|---|
| 23:01 | GBP | RICS Housing Price Balance May | -35% | -32% | -34% | -35% |
| 23:50 | JPY | BSI Large Manufacturing Q2 | -1.8 | 4.2 | 3.8 | |
| 01:00 | AUD | Consumer Inflation Expectations Jun | 5.50% | 5.60% | ||
| 12:15 | EUR | ECB Deposit Rate | 2.25% | 2.25% | 2.00% | |
| 12:15 | EUR | ECB Main Refinancing Rate | 2.40% | 2.40% | 2.15% | |
| 12:15 | EUR | ECB Monetary Policy Statement | ||||
| 12:30 | CAD | Building Permits M/M Apr | -7.60% | -3.70% | 10.30% | 10.60% |
| 12:30 | USD | Initial Jobless Claims (Jun 5) | 229K | 225K | 225K | |
| 12:30 | USD | PPI M/M May | 1.10% | 0.70% | 1.40% | 1.10% |
| 12:30 | USD | PPI Y/Y May | 6.50% | 6.40% | 6.00% | 5.70% |
| 12:30 | USD | PPI Core M/M May | 0.40% | 0.50% | 1.00% | 0.70% |
| 12:30 | USD | PPI Core Y/Y May | 4.90% | 5.40% | 5.20% | 4.90% |
| 12:45 | EUR | ECB Press Conference | ||||
| 14:30 | USD | Natural Gas Storage (Jun 5) | 108B | 101B | 95B |
| 23:01 | GBP |
| RICS Housing Price Balance May | |
| Actual | -35% |
| Consensus | -32% |
| Previous | -34% |
| Revised | -35% |
| 23:50 | JPY |
| BSI Large Manufacturing Q2 | |
| Actual | -1.8 |
| Consensus | 4.2 |
| Previous | 3.8 |
| 01:00 | AUD |
| Consumer Inflation Expectations Jun | |
| Actual | 5.50% |
| Consensus | |
| Previous | 5.60% |
| 12:15 | EUR |
| ECB Deposit Rate | |
| Actual | 2.25% |
| Consensus | 2.25% |
| Previous | 2.00% |
| 12:15 | EUR |
| ECB Main Refinancing Rate | |
| Actual | 2.40% |
| Consensus | 2.40% |
| Previous | 2.15% |
| 12:15 | EUR |
| ECB Monetary Policy Statement | |
| Actual | |
| Consensus | |
| Previous | |
| 12:30 | CAD |
| Building Permits M/M Apr | |
| Actual | -7.60% |
| Consensus | -3.70% |
| Previous | 10.30% |
| Revised | 10.60% |
| 12:30 | USD |
| Initial Jobless Claims (Jun 5) | |
| Actual | 229K |
| Consensus | 225K |
| Previous | 225K |
| 12:30 | USD |
| PPI M/M May | |
| Actual | 1.10% |
| Consensus | 0.70% |
| Previous | 1.40% |
| Revised | 1.10% |
| 12:30 | USD |
| PPI Y/Y May | |
| Actual | 6.50% |
| Consensus | 6.40% |
| Previous | 6.00% |
| Revised | 5.70% |
| 12:30 | USD |
| PPI Core M/M May | |
| Actual | 0.40% |
| Consensus | 0.50% |
| Previous | 1.00% |
| Revised | 0.70% |
| 12:30 | USD |
| PPI Core Y/Y May | |
| Actual | 4.90% |
| Consensus | 5.40% |
| Previous | 5.20% |
| Revised | 4.90% |
| 12:45 | EUR |
| ECB Press Conference | |
| Actual | |
| Consensus | |
| Previous | |
| 14:30 | USD |
| Natural Gas Storage (Jun 5) | |
| Actual | 108B |
| Consensus | 101B |
| Previous | 95B |