Sample Category Title
RBA and Inflation View: June Hold Affirmed, Increases Still Ahead
We affirm our previously published view that the RBA will remain on hold in June, but increase rates in coming months given inflation risks.
- We affirm our existing expectation that the RBA Monetary Policy Board (MPB) will hold the cash rate steady at its June meeting next week. Although inflation remains above target, the previous three rate increases have given the MPB time to assess cross-cutting trends of weak consumers and housing markets versus high inflation pressures and a secular boom in data centres and related investment. The recent run of inflation and labour market data has been a bit mixed, supporting the case for a pause.
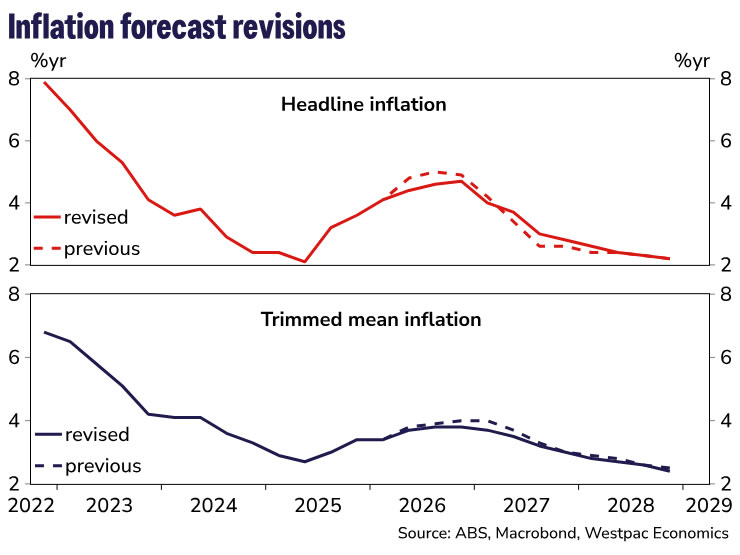
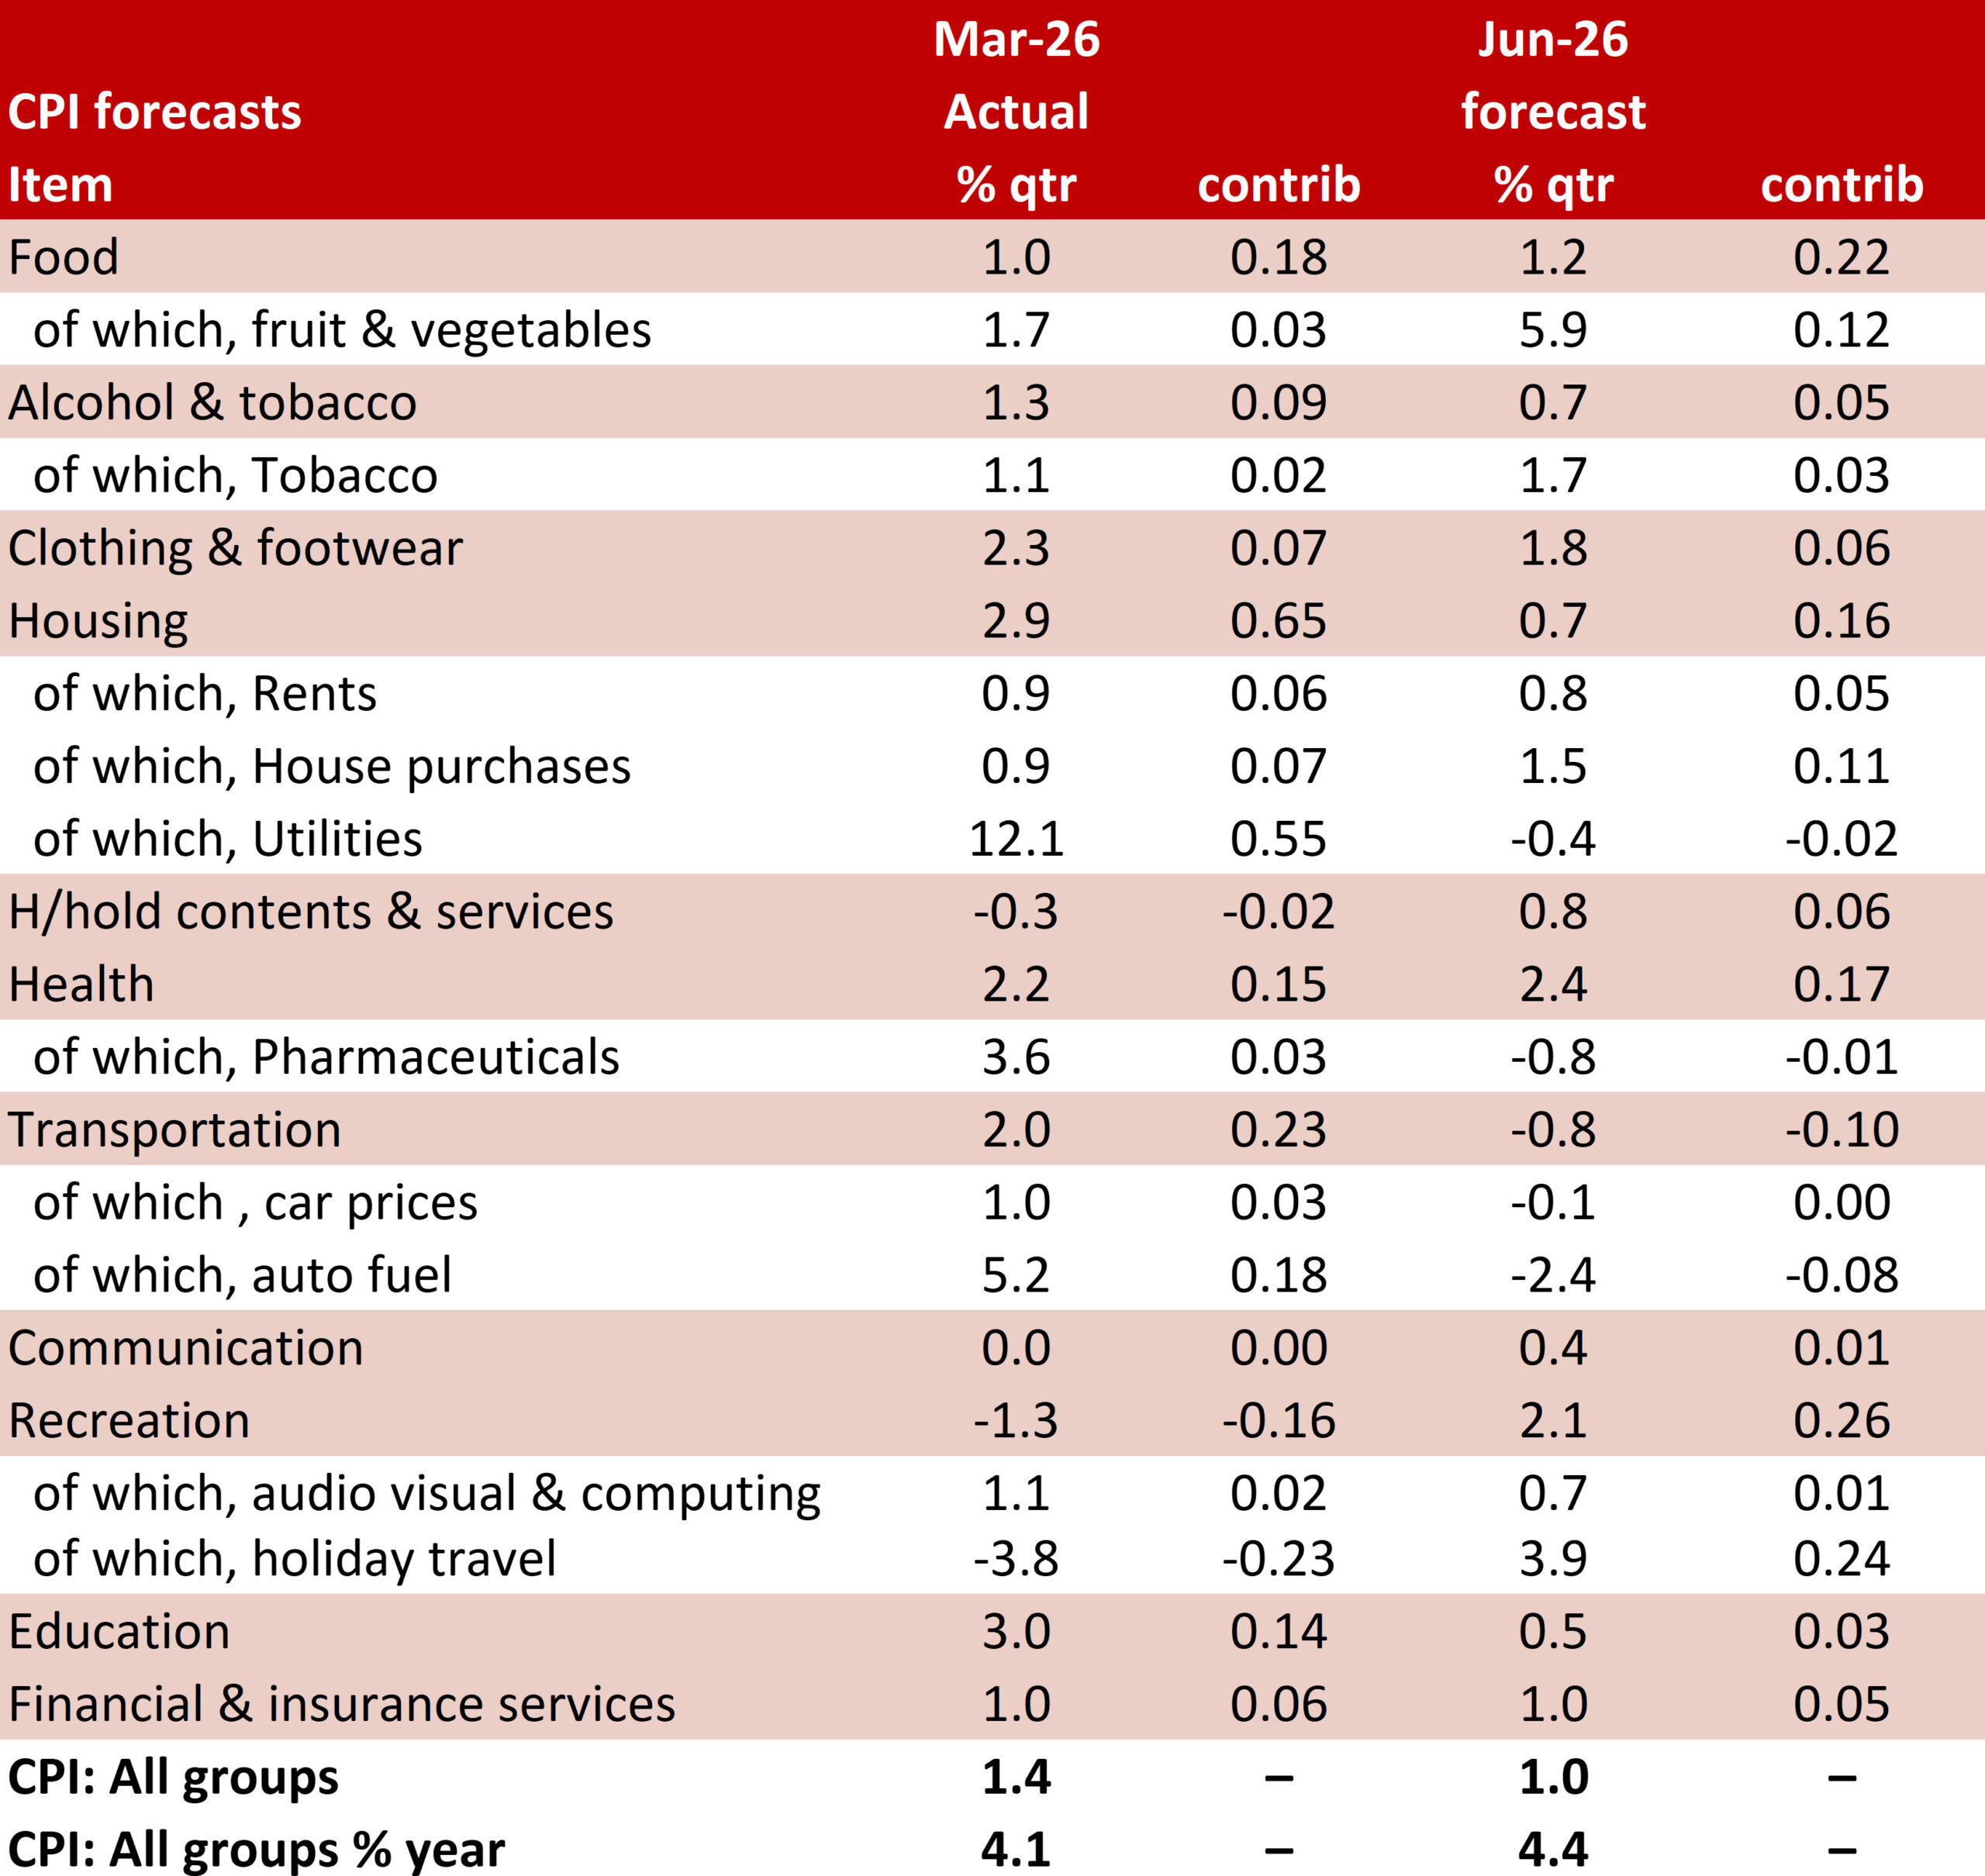
- We update our inflation forecasts below, ahead of the release of our June Market Outlook publication later today. A lower peak for oil, and thus petrol and diesel, prices lowers the peak for headline inflation from 5.0% to 4.7%. Trimmed mean inflation is revised marginally lower across Q2, Q3 and Q4, lowering the peak in the year-ended rate from 4.0%yr to 3.8%yr. We continue to see significant pass-through from higher fuel costs into some other prices. In addition, the larger-than-expected increase in award wages will add a little to some market services components of the CPI, where labour costs are particularly important and many workers are on awards.
- This slightly lower track for underlying inflation is still higher than the RBA’s own forecasts. If we are right about the inflation profile from here, the RBA will be surprised on the upside. We therefore retain our view that further rate hikes will occur in the following meetings (August and September). This is consistent with the RBA’s priority to get inflation down. While ever inflation trends are this far away from the 2.5% target midpoint and showing little tendency to decline, the MPB will regard soft outcomes for the consumer and housing sectors as being a necessary part of the transmission of monetary policy.
- The risks are clearly on the downside, though, in the sense that zero or one further hike is much more likely than three hikes. A more extended pause would be associated with a smaller overall hiking cycle.
While markets are increasingly pricing a faster resolution, our base case for the reopening of the Strait of Hormuz and Gulf oil supply normalisation remains broadly unchanged. We continue to assume shipping rises to around 10% of normal levels by end-June, with full normalisation not occurring until mid-2027.
Q2 average Brent spot and dated prices are tracking below our baseline assumptions of US$110 and US$125 respectively, reflecting a decline in supply risk premia following the ceasefire and a less tight crude balance than anticipated. Stronger-than-expected US exports and weaker Chinese import demand have provided a near-term buffer, though prices have remained volatile amid shifting headlines.
We have lowered our price assumptions through Q2–Q4 2026, with the largest downgrade in Q3 (–US$13/bbl) and a smaller adjustment in Q4, while leaving 2027 broadly unchanged. Prices are likely to fall, potentially below US$90/bbl, on confirmation of a deal and the resumption of shipping, before it becomes evident that the pace of normalisation in traffic and Gulf production will be gradual. The Q2 buffer from US exports is unlikely to persist, while some recovery in Chinese demand is expected. Beyond 2026, we continue to assume a gradual normalisation in shipping and production, alongside a rebuild in global strategic reserves from H2 2027.
Petrol and diesel price assumptions have been revised materially lower across Q2–Q4 2026, reflecting the softer oil price backdrop. The largest adjustments occur in Q3, where petrol is down around 20c/l and diesel close to 100c/l, averaging $2.05/l and $2.39/l respectively.
Following on from these revisions, we have lowered the near-term inflation profile which is partly offset by a stronger wages outlook feeding into market services.
Headline inflation is expected to reach 4.4%yr in Q2 and peak later at 4.7%yr in Q4 (previously 5.0%yr in Q3). Base effects see a more gradual easing thereafter in year-ended terms, with inflation reaching 2.8%yr by end-2027 and 2.2%yr by end-2028.
Trimmed mean inflation has also been revised lower, reaching 3.7%yr in Q2 before peaking at 3.8%yr in Q3 and holding through Q4 (down from 4.0%yr). The quarterly path for the remainder of 2026 is 1.0%, 1.1% and 0.9% – the H2 2026 profile sits slightly above that implied by the RBA’s May Statement on Monetary Policy forecasts. Trimmed mean inflation is expected to return to the RBA’s target band by end-2027 (3.0%yr) and ease to 2.4%yr by end-2028.
While the near-term profile is lower, the risk of second-round effects from higher fuel costs to broader prices remains. Current policy measures are dampening the pass-through, but with most of these set to expire by the end of June, the bulk of the impact from higher freight costs still lies ahead. Additionally, the impact of higher fertiliser costs will likely feed through in the second half of this year with industry surveys showing growers are scaling back planting schedules in response to higher input costs. Drier weather conditions, with the risk of a more severe El Niño, also adds upside pressure.
They key downside risks to our profile stem from weaker consumer demand that limits firms’ ability to pass through higher costs and a faster-than-expected normalisation of shipping through the Strait of Hormuz.
The RBA faces a difficult set of trade-offs in its near-term monetary policy decisions. As well as the more benign developments in energy prices and the conflict more broadly, some domestic data releases have been softer than generally expected. Consumer spending looks to have stalled, tax changes have induced uncertainty in the housing market, and sentiment surveys have weakened. Weak GDP reads are likely in coming quarters.
At the same time, Australia started the year with inflation too high, and the second-round inflation response to higher energy prices is becoming more evident in the data. While the RBA has already tightened policy in response to the lift in inflation that pre-dated the Middle East conflict, business surveys and other information suggest that the pass-through of higher energy prices to other prices has been significant and front-loaded. Contention for resources to construct the pipeline of data centres – an investment boom largely impervious to interest rates – will add to cost pressures.
We continue to expect that the RBA will pause at its June meeting as it assesses the data flow. However, we believe it will remain focused on getting inflation back down to target and will be less swayed by some of this softer data than some observers might assume. Indeed, it is likely that it views the softer data as being a necessary part of the transmission of restrictive monetary policy. Trimmed mean inflation is drifting up, and even after revising the outlook for the somewhat better oil price trajectory, our base case remains higher than the RBA’s May forecasts through the rest of this year. Pass-through is starting to become evident in categories such as home-building costs, dining out and postal and courier services.
Because our inflation forecast is above the RBA’s most recent published forecast, it implies that the RBA will receive an upside surprise in coming months. This implies further rate hikes as the second-round inflation impact of the energy price shock emerge. Given the weaker outlook for the household sector, risks are skewed to the downside, in the sense that zero or one hike from here is much more likely than three hikes. We still regard our two-hike track as the most appropriate base case view, given the inflation outlook.
Cliff Notes: Stuck in the Moment
Key insights from the week that was.
Our latest Westpac-MI Consumer Sentiment Survey proves the tense backdrop of elevated inflation, restrictive interest rates and heightened economic and political uncertainty is weighing heavily on the consumer mood. The headline index fell 2.9% to 80.6 in May, leaving sentiment stuck near pandemic-era lows. Cost-of-living pressures are the chief concern: ‘family finances vs a year ago’ and ‘family finances next 12 months’ down 7.5% and 8.5% respectively, reversing April’s reprieve and leaving both measures circa 20% below historical averages. This tone is hardly surprising given inflation expectations are holding around 5½%yr, 3ppts above the RBA’s target range mid-point.
It is notable that RBA Governor Bullock has characterised the three rate hikes delivered earlier this year as necessary to deal with the domestic inflation risks present before the Middle East conflict began, and that this “gives space” for the RBA to see how the conflict plays out. Markets are increasingly adopting a sanguine view on the conflict despite a run of military strikes, seeing Brent oil generally trade between US$90 and US$95 per barrel over the past week, with the lower limit of that range tested overnight after President Trump announced a deal would be signed in coming days (more below). While the RBA is set to pause in June, input cost inflation and the threat of broad-based passthrough still makes the case for further rate hikes in August and September.
Over two-thirds of respondents to the consumer sentiment survey also expect a further increase in mortgage rates over the next year. The threat of an additional squeeze on households’ real incomes makes for a pessimistic assessment on the near-term economic outlook amongst consumers, a viewpoint shared by business. The latest NAB business survey showed that business confidence remained very weak in May, though a moderation in cost pressures lifted the collective mood slightly. Business conditions are reportedly stalling as profit margins are squeezed by higher costs. This is consistent with our view for GDP growth to hold below the pace of population growth through 2026. Our detailed forecasts will be published later today in our June Market Outlook on WestpacIQ.
In the US, May non-farm payrolls materially beat expectations, gaining 172k against a circa 90k expectation, with 93k in back revisions to March and April. These results left the 3-month average at 188k, three times April's initial 48k. The unemployment rate and participation rate were unchanged, however, at 4.3% and 61.8%. Average hourly earnings were also benign at 0.3%, 3.4%yr. Headline US CPI inflation then printed in line with expectations at an elevated 0.5% in May, principally due to a 3.9%mth jump in energy prices. But core inflation has printed at 0.2% for four of the past six months (including May), and the monthly average is 0.25%, suggesting underlying inflation in the US is only modestly above the 2.0%yr medium-term target. While the market has been flirting with the idea of impending rate hikes by the FOMC, these data points instead suggest the best course is for the Committee to remain on hold.
An extended period of on-hold policy is also likely to be seen in Canada. Having left the policy rate unchanged in June, the Bank of Canada highlighted that the Middle East conflict and US trade policy are lingering risks for inflation, but Canadian GDP is weak, having disappointed in Q1 at -0.1%, and employment stalled on a multi-month basis. A recovery in growth in coming quarters is still expected to leave Canada with excess supply, allowing the initial impacts of the current energy shock to be looked through, unless evidence of secondary effects materialise.
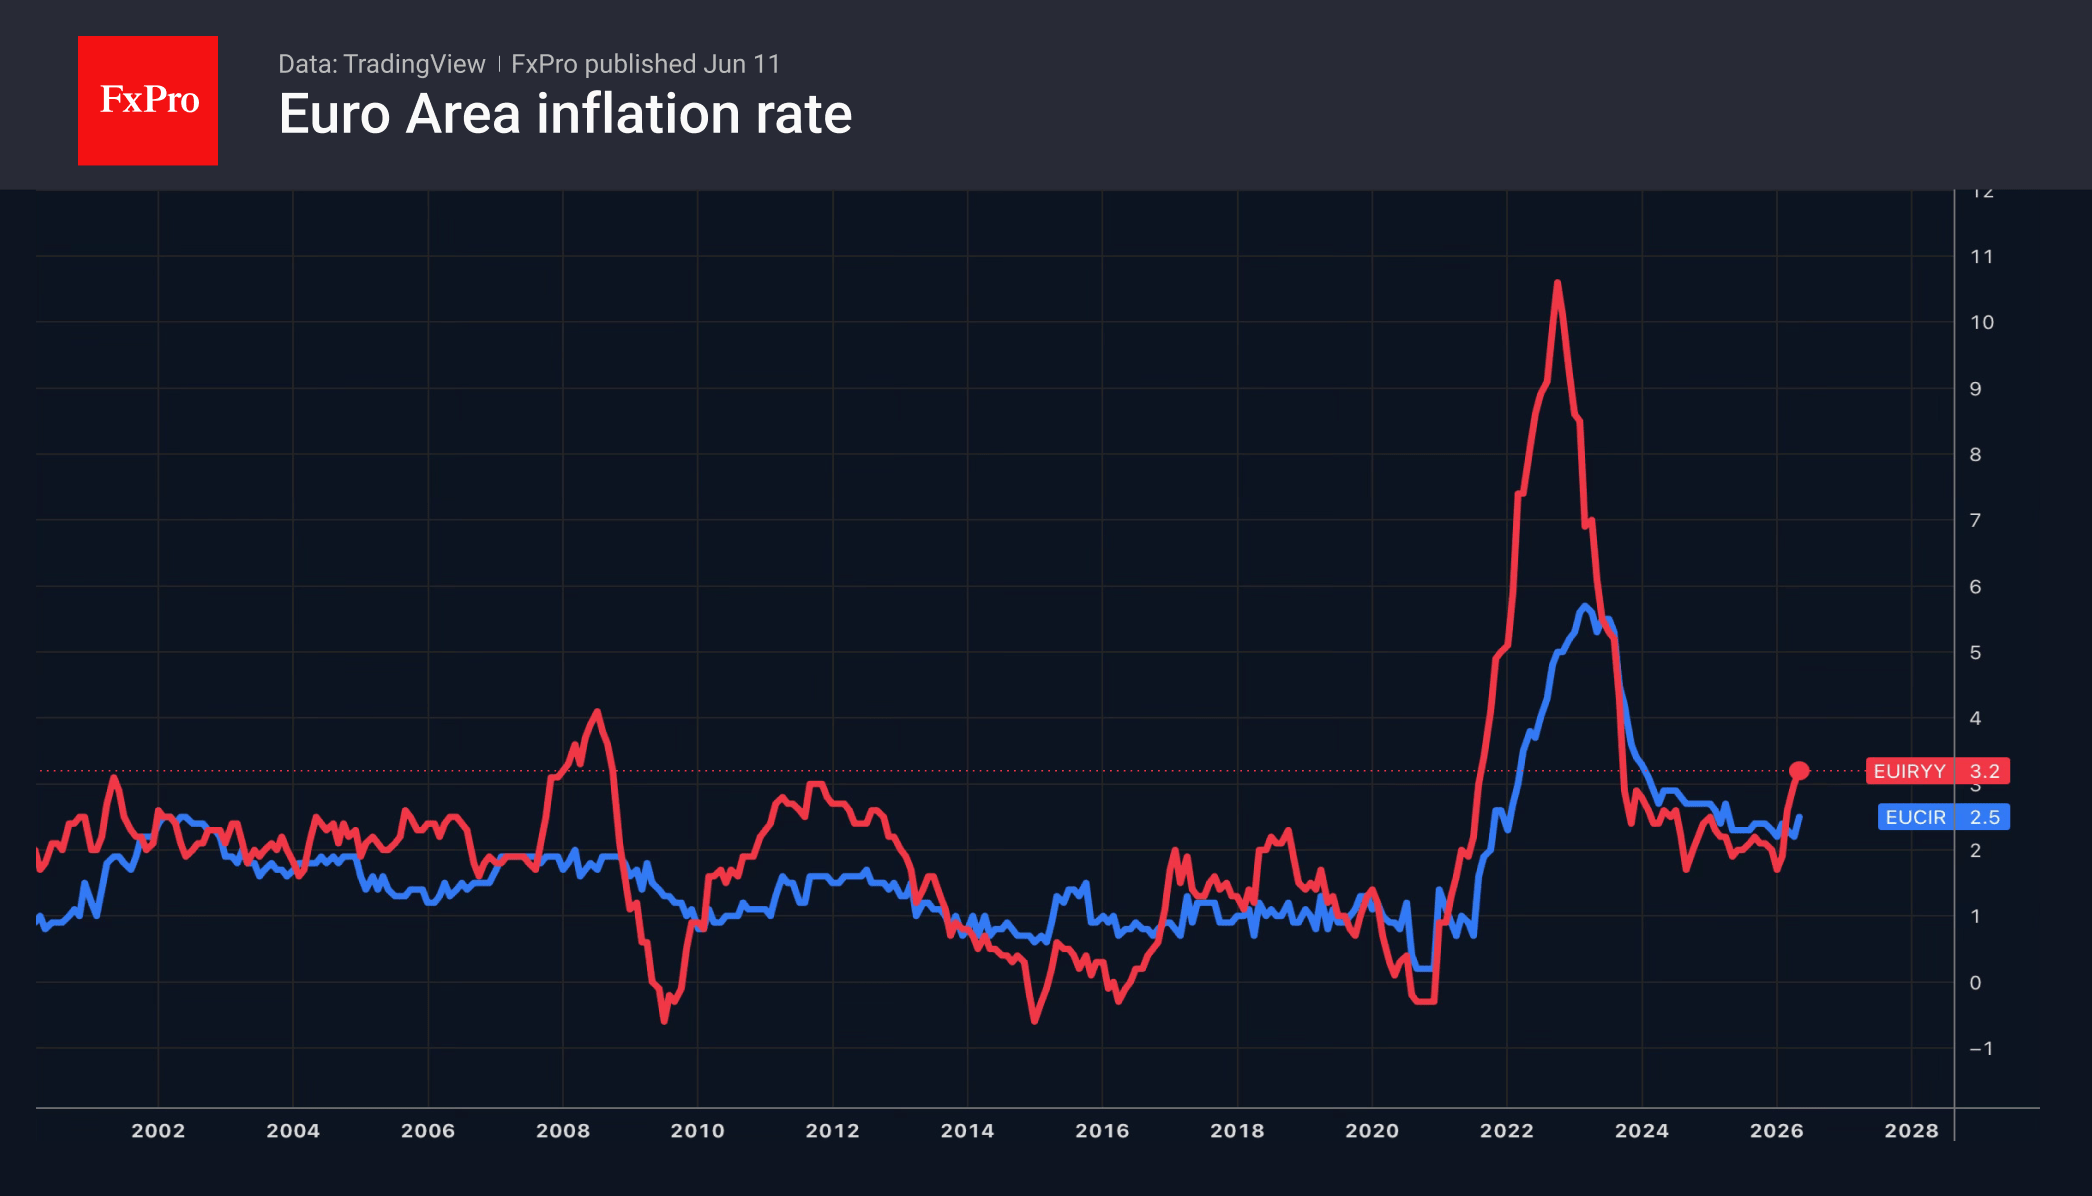
In contrast, the ECB is now officially back in tightening mode. The Governing Council delivered an expected 25bp increase at their June meeting. In the press conference, President Lagarde indicated that policymakers had little doubt about the need to tighten policy, with the decision taken unanimously and no alternative options considered. The policy statement was explicit that this shift is a response to inflationary pressures stemming from the war in the Middle East, which, looking ahead, will depend on “the intensity and duration of the energy price shock, as well as the scale of its indirect and second-round effects”.
The ECB’s new economic projections illustrated the range of possible effects the war could have on the economy. The baseline projects GDP growth of 0.8%yr this year and 1.2%yr next year, 0.1ppts lower than the last update. The adverse and severe stress scenarios instead point to materially weaker growth in the near term, with the economy slipping into a technical recession in both cases. On inflation, the baseline outlook now sees inflation peaking at 3.4%yr, up from 3.1%yr previously, and remaining elevated for longer. The adverse and severe scenarios showed headline HICP inflation peaking at 4.1%yr and 6.3%yr respectively, little changed from the March projections. Looking ahead, President Lagarde’s comments confirm that inflationary momentum is broadening, suggesting a single 25bp hike is unlikely to be sufficient. So, we expect another hike, most likely in September when the ECB will next update its projections.
In closing, it is worth highlighting the state of the Middle East conflict. The past week has been eventful to say the least. Last weekend, Iran and Israel hit one another with several barrages of missiles. The US requested the hostilities cease, and both Iran and Israel acquiesced. But an Iranian drone then hit a US Apache helicopter patrolling the Strait of Hormuz, seeing the US retaliate with force against numerous Iranian military assets. Iran then responded, and the US followed up with further attacks. A reported request from Iran to cease the attack saw President Trump cease fire on Thursday only to again threaten to hit Iran “VERY HARD” on Friday and to take control of Iran’s oil production facilities. Within hours though, President Trump announced that an agreement had been reached and would be signed off in coming days, leading to a re-opening of the Strait. Brent crude currently trades around US$90, having initially broke through that level. Participants are clearly hopeful this update will prove accurate and herald at least a temporary end to the conflict.
AUDCAD Wave Analysis
AUDCAD: ⬆️ Buy
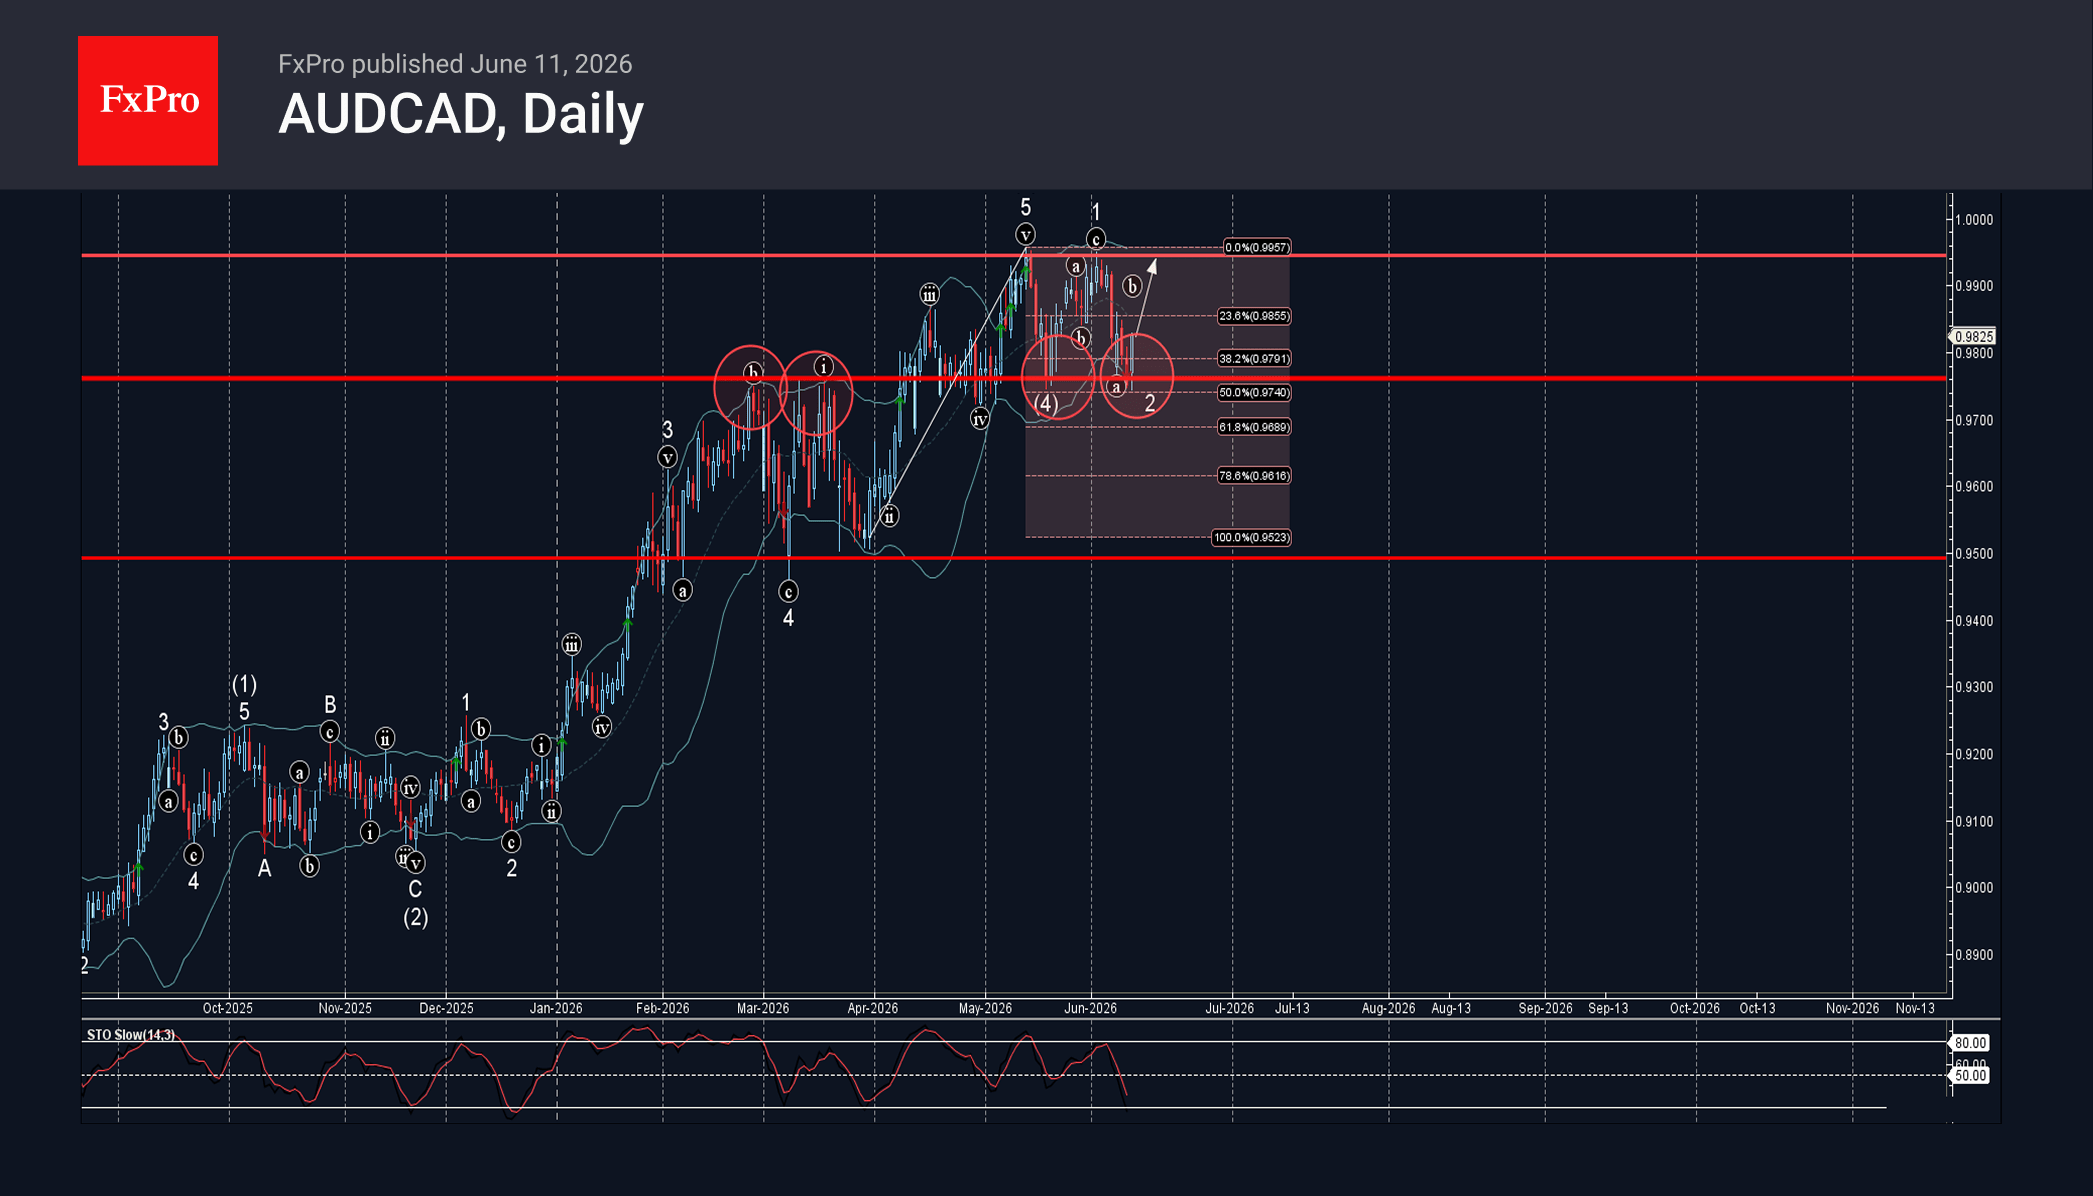
– AUDCAD reversed from support zone
– Likely to rise to resistance level 0.9945
AUDCAD currency pair recently reversed from the support zone between the support level 0.9761 (former resistance from February and March, low of earlier wave (4)) and the lower daily Bollinger Band.
The upward reversal from this support zone stopped the previous minor correction 2.
Given the clear daily uptrend, AUDCAD currency pair can be expected to rise to the next resistance level 0.9945 (which stopped earlier waves 5 and 1).
USDJPY Wave Analysis
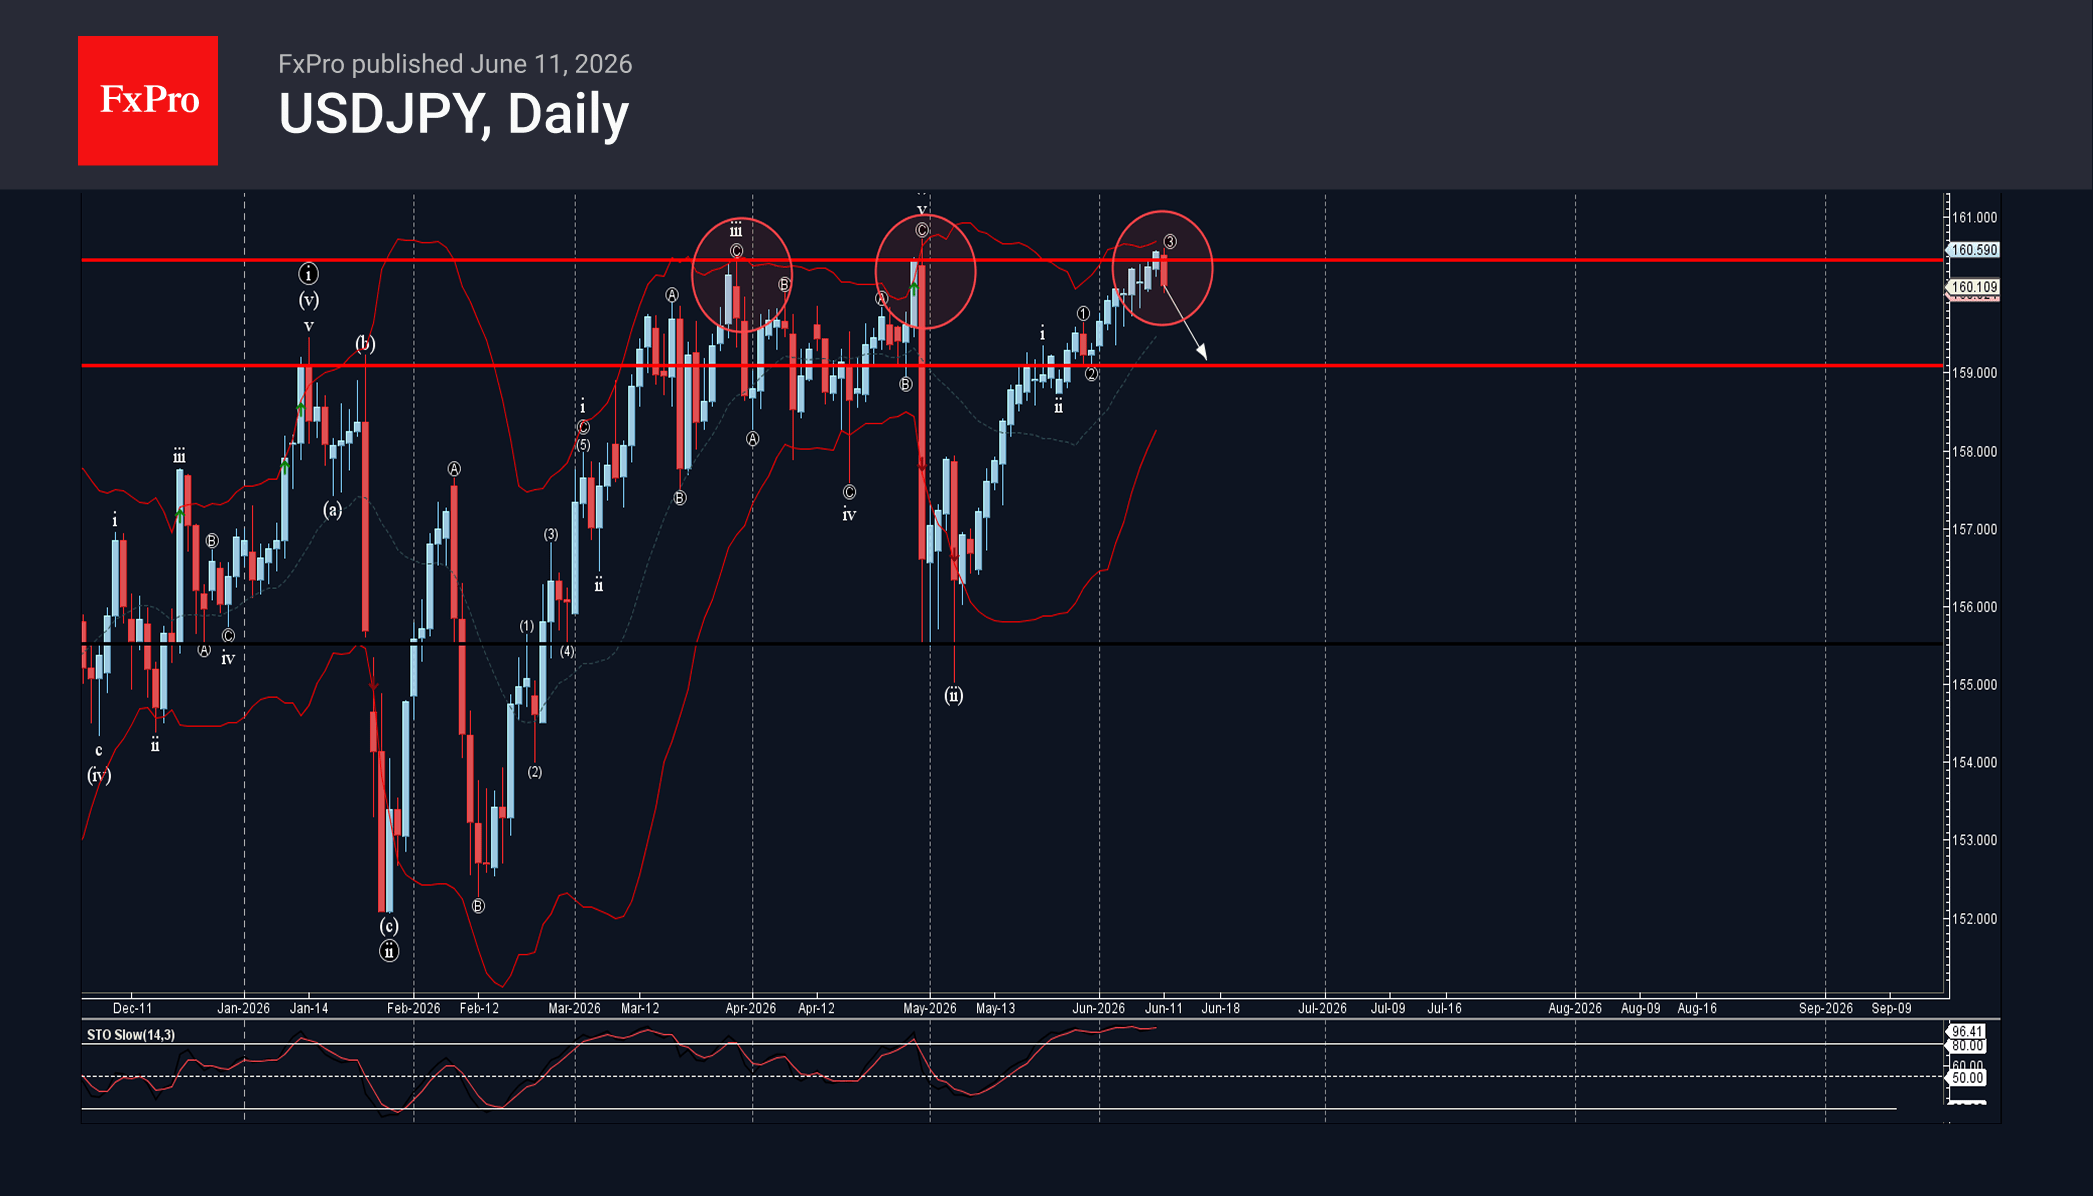
USDJPY: ⬇️ Sell
– USDJPY reversed from strong resistance level 160.50
– Likely to fall to support level 159.00
USDJPY currency pair recently reversed down from the strong resistance level 160.50 (which has been reversing the price from the end of March).
The resistance zone near the resistance level 160.50 was strengthened by the upper daily Bollinger Band.
Given the strength of the resistance level 160.50 and the overbought daily Stochastic, USDJPY currency pair can be expected to fall to the next support level 159.00.
Eco Data 6/12/26
| GMT | Ccy | Events | Act | Cons | Prev | Rev |
|---|---|---|---|---|---|---|
| 22:30 | NZD | Business NZ PMI May | 49.9 | 50.5 | 50.4 | |
| 04:30 | JPY | Industrial Production M/M Apr F | 0.50% | 0.80% | 0.80% | |
| 06:00 | EUR | Germany CPI M/M May F | -0.20% | -0.20% | -0.20% | |
| 06:00 | EUR | Germany CPI Y/Y May F | 2.60% | 2.60% | 2.60% | |
| 06:00 | GBP | GDP M/M Apr | -0.10% | -0.10% | 0.30% | |
| 06:00 | GBP | Goods Trade Balance (GBP) Apr | -26.0B | -22.5B | -27.2B | |
| 08:30 | GBP | Consumer Inflation Expectations | 4.00% | 3.20% | ||
| 14:00 | USD | UoM Consumer Sentiment Jun P | 48.9 | 46 | 44.8 | |
| 14:00 | USD | UoM 1-Yr Inflation Expectations Jun P | 4.60% | 4.80% |
| 22:30 | NZD |
| Business NZ PMI May | |
| Actual | 49.9 |
| Consensus | |
| Previous | 50.5 |
| Revised | 50.4 |
| 04:30 | JPY |
| Industrial Production M/M Apr F | |
| Actual | 0.50% |
| Consensus | 0.80% |
| Previous | 0.80% |
| 06:00 | EUR |
| Germany CPI M/M May F | |
| Actual | -0.20% |
| Consensus | -0.20% |
| Previous | -0.20% |
| 06:00 | EUR |
| Germany CPI Y/Y May F | |
| Actual | 2.60% |
| Consensus | 2.60% |
| Previous | 2.60% |
| 06:00 | GBP |
| GDP M/M Apr | |
| Actual | -0.10% |
| Consensus | -0.10% |
| Previous | 0.30% |
| 06:00 | GBP |
| Goods Trade Balance (GBP) Apr | |
| Actual | -26.0B |
| Consensus | -22.5B |
| Previous | -27.2B |
| 08:30 | GBP |
| Consumer Inflation Expectations | |
| Actual | 4.00% |
| Consensus | |
| Previous | 3.20% |
| 14:00 | USD |
| UoM Consumer Sentiment Jun P | |
| Actual | 48.9 |
| Consensus | 46 |
| Previous | 44.8 |
| 14:00 | USD |
| UoM 1-Yr Inflation Expectations Jun P | |
| Actual | 4.60% |
| Consensus | |
| Previous | 4.80% |
Sunset Market Commentary
Markets
The ECB as expected raised the policy rate by 25 bps to 2.25% today. It said the war in the Middle East is generating inflation pressures, making the case for a hike “across a range of scenarios”. The central bank stayed vague on future moves. It remains well positioned to navigate the uncertainty and will follow a data-dependent and meeting-by-meeting approach. Updated forecasts, however, suggests at least one more increase is in the making. Headline inflation was jacked up to 3%-2.3%-2% in 2026-2028 from 2.6%-2%-2.1% in March. Higher energy prices are expected to feed into food, goods and services inflation to some extent, prompting a significant bump in core inflation forecasts (2.5%-2.5%-2.2%) as well, to be well above 2% across the policy horizon. GDP forecasts were marginally revised down for this (0.8%) and next (1.2%) year, reflecting a more pronounced impact of the war on commodity markets, real incomes and confidence. 2028 was lifted to 1.5%. Inflation risks are tilted to the upside (energy prices, spillovers to wages and other prices, fragmented supply chains, raw material constraints …), those for growth to the downside (prolonged conflict, higher energy prices for longer, trade frictions, supply chain disruptions …). The full implications of the conflict ultimately depend on the intensity and duration of the energy shock as well as the scale of its indirect and second-round effects.
ECB chair Lagarde in the Q&A said the decision was unanimous with no alternative proposals (eg. bigger hike or status quo) discussed. She deflected a question on what to expect for next month or later this year. But she went into length to disregard the notion that today’s hike should be not at all be considered an insurance move. Instead the ECB is seeing and therefore reacting to the initial energy shock broadening. Lagarde added that they have developed a “milder” scenario next to the adverse and severe one relative to the base scenario. It’s unlikely to materialize, she said, but even in that case today’s hike was seen as appropriate. The ECB president didn’t say which of the scenarios is applicable today but referred to her March speech in which she outlined the reaction function of the central bank in three possible cases. Of those three, she dismissed the “see-through-the-shock” one. The second case - a large though not too persistent inflation overshoot which requires a measured policy adjustment - appears to be the dominant one instead. She sounded not too worried on growth. “It’s not as if we are in an environment where growth is absent or under significant threat.” With that, the door remains wide open for a further “measured adjustment”. Money markets are raising bets for back-to-back action in July with a hike currently discounted for +/- 65%. The broader market reaction was muddied by Donald J. Trump though. In a pre-presser message on social media, he said that the US will hit Iran very hard tonight. He threatened to “assume total control of” Iran’s oil and gas markets by taking Kharg Island, Iran’s oil export artery, “at some point”. Oil prices jumped up from intraday lows around $92 to $94, core bond yields erased earlier losses and the euro fell against the US dollar. All of that reversed meanwhile, suggesting markets aren’t buying into Trump’s threat. That could backfire.
News & Views
In the Norges Bank’s (NB) Q2 Regional Network Survey, contacts revised down growth prospects for the current quarter from 0.4% to 0.2%, but see growth picking up in Q3 (to 0.3%). All sectors (except oil services) expect higher activity ahead, even as customers become more hesitant. Investment in defence and emergency preparedness is boosting activity in commercial services. Activity in the construction sector stays weak. Slightly fewer contacts report capacity constraints and the share facing recruitment difficulties has declined somewhat. 30% of respondents report full capacity utilization. This indictor gradually eased to the lowest level since 2020. Recruitment difficulties have also eased for the likes of IT-expertise. Difficulties to recruiting several other skilled workers remain in place. Even so, estimated wage growth for this and next year is upwardly revised from 4.2% and 3.9% respectively in the Q1 survey to 4.5% and 4.1%. NOK 2-y swap yield declines 5 bps. Markets see <20% chance of a 25 bps hike next week. September is 90% discounted. The krone eases slightly further to EUR/NOK 10.99.
Euro Shrugs Off ECB Hike as Traders Refocus on Rising US-Iran Risks
The Euro was broadly steady after the ECB delivered its widely anticipated 25 basis point rate hike, as traders quickly shifted their attention back to the Middle East. While the central bank raised inflation forecasts and lowered growth projections, the decision largely matched expectations. More importantly, policymakers offered no guidance on what comes next, leaving markets with little reason to substantially reprice the outlook for Eurozone interest rates.
The most important sentence in the statement may have been the ECB's acknowledgment that "the war in the Middle East is generating inflation pressures." Policymakers also warned that higher energy costs are expected to feed into food, goods and services prices over time. That represents a clear recognition that the current inflation shock is no longer confined to oil markets and could eventually become more deeply embedded across the economy.
Yet despite that concern, ECB avoided any hint of a future rate path. The Governing Council repeated that it would follow a "data-dependent and meeting-by-meeting approach" and stressed that it is "not pre-committing to a particular rate path." Given the rapidly changing geopolitical environment, such caution was hardly surprising. The economic outlook now depends heavily on developments in energy markets and the trajectory of the conflict itself.
With the ECB event risk removed, markets are back focused on the next phase of the US-Iran confrontation. US President Donald Trump significantly escalated rhetoric today, declaring that the US military would hit Iran "VERY HARD TONIGHT" and promising to take control of key Iranian oil infrastructure, including Kharg Island. He also stated that an operation to assume "total control" of Iran's oil and gas markets would take place in the near future.
Those comments came after an already dangerous escalation over recent days. The US military launched strikes that it described as "self-defense" operations, while Iranian media reported fresh explosions at multiple locations. Kuwait and Bahrain remained on heightened alert following missile and drone attacks linked to the broader conflict. The situation continues to evolve rapidly, with markets struggling to assess whether the latest developments represent temporary escalation or the beginning of a more prolonged confrontation.
For investors, the key question is whether geopolitical developments will trigger another surge in oil prices. Currency markets currently reflect that uncertainty. Dollar is the strongest performer of the day, followed by Yen and Euro. At the other end of the spectrum, Kiwi leads losses, followed by Loonie and Aussie. The positioning suggests a cautious, risk-off environment where investors are seeking safety while remaining alert to the possibility that the next major market move comes from the Middle East.
ECB Hikes, Sees Higher Inflation, Lower Growth as Middle East Conflict Deepens
The ECB delivered its expected rate hike, but the bigger story was a sharp shift in its economic outlook. Inflation forecasts were revised higher, growth forecasts were revised lower, and policymakers explicitly warned that the Middle East war is generating inflation pressures across the Eurozone. Read More.
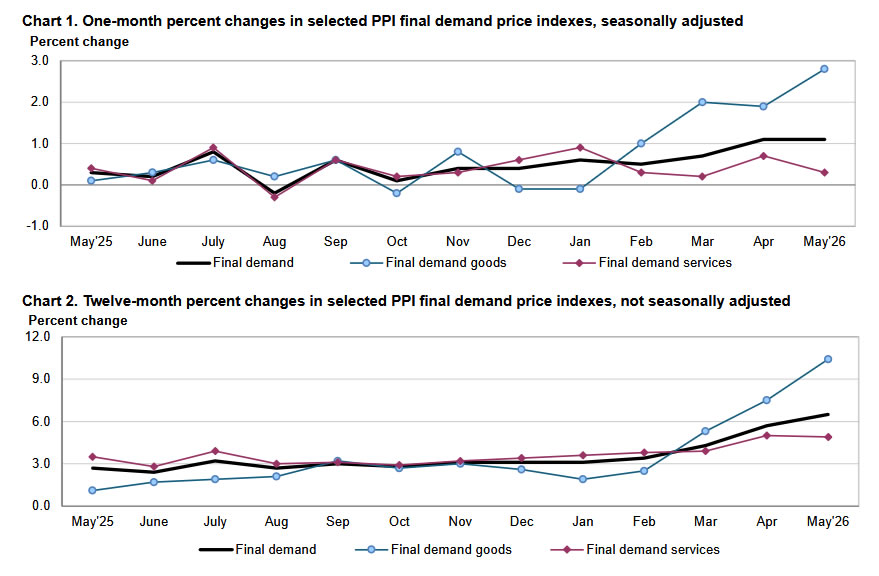
US PPI Jump 6.5%, Highest Since 2022, as Oil Shock Spreads
US CPI may have eased fears of an immediate inflation spiral, but producer prices are telling a different story. PPI surged to its highest annual rate since 2022, while core producer inflation recorded its strongest monthly increase in more than three years, highlighting persistent pipeline price pressures. Read More.
US Jobless Claims Rise to 229k, Continuing Claims Climb
US jobless claims moved higher again, adding to evidence that the labor market is gradually cooling. But with layoffs still low by historical standards and payroll growth holding up, the data is unlikely to distract Fed officials from their primary concern: inflation. Read More.
GBP/CHF's Head-and-Shoulders Bottom Points to Bigger Gains as BoE and SNB Diverge
GBP/CHF has completed a potentially major head-and-shoulders bottom as markets increasingly price divergent policy paths for the Bank of England and Swiss National Bank. With BoE still discussing the possibility of another hike and SNB expected to stay at 0%, the latest breakout may signal the start of a much larger trend reversal. Read More.
Trump, Iran and Hormuz: Brent Oil's Double Bottom Could Be the Real Warning
The Middle East conflict is escalating, Gulf states are increasingly being drawn into the crossfire, and Iran has declared the Strait of Hormuz closed. Yet Brent crude still trades as though diplomacy will eventually prevail. A developing double-bottom pattern may be the first sign that oil markets are starting to question that assumption. Read More.
EUR/USD Daily Outlook
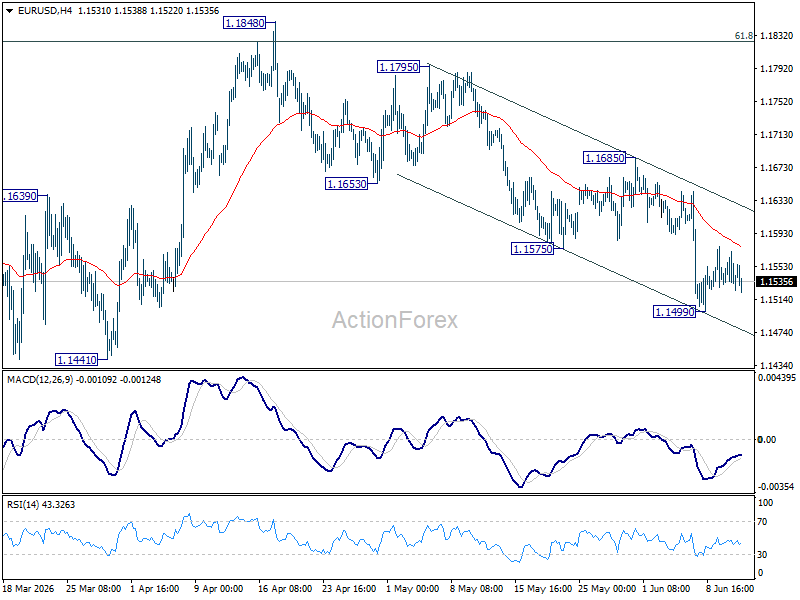
Range trading continues in EUR/USD above 1.1499 and intraday bias remains neutral. Risk will stay on the downside as long as 1.1685 resistance holds. Break of 1.4992 will resume the fall from 1.1848 to retest 1.1408 low next.
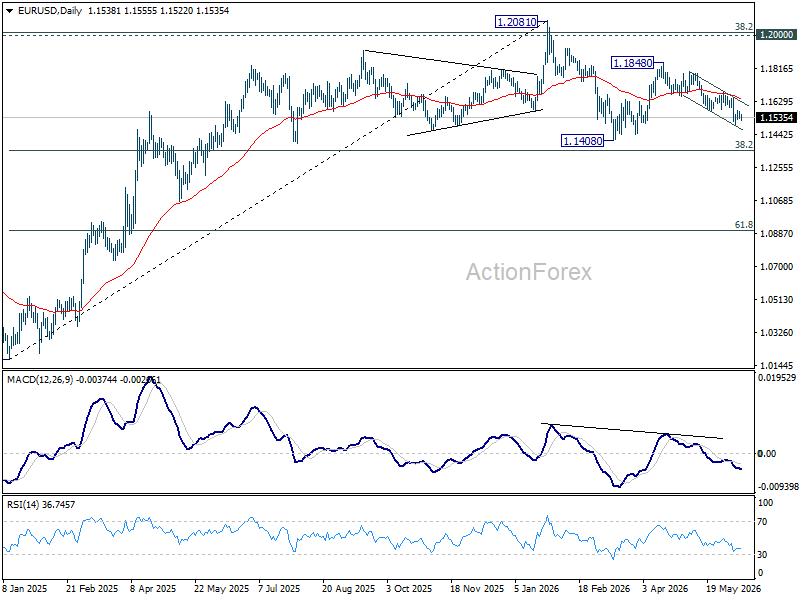
In the bigger picture, the strong support from 38.2% retracement of 1.0176 to 1.2081 at 1.1353 suggests that the pullback from 1.2081 is more likely a corrective move. Strong support was also found in 55 W EMA (now at 1.1547). Focus is back on 1.2 key cluster resistance level. Decisive break there will carry long term bullish implications. Nevertheless, break of 1.1408 support will revive the case of medium term bearish trend reversal.
The EURO: in the ECB’s Hands
- The European Central Bank meeting will clarify the outlook for EURUSD.
- The dollar is failing to capitalise on the favourable backdrop.
The US dollar has ignored the escalation of geopolitical tensions in the Middle East and the fall in stock indices. Neither its status as a safe-haven asset nor the deterioration in global risk appetite has helped. Moreover, following the report that consumer inflation accelerated to 4.2% in May, the chances of a Fed rate hike by the end of the year fell from 73% to 69%. Investors noted the month-on-month slowdown in price growth, which was interpreted as signalling that inflation had peaked. A subsequent decline in CPI growth will allow the central bank to keep rates on hold.
Pressure on the US dollar is being exerted by the oil market’s adjustment to supply disruptions and by expectations of the ECB’s rate-hiking cycle starting on 11 June. Markets are confident of a 25-basis-point hike in the deposit rate to 2.25%, amid evidence that high energy prices are beginning to feed through to core inflation. The central bank is expected to cut its GDP growth forecasts and raise its CPI projections.
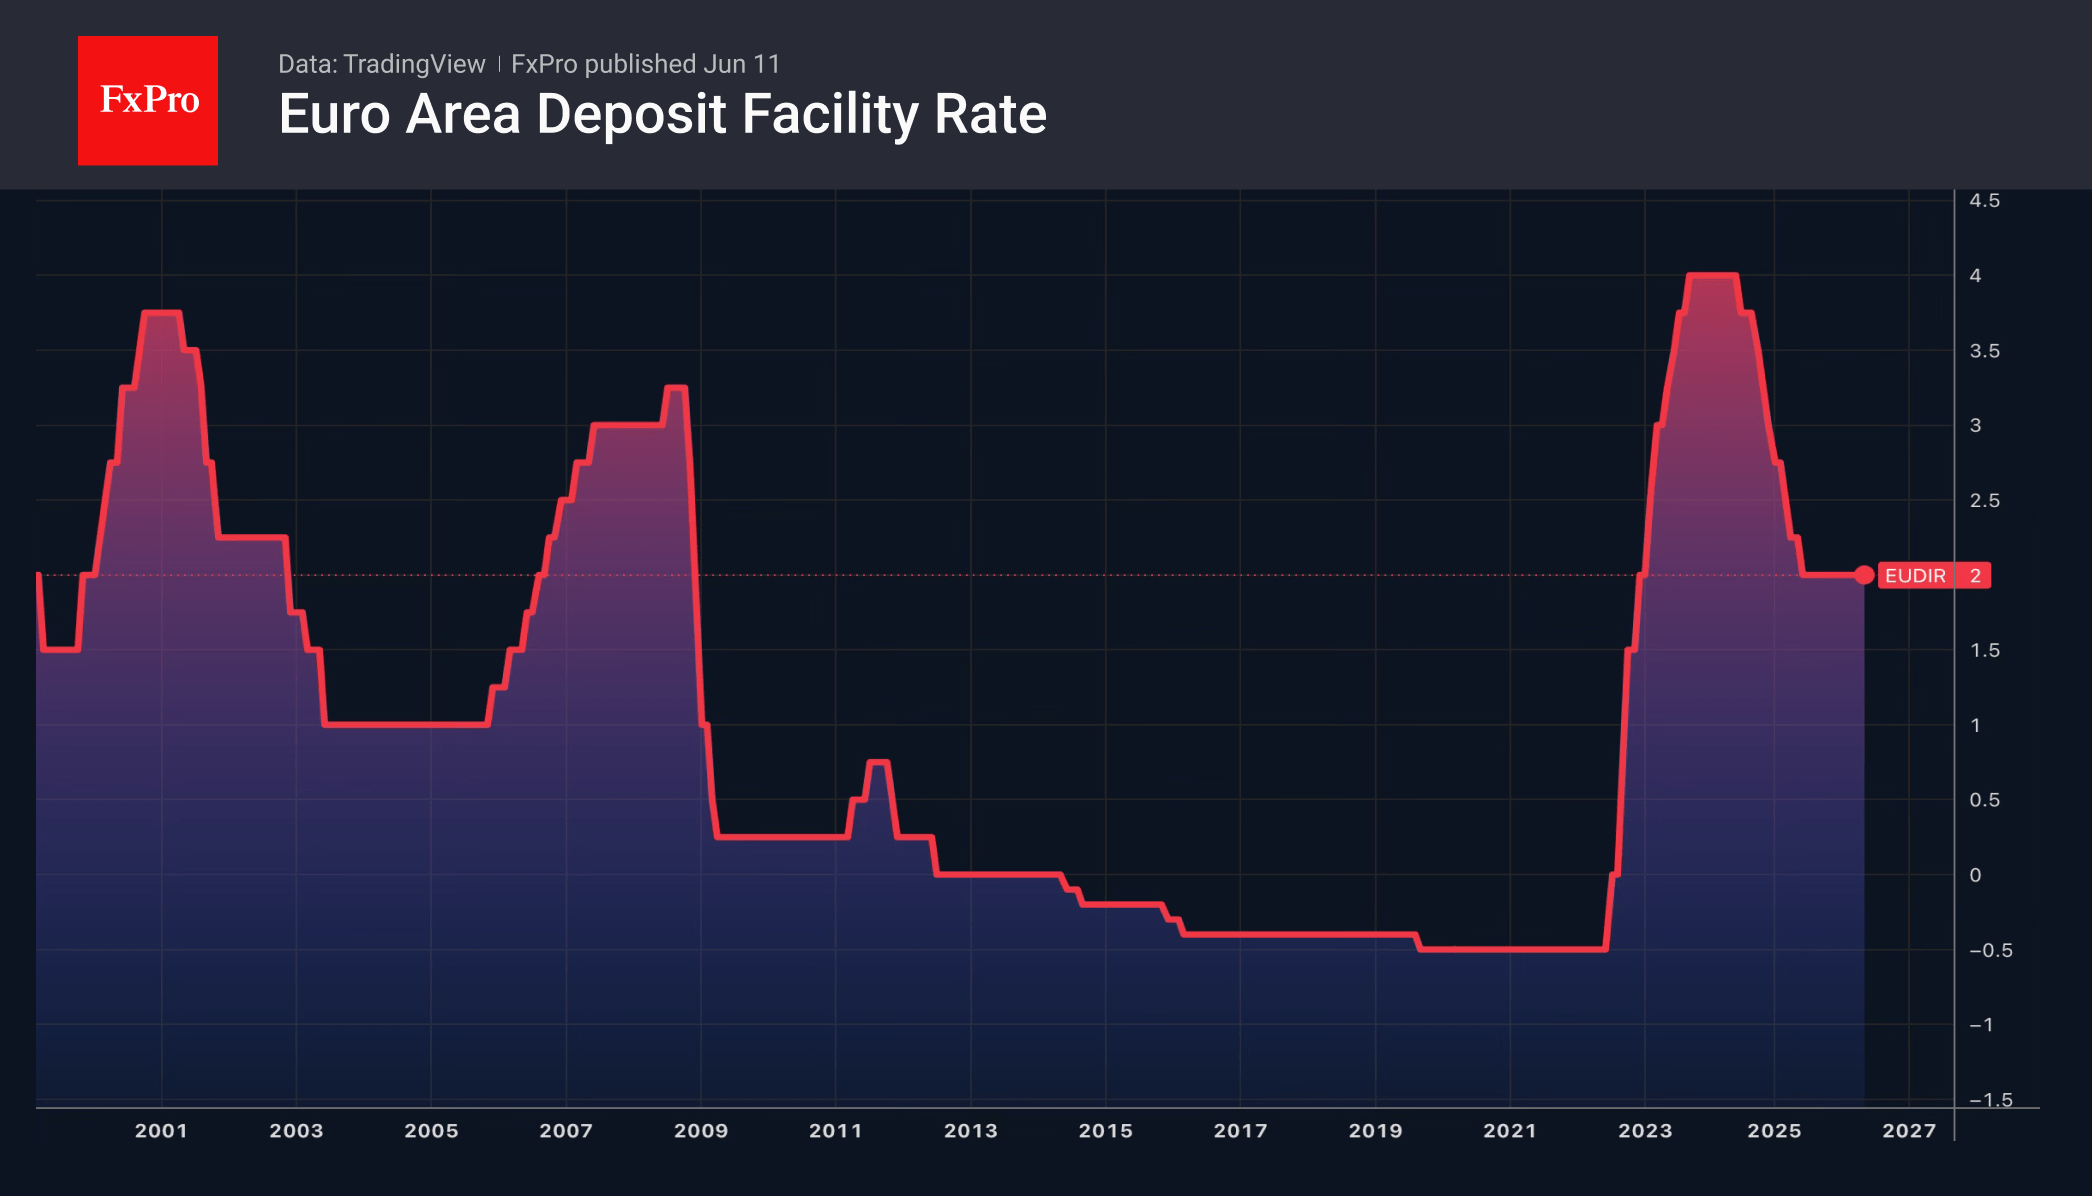
Bloomberg experts are forecasting two rate rises by the end of the year: in June and September, though some believe this could happen as early as July.
At the same time, investors warn that the European Central Bank could repeat a past mistake. According to TS Lombard, the 2011 rate rise was a policy error. At present, the ECB is more focused on inflation expectations and the scars left by 2022. Back then, it was too late to start tightening monetary policy.
2011 is not the only instance in which rate cuts followed hikes. A similar mistake was made in 2008, shortly before the global financial crisis.
Nevertheless, the ECB’s focus remains firmly on preventing inflation from spiralling out of control. The European Central Bank is prepared to tighten policy now and ease it if necessary. Bloomberg analysts predict a cut to the deposit rate as early as March 2027.
The rise in borrowing costs in June is already reflected in EURUSD quotes. The pair’s reaction to the ECB meeting will depend on the updated forecasts and Christine Lagarde’s rhetoric.
US PPI Jump 6.5%, Highest Since 2022, as Oil Shock Spreads
US producer prices surged far more than expected in May, highlighting that inflation pressures continue to build beneath the surface of the economy despite Wednesday's relatively reassuring consumer inflation report. PPI rose 1.1% mom, matching April's increase and exceeding expectations of 0.7% mom. Annual producer inflation accelerated from 5.9% yoy to 6.5% yoy, the strongest pace since November 2022.
The increase was overwhelmingly driven by energy costs. Final demand goods prices jumped 2.8% mom, the largest increase since the series began in 2009, with a 10.7% surge in energy prices accounting for most of the gain. Gasoline prices alone soared 23.4%, while diesel fuel, jet fuel, industrial chemicals and natural gas liquids also recorded sharp increases.
However, the report was not purely an energy story. Core producer prices excluding food, energy and trade services rose 0.8% mom, the largest increase since March 2022, lifting the annual rate to 5.1% yoy.
The data reinforces a theme increasingly confronting policymakers around the world: the energy shock is beginning to move beyond oil markets and into broader production chains.
| Indicator | May 2026 | Notes |
|---|---|---|
| Headline PPI M/M | 1.1% | Above expectations |
| Headline PPI Y/Y | 6.5% | Highest since Nov 2022 |
| Core PPI* M/M | 0.8% | Highest since Mar 2022 |
| Core PPI* Y/Y | 5.1% | Highest since Oct 2022 |
| Final Demand Goods M/M | 2.8% | Record increase since series began in 2009 |
| Energy Prices M/M | 10.7% | Main inflation driver |
| Gasoline Prices M/M | 23.4% | More than half of goods increase |
| Final Demand Services M/M | 0.3% | Slower than April |
| Transportation & Warehousing | 2.6% | Strong increase |
| Trade Services | -1.1% | Partial offset |
US Jobless Claims Rise to 229k, Continuing Claims Climb
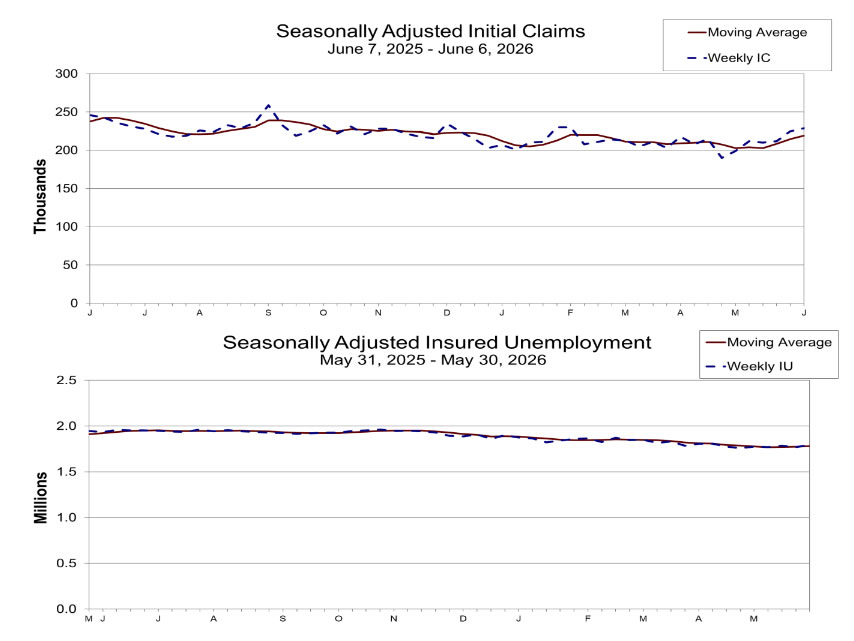
US initial jobless claims rose by 4k to 229k in the week ending June 6, slightly above expectations of 225k. The underlying trend also moved higher. The four-week moving average of initial claims, which smooths out weekly volatility, increased by 4.25k to 219k.
Meanwhile, continuing claims rose by 24k to 1.795m in the week ending May 30, while the corresponding four-week average climbed to 1.7805m from 1.7758m previously.
Despite the latest increases, claims levels remain far below those typically associated with significant labor market deterioration.