Sample Category Title
NASDAQ-100 Wave Analysis
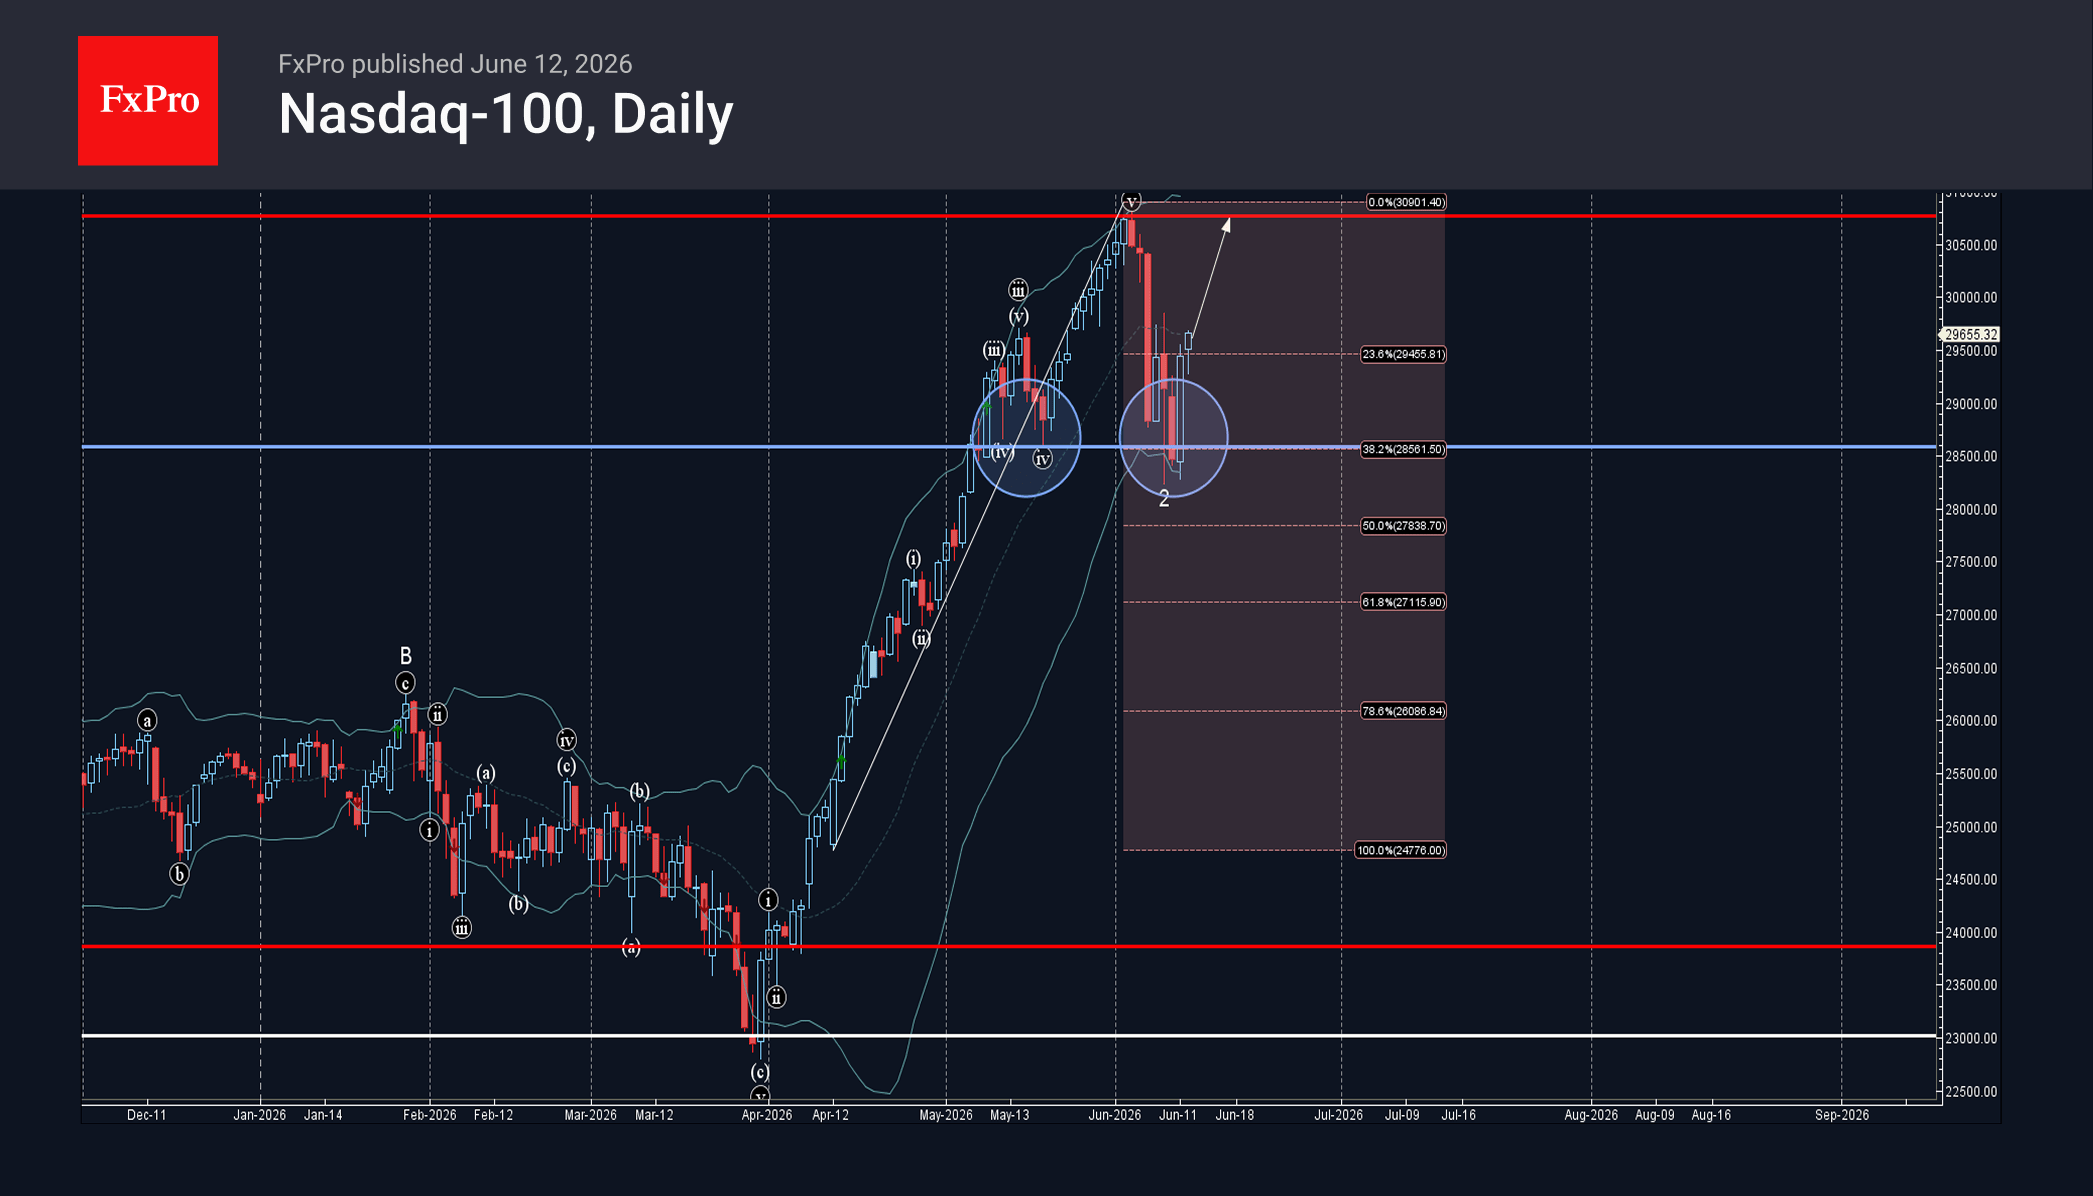
Nasdaq-100: ⬆️ Buy
– Nasdaq-100 reversed from support zone
– Likely to rise to resistance level 30770.00
Nasdaq-100 index recently reversed up from the support zone between the support level 28585.00 (which stopped earlier corrections (iv) and iv), lower daily Bollinger Band and the 38.2% Fibonacci correction of the upward impulse from April.
The upward reversal from this support zone created the daily Japanese candlesticks reversal pattern Bullish Engulfing – which started the active impulse wave 3.
Given the clear daily uptrend, Nasdaq-100 index can be expected to rise to the next resistance levels 30770.00 – top of the previous impulse wave 3.
The ECB’s Interest Rate Hike Is More Than an Insurance Hike, but No Signal for a Start of a...
At its policy meeting on 11 June, the ECB raised its deposit rate by 25 basis points to 2.25%. This automatically raises the refinancing rate to 2.40% and the marginal lending rate to 2.65%. This decision was unanimous, based entirely on the forecasts of the Eurosystem’s economists and advocated by ECB Chief Economist Lane. The decision was also in line with recent communications from ECB policymakers, including Executive Board member Schnabel, and with the latest market expectations. As a result, the market reaction to the German ten-year government bond yield was relatively muted. If there was any movement at all, it was a slight decline to around 3.03% by the end of the press conference.
‘Well-positioned’ once again
ECB President Lagarde also indicated that, following the rate hike to 2.25%, the ECB now considers itself well positioned once again to respond to further developments. The meeting did not discuss the ECB’s stance relative to the neutral rate. Lagarde even described the concept of the neutral rate as an equilibrium rate as somewhat irrelevant at present, given the major shocks currently affecting the eurozone economy.
During the press conference, ECB President Lagarde justified the interest rate decision primarily by citing the impact of the war in the Middle East on the eurozone’s medium-term inflation outlook. In the baseline scenario, Eurosystem economists raised their inflation forecasts for 2026 and 2027 to 3% and 2.3% respectively, with a slight reduction to 2% in 2028. The inflation path for underlying core inflation (excluding energy and food) was also revised upwards to 2.5%, 2.5% and 2.2% in 2026, 2027 and 2028 respectively. Inflation risks remain on the upside. The higher expected inflation path is the result of pass-through effects from higher energy prices to food, goods and services prices. According to the ECB, there is as yet no evidence of explicit so-called ‘second-round effects’, whereby inflation expectations begin to impact wage formation, for example.
At the same time, growth forecasts were lowered (by 0.1 percentage points across the board) to 0.8%, 1.2% and 1.5% in 2026, 2027 and 2028 respectively. The risks are tilted to the downside. The negative impact on expected growth is mainly driven by the pass-through of higher commodity prices to real incomes and the deterioration in confidence indicators.
Scenario analysis
To examine the robustness of these conclusions, the Eurosystem economists not only produced new projections for the baseline scenario, but also updated the ‘adverse’ and ‘severe’ scenarios from March. In addition, a new ‘milder’ scenario was introduced, which assumes a more favourable outcome than the baseline scenario regarding geopolitical developments and, consequently, future energy prices. In all four scenarios, the ECB concludes that today’s interest rate hike was the correct policy decision. The fact that a milder alternative scenario is also included, for which that policy conclusion also applies, made the decision robust, hence more than an insurance hike, and therefore inevitable, according to the ECB.
Does the ECB validate market expectations?
A relevant point to note here is that for the simulations in all four scenarios, so-called ‘technical’ assumptions are made for certain market variables, based on market expectations with 21 May as the cut-off date. Specifically, this means that the assumption for the money market rate is a three-month Euribor rate of 2.4% in 2026, 2.8% in 2027 and 2.7% in 2028. A key question for assessing future ECB policy is therefore to what extent the results of the ECB’s simulations (a return of inflation to the 2% target in the autumn of 2027) implicitly validate these market expectations. Plausibly, the simulation results do provide some insight into how the ECB might currently be thinking. However, what it will decide at its next policy meetings remains highly data-dependent. In any case, the ECB does not wish to commit to a specific interest rate path.
No ‘second-round effects’ visible yet
According to the ECB, the full impact of the war in the Middle East depends on the scale and duration of the energy price shock. In addition, spillover effects to other product categories also play a role (which are becoming increasingly visible) and, finally, the extent of possible ‘second-round effects’. According to the ECB, there is as yet no sign of this latter effect, although the risk related to it will be monitored closely. Lagarde noted that, based on market and survey data, medium-term inflation expectations remain fairly well anchored around the 2% inflation target (this is not the case for the short term). Nor does the ECB’s ‘wage tracker’, which monitors wage agreements in the eurozone, yet provide any indications that inflation expectations are having a stronger impact on wage agreements.
According to the ECB’s new projections, inflation in the eurozone will therefore remain above the 2% target until the first half of 2027 as a result of high energy prices and their pass-through to goods and services prices. In the autumn of 2027, inflation will then, still according to the ECB, fall back to around that target as a result of falling energy prices and slowing inflation in other product categories.
More than a precautionary measure, but no signal for a start of a tightening cycle
As mentioned above, Lagarde emphasised that the interest rate hike was necessary in all four scenarios considered and was therefore not merely an ‘insurance hike’, but rather an act of appropriate monetary policy. When asked whether this marked the start of a tightening cycle, she was only willing to reveal the following. Much will depend on how medium-term inflation expectations develop. In this context, she referred to the analytical framework she had proposed in March. In it, she stated that the ECB could look through a limited (and temporary) shock, respond to a larger shock that is not persistent with a well-calibrated policy adjustment, and respond forcefully to a significant and sustained deviation from the inflation target.
The first scenario is no longer relevant following the interest rate hike. On the other hand, according to Lagarde, a 25-basis-point rate hike is not really a ‘forceful’, but nevertheless an appropriate policy response. In light of the upcoming policy meetings, this suggests that, until further notice, the ECB is thinking in terms of a rather limited adjustment of its policy stance (well-calibrated) and does not wish to rush into anything for the time being.
Dollar Down But Not Out While Oil’s $10 Collapse Signals Iran Deal Optimism
Dollar is under broad-based pressure today as safe-haven demand unwinds, but the scale of the selloff remains surprisingly modest considering the dramatic move in oil markets. Brent crude has plunged from above $95 just a day ago to below $86, one of the sharpest declines since the Iran conflict began, as investors increasingly price the possibility of a breakthrough peace agreement between the United States and Iran. Yet while oil is behaving as if a deal is nearly done, currency markets appear to be waiting for confirmation before making larger bets.
The latest optimism stems from reports that a memorandum aimed at ending the conflict could be signed as soon as Sunday, with Geneva emerging as the most likely venue. According to sources, the draft agreement would include waiving sanctions on Iranian oil exports, unfreezing billions of dollars in Iranian assets and reopening the Strait of Hormuz. Iran is also pushing for a halt to hostilities across all fronts, including Lebanon, where Israel continues to battle Hezbollah. The language of the memorandum is reportedly still being finalized, highlighting that while negotiations have advanced significantly, a signed agreement remains far from guaranteed.
The reaction across asset classes reflects that uncertainty. Oil markets have aggressively dismantled geopolitical risk premium as traders anticipate a return of Iranian supply and normalization of shipping through Hormuz. Currency markets have been more restrained. Dollar is weaker, but it continues to hold above last week's lows against major peers. The lack of a deeper decline suggests investors are willing to price the possibility of peace but remain reluctant to abandon defensive positioning entirely until signatures are on paper.
The Canadian Dollar has emerged as the week's biggest casualty. Falling oil prices are directly undermining one of Canada's key sources of support. Yet even if oil had remained elevated, Loonie would still face challenges because Bank of Canada appears firmly on hold while other central banks, continue to discuss the possibility of further tightening. That leaves CAD trapped in what increasingly looks like a lose-lose scenario.
Elsewhere, Dollar is the second worst-performing currency of the week, while Aussie ranks third from the bottom despite the improvement in risk sentiment. The muted response from AUD suggests investors remain cautious about the global growth outlook and continue to reassess expectations for further RBA tightening. On the other side of the ledger, Kiwi leads gains, followed by Sterling and Euro.
Oil Collapses on Hormuz Optimism, EUR/CAD Rally May Be Just Getting Started
The market may finally be shifting from pricing war to pricing peace. Reports that a draft US-Iran agreement would reopen the Strait of Hormuz have pushed oil sharply lower and helped fuel EUR/CAD's latest breakout. Read More.
Gold and Silver Hold Make-or-Break Zones After Trump's Iran Pivot, but Bullish Reversal Remains a Work in Progress
Trump's decision to cancel planned strikes against Iran sparked a powerful relief rally across global markets. Gold and Silver responded by rebounding from critical support zones around $4,000 and $60, but neither metal has confirmed bottoming yet. The next battle lies at key resistance levels that will determine whether a genuine bullish reversal is underway. Read More.
ECB's Nagel Refuses to Rule Out July Hike as Middle East Shock Persists
Just one day after ECB's rate hike, Bundesbank President Joachim Nagel reinforced the hawkish message. Warning that the Middle East energy shock is proving "strong and persistent," he made clear that another rate increase in July cannot be ruled out if inflation pressures continue to spread. Read More.
UK GDP Slips -0.1% M/M in April as Services Weigh, Three-Month Growth Accelerates
The UK economy contracted modestly in April, but the broader picture remains more encouraging. While services output dragged monthly GDP into negative territory, growth accelerated to 0.7% over the latest three-month period, suggesting the economy still has momentum. Read More.
NZ BNZ PMI Falls Below 50 as Manufacturers Face Demand and Energy Pressures
New Zealand manufacturing slipped back into contraction in May as weak customer demand, rising fuel costs and Middle East uncertainty weighed on activity. While larger firms continue to perform well, smaller manufacturers are facing increasing pressure heading into winter. Read More.
AUD/USD Daily Report
Intraday bias in AUD/USD is turned neutral with current recovery. Risk will stay on the downside as long as 0.7076 support turned resistance holds. Below 0.6977 will resume the fall from 0.7277 towards 0.6832 support next. Nevertheless, firm break of 0.7076 will argue that fall from 0.7277 might have completed, and turn bias back to the upside for stronger rebound.
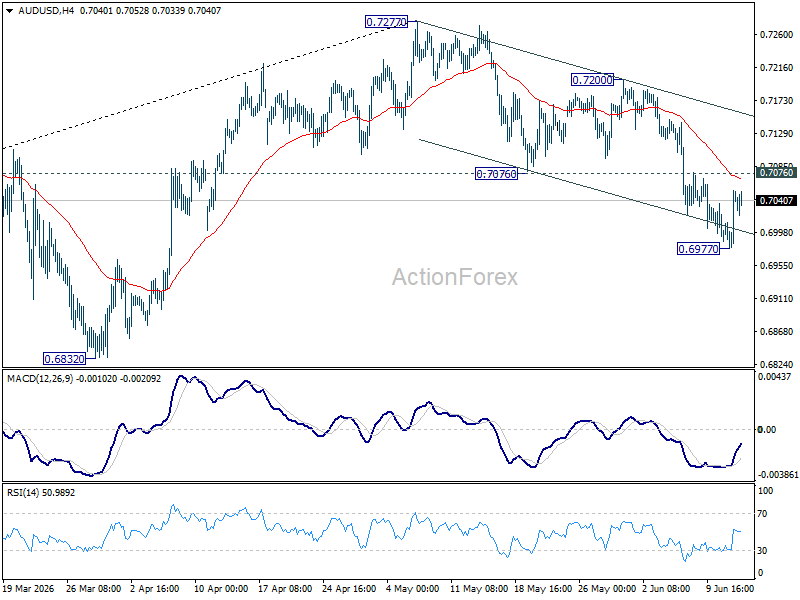
In the bigger picture, considering bearish divergence condition in D MACD, a medium term top could be formed at 0.7277 after failing to sustain above 61.8% retracement of 0.8006 (2021 high) to 0.5913 (2024 low) at 0.7206). Deeper fall could be seen to 38.2% retracement of 5913 to 0.7277 at 0.6756 as a correction. But strong support should be seen there to bring rebound. Consolidations would continue below 0.7277 for a while.
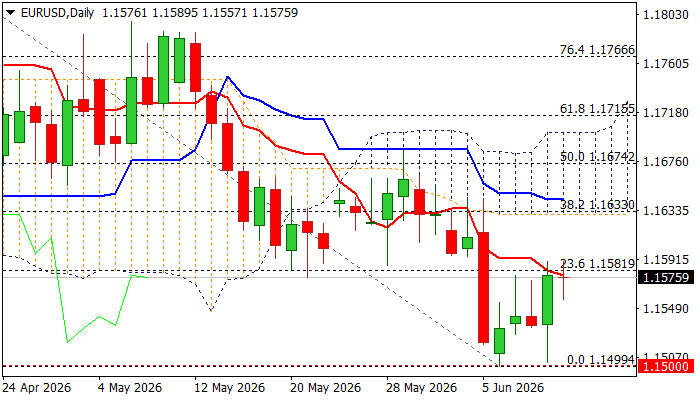
EURUSD – Post-ECB Recovery Faces Strong Obstacles En-Route
The Euro remains constructive on Friday after previous day’s jump on ECB rate hike (the first in three years).
The latest news about potential peace deal in the Middle East also contributes to fresh positive tone, although markets need more evidence before reacting.
The pair probes again through initial barriers at 1.1580 zone (10DMA / Fibo 23.6% of 1.1849/1.1500) and need firm break higher to confirm a higher base at 1.1500 zone (formed after a double downside rejection and generate initial reversal signal.
However, daily indicators are still in bearish setup (MAs / negative momentum studies) that keeps the downside vulnerable, particularly while the price holds below the base of daily Ichimoku cloud / Fibo 38.2% (1.1630).
In such scenario, limited upticks would provide better levels to re-enter larger downtrend from 1.1850 (mid-Apr peak).
Res: 1.1602; 1.1630; 1.1645; 1.1674
Sup: 1.1557; 1.1500; 1.1443; 1.1410
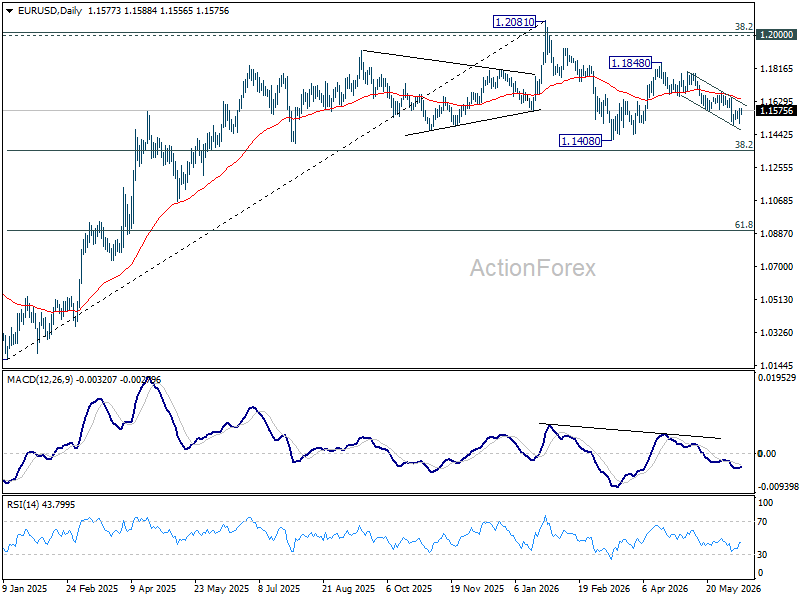
EUR/USD Daily Outlook
Intraday bias in EUR/USD remains neutral first, as range trading continues above 1.1499. Risk will stay on the downside as long as 1.1685 resistance holds. Break of 1.4992 will resume the fall from 1.1848 to retest 1.1408 low next.
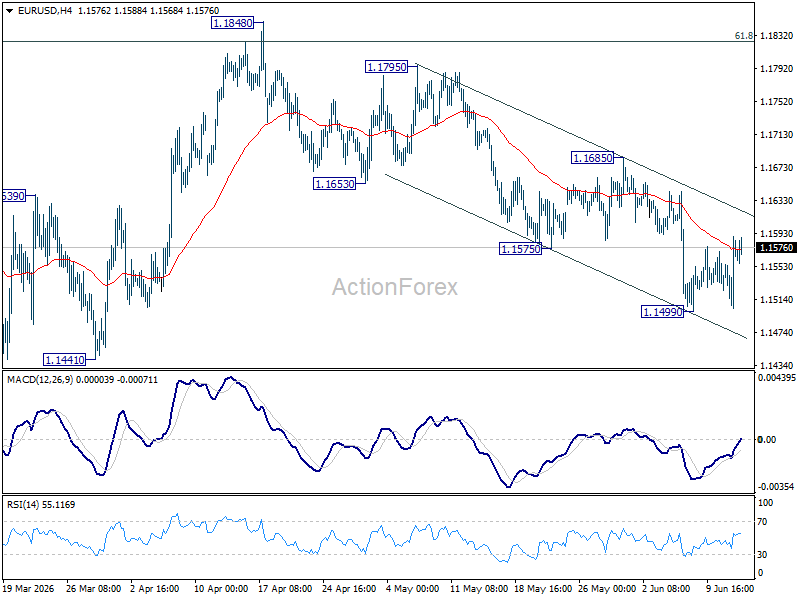
In the bigger picture, the strong support from 38.2% retracement of 1.0176 to 1.2081 at 1.1353 suggests that the pullback from 1.2081 is more likely a corrective move. Strong support was also found in 55 W EMA (now at 1.1547). Focus is back on 1.2 key cluster resistance level. Decisive break there will carry long term bullish implications. Nevertheless, break of 1.1408 support will revive the case of medium term bearish trend reversal.
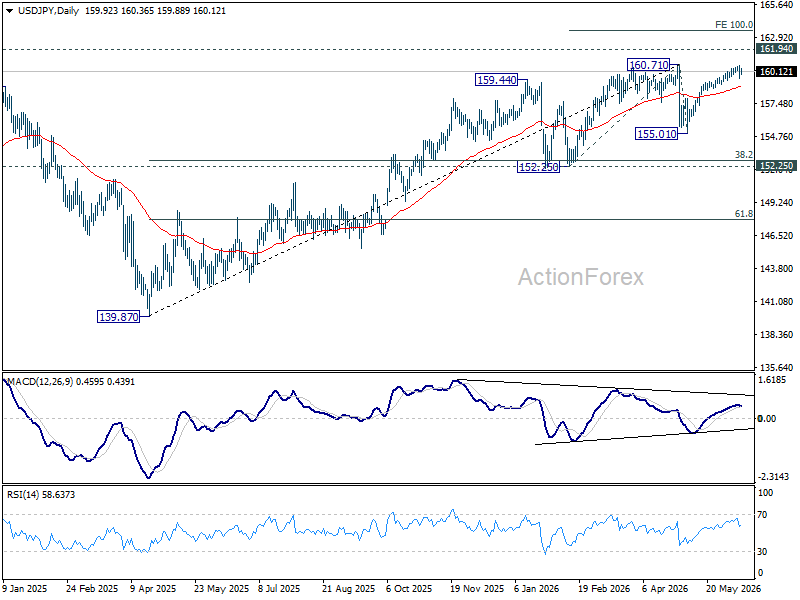
USD/JPY Daily Outlook
Break of 159.72 support suggests that a short term top was formed at 160.58 in USD/JPY, on bearish divergence condition in 4H MACD. Intraday bias is now mildly on the downside. Deeper pullback should be seen to 38.2% retracement of 155.01 to 160.58 at 158.45. In case of another risk, strong resistance is still expected from 160.71. However, decisive break of 160.71 will confirm up trend resumption. That should push USD/JPY through 161.94 to 100% projection of 152.25 to 160.71 from 155.01 at 163.47 next.
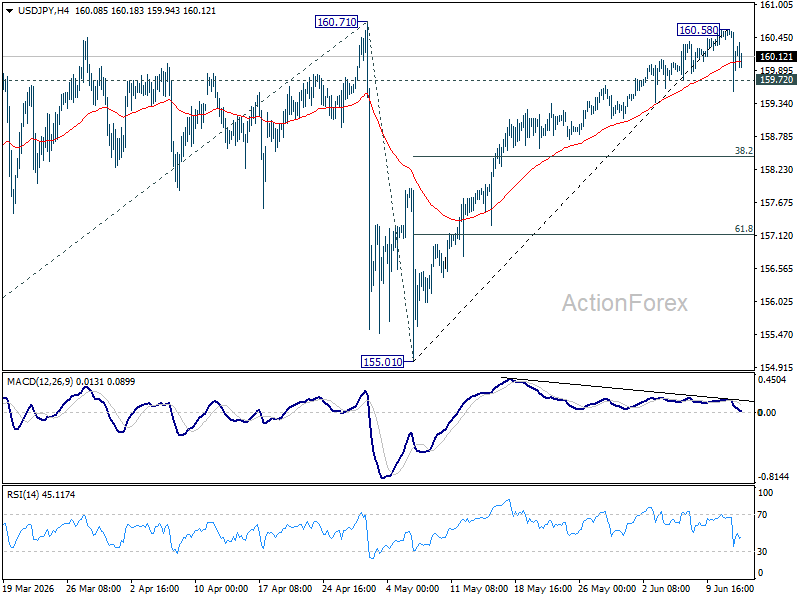
In the bigger picture, for now, corrective pattern from 161.94 (2024 high) is still seen as completed at 139.87. Rise from there is seen as resuming the long term up trend. So, break of 161.94 is expected at a later stage to resume the long term up trend. However, sustained break of 55 W EMA (now at 154.93) will dampen this view and bring deeper fall back towards 139.87 to extend the pattern from 161.94.
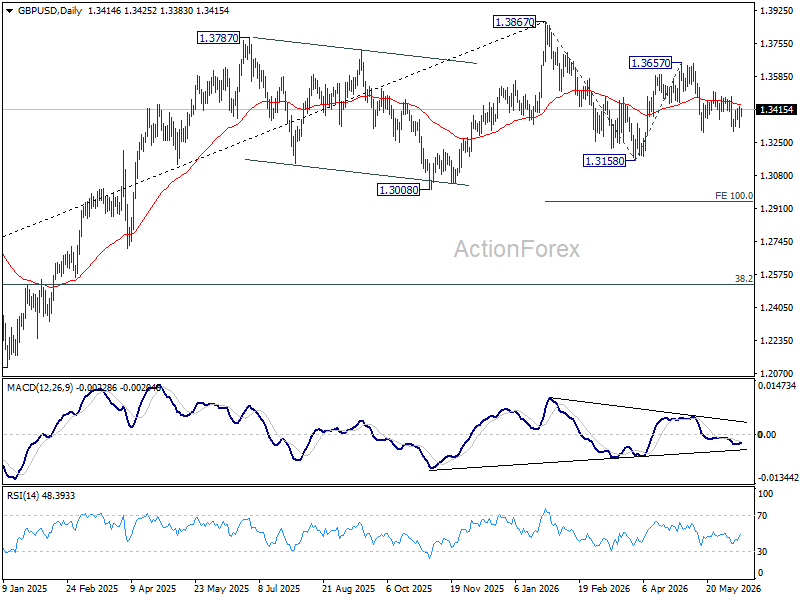
GBP/USD Daily Outlook
Intraday bias in GBP/USD stays neutral as range trading continues. On the downside, break of 1.3300 will target a retest on 1.3158. Firm break there will extend the whole fall from 1.3867 to 100% projection of 1.3867 to 1.3158 from 1.3657 at 1.2948. For now, risk is mildly on the downside as long as 1.3508 resistance holds, in case of recovery.
In the bigger picture, price actions from 1.3867 are a corrective pattern within the broader up trend from 1.0351 (2022 low). With 1.3008 support intact, medium term bullishness is maintained and break of 1.3867 is in favor for a later stage, towards 1.4248 key resistance (2021 high). However, firm break of 1.3008 will at least bring deeper fall to 38.2% retracement of 1.0351 to 1.3867 at 1.2524, with increased risk of bearish reversal.
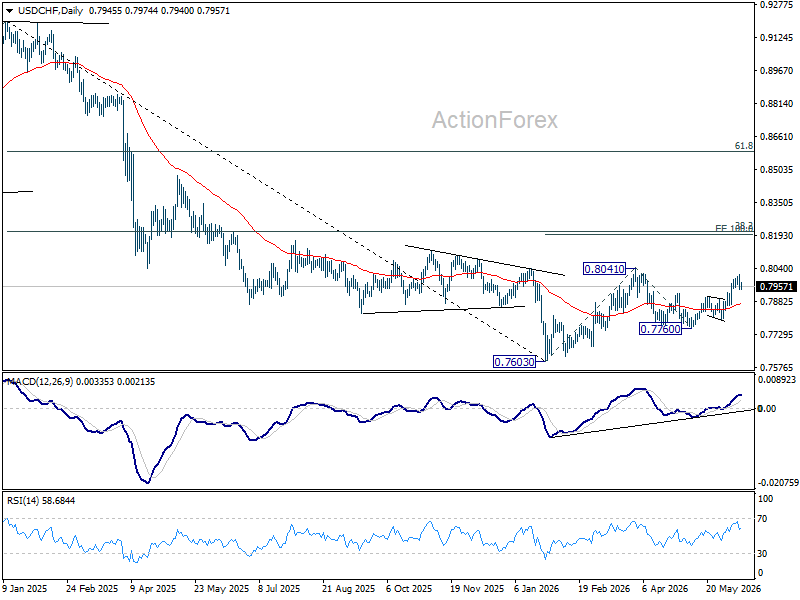
USD/CHF Daily Outlook
Intraday bias in USD/CHF is turned neutral first with current retreat. Some consolidations would be seen below 0.8012 temporary top. Further rise is expected as long as 0.7906 resistance turned support holds. Above 0.8012 will bring retest of 0.8041 high. Firm break there will resume the rise from 0.7603 and target 100% projection 0.7603 to 0.841 from 0.7600 at 0.8198 next.
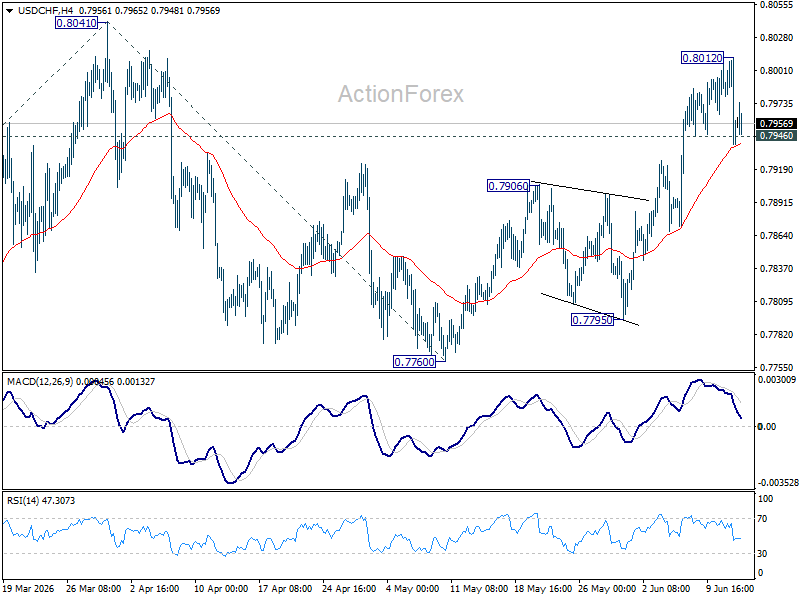
In the bigger picture, while a medium term bottom was formed at 0.7603, it's still early to call for bullish trend reversal. As long as 38.2% retracement of 0.9200 (2025 high) to 0.7603 at 0.8213 holds, the larger down trend could still continue through 0.7603 at a later stage. However, firm break of 0.7603 will argue that the trend has reversed and turn focus to 0.8332 support turned resistance (2023 low) for confirmation.
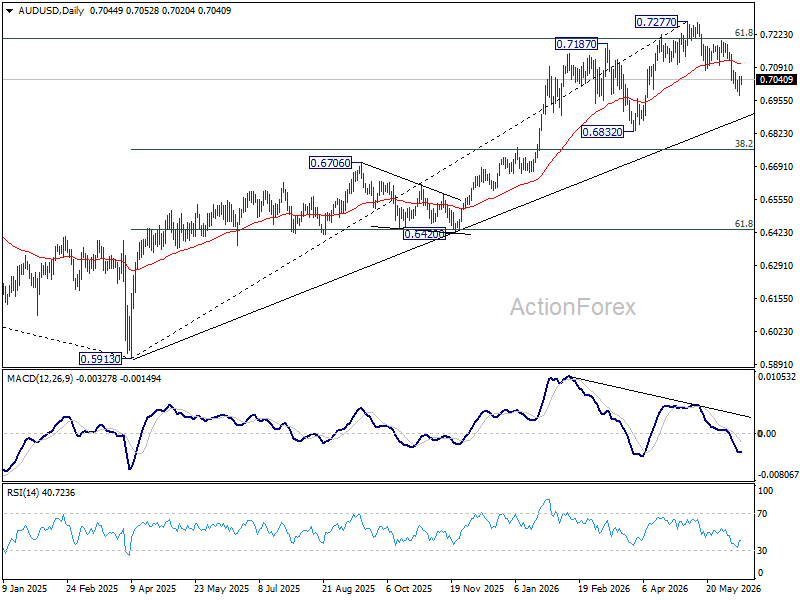
AUD/USD Daily Report
Intraday bias in AUD/USD is turned neutral with current recovery. Risk will stay on the downside as long as 0.7076 support turned resistance holds. Below 0.6977 will resume the fall from 0.7277 towards 0.6832 support next. Nevertheless, firm break of 0.7076 will argue that fall from 0.7277 might have completed, and turn bias back to the upside for stronger rebound.
In the bigger picture, considering bearish divergence condition in D MACD, a medium term top could be formed at 0.7277 after failing to sustain above 61.8% retracement of 0.8006 (2021 high) to 0.5913 (2024 low) at 0.7206). Deeper fall could be seen to 38.2% retracement of 5913 to 0.7277 at 0.6756 as a correction. But strong support should be seen there to bring rebound. Consolidations would continue below 0.7277 for a while.
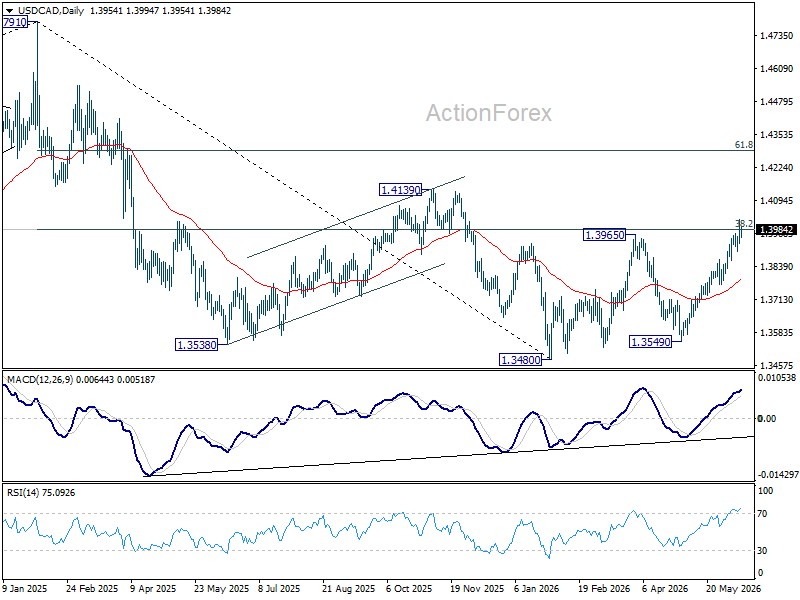
USD/CAD Daily Outlook
Intraday bias in USD/CAD stays on the upside for the moment. Decisive break of 38.2% retracement of 1.4791 to 1.3480 at 1.3981 will carry larger bullish implications and target 61.8% retracement at 1.4290 next. On the downside, below 1.3897 minor support will turn bias neutral again first.
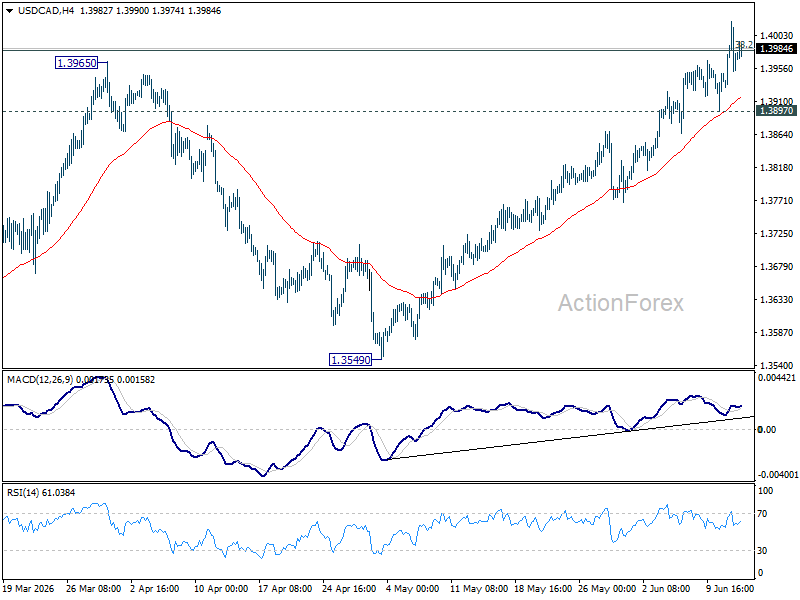
In the bigger picture, price actions from 1.4791 are seen as a corrective pattern to the whole up trend from 1.2005 (2021 low). Rejection by 38.2% retracement of 1.4791 to 1.3480 at 1.3981 will keep the decline intact, and bring another fall through 1.3480 at a later stage. However, firm break of 1.3981 will argue that the decline has completed, and set up further rise back to retest 1.4791 instead.