Sample Category Title
ECB Hikes As Expected, One More Likely in September
In focus today
UK April GDP is released today. PMIs suggest the economy remained in growth territory in April and only slowed in May, although market consensus expects GDP in April to decline further from 0.3% m/m in March to -0.1% m/m in April.
Euro area final inflation estimates for May are released from Germany, France and Spain, where we expect the print to confirm flash estimates. The flash prints showed headline inflation rising mainly on the back of energy with Germany coming in slightly below expectations.
Also in the euro area, we have ECB's Kocher, Rehn and Nagel giving speeches, where we look for further details after yesterday's meeting.
In the US, consumer sentiment will be in focus, as the University of Michigan preliminary index for June is released. The index came out on the weak side in May as it was revised down in the final print to 44.8 from 48.2 vs. consensus at 49.5. The index is expected to rebound slightly to 46.0 in June.
Economic and market news
What happened yesterday
In the euro area, the ECB hiked policy rates by 25bp as expected, bringing the deposit rate to 2.25% at the June meeting. Lagarde highlighted the robustness of the decision to hike rates across a range of scenarios, downplayed growth risks, and emphasised upside risks to the inflation outlook. Looking ahead, we now expect the ECB to deliver its second hike to 2.50% in September (prev. July). We maintain our call for two cuts in H1 2027. For more see ECB Review: A robust hike, one more to come, 11 June.
In the Iran-war, President Trump said the US and Iran have agreed the final points of "a great settlement of the war with Iran" and could sign a peace deal "very soon, maybe over the weekend in Europe", which would reopen the Strait of Hormuz to shipping and halt planned US strikes according to Trump. Iran countered that a deal had not yet been finally agreed upon. Markets reacted to the perceived de‑escalation with Brent crude falling to around USD 89/bbl and equities up.
In Norway, the Regional Network Survey came in on the soft side. Capacity utilisation fell from 32% to 30% and recruitment difficulties dropped from 21% to 18%. Growth, employment and investment all came in below Norge's Bank's March MPR forecasts. The only exceptions were wage growth for 2027, which is expected at 4.1% compared to 3.9%. Together with yesterday's CPI, the survey reduces the probability of a rate hike next week and our base case thus remains that we have hit a peak in policy rates in Norway already now.
In Sweden, the final May inflation figures largely confirmed the flash estimate, revised down only slightly at the second decimal. The upside surprise that we saw in the flash estimate stems from package holidays, which increased 25.8% m/m, which is unusually early, as the seasonal price increase typically does not occur until June. Statistics Sweden also released the new measure of CPIF ex energy with constant taxes, alongside the latest figure for CPIF with constant taxes, both of which will be key inputs for the Riksbank's assessment of underlying inflation pressures and the policy outlook next week.
In the US, May PPI came in at 1.1% m/m SA (from: 1.1%), largely driven by gasoline prices surging 23.4% m/m. While core PPI appeared to surprise to the downside at 4.9% y/y (from 5.2%), this was distorted by the volatile trade services category. Excluding this, core PPI grew 5.1% y/y (from 4.4%) and 0.8% m/m SA (from 0.6%) and suggests that cost pressures are building more broadly across goods and services. Overall, the report was more hawkish than the CPI print earlier in the week, and US yields ticked slightly higher in response.
The Central Bank of Turkey left its 1W repo rate unchanged at 37% for the third consecutive meeting, as expected by markets.
Equities: Global risk sentiment was very constructive yesterday, with global equities rallying 1.3%. Cyclical stocks led the move higher, while defensives lagged at the bottom of the performance table, particularly energy suffered. That said, the trigger for the positive risk move happened after US President Trump announced that the US and Iran are close to reaching an agreement, potentially to be signed as soon as this coming weekend (where Trump turns 80 on Sunday). The deal is expected to focus on reopening the Strait of Hormuz and securing assurances that Iran will not further develop its nuclear weapons programme. Unsurprisingly, the prospect of such an agreement weighed significantly on oil prices and is now 4.6% lower since yesterday morning to trade at USD 88.8bbl. The S&P 500 finished up 1.8%, the Nasdaq gained 2.5%, and the Russell 2000 rose more than 3%. US equity futures are higher again this morning, and the same picture is evident across Asia. South Korea's KOSPI stands out in particular, advancing more than 8%.
FI and FX: Yesterday's session proved a proper rollercoaster. Initially, risk suffered as Trump threatened further strikes on Iran, pulling EUR/USD lower towards 1.15 and EUR/SEK above 11.00. However, as Trump suddenly announced a deal being agreed by the Iranians, risk completely turned around. EUR/USD shot higher towards 1.16 whilst rates declined and EUR/SEK closed the session around 10.93. The ECB hiked rates as expected, but any ensuing market reaction was drowned by the geopolitics. As any deal has yet to be confirmed by Iran, markets will likely continue to trade closely linked to geopolitical developments, as sentiment remains jittery.
UK GDP Slips -0.1% M/M in April as Services Weigh, Three-Month Growth Accelerates
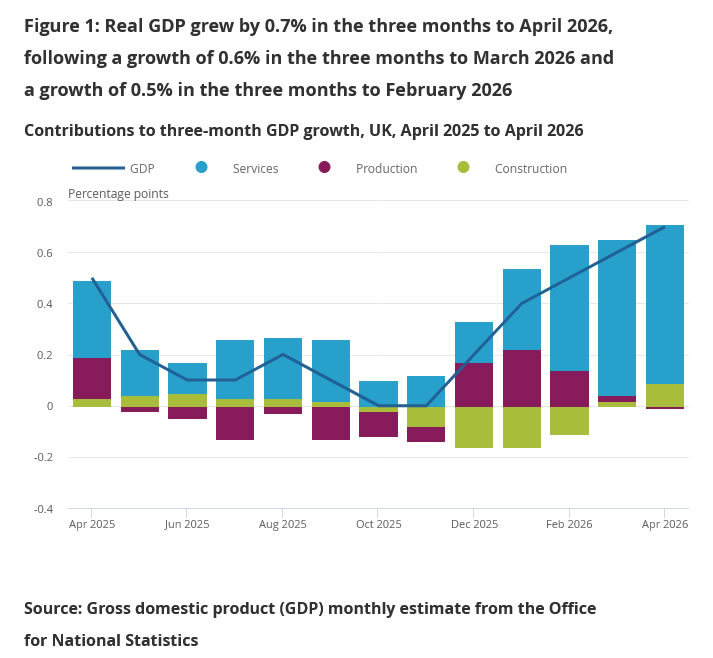
UK GDP contracted by -0.1% m/m in April, matching expectations. The setback followed solid gains of 0.4% in February and 0.3% in March, suggesting the economy lost some momentum at the start of the second quarter.
The monthly GDP decline was driven primarily by a -0.2% fall in services output, while construction provided a modest offset with growth of 0.1%. Production output was unchanged on the month.
Despite the softer monthly reading, the broader growth picture remained relatively encouraging. In the three months to April, GDP expanded by 0.7% compared with the previous three-month period, accelerating from 0.6% in the three months to March and 0.5% in the three months to February.
Services remained the main engine of growth, rising 0.8% over the three-month period. Construction was another bright spot, expanding by 1.6% and extending its recovery after a prolonged downturn that lasted through much of late 2025 and early 2026. Production output, however, contracted by -0.1% over the same period.
Three-Month Growth (vs Previous Three Months):
| Indicator | 3M to Apr 2026 | 3M to Mar 2026 |
|---|---|---|
| GDP | 0.7% | 0.6% |
| Services | 0.8% | 0.8% |
| Production | -0.1% | 0.2% |
| Construction | 1.6% | 0.4% |
ECB’s Nagel Refuses to Rule Out July Hike as Middle East Shock Persists
German Bundesbank President Joachim Nagel signaled that another ECB rate hike in July remains possible, emphasizing that policymakers are keeping "all options open" as they assess the inflationary impact of the Middle East conflict. Just one day after ECB raised rates by 25 basis points, Nagel stressed that the Governing Council stands "ready to respond once again, should we have to." While sources familiar with the discussions indicated that a July hike is not currently the base case, Nagel's comments made clear that further tightening remains on the table if inflation pressures intensify.
Nagel argued that "the supply shock triggered by the war in the Middle East is proving to be strong and persistent". More importantly, he warned that inflation is no longer confined to energy markets. Thursday's rate hike was necessary because price pressures are increasingly spreading into other areas of the economy, with higher energy costs feeding into broader goods and services inflation. "That is why we cannot simply 'look through' it," Nagel added.
Nagel argued that the Governing Council's actions demonstrate determination and help prevent inflation expectations from "becoming unanchored." For markets, the message is straightforward: while a July hike is not the ECB's central scenario, further tightening remains a live possibility if oil prices rise again or inflation delivers another upside surprise.
Wall Street Surges as Trump Signals a Breakthrough Peace Deal with Iran
Key takeaways
- Global stock markets staged a powerful relief rally after President Trump signalled that a comprehensive peace agreement between the US and Iran could be reached soon, triggering a sharp 6% decline in crude oil prices and easing stagflation concerns.
- Technology and AI-related stocks rebounded strongly, with semiconductor shares surging nearly 8% as investors regained confidence in the AI infrastructure investment cycle and concerns over liquidity drains from major IPOs eased.
- Bond yields and the US dollar weakened as traders scaled back expectations for energy-driven Federal Reserve rate hikes, providing support for equities, precious metals, and risk-sensitive assets across global markets.
- Chart of the day: Nasdaq 100’s rebound stalled right below its 20-day moving average, with key short-term resistance at 29,700.
Chart of the day - Nasdaq 100 squeezed up, halted at 20-day MA
Fig. 1: US Nasdaq 100 CFD minor trend as of 12 Jun 2026 (Source: TradingView). The information presented is historical information, and past performance is not indicative of future performance.

Thursday, 11 June, US mid-session intraday rally (induced by US President Trump’s optimistic remarks on an imminent US-Iran peace deal) in the US Nasdaq 100 CFD (a proxy for the Nasdaq 100 E-mini futures) has paused right below the 20-day moving average, and the 61.8% Fibonacci retracement of the prior decline from the 3 June 2026 all-time high to 10 June 2026 low.
The prior 20-day moving average retest on Tuesday, 9 June, led to a 5.4% intraday drop in the US Nasdaq 100 CFD.
Hence, watch the 29,700 key short-term pivotal resistance; a break below 29,000 near-term support is likely to indicate yesterday’s recovery may be a “bull trap,” opening scope for further potential weakness towards the intermediate-range support of 28,280.
However, a clearance with an hourly close above 29,700 invalidates the bearish tone and opens the door to a further squeeze up towards the next intermediate resistances at 30,075 and 30,530.
Top macro headlines
- Trump signals imminent US-Iran peace breakthrough, crude oil plunges 6%: Global risk assets experienced a massive relief rally after U.S. President Donald Trump pulled back threatened military strikes and signalled that a negotiated settlement to end the war is near. Trump cited “discussions brought to the highest level of Iranian leadership,” stating a signing ceremony could take place in Europe as soon as this weekend. WTI crude oil tumbled 6% to a 2-month low, settling at $86.43/bbl, sharply deflating recent geopolitical inflation premiums.
- Wall Street recovers as S&P 500 surges 1.8%: Major U.S. equity indexes halted a bruising two-day slide to stage a violent upward reversal. The S&P 500 bounded 1.8% higher as recession and energy-driven inflation anxieties eased on the heels of the Middle East diplomatic breakthrough, and the tech-heavy Nasdaq 100 rocketed up 3.3%.
- AI infrastructure and chip stocks stage 8% monster bounce: The beaten-down semiconductor sector led the broader market resurgence. A closely watched gauge of global chipmakers (SOX) jumped nearly 8% as momentum and dip-buying institutional capital flooded back into AI-concentric winners.
- SpaceX generates $250 billion in demand for historic $75 Billion Listing: Highlighting robust private-market liquidity, Elon Musk’s SpaceX successfully closed its historic $75 billion capital raise at a fixed price of $135 per share. The listing, which tracked as the largest-ever corporate market entry, drew over $250 billion in institutional demand and more than $100 billion in orders from retail investors, suggesting the IPO is nearly four times oversubscribed and relieving fears of an immediate liquidity squeeze in secondary public equities.
- The US is crowned the world’s Top oil exporter as shifting energy order sinks OPEC power: Data released on Thursday confirmed that the United States has officially overtaken Saudi Arabia and Russia to become the world’s largest oil exporter. Spurred by structural production growth and geopolitical realignments since the war’s onset in February 2026, U.S. crude exports surged to 10.5 million barrels per day, significantly weakening OPEC’s historical pricing grip.
Key macro themes
- De-escalation and the dismantling of the stagflation Premium: The overarching narrative shifting multi-asset portfolios was the swift unwinding of the geopolitical stagflation trade. The sudden pivot toward a comprehensive, high-level diplomatic settlement between Washington and Tehran completely re-baselined global energy risk expectations. With crude oil giving up its premium and the strategically crucial Strait of Hormuz poised to remain open, market participants immediately scaled back expectations for a hawkish, energy-driven Federal Reserve interest rate hike in October, prompting a massive repricing across sovereign curves.
- Re-mooring of the mega-Cap AI growth thesis: The technical and fundamental damage sustained by semiconductor and AI infrastructure giants earlier in the week was aggressively repaired. Fears that massive, impending private listings (such as SpaceX, Anthropic, and OpenAI) would permanently cannibalise secondary-market liquidity were alleviated as the SpaceX offering drew record-breaking oversubscriptions without causing an enduring drag on public-market tech stocks. The nearly 8% surge in chipmakers reflects institutional confirmation that corporate AI capital deployment remains fully supported by underlying liquidity in the capital markets.
- Realignment of global energy hegemony: The formal confirmation of the United States as the world’s dominant oil exporter marks a permanent structural shift in global trade dynamics. Driven by private-sector profit optimisation rather than state-mandated targets, the American shale and crude export complex has successfully absorbed disruptions to Middle Eastern and Russian supply. This structural dominance provides Washington with unparalleled economic leverage and diminishes the long-term effectiveness of traditional energy-weapon embargos.
Global markets impact (last 24 hours)
Equities: The S&P 500 rose 1.8% to lead global equity boards out of a two-day correction. The tech-heavy Nasdaq 100 outperformed, with benchmark chip components rising nearly 8%. European bourses similarly caught a strong cross-Atlantic bid, with pan-region benchmarks erasing early industrial drags to close firmly in positive territory.
Fixed Income: Sovereign bonds staged a massive rally as inflation anxieties plunged alongside the sell-off in crude oil. The yield on the benchmark 10-year U.S. Treasury bond dropped 10 basis points to 4.46%, but remains above the 50-day moving average at 4.40%.
FX: The US Dollar Index fell 0.4% as safe-haven bids for the greenback dissipated. The euro erased earlier ex-post ECB losses, bouncing by 0.4% to settle at 1.1579, while the British Pound also added 0.4% to finish at $1.3416. The Japanese Yen gained 0.4% to 159.97 per dollar amid broader macro realignment.
Commodities: WTI crude oil tumbled 6% to settle at $86.43/bbl. Conversely, spot gold staged a minor rebound, surging 3.4% to $4,211/oz as a slide in sovereign bond yields enhanced the appeal of non-yielding safe havens, but still remained below its 20-day moving average at $4,425/oz.
Asia Pacific impact
- Markets poised for aggressive opening rebound: While local Asian stock indexes closed lower on Thursday (MSCI’s broadest index of Asia-Pacific shares outside Japan fell 0.9%, and South Korea’s KOSPI dropped 3%) due to lagging responses to Wednesday’s late-day inflation data and initial war spikes, the subsequent overnight peace breakthrough in New York has left regional stock futures poised for a massive opening gap higher on Friday morning. So far, the intraday bullish tone is prevailing on Friday, Nikkei 225 (+3.4%), KOSPI (+8%), Hang Seng Index (+2%), China A50 (+1.2%), CSI 300 (+1.5%), ASX 200 (+1.9%), and STI (+0.4%). But fortunes may be reversed on Monday as we head into the non-trading weekend period for public markets with the “fluid” US-Iran situation at the forefront.
- Asian currency pressure alleviates: Local currency defence units received significant breathing room as the U.S. dollar index softened. The Indonesian Rupiah extended its gains by 0.4% to trade at 17,900 per US dollar, recovered by 1.5% from its all-time low of 18,1800 against the greenback on Monday. However, the South Korean Won weakened slightly by 0.3% to trade at 1,520.60 per US dollar.
Top 3 events to watch today
- SpaceX public listing Impact: US stock indices
- University of Michigan Consumer Sentiment Prelim (Jun) - 10:00 pm SGT (consensus: 46, May: 44.8) Impact: USD, US Treasuries, US stock indices
- US-Iran peace deal news flow Impact: All asset classes
Elliott Wave View: Wti Crude Oil (Cl) Eyeing Lower Range at $68–$73
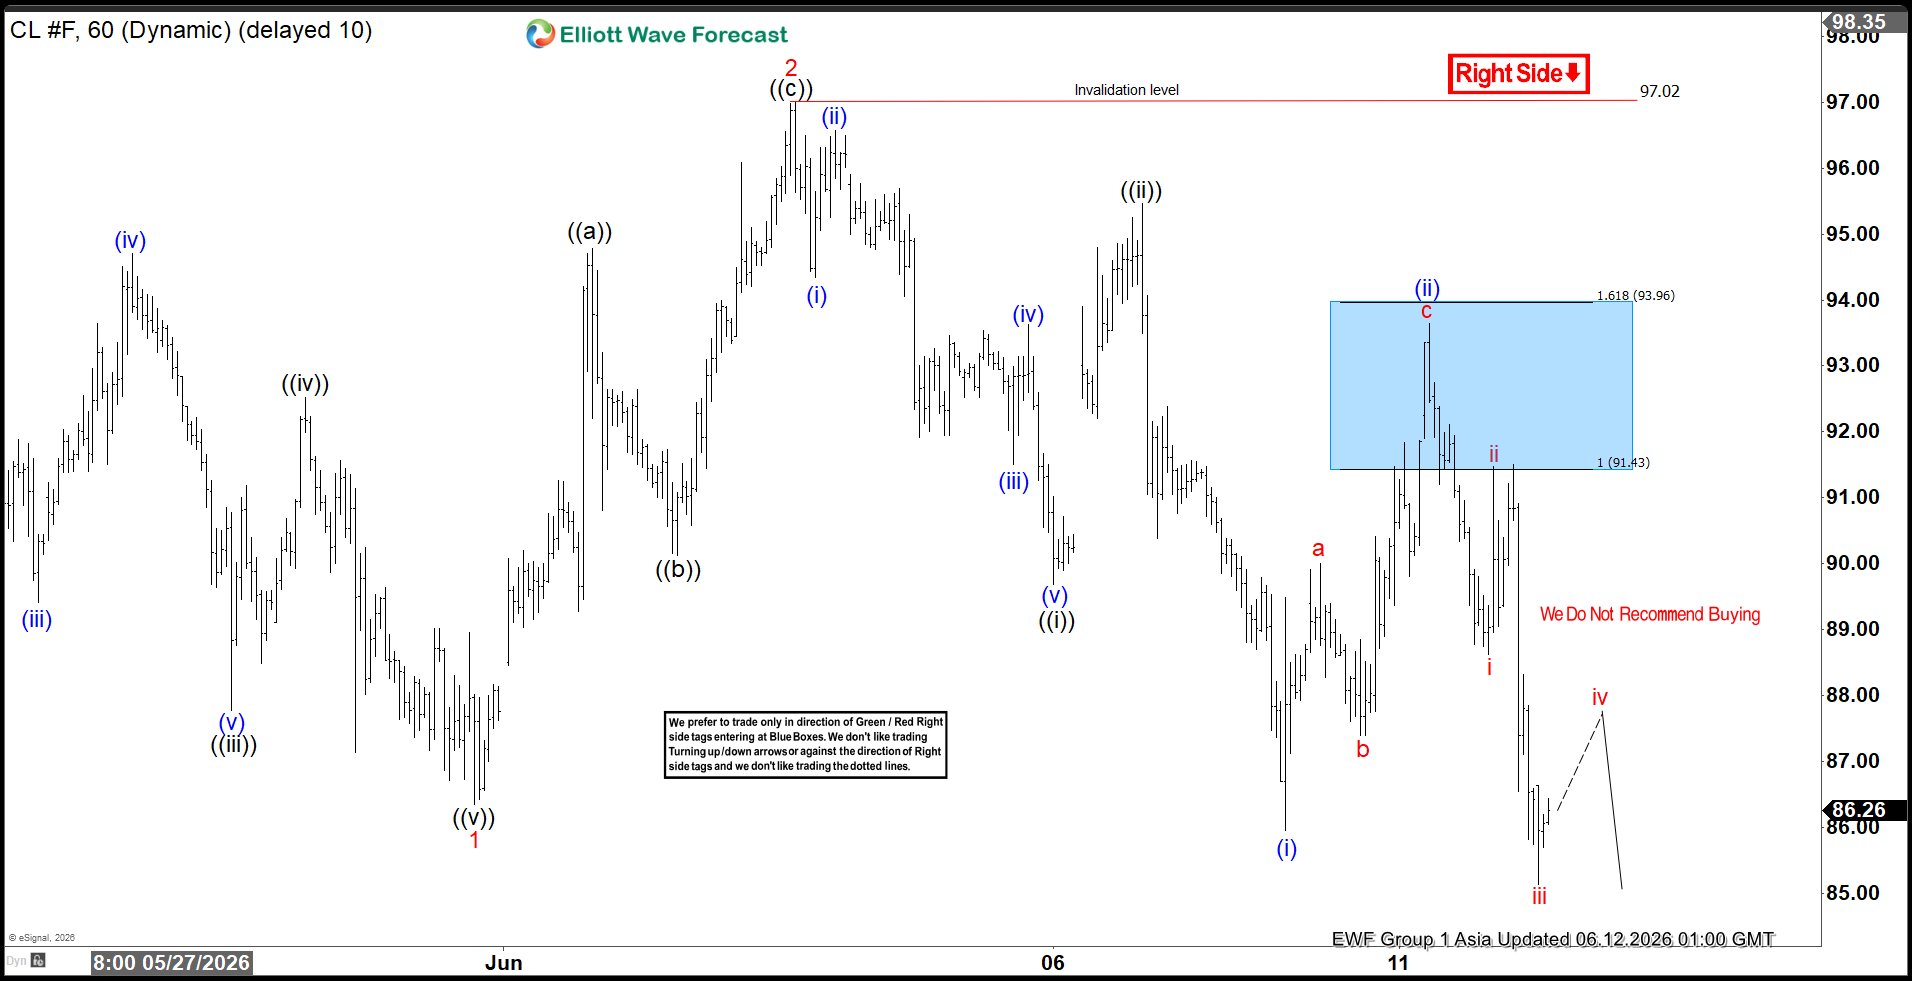
WTI Light Crude Oil (CL) maintains a bearish sequence that began from the May 19, 2026 high. The decline from that peak produced wave 1 at $86.35, followed by a corrective rally in wave 2. This correction unfolded as a zigzag, with wave ((a)) ending at $94.78, wave ((b)) pulling back to $90.12, and wave ((c)) extending higher to $97.02. That move completed wave 2 at a higher degree. Afterward, Oil resumed its decline and broke below the termination of wave 1, confirming the bearish structure.
The downside projection is guided by the 100%–123.6% Fibonacci extension from the May 19 high. This extension aligns with the $68–$73 area, which now represents a potential support zone. From the wave 2 peak, wave ((i)) ended at $89.68, while wave ((ii)) rallied to $95.47. Oil then extended lower again, forming a nested sequence. Within this structure, wave (i) of ((iii)) ended at $85.95, and wave (ii) of ((iii)) rallied to $93.64. The market has since resumed its decline, keeping the bearish outlook intact.
Near term, as long as price remains below $97.02, rallies are expected to fail in either three or seven swings. This reinforces the probability of continued downside pressure. The technical view highlights the likelihood of Oil extending lower toward the $68–$73 zone, consistent with the broader bearish sequence.
Light Crude Oil (CL_F) 60-Minute Elliott Wave Chart
 CL_F Elliott Wave Video:
https://www.youtube.com/watch?v=zlBkdsN6GsY
Gold and Silver Hold Make-or-Break Zones After Trump’s Iran Pivot, but Bullish Reversal Remains a Work in Progress
Financial markets staged a powerful relief rally after US President Donald Trump abruptly called off planned military strikes against Iran and declared that diplomatic discussions had reached the "highest level of Iranian leadership." Trump later suggested that a peace agreement could be finalized as soon as this weekend, potentially leading to the reopening of the Strait of Hormuz and easing fears of a prolonged disruption to global energy supplies. Stocks surged, Dollar reversed lower, and broader risk sentiment improved sharply.
Yet beneath the market optimism, the diplomatic picture remains far less certain. Trump claimed a "very strong memorandum of understanding" is ready for signing and said all parties have effectively approved the framework. Reports indicate the proposed agreement would include a ceasefire extension, reopening of Hormuz and further negotiations over Iran's nuclear program. However, Iranian officials have publicly pushed back against the suggestion that a final deal has been reached. Foreign Ministry spokesman Esmaeil Baghaei described reports of a finalized agreement as premature, while Iranian media noted that similar declarations of imminent breakthroughs have surfaced repeatedly over recent months. A draft framework may exist, but Tehran has made clear that final approval has not yet been granted.
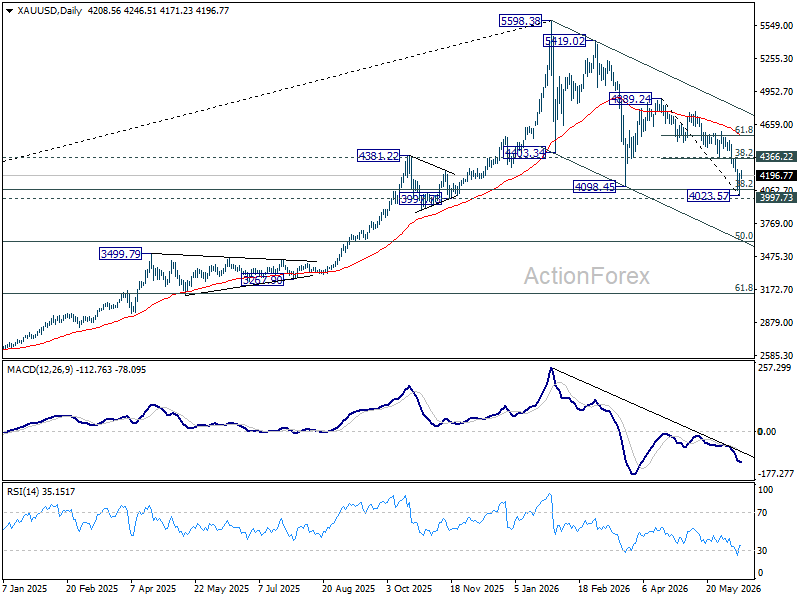
Gold and Silver responded positively to the sharp improvement in market sentiment, rebounding after testing critical long-term make or break support zones. Gold fell as low as 4,023.57 earlier this week, breaking below the March low at 4,098.45 before finding buyers near an important support cluster around the 4,000 area. That zone includes 38.2% retracement of 1,614.60 to 5,598.38 at 4,076.57, along with structural support at 3,997.73. The successful defense of this region has significantly reduced immediate downside pressure.
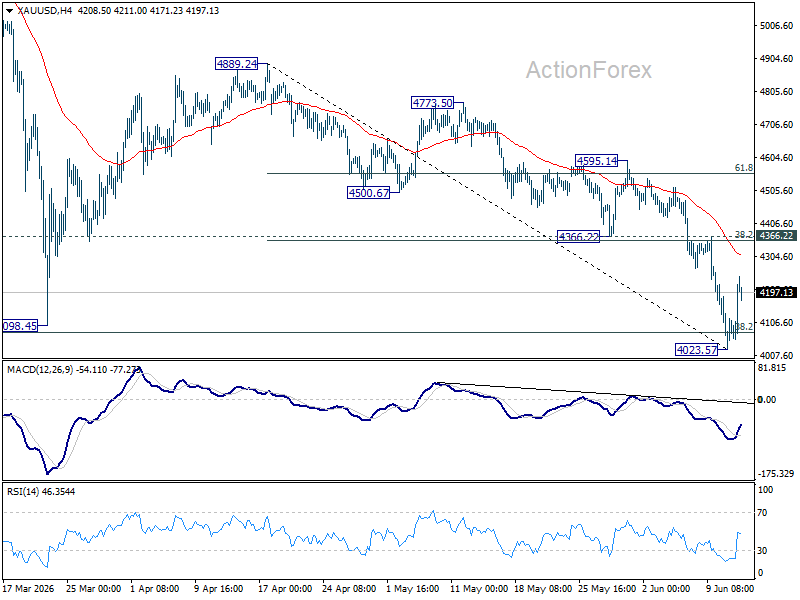
Attention now shifts to whether the rebound can evolve into a more meaningful reversal. For Gold, the key level is the 4,354-4,366 resistance zone, which combines 38.2% retracement of 4,889.24 to 4,023.57 at 4,354.25 and former support turned resistance at 4,366.22. A decisive break would argue that a short-term bottom has already formed and that the recent selloff has run its course.
However, rejection at 4,354-4,366 will keep near term outlook bearish. In this case, risk will remain on the downside for pushing through 4,000 to extend the down trend from 5,598.38 record high.
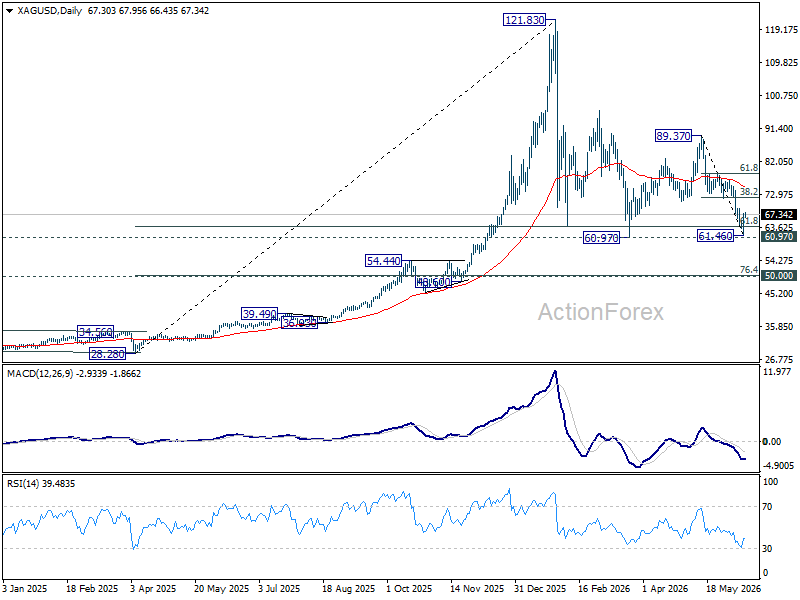
Silver tells a similar story. Prices rebounded after reaching 61.46, narrowly avoiding a test of the March low at 60.97 while also defending the important psychological 60 level. The metal has since stabilized, but confirmation of a bottom remains absent.
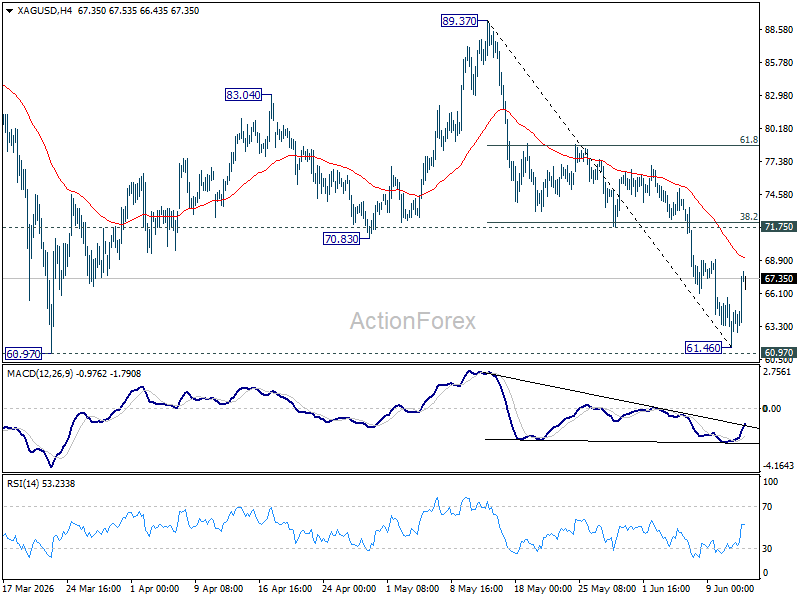
The next hurdle for Silver lies at 71.75 cluster resistance, with 38.2% retracement of 89.37 to 61.46 at 72.12. Sustained break through that region would strongly suggest that the decline from 89.37 has completed and that a durable base has formed around 60.
However, rejection there would leave downside risks intact and raise the possibility of a fresh move below 60, extending the broader correction from the record high at 121.83.
For now, markets are celebrating the reduced probability of immediate military escalation. Whether that optimism proves justified depends on events in Tehran as much as events in Washington. The risk of a weekend bombing campaign may have fallen sharply, but until signatures appear on a final agreement, both the diplomatic process and the technical recoveries in Gold and Silver remain works in progress.
USD/JPY Could Restart Its Uptrend with Bulls Back in Control
Key Highlights
- USD/JPY corrected some gains but found support at 159.55.
- It traded below a bullish trend line with support at 160.20 on the 4-hour chart.
- Bitcoin could start a recovery wave if it clears $64,500.
- WTI Crude Oil prices declined below the $88.50 support.
USD/JPY Technical Analysis
The US Dollar corrected some gains from 160.60 against the Japanese Yen. USD/JPY traded below 160.00 before the bulls appeared.
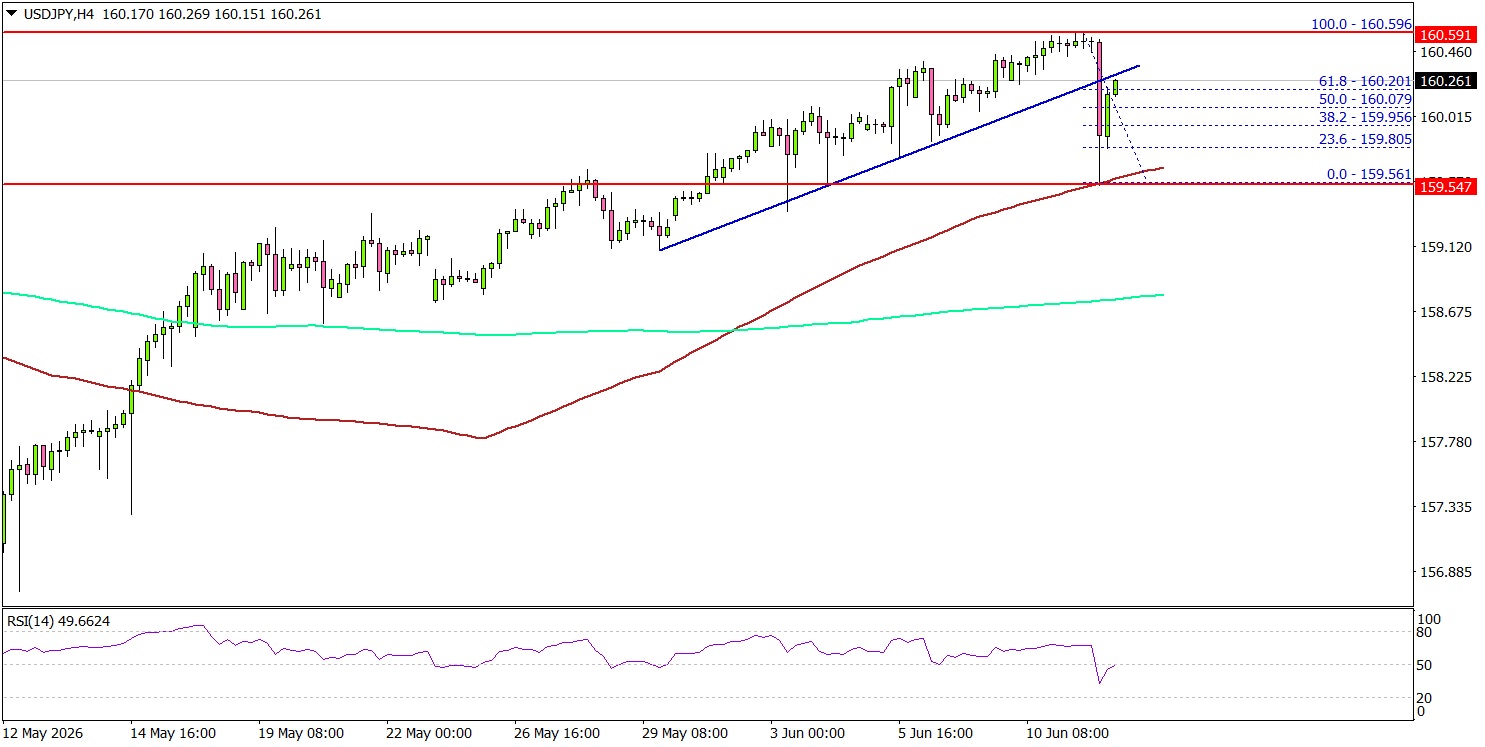
Looking at the 4-hour chart, the pair traded below a bullish trend line with support at 160.20. However, the bulls were active above 159.50. A low was formed at 159.56, and the pair remained stable above the 100 simple moving average (red, 4-hour) and the 200 simple moving average (green, 4-hour).
On the upside, an immediate resistance could be 160.35. The next major resistance might be 160.60. A close above 160.60 could open doors for gains.
The main hurdle for the bulls could be 161.20. If there is a close above 161.20, the pair could rise toward the 162.00 level. If there is another decline, the pair might find bids near the 160.00 level.
The first major support might be near the 100 simple moving average (red, 4-hour) at 159.60. A close below 159.60 could open the doors for a larger decline toward 158.80. Any more losses might set the pace for a test of 158.00.
Looking at Bitcoin, the bulls are currently protecting the $60,000 support, and might soon aim for a recovery wave above $65,000.
Upcoming Key Economic Events:
- Michigan Consumer Sentiment Index for June 2026 (Prelim) – Forecast 44.3, versus 44.1 previous.
NZ BNZ PMI Falls Below 50 as Manufacturers Face Demand and Energy Pressures
New Zealand's manufacturing sector slipped back into contraction in May, with the BNZ-BusinessNZ Performance of Manufacturing Index falling from 50.4 to 49.9. While the decline was modest, it marked a notable loss of momentum from March's 52.8 reading and left the index well below its long-term average of 52.5. The result suggests the sector continues to struggle to establish a sustained recovery amid a challenging economic backdrop.
BusinessNZ Director of Advocacy Catherine Beard said it was "disappointing to see the PMI slip back into negative territory", pointing to a combination of weak customer demand, elevated fuel costs and the ongoing conflict in the Middle East. The survey details painted a mixed picture. Deliveries (51.9) and finished goods inventories (53.8) remained in expansion territory, but production, employment and new orders were broadly flat around the 50 mark, indicating a lack of underlying momentum.
The survey also highlighted a widening gap between businesses of different sizes. Micro-firms with fewer than 10 employees recorded a deeply contractionary reading of 46.0, while large firms with more than 100 employees posted a strong 57.6. Looking ahead, BNZ Head of Research Stephen Toplis said the sector may endure a "flat patch during winter" but maintained that, "Middle East willing", broader economic growth could regain momentum later this year. For now, however, manufacturing remains vulnerable to weak demand and the uncertainty created by higher energy costs.
| Indicators | Apr | May |
|---|---|---|
| PMI | 50.4 | 49.9 |
| Production | 51.4 | 50.0 |
| Employment | 53.2 | 49.6 |
| New Orders | 48.0 | 50.1 |
| Finished Stocks | 50.7 | 53.8 |
| Deliveries | 46.8 | 51.9 |
ECB Review: A Robust Hike, One More to Come
- The ECB hiked policy rates by 25bp as expected, bringing the deposit rate to 2.25% at the June meeting.
- Lagarde highlighted the robustness of the decision to hike rates across a range of scenarios, downplayed growth risks, and emphasised upside risks to the inflation outlook.
- We now expect the ECB to deliver its second hike in September (prev. July). We maintain our call for two cuts in H1 2027.
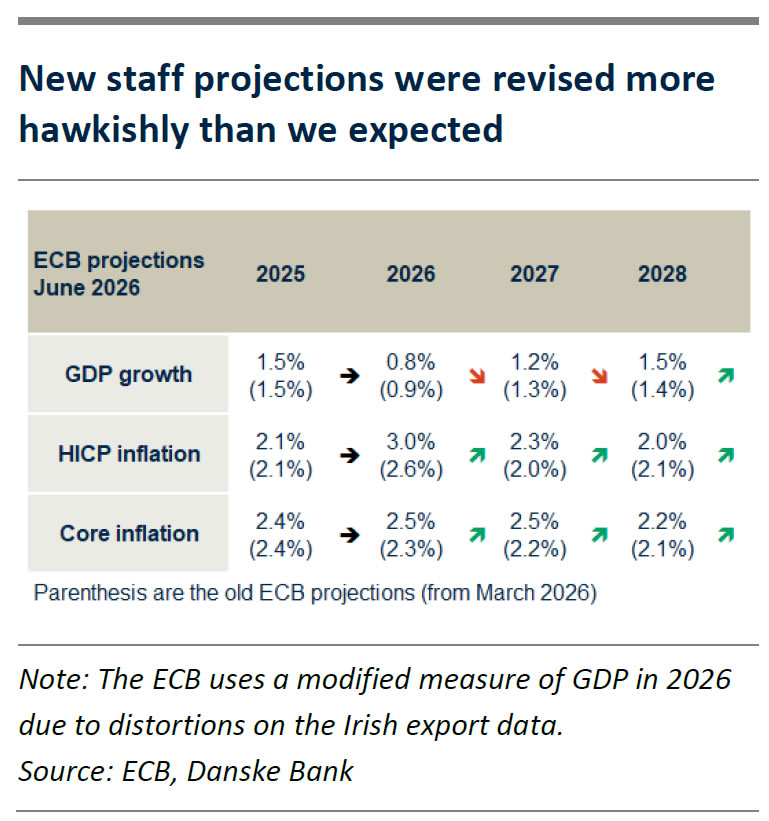
For the first time since September 2023, the ECB hiked its policy rates by 25bp, bringing the deposit rate to 2.25%. The decision was motivated by the war in the Middle East “generating inflation pressures” highlighting that “the decision to raise rates is robust across a range of scenarios mapping out how the shock might evolve and affect the medium-term outlook for the euro area.” Even in a “mild scenario” where energy prices decline significantly more than implied by current futures, inflation is expected to average 1.8% y/y in both 2027 and 2028 with core inflation above 2%. With a primary objective of maintaining price stability, the ECB are thereby assessing that monetary policy needs to be tightened.
The market reacted to the new staff projections by sending European yields higher as the new staff projections showed higher inflation but only slightly lower growth (see chart). For 2026, GDP growth is seen at 0.8% y/y (from: 0.9%) and inflation at 3.0% y/y (from: 2.6%) with core at 2.5% (from: 2.3% y/y). As euro area GDP fell 0.2 % q/q in Q1 due to distortions of the Irish export data the ECB staff decided to use a modified measure of GDP for Ireland reflecting only domestic demand. For this reason, GDP growth is holding up much better than we had anticipated based on the “official” measure of GDP. As the staff projections include market expectations of around 75bp worth of hikes and only then see inflation back at 2.0% in 2028 while growth is still holding up relatively well, we expect the ECB to deliver a second hike. However, as we also expect growth to disappoint relative to their expectations even on the modified measure, we do not expect more than two hikes to be delivered.
During the press conference, Lagarde repeatedly highlighted that this was not simply an “insurance” hike and that the interest rate decision was robust across the four scenarios, which now also includes a “milder scenario” to reflect the two-sided risk picture. While highlighting that some measures of underlying inflation had increased, the ECB was confident that they were not seeing second round effects yet, while also downplaying the importance of the latest high services reading in May. This led markets to push European rates back to levels prior to the decision.
To us, it was striking how little downside risks to the growth outlook were mentioned given the weakness that has already been evident across various measures the past months. Lagarde repeatedly emphasized that the ECB has a “price stability mandate” to mitigate a broadening of the energy shock. She said that the main risk to growth would be the ECB not taking a decision to hike as inflation would then increase too much thereby prompting an even large tightening later. This confirms the ECB’s bias towards curbing upside inflation risks rather than addressing downside growth risks, which is one reason for why we expect another 25bp hike.
We update our ECB call and now expect the ECB to deliver its second hike in September (prev. July). Growth data has disappointed lately and wage growth is falling faster than expected. At the same time, the energy shock is propagating at a normal speed which gives the ECB more time to assess any indirect and second-round effects before embarking on a second hike. Ahead of the July meeting, there will also be limited further data releases with only one inflation release for July and one official PMI release, although the GC will likely also have access to the July report. The wait-and-see approach in July was also confirmed in sources stories following the press conference.
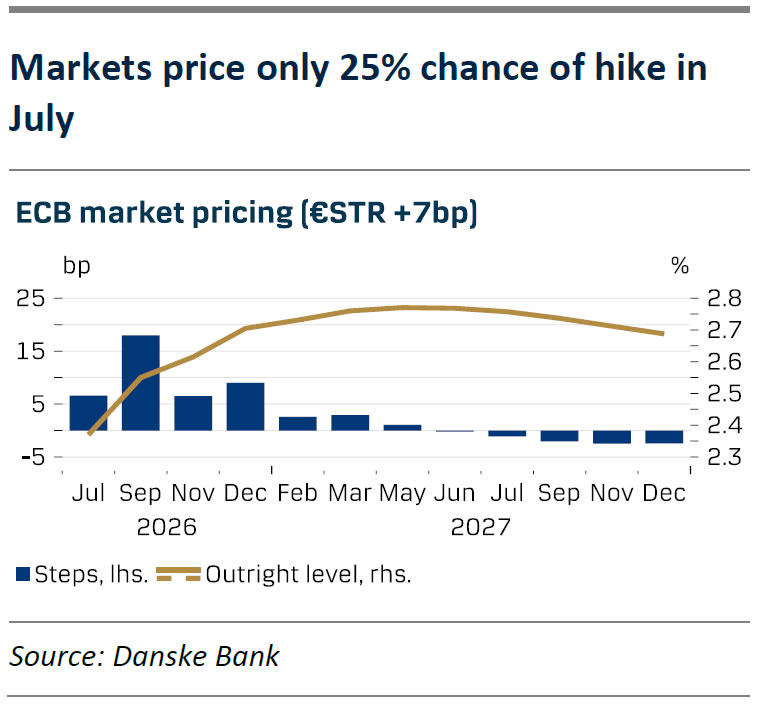
We emphasize the risk that ECB might deliver the second hike already in July if the war in Iran escalates or the increase in services inflation we saw in May was indeed not due to an idiosyncratic factor related to seasonality but a more broad-based pickup in inflation. We stress that the decision of a hike in July or September does not significantly affect the economic outlook nor our overall view on rates markets where we still favour playing the move for lower short-end swap rates.
RBA and Inflation View: June Hold Affirmed, Increases Still Ahead
We affirm our previously published view that the RBA will remain on hold in June, but increase rates in coming months given inflation risks.
- We affirm our existing expectation that the RBA Monetary Policy Board (MPB) will hold the cash rate steady at its June meeting next week. Although inflation remains above target, the previous three rate increases have given the MPB time to assess cross-cutting trends of weak consumers and housing markets versus high inflation pressures and a secular boom in data centres and related investment. The recent run of inflation and labour market data has been a bit mixed, supporting the case for a pause.
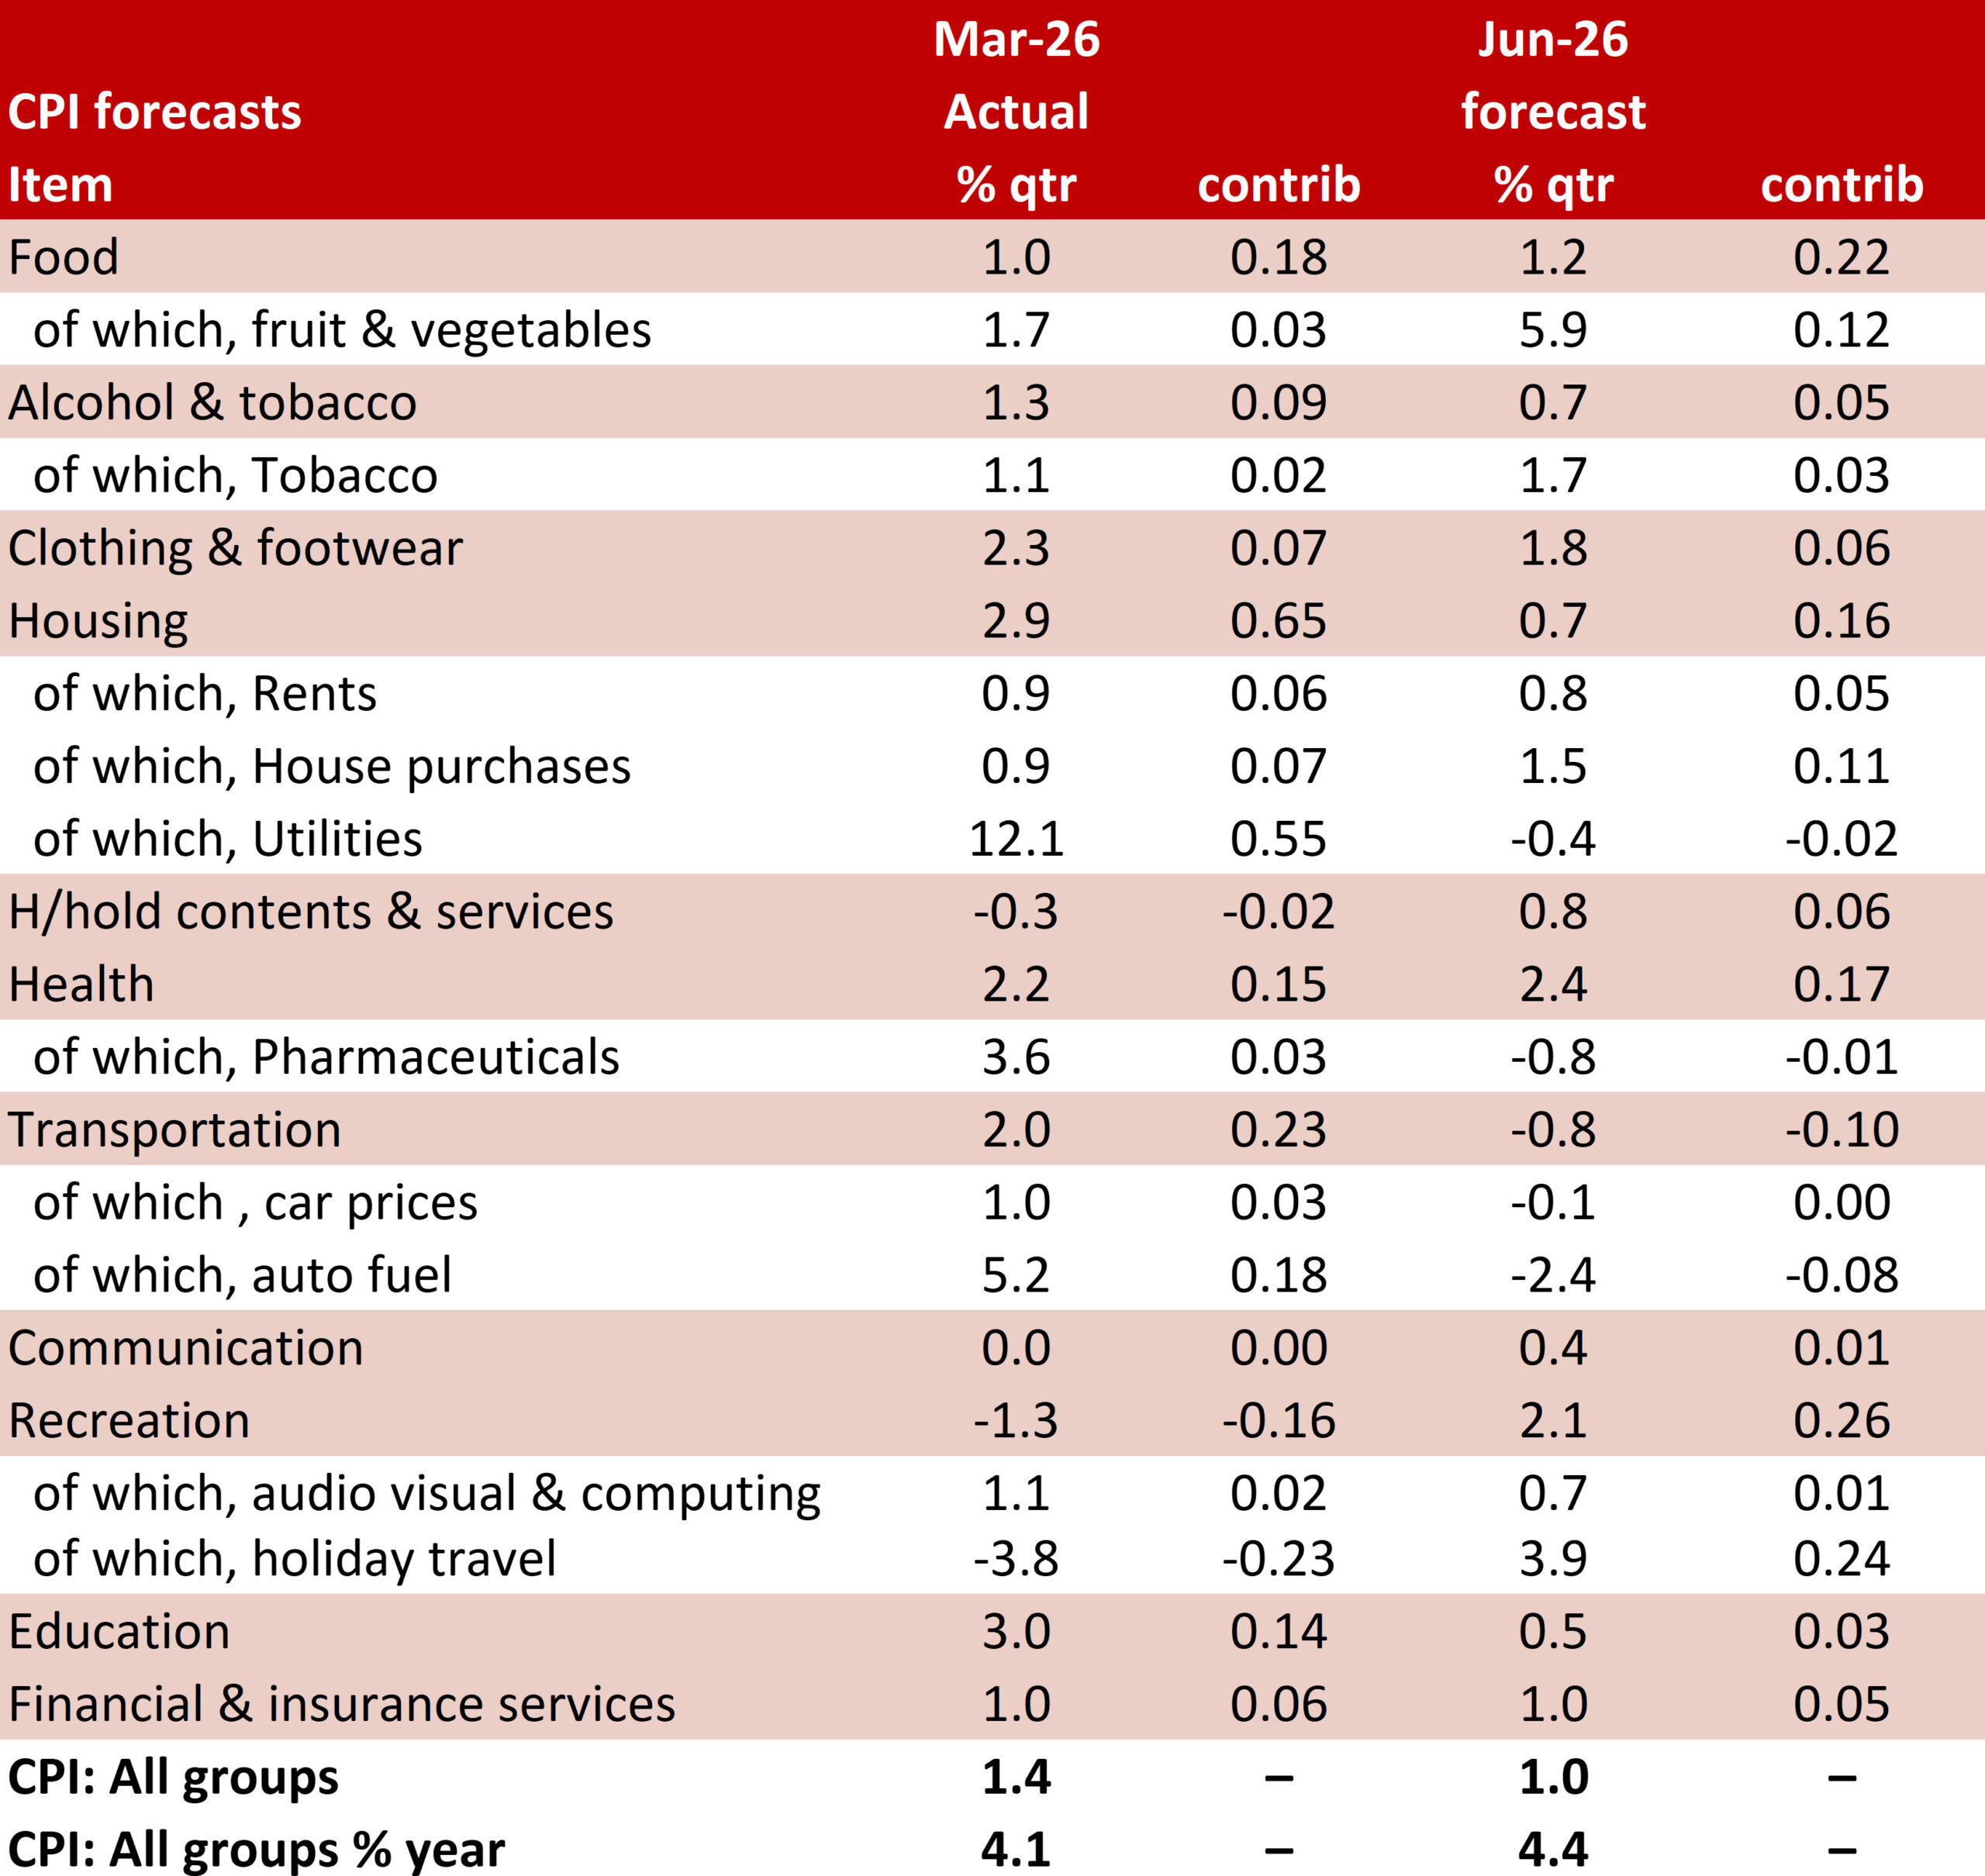
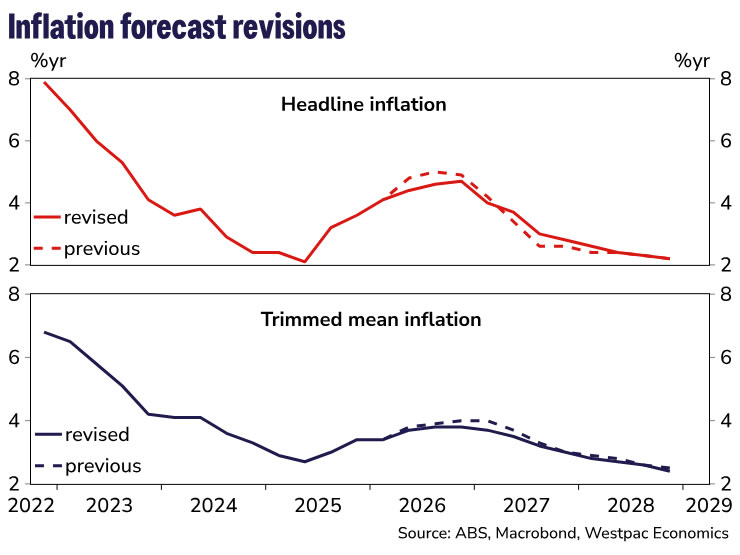
- We update our inflation forecasts below, ahead of the release of our June Market Outlook publication later today. A lower peak for oil, and thus petrol and diesel, prices lowers the peak for headline inflation from 5.0% to 4.7%. Trimmed mean inflation is revised marginally lower across Q2, Q3 and Q4, lowering the peak in the year-ended rate from 4.0%yr to 3.8%yr. We continue to see significant pass-through from higher fuel costs into some other prices. In addition, the larger-than-expected increase in award wages will add a little to some market services components of the CPI, where labour costs are particularly important and many workers are on awards.
- This slightly lower track for underlying inflation is still higher than the RBA’s own forecasts. If we are right about the inflation profile from here, the RBA will be surprised on the upside. We therefore retain our view that further rate hikes will occur in the following meetings (August and September). This is consistent with the RBA’s priority to get inflation down. While ever inflation trends are this far away from the 2.5% target midpoint and showing little tendency to decline, the MPB will regard soft outcomes for the consumer and housing sectors as being a necessary part of the transmission of monetary policy.
- The risks are clearly on the downside, though, in the sense that zero or one further hike is much more likely than three hikes. A more extended pause would be associated with a smaller overall hiking cycle.
While markets are increasingly pricing a faster resolution, our base case for the reopening of the Strait of Hormuz and Gulf oil supply normalisation remains broadly unchanged. We continue to assume shipping rises to around 10% of normal levels by end-June, with full normalisation not occurring until mid-2027.
Q2 average Brent spot and dated prices are tracking below our baseline assumptions of US$110 and US$125 respectively, reflecting a decline in supply risk premia following the ceasefire and a less tight crude balance than anticipated. Stronger-than-expected US exports and weaker Chinese import demand have provided a near-term buffer, though prices have remained volatile amid shifting headlines.
We have lowered our price assumptions through Q2–Q4 2026, with the largest downgrade in Q3 (–US$13/bbl) and a smaller adjustment in Q4, while leaving 2027 broadly unchanged. Prices are likely to fall, potentially below US$90/bbl, on confirmation of a deal and the resumption of shipping, before it becomes evident that the pace of normalisation in traffic and Gulf production will be gradual. The Q2 buffer from US exports is unlikely to persist, while some recovery in Chinese demand is expected. Beyond 2026, we continue to assume a gradual normalisation in shipping and production, alongside a rebuild in global strategic reserves from H2 2027.
Petrol and diesel price assumptions have been revised materially lower across Q2–Q4 2026, reflecting the softer oil price backdrop. The largest adjustments occur in Q3, where petrol is down around 20c/l and diesel close to 100c/l, averaging $2.05/l and $2.39/l respectively.
Following on from these revisions, we have lowered the near-term inflation profile which is partly offset by a stronger wages outlook feeding into market services.
Headline inflation is expected to reach 4.4%yr in Q2 and peak later at 4.7%yr in Q4 (previously 5.0%yr in Q3). Base effects see a more gradual easing thereafter in year-ended terms, with inflation reaching 2.8%yr by end-2027 and 2.2%yr by end-2028.
Trimmed mean inflation has also been revised lower, reaching 3.7%yr in Q2 before peaking at 3.8%yr in Q3 and holding through Q4 (down from 4.0%yr). The quarterly path for the remainder of 2026 is 1.0%, 1.1% and 0.9% – the H2 2026 profile sits slightly above that implied by the RBA’s May Statement on Monetary Policy forecasts. Trimmed mean inflation is expected to return to the RBA’s target band by end-2027 (3.0%yr) and ease to 2.4%yr by end-2028.
While the near-term profile is lower, the risk of second-round effects from higher fuel costs to broader prices remains. Current policy measures are dampening the pass-through, but with most of these set to expire by the end of June, the bulk of the impact from higher freight costs still lies ahead. Additionally, the impact of higher fertiliser costs will likely feed through in the second half of this year with industry surveys showing growers are scaling back planting schedules in response to higher input costs. Drier weather conditions, with the risk of a more severe El Niño, also adds upside pressure.
They key downside risks to our profile stem from weaker consumer demand that limits firms’ ability to pass through higher costs and a faster-than-expected normalisation of shipping through the Strait of Hormuz.
The RBA faces a difficult set of trade-offs in its near-term monetary policy decisions. As well as the more benign developments in energy prices and the conflict more broadly, some domestic data releases have been softer than generally expected. Consumer spending looks to have stalled, tax changes have induced uncertainty in the housing market, and sentiment surveys have weakened. Weak GDP reads are likely in coming quarters.
At the same time, Australia started the year with inflation too high, and the second-round inflation response to higher energy prices is becoming more evident in the data. While the RBA has already tightened policy in response to the lift in inflation that pre-dated the Middle East conflict, business surveys and other information suggest that the pass-through of higher energy prices to other prices has been significant and front-loaded. Contention for resources to construct the pipeline of data centres – an investment boom largely impervious to interest rates – will add to cost pressures.
We continue to expect that the RBA will pause at its June meeting as it assesses the data flow. However, we believe it will remain focused on getting inflation back down to target and will be less swayed by some of this softer data than some observers might assume. Indeed, it is likely that it views the softer data as being a necessary part of the transmission of restrictive monetary policy. Trimmed mean inflation is drifting up, and even after revising the outlook for the somewhat better oil price trajectory, our base case remains higher than the RBA’s May forecasts through the rest of this year. Pass-through is starting to become evident in categories such as home-building costs, dining out and postal and courier services.
Because our inflation forecast is above the RBA’s most recent published forecast, it implies that the RBA will receive an upside surprise in coming months. This implies further rate hikes as the second-round inflation impact of the energy price shock emerge. Given the weaker outlook for the household sector, risks are skewed to the downside, in the sense that zero or one hike from here is much more likely than three hikes. We still regard our two-hike track as the most appropriate base case view, given the inflation outlook.