Sample Category Title
ECB Hikes, Sees Higher Inflation, Lower Growth as Middle East Conflict Deepens
The European Central Bank raised its key interest rates by 25bps as widely expected, and the accompanying statement delivered a clear message: the Middle East conflict is now a major inflation problem for the Eurozone. Explaining the decision, ECB said that "the war in the Middle East is generating inflation pressures" and that the rate increase was "robust across a range of scenarios" describing how the shock could evolve. The deposit rate was raised to 2.25%, while the main refinancing rate increased to 2.40%.
The ECB also raised its inflation outlook higher. Under the new staff projections, headline inflation is expected to average 3.0% in 2026, 2.3% in 2027 and 2.0% in 2028. Core inflation is projected at 2.5% in both 2026 and 2027 before easing to 2.2% in 2028.
Policymakers explicitly attributed the upward revisions to higher energy prices and warned that these costs are expected to feed into "food, goods and services inflation". That language highlights growing concern about second-round inflation effects rather than a purely temporary energy shock.
At the same time, the ECB acknowledged that the economic cost of the conflict is mounting. Growth forecasts were revised lower, with GDP now expected at 0.8% in 2026, 1.2% in 2027 and 1.5% in 2028. The Bank cited the war's impact on commodity markets, real incomes and confidence as key reasons behind the downgrade. The result is an increasingly stagflationary outlook, with inflation moving higher even as growth slows.
Despite the hawkish inflation assessment, the ECB stopped short of signaling another rate increase. Instead, policymakers stressed that the outlook remains uncertain, with "upside risks for inflation and downside risks for economic growth." The Governing Council reiterated its data-dependent and meeting-by-meeting approach and emphasized that it is "not pre-committing to a particular rate path." Markets are therefore left with a central bank that is clearly worried about inflation but still cautious about tightening too aggressively into an increasingly fragile economy.
ECB Staff Projections Comparison
Headline Inflation (%)
| Year | March | June | Change |
|---|---|---|---|
| 2026 | 2.6 | 3.0 | +0.4 |
| 2027 | 2.0 | 2.3 | +0.3 |
| 2028 | 2.1 | 2.0 | -0.1 |
Key takeaway: ECB significantly raised near-term inflation forecasts, reflecting the prolonged energy shock and its broader pass-through into the economy.
Core Inflation (%)
| Year | March | June | Change |
|---|---|---|---|
| 2026 | 2.3 | 2.5 | +0.2 |
| 2027 | 2.2 | 2.5 | +0.3 |
| 2028 | 2.1 | 2.2 | +0.1 |
Key takeaway: The increase in core inflation forecasts is arguably more important than the headline revision. ECB now expects energy costs to feed into food, goods and services prices, signaling greater concern about second-round inflation effects.
GDP Growth (%)
| Year | March | June | Change |
|---|---|---|---|
| 2026 | 0.9 | 0.8 | -0.1 |
| 2027 | 1.3 | 1.2 | -0.1 |
| 2028 | 1.4 | 1.5 | +0.1 |
Key takeaway: Growth forecasts were trimmed for 2026 and 2027 as the war's impact on energy prices, confidence and real incomes weighs on activity. However, ECB sees slightly stronger medium-term recovery by 2028.
(ECB) Monetary policy decisions
The Governing Council is committed to setting monetary policy to ensure that inflation stabilises at its 2% target in the medium term. In line with this commitment, it today decided to raise the three key ECB interest rates by 25 basis points. The war in the Middle East is generating inflation pressures, and the decision to raise rates is robust across a range of scenarios mapping out how the shock might evolve and affect the medium-term outlook for the euro area.
In the baseline of the new Eurosystem staff projections, headline inflation is expected to average 3.0% in 2026, 2.3% in 2027 and 2.0% in 2028. For inflation excluding energy and food, the baseline foresees an average of 2.5% in 2026 and 2027 and 2.2% in 2028. Compared with March, staff have revised up their baseline projection for inflation in 2026 and 2027 owing to a higher path for energy prices, which, to some extent, is expected to feed into food, goods and services inflation. The baseline sees economic growth at an average of 0.8% in 2026, 1.2% in 2027 and 1.5% in 2028. This is a downward revision for 2026 and 2027, reflecting a more pronounced impact of the war on commodity markets, real incomes and confidence.
The outlook remains uncertain, with upside risks for inflation and downside risks for economic growth. The full implications of the war for medium-term inflation and growth will depend on the intensity and duration of the energy price shock, as well as the scale of its indirect and second-round effects. This uncertainty is also reflected in the broad range of outcomes for inflation and growth in the updated illustrative scenarios put together by Eurosystem staff. These will be published with the staff projections on the ECB’s website.
With today’s decision, the Governing Council remains well positioned to navigate the uncertainty caused by the war. It will closely monitor the situation and follow a data-dependent and meeting-by-meeting approach to determining the appropriate monetary policy stance. In particular, the Governing Council’s interest rate decisions will be based on its assessment of the inflation outlook and the risks surrounding it, in light of the incoming economic and financial data, as well as the dynamics of underlying inflation and the strength of monetary policy transmission. The Governing Council is not pre-committing to a particular rate path.
Key ECB interest rates
The Governing Council decided to raise the three key ECB interest rates by 25 basis points. Accordingly, the interest rates on the deposit facility, the main refinancing operations and the marginal lending facility will be increased to 2.25%, 2.40% and 2.65% respectively, with effect from 17 June 2026.
Asset purchase programme (APP) and pandemic emergency purchase programme (PEPP)
The APP and PEPP portfolios are declining at a measured and predictable pace, as the Eurosystem no longer reinvests the principal payments from maturing securities.
***
The Governing Council stands ready to adjust all of its instruments within its mandate to ensure that inflation stabilises at its 2% target in the medium term and to preserve the smooth functioning of monetary policy transmission. Moreover, the Transmission Protection Instrument is available to counter unwarranted, disorderly market dynamics that pose a serious threat to the transmission of monetary policy across all euro area countries, thus allowing the Governing Council to more effectively deliver on its price stability mandate.
The President of the ECB will comment on the considerations underlying these decisions at a press conference starting at 14:45 CET today.
NASDAQ 100 Analysis: Is This the Beginning of a Deeper Correction?
As the chart shows, the Nasdaq 100 (US Tech 100 Mini on FXOpen) is down more than 6% from its recent highs, with Friday, 6 June, standing out as the defining session: a single-day loss of approximately 4.74% marked the worst daily performance of 2026.
The S&P 500 (US SPX 500 Mini on FXOpen) declined around 4% from its highs, while the Dow Jones (Wall Street 30 Mini on FXOpen) posted a more contained loss of approximately 3%. Investors and traders are now asking the same question: Is this the beginning of a deeper correction, or simply an isolated bout of volatility?
Why Did US Markets Sell Off?
The sell-off was driven by a combination of geopolitical, macroeconomic, and technical factors. On the geopolitical front, US/Israel–Iran negotiations have shown signs of escalation in recent days, injecting uncertainty into already fragile risk sentiment.
The primary catalyst, however, was Friday's Non-Farm Payrolls report, which showed 172,000 jobs added compared with forecasts of just 85,000. The stronger-than-expected reading sent the US dollar sharply higher, putting pressure on all inversely correlated assets, including equity indices, gold, silver, forex pairs, and cryptocurrencies.
Adding further headwinds, Wednesday's CPI print showed inflation holding at 4.2% (Core CPI: 2.9%), potentially pushing the Fed, now under new Chair Warsh, to keep rates on hold for longer.
Technical Analysis of the Nasdaq 100
The chart presents two contrasting scenarios.
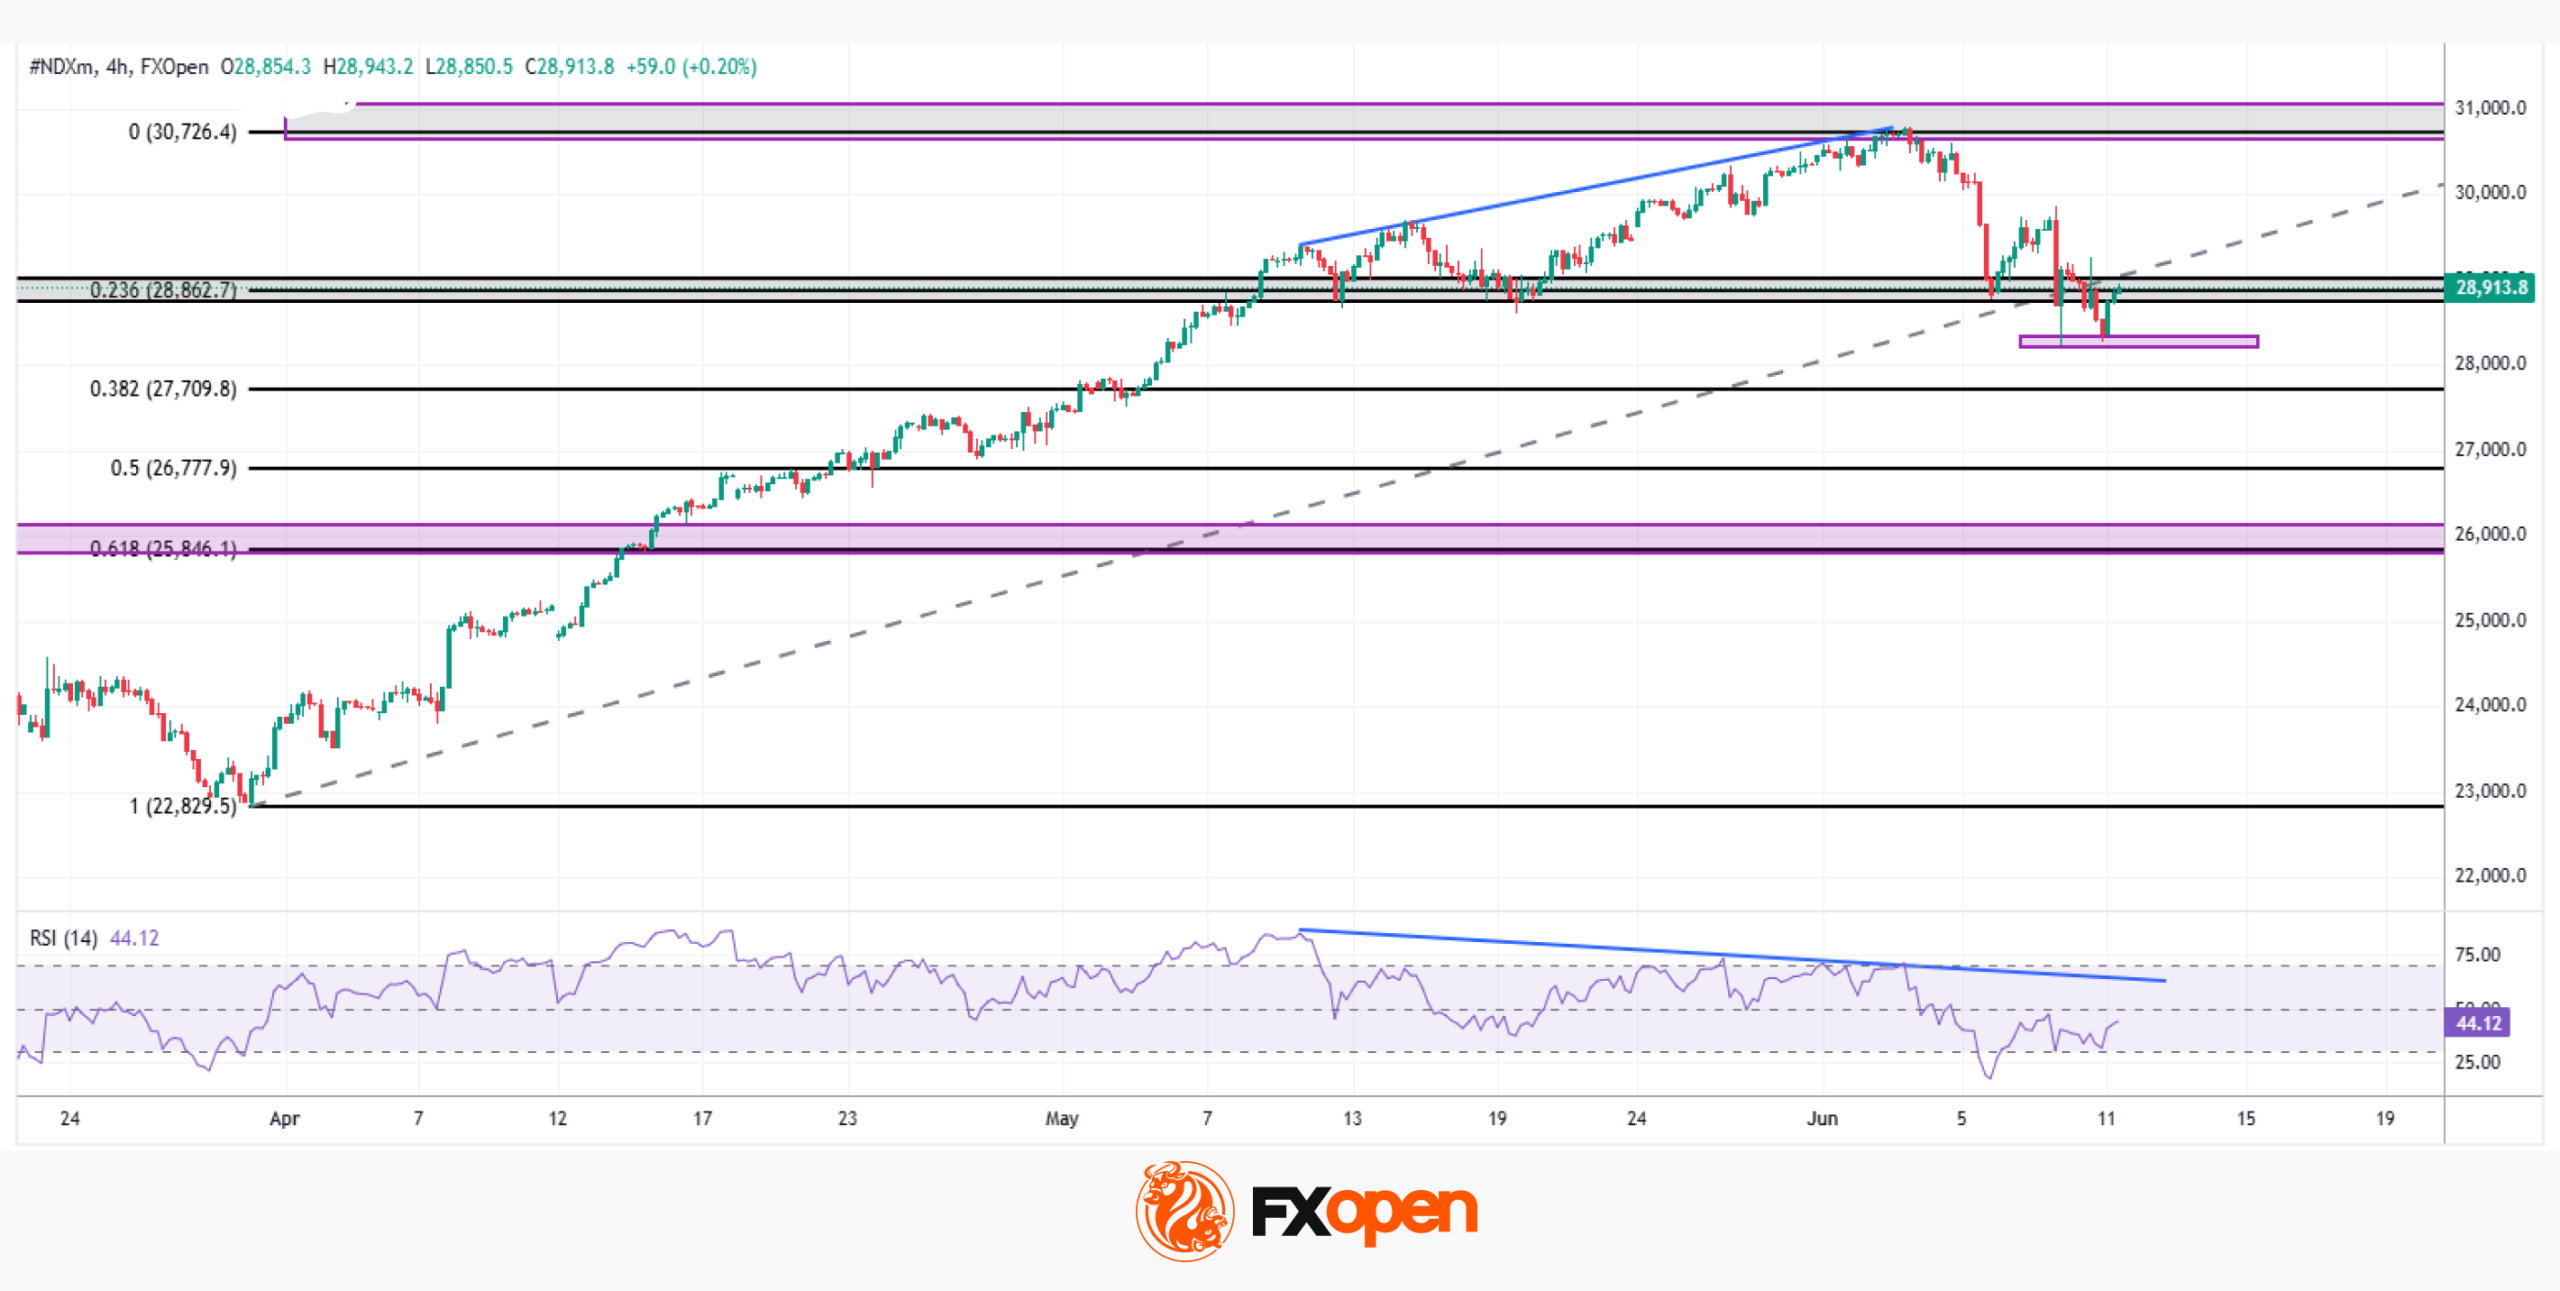
On the bullish side, the price defended the 28,200–28,300 support zone twice, triggering a rebound toward the 28,800–29,000 region, a key former support level now acting as resistance. A clean break above this level could suggest the broader uptrend remains intact, while a rejection might initiate a sequence of lower highs and lower lows.
On the bearish side, a confirmed break below the lows of 9 and 11 June could potentially expose the 25,800–26,000 zone — where a key former resistance and the 0.618 Fibonacci retracement of the late-March rally converge. An RSI divergence on the 4H time-frame, already visible before the sell-off, appears to be playing out in support of this scenario.
With dollar strength, sticky inflation, and geopolitical risk all weighing on sentiment, these levels could prove decisive in the sessions ahead.
Trade global index CFDs with zero commission and tight spreads (additional fees may apply). Open your FXOpen account now or learn more about trading index CFDs with FXOpen.
This article represents the opinion of the Companies operating under the FXOpen brand only. It is not to be construed as an offer, solicitation, or recommendation with respect to products and services provided by the Companies operating under the FXOpen brand, nor is it to be considered financial advice.
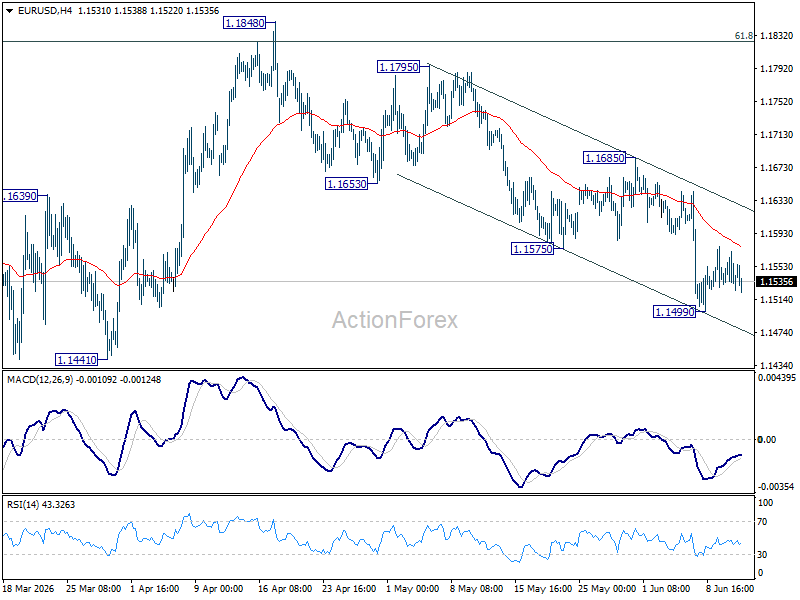
EUR/USD Daily Outlook
Range trading continues in EUR/USD above 1.1499 and intraday bias remains neutral. Risk will stay on the downside as long as 1.1685 resistance holds. Break of 1.4992 will resume the fall from 1.1848 to retest 1.1408 low next.
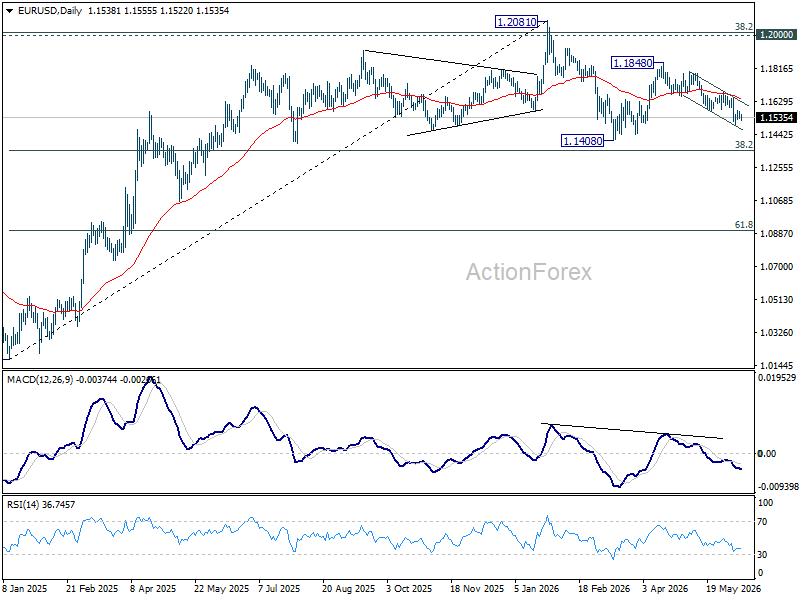
In the bigger picture, the strong support from 38.2% retracement of 1.0176 to 1.2081 at 1.1353 suggests that the pullback from 1.2081 is more likely a corrective move. Strong support was also found in 55 W EMA (now at 1.1547). Focus is back on 1.2 key cluster resistance level. Decisive break there will carry long term bullish implications. Nevertheless, break of 1.1408 support will revive the case of medium term bearish trend reversal.
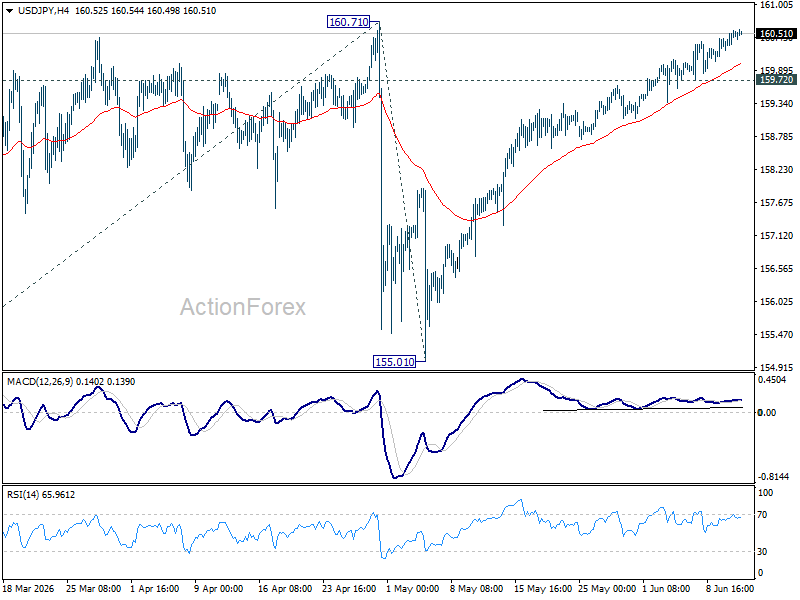
USD/JPY Daily Outlook
Further rise could still be seen in USD/JPY. But strong resistance is still expected from 160.71. Break of 159.72 minor support will turn bias back to the downside for deeper pullback first. However, decisive break of 160.71 will confirm up trend resumption. That should push USD/JPY through 161.94 to 100% projection of 152.25 to 160.71 from 155.01 at 163.47 next.
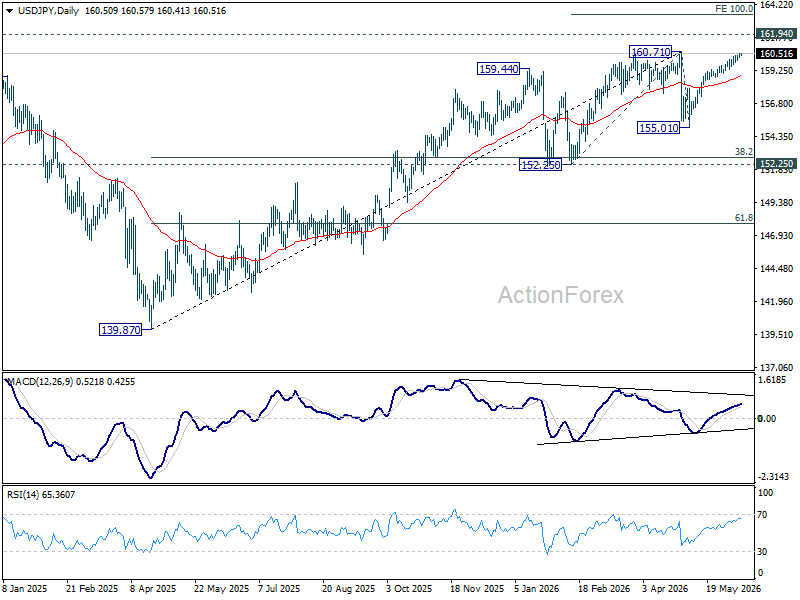
In the bigger picture, for now, corrective pattern from 161.94 (2024 high) is still seen as completed at 139.87. Rise from there is seen as resuming the long term up trend. So, break of 161.94 is expected at a later stage to resume the long term up trend. However, sustained break of 55 W EMA (now at 154.93) will dampen this view and bring deeper fall back towards 139.87 to extend the pattern from 161.94.
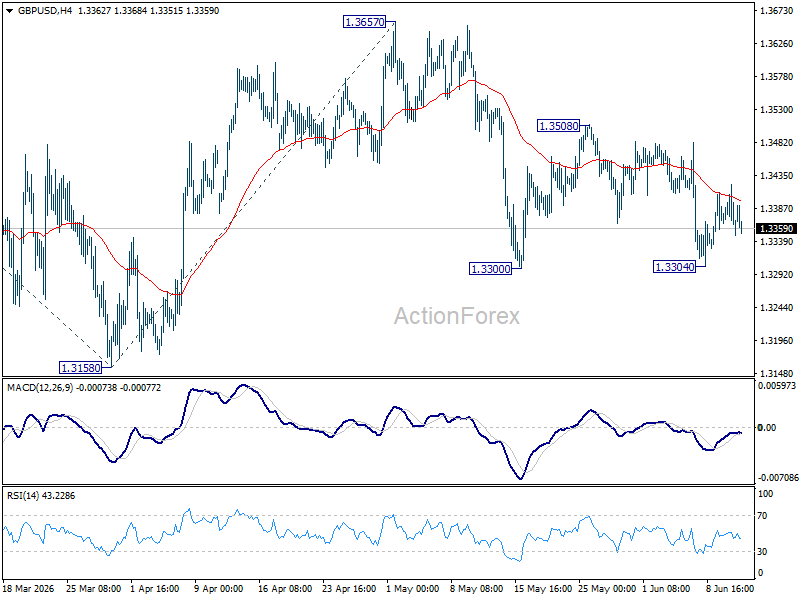
GBP/USD Daily Outlook
Range trading continues in GBP/USD and intraday bias stays neutral. On the downside, break of 1.3300 will target a retest on 1.3158. Firm break there will extend the whole fall from 1.3867 to 100% projection of 1.3867 to 1.3158 from 1.3657 at 1.2948. For now, risk is mildly on the downside as long as 1.3508 resistance holds, in case of recovery.
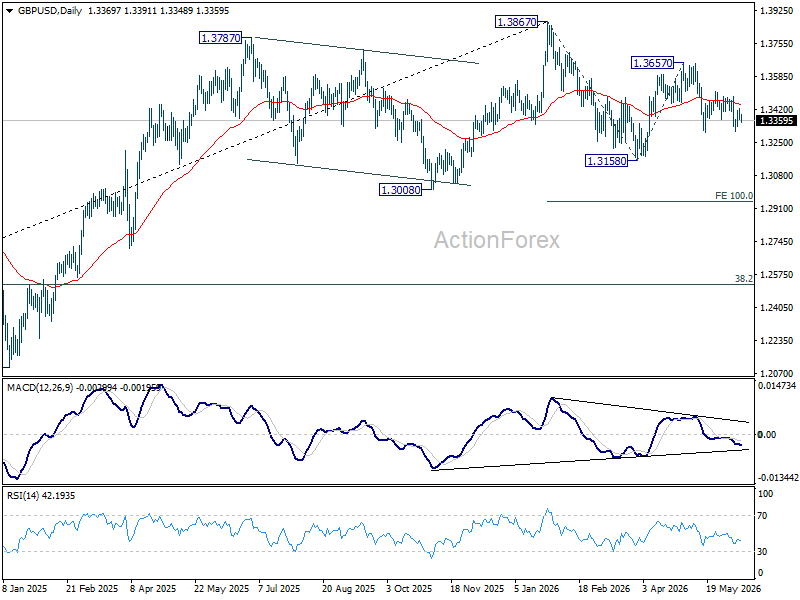
In the bigger picture, price actions from 1.3867 are a corrective pattern within the broader up trend from 1.0351 (2022 low). With 1.3008 support intact, medium term bullishness is maintained and break of 1.3867 is in favor for a later stage, towards 1.4248 key resistance (2021 high). However, firm break of 1.3008 will at least bring deeper fall to 38.2% retracement of 1.0351 to 1.3867 at 1.2524, with increased risk of bearish reversal.
USD/CHF Daily Outlook
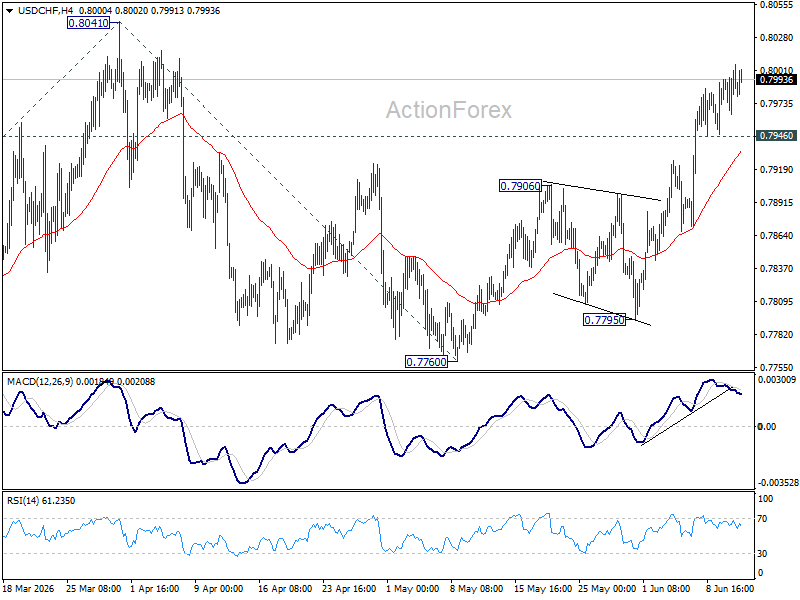
Intraday bias in USD/CHF remains mildly on the upside for retesting 0.8041 high. Firm break there will resume the rise form 0.7603 and target 100% projection 0.7603 to 0.841 from 0.7600 at 0.8198 next. On the downside, below 0.7946 minor support will turn intraday bias neutral again.
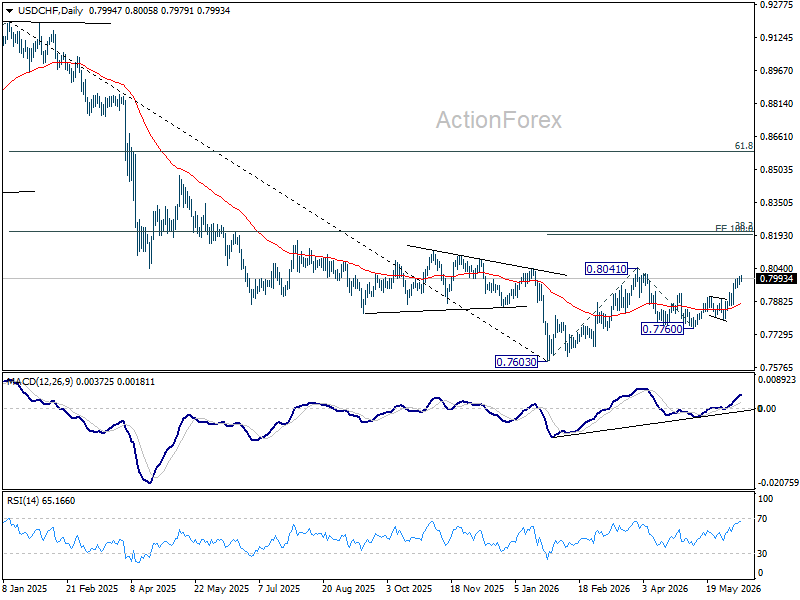
In the bigger picture, while a medium term bottom was formed at 0.7603, it's still early to call for bullish trend reversal. As long as 38.2% retracement of 0.9200 (2025 high) to 0.7603 at 0.8213 holds, the larger down trend could still continue through 0.7603 at a later stage. However, firm break of 0.7603 will argue that the trend has reversed and turn focus to 0.8332 support turned resistance (2023 low) for confirmation.
AUD/USD Daily Report
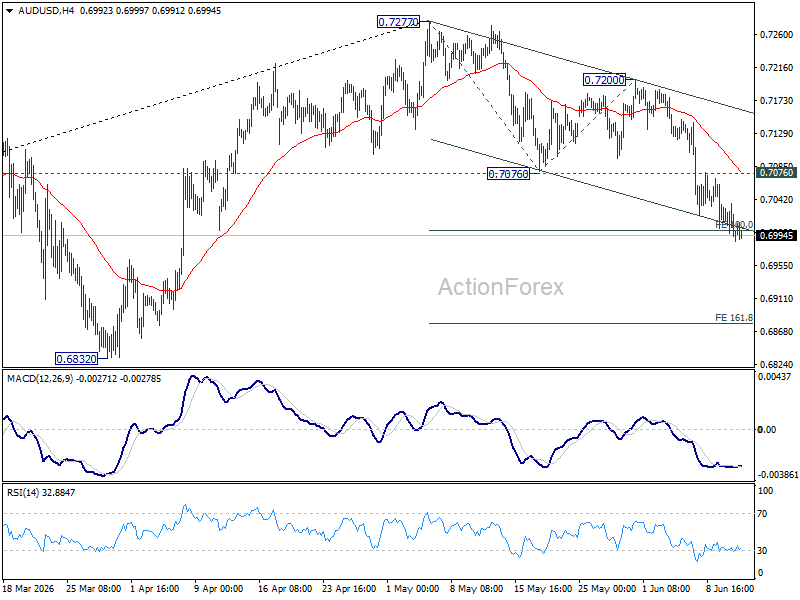
Intraday bias in AUD/USD remains on the downside at this point. Firm break of 100% projection of 0.7277 to 0.7076 from 0.7200 at 0.699 will target 161.8% projection at 0.6875. On the upside, above 0.7076 support turned resistance will turn intraday bias neutral first.
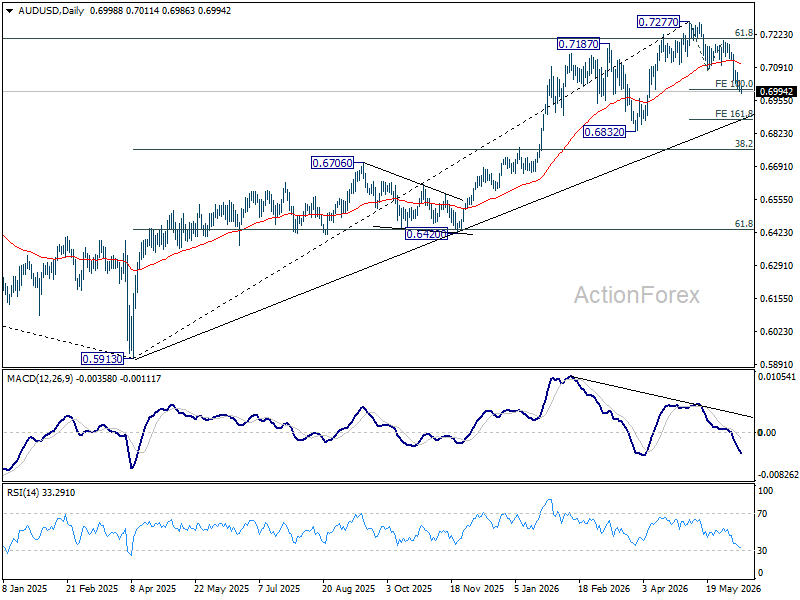
In the bigger picture, considering bearish divergence condition in D MACD, a medium term top could be formed at 0.7277 after failing to sustain above 61.8% retracement of 0.8006 (2021 high) to 0.5913 (2024 low) at 0.7206). Deeper fall could be seen to 38.2% retracement of 5913 to 0.7277 at 0.6756 as a correction. But strong support should be seen there to bring rebound. Consolidations would continue below 0.7277 for a while.
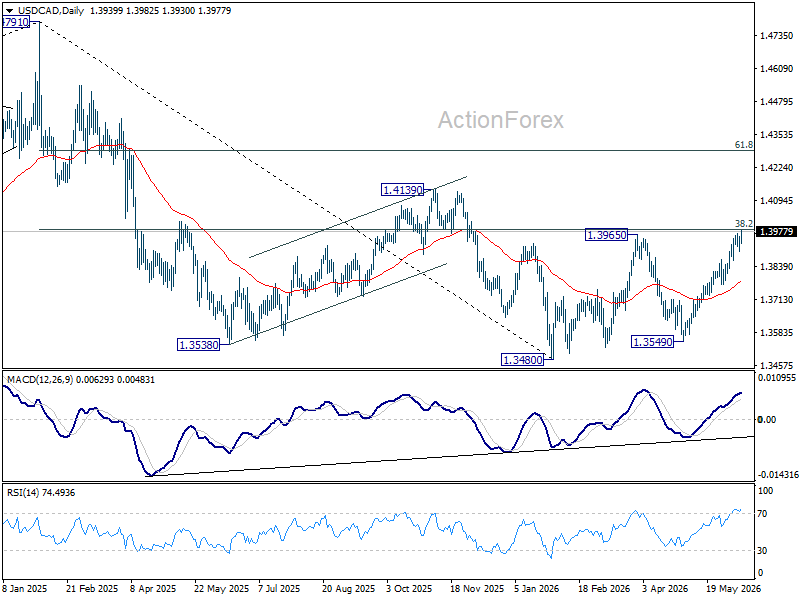
USD/CAD Daily Outlook
USD/CAD's rally resumed by breaking through 1.3967 temporary top and intraday bias is back on the upside. Decisive break of 38.2% retracement of 1.4791 to 1.3480 at 1.3981 will carry larger bullish implications and target 61.8% retracement at 1.4290 next. On the downside, below 1.3897 minor support will turn bias neutral again first.
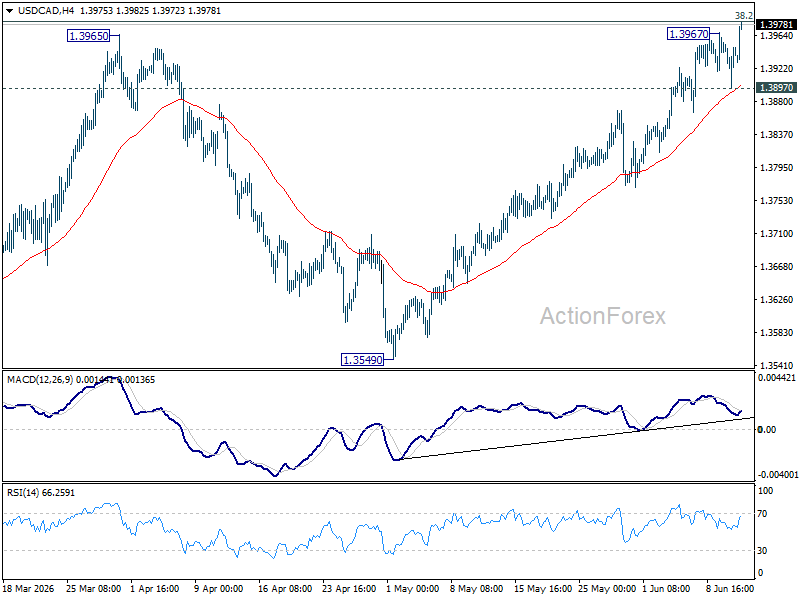
In the bigger picture, price actions from 1.4791 are seen as a corrective pattern to the whole up trend from 1.2005 (2021 low). Rejection by 38.2% retracement of 1.4791 to 1.3480 at 1.3981 will keep the decline intact, and bring another fall through 1.3480 at a later stage. However, firm break of 1.3981 will argue that the decline has completed, and set up further rise back to retest 1.4791 instead.
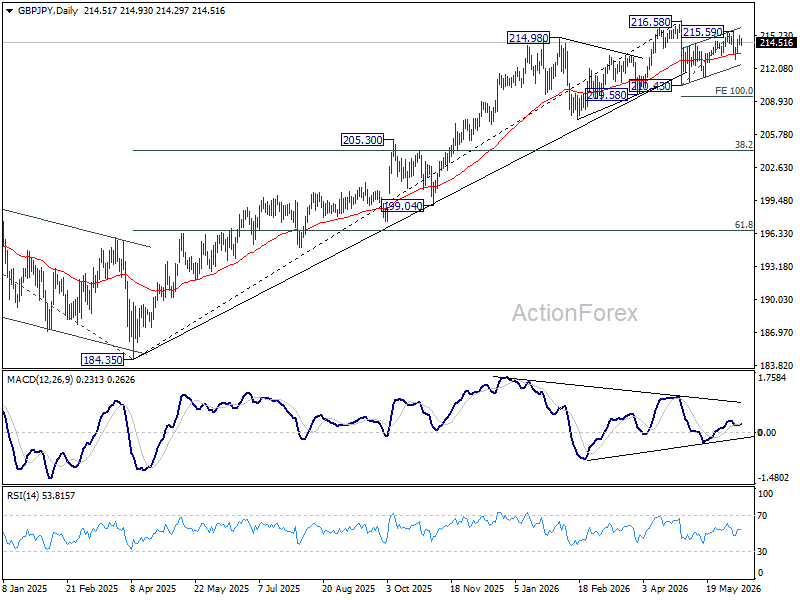
GBP/JPY Daily Outlook
Intraday bias in GBP/JPY stays neutral at this point. Risk stays mildly on the downside as long as 215.59 resistance holds. Below 212.90 will target 210.43/211.23 support zone. However, firm break of 215.59 will resume the rebound from 210.43 to retest 216.58 high instead.
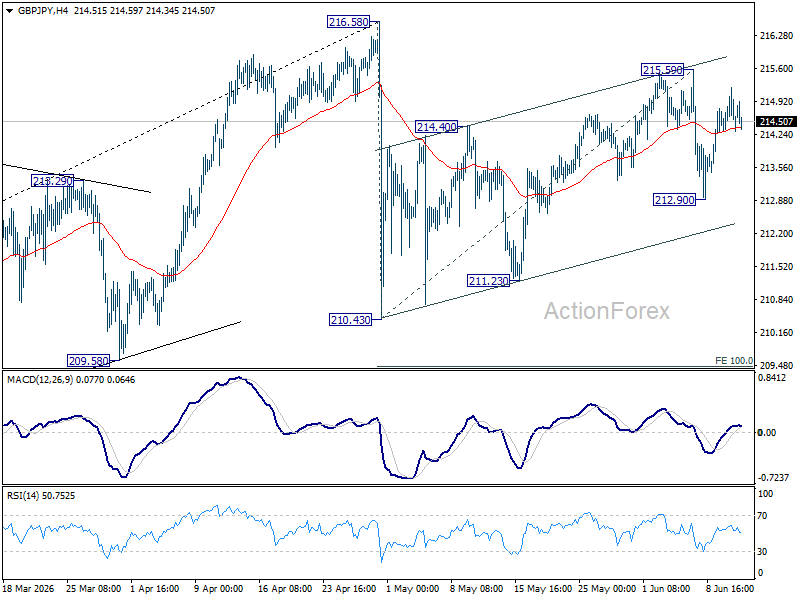
In the bigger picture, there is no clear sign of trend reversal yet. The long term up trend could still extend to 61.8% projection of 148.93 (2022 low) to 208.09 (2024 high) from 184.35 at 220.90 on resumption. However, sustained break of 55 W EMA (now at 206.77) will argue that it's already in medium term down trend for 184.35 support.