
Sample Category Title
EUR/JPY Daily Outlook
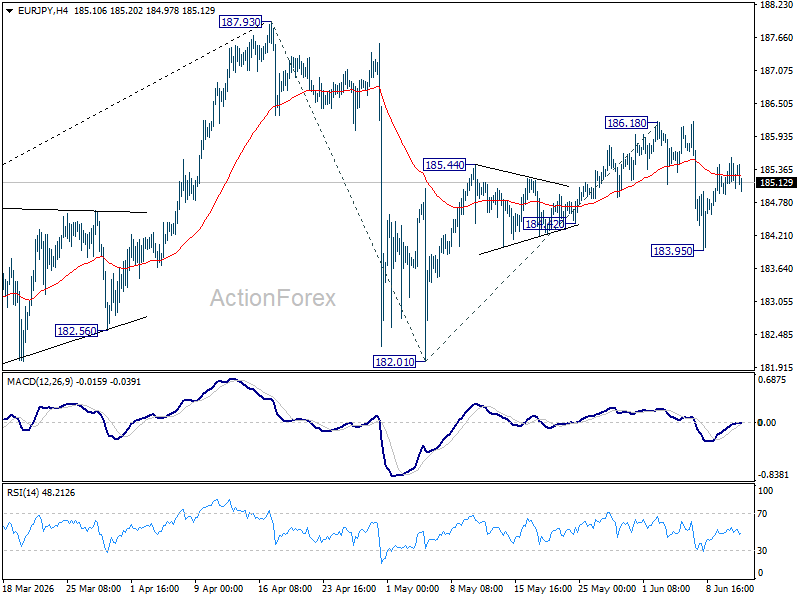
Intraday bias in EUR/JPY remains neutral for the moment. Risks stay mildly on the downside as long as 186.18 resistance holds. Below 183.95 will bring retest of 182.01 support first. However, firm break of 186.18 will resume the rebound from 182.01 to retest 187.93 high instead.
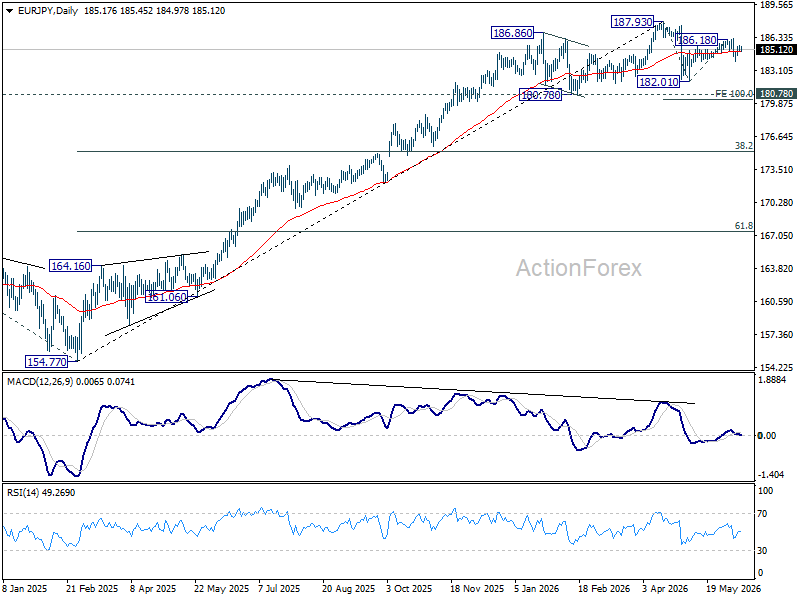
In the bigger picture, there is no sign of reversal yet. Uptrend from 114.42 (2020 low) is still expected to resume at a later stage to 78.6% projection of 124.37 (2022 low) to 175.41 (2025 high) from 154.77 at 194.88. However, sustained break of 55 W EMA (now at 178.95) will argue that it's already in a medium term down trend to 175.41 resistance turned support and below.
EUR/GBP Daily Outlook
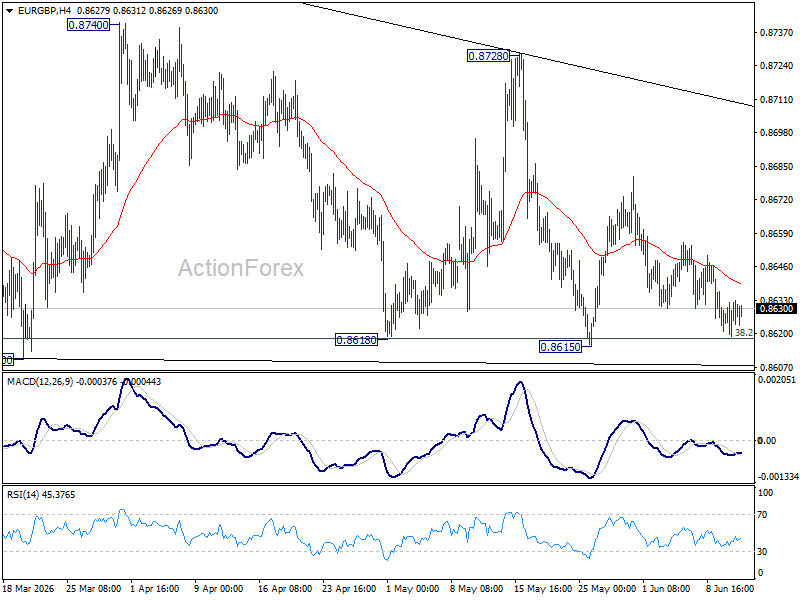
EUR/GBP is still bounded in sideway trading and intraday bias stays neutral. On the downside, decisive break of 0.8610 support will revive the case of bearish trend reversal. On the upside, break of 0.8728 resistance will bring stronger rally back towards 0.8788 resistance.
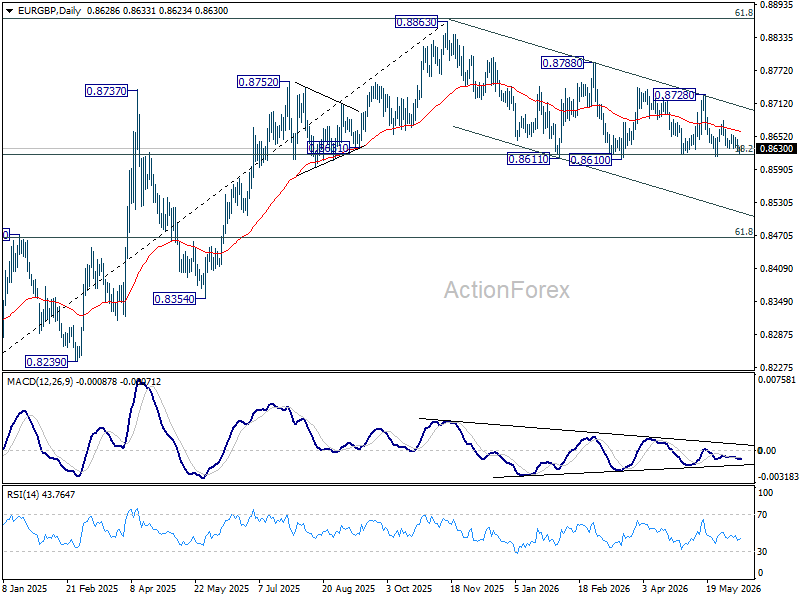
In the bigger picture, focus is staying on 38.2% retracement of 0.8821 to 0.8863 at 0.8618. Strong rebound from there will retain medium term bullishness. Rise from 0.8221 should resume through 0.8863 at a later stage. Nevertheless, sustained break of 0.8618 will confirm that whole rise from 0.8221 has completed at 0.8863. Deeper decline should then be seen to 61.8% retracement at 0.8466 at least.
EUR/AUD Daily Outlook
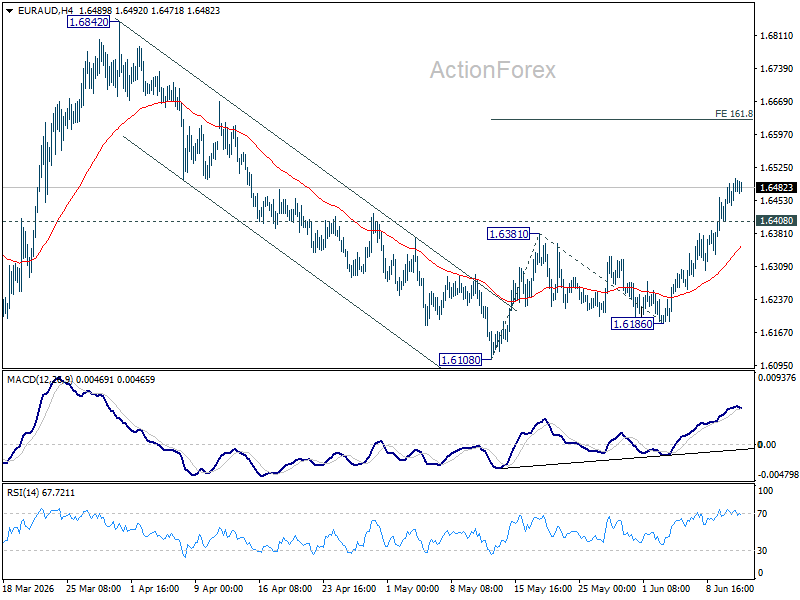
Intraday bias in EUR/AUD remains on the upside for the moment. Rise from 1.6108 is in progress and should target 161.8% projection of 1.6108 to 1.6381 from 1.6186 at 1.6628 next. On the downside, below 1.6480 minor support will turn bias neutral and bring consolidations first.
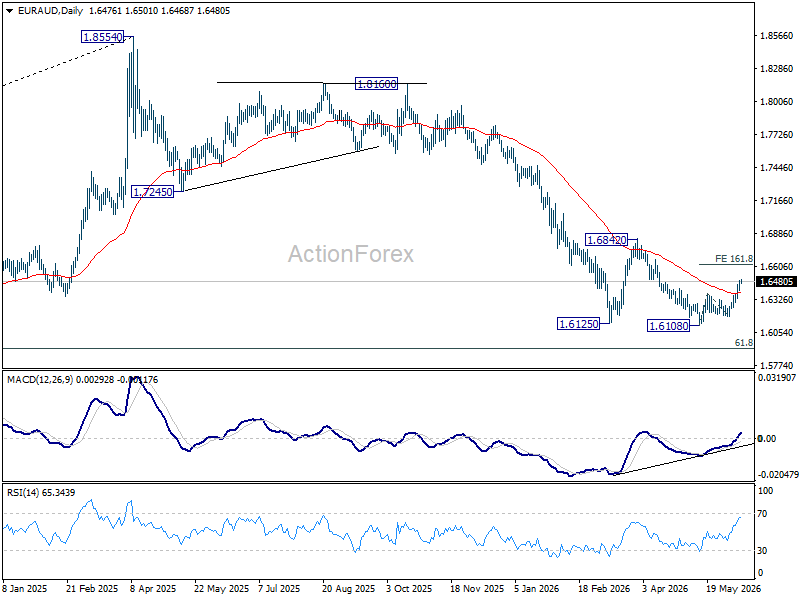
In the bigger picture, outlook will stay bearish as long as 1.6842 resistance holds. Fall from 1.8554 (2025 high) is expected to continue to 61.8% retracement of 1.4281 to 1.8554 at 1.5913. Decisive break there will pave the way back to 1.4281 (2022 low). However, firm break of 1.6842 should confirm medium term bottoming, and bring stronger rally.
EUR/CHF Daily Outlook
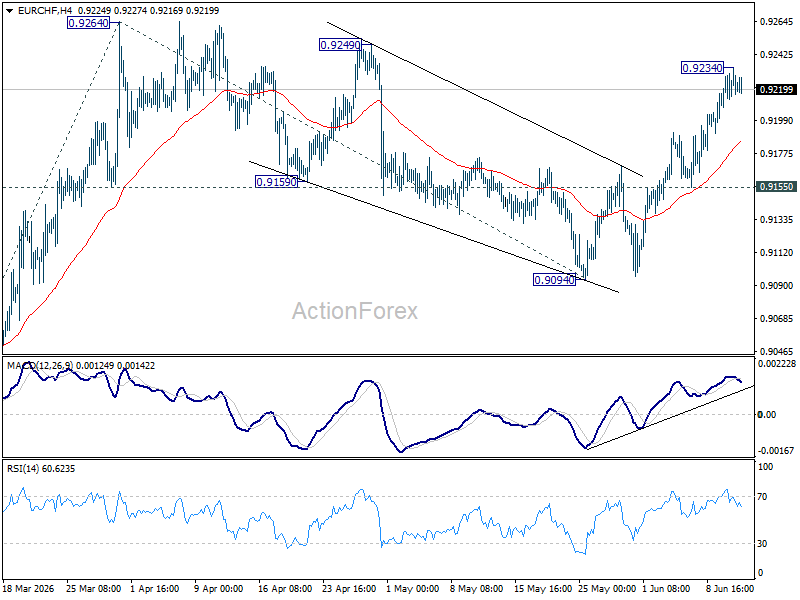
Intraday bias in EUR/CHF is turned neutral again with current retreat, and some consolidations would be seen below 0.9234 temporary top. Further rise is expected as long as 0.9155 support holds. Above 0.9234 will bring retest of 0.9264 resistance first. Firm break there will resume the rise from 0.8979 to 100% projection of 0.8979 to 0.9264 from 0.9094 at 0.9379.
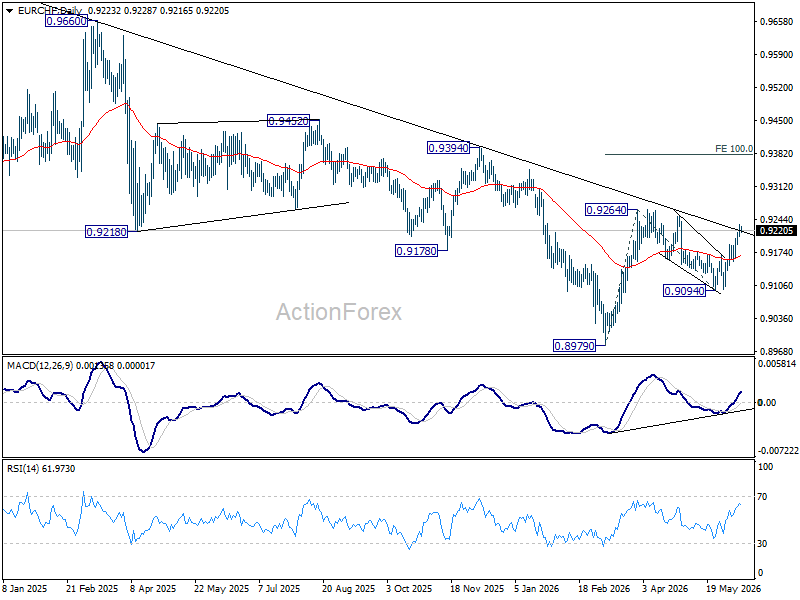
In the bigger picture, as long as 0.9394 resistance holds, down trend from 0.9928 (2024 high) should still be in progress. Firm break of 0.8979 will confirm down trend resumption. However, decisive break of 0.9394 will be an important sign of medium term bullish reversal.
Brent – Bears Hold Grip Despite Fresh Escalation in the Middle East
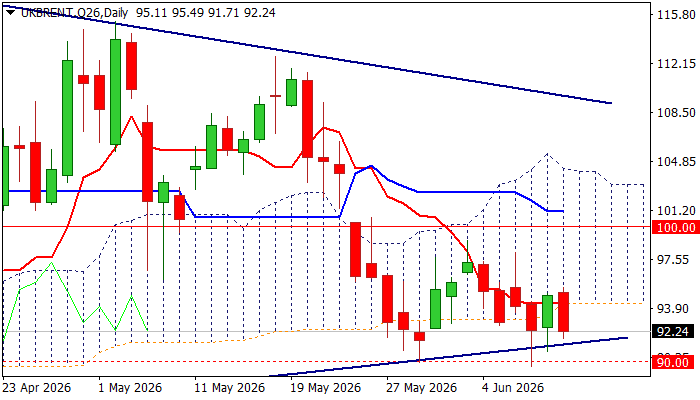
Brent oil price remains within a range between $90.00 and $95.00 for the fifth consecutive day despite renewed tensions in the Middle East and much stronger than expected draw in US crude inventories, as markets still do not see significant threat from the overall situation.
Although the price repeatedly jumped (Wed / Thu) on fire exchange between US and Iran, gains were limited, with today’s quick reversal (price dropped almost $4) suggesting that markets look for stronger signal from geopolitical side to define fresh direction.
Also, US crude inventories fell by 7.2 million barrels last week (almost identical drop to the previous week’s 7.9 million barrels) and strongly overshot forecasts for 3 million barrels draw, as the US continues to use reserves and strategic reserves to cover up shortage in supply, caused by partial / total close of strait of Hormuz, key route for transport of oil from several Gulf countries that resulted in the lowest oil output from OPEC members in over two decades.
Technical picture remains predominantly bearish on daily chart (negative momentum studies / MAs in mixed setup) with near-term price action mainly holding below the base of thick daily Ichimoku cloud, which now acts as solid resistance (cracked several times but without sustained break higher) that keeps upper breakpoints at $99.00 and $100.00 out of reach.
Near-term bias is expected to remain with bears while cloud base limits recovery attempts.
On the other hand, the base has been formed at $90.00 zone following repeated strong rejection here and renewed attacks are likely to face increased headwinds, but firm break would signal continuation of larger downtrend from $120 zone.
Res: 94.32; 95.50; 97.41; 98.41
Sup: 91.71; 90.76; 90.00; 89.58
The Crypto Market Is Consolidating Rather Than Falling
Market Overview
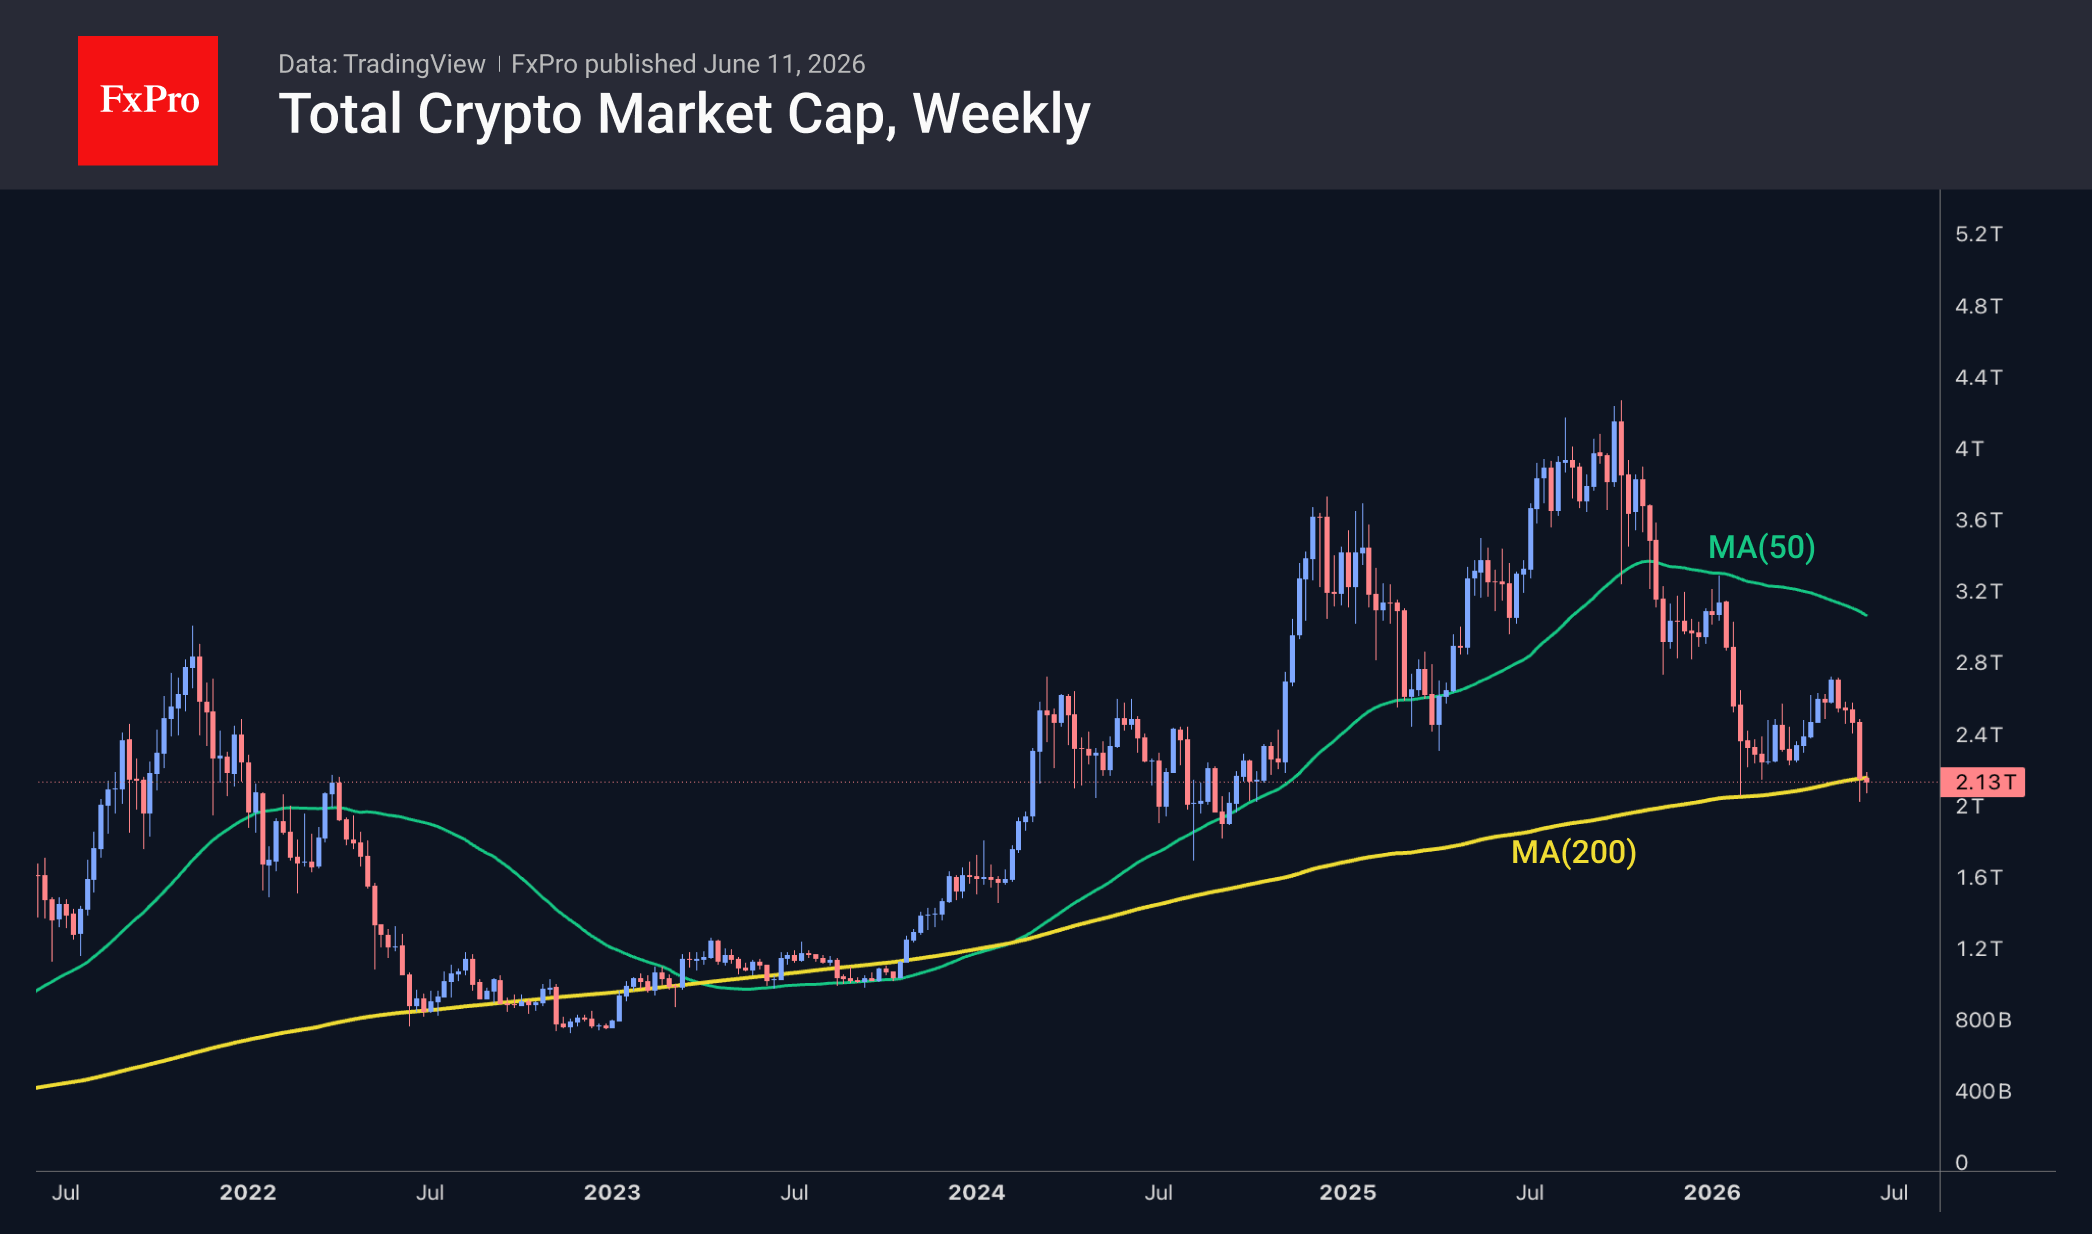
The crypto market capitalisation has risen by 0.9% to $2.15 trillion over the past 24 hours, with gains broadly distributed among the most popular altcoins. In the short term, this looks more like a technical rebound within a broader consolidation near the 200-week moving average than a full-fledged reversal. Nevertheless, relatively small coins such as SushiSwap, Cosmos, and Official Trump have led this rebound, gaining 6%, 5%, and 4.6%, respectively. The underperformers were Aptos (-3.2%), Algorand (-2%), and Zcash (-1.6%).
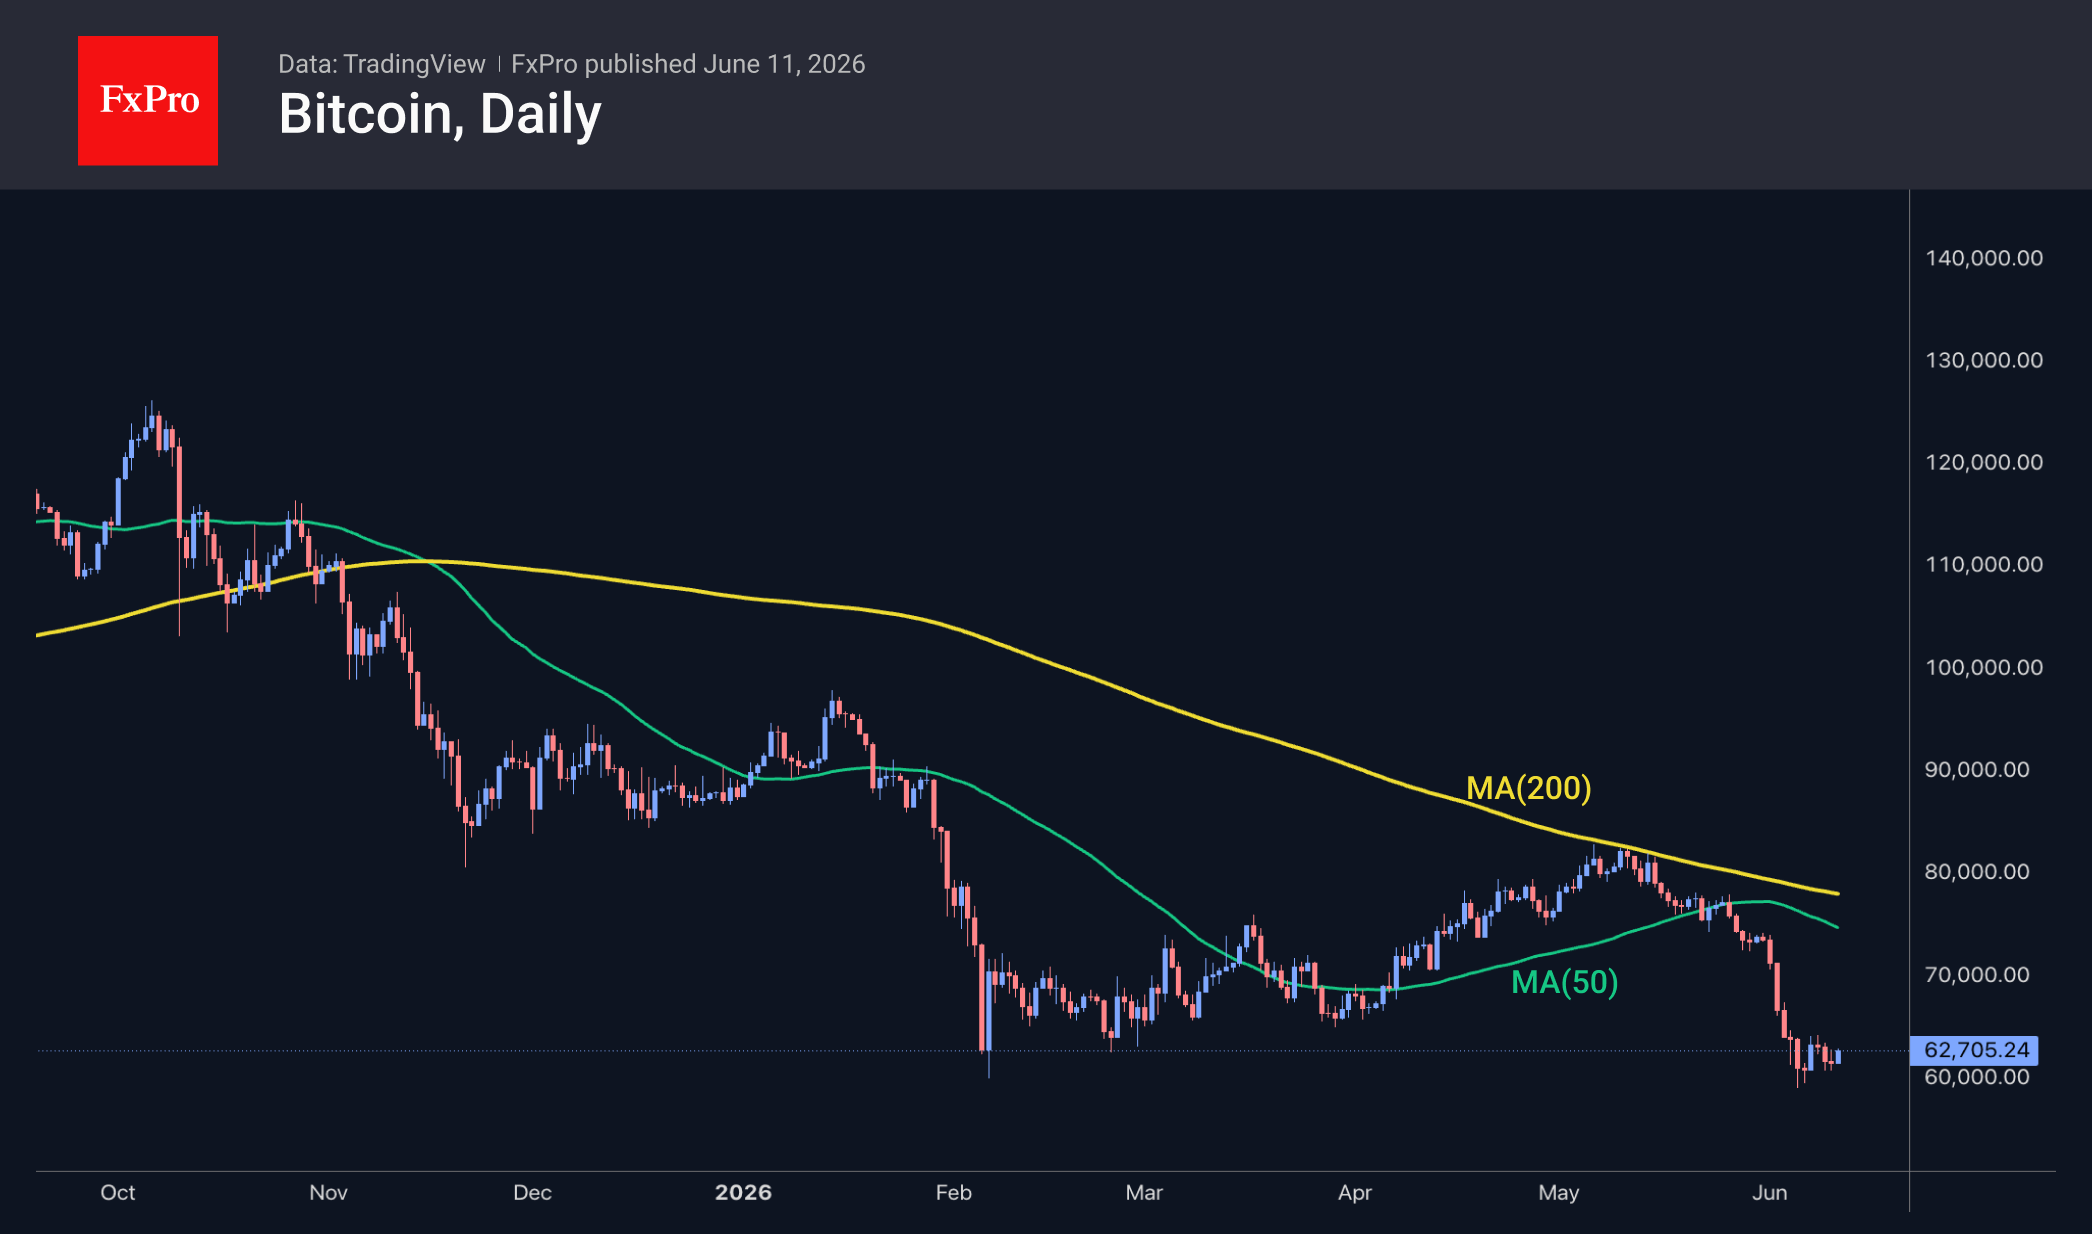
Bitcoin is trading on the cusp of $63K, which is below the consolidation zone seen in the early months of this year. This positioning points to the bears’ formidable strength. On the other hand, the market did not enter a nosedive, having dipped below the previous support line while avoiding the cascading spiral of stop-loss orders being triggered, as was the case last October or February. Bitcoin has also changed its reaction to sell-offs in risky assets, effectively holding and building positions during the sell-off in tech stocks.
News Background
Despite the short-term rebound, market structure and on-chain data do not yet confirm the formation of a sustained uptrend, according to CryptoQuant.
Bitcoin remains vulnerable to further declines, as a solid bottom has yet to be established, according to Wintermute. There is still insufficient demand from large investors for the leading cryptocurrency, amid capital outflows from spot Bitcoin ETFs.
Bitwise believes that Bitcoin’s recent decline reflects broader trends in financial markets and is not solely attributable to issues within the crypto industry. BTC may react to changes in global financial market conditions sooner than traditional assets.
Investor sentiment towards Ethereum has turned sharply negative on social media, suggesting an impending trend reversal, Santiment points out. In the past, such periods of peak fear and uncertainty have often preceded an asset’s rise.
The FxPro Analyst Team
USD/JPY Continues Its Climb: Is There a Limit?
USD/JPY rose to 160.52 on Thursday, marking its highest level since July 2024. The Japanese yen remains under significant pressure despite a notable acceleration in Japan’s producer price inflation.
According to the latest data, Japan’s Producer Price Index (PPI) increased by 6.1% year-on-year in May, up from a revised 5.3% in April. The figure exceeded market expectations of 5.5% and reached its highest level in three years. Rising energy costs and the yen’s weakness remain the primary drivers of producer price growth.
The stronger-than-expected inflation data has reinforced expectations that the Bank of Japan could raise interest rates as early as its next policy meeting. Market participants increasingly believe the central bank will need to respond to mounting inflationary pressures, exacerbated by the conflict in the Middle East and the continued depreciation of the Japanese currency.
Investor attention is also focused on comments from Bank of Japan Governor Kazuo Ueda, with markets seeking clearer signals on the future direction of monetary policy. Investors are already pricing in the possibility of another rate increase in September and are not ruling out an additional move in December.
Despite these expectations, the yen remains under pressure. The strength of the US dollar and expectations that the Federal Reserve will maintain a restrictive policy stance continue to outweigh support from potential Bank of Japan rate hikes.
Technical Analysis
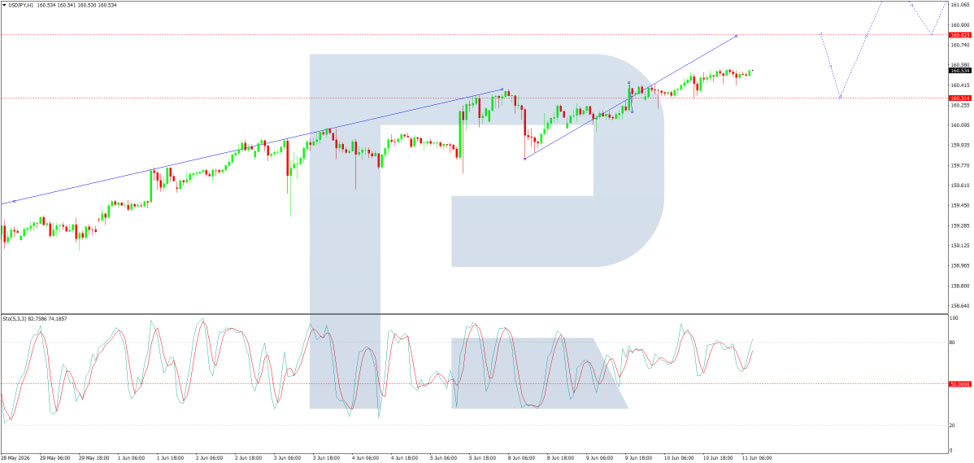
On the H4 chart, USD/JPY is trading within a consolidation range around the 160.30 level and is developing an upward move towards 160.85. This target is expected to be reached today, followed by a corrective pullback towards 160.30. The MACD indicator supports this scenario, with its signal line above zero and pointing firmly upwards, indicating that bullish momentum remains intact.
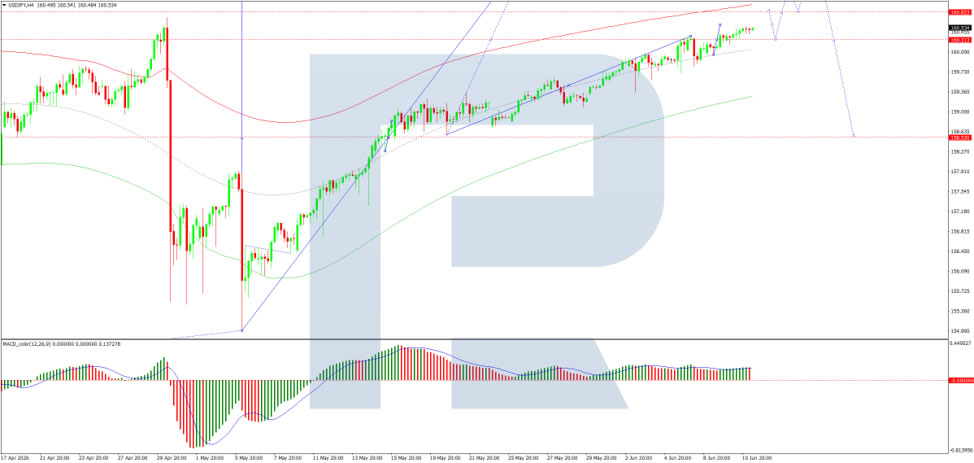
On the H1 chart, USD/JPY is building an upward structure towards 160.85. A correction towards 160.30 may follow before another advance towards 160.90, with scope for the broader trend to extend to 162.00.
The Stochastic oscillator confirms this outlook. Its signal line remains above the 50 level and is moving towards 80, suggesting that upside momentum is likely to persist in the short term.
Conclusion
USD/JPY continues to benefit from a strong US dollar and expectations of prolonged Federal Reserve policy tightness, despite growing speculation of further Bank of Japan rate increases. While the pair remains firmly bullish, its approach to new multi-year highs may increase market sensitivity to any signs of intervention or policy shifts from Japanese authorities.
GBP/CHF’s Head-and-Shoulders Bottom Points to Bigger Gains as BoE and SNB Diverge
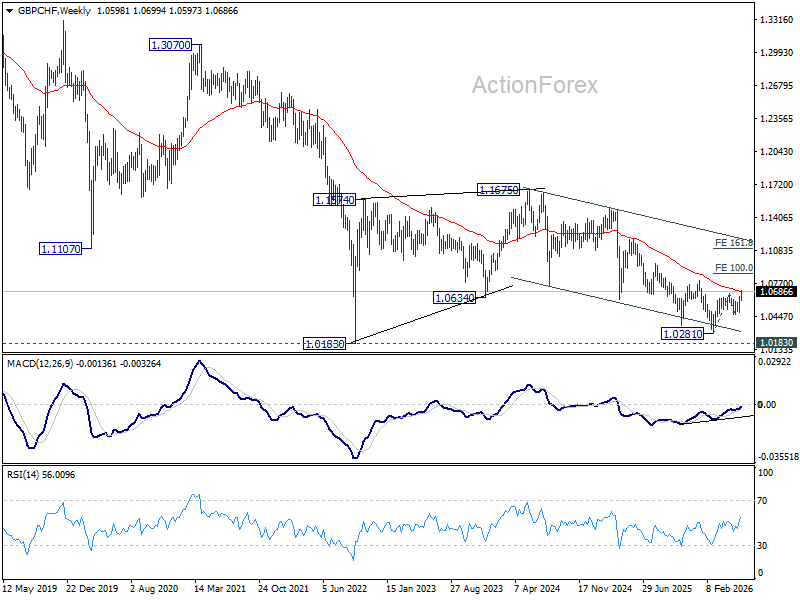
GBP/CHF may be offering one of the clearest examples of how monetary policy divergence and technical analysis can reinforce each other. The cross surged to its highest level since January this week, after breaking through key near term resistance at 1.0674. More importantly, that move appears to complete a significant head-and-shoulders bottom formation, suggesting the broader downtrend from the 2024 high may have already ended.
The fundamental backdrop is increasingly supportive of Sterling. While markets have largely ruled out a Bank of England rate hike at next week's meeting, policymakers are not yet finished discussing the possibility of further tightening. Chief Economist Huw Pill recently voted for an immediate rate increase, and the Monetary Policy Committee continues to monitor whether higher energy prices eventually feed through into wages and services inflation. With oil prices still elevated and inflation risks lingering, markets continue to price the possibility of an "insurance hike" later this year, most likely around the July or September meetings.
The Swiss National Bank faces a very different reality. Swiss inflation remains comfortably contained, with May CPI slowing to just 0.6% yoy, below expectations. That leaves inflation well within the SNB's 0%-2% target range and removes any meaningful pressure for policy tightening. Investors are convinced that the SNB will keep rates at 0% throughout the remainder of 2026. While BoE debates whether another hike may eventually be needed, SNB is effectively frozen in place.
That divergence matters because interest-rate differentials remain one of the most powerful long-term drivers in foreign exchange markets. Sterling (BoE rate at 3.75%) already enjoys a substantial yield advantage over Swiss Franc (SNB rate at 0.00%). Markets do not need a series of additional BoE hikes to justify GBP/CHF strength. They simply need confidence that the next move from BoE is more likely to be up than down while SNB remains firmly on hold.
The technical picture is also aligning with that macro story. The break above 1.0674 suggests completion of a head-and-shoulders bottom (ls: 1.0362, h, 1.0281, rs: 1.0674). Additional confirmation comes from bullish convergence conditions on both D and W MACD.
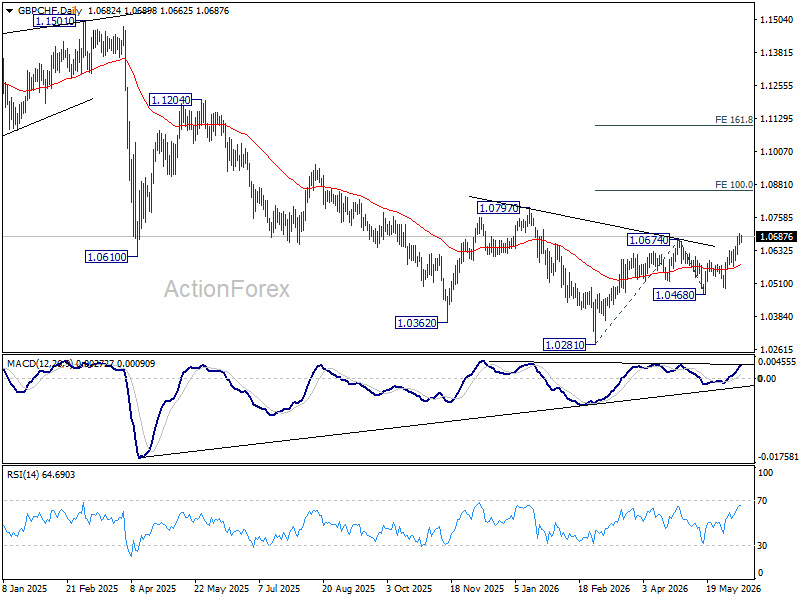
Further rise is expected as long as 55 D EMA (now at 1.0581) holds. Next target is 100% projection of 1.0281 to 1.0674 from 1.0468 at 1.0861. Decisive break of 1.0861 will argue that rise from 1.0281 is an impulsive wave that's in upside acceleration towards 161.8% projection at 1.1104.
If expectations for a BoE insurance hike become more firmly established in the months ahead, Sterling's yield advantage could provide additional fuel for that move.
Sterling at Key Levels as Investors Assess UK Economic Outlook
The British pound is maintaining a cautious tone following a period of elevated volatility, with market participants now focused on key upcoming UK economic data releases. Both GBP/USD and GBP/JPY are consolidating near important technical levels as investors await macroeconomic indicators that could provide clearer signals on the outlook for the UK economy and the Bank of England’s next policy moves.
The main event later this week will be the release of UK GDP data for April. Forecasts suggest the economy may contract by 0.1% month-on-month, following a 0.3% expansion in the previous month. At the same time, figures for industrial production, manufacturing output, construction activity, and the trade balance will also be published. Weaker-than-expected data could reinforce expectations of further Bank of England easing and put additional pressure on sterling, while stronger readings may support the currency and trigger a fresh wave of demand.
GBP/USD
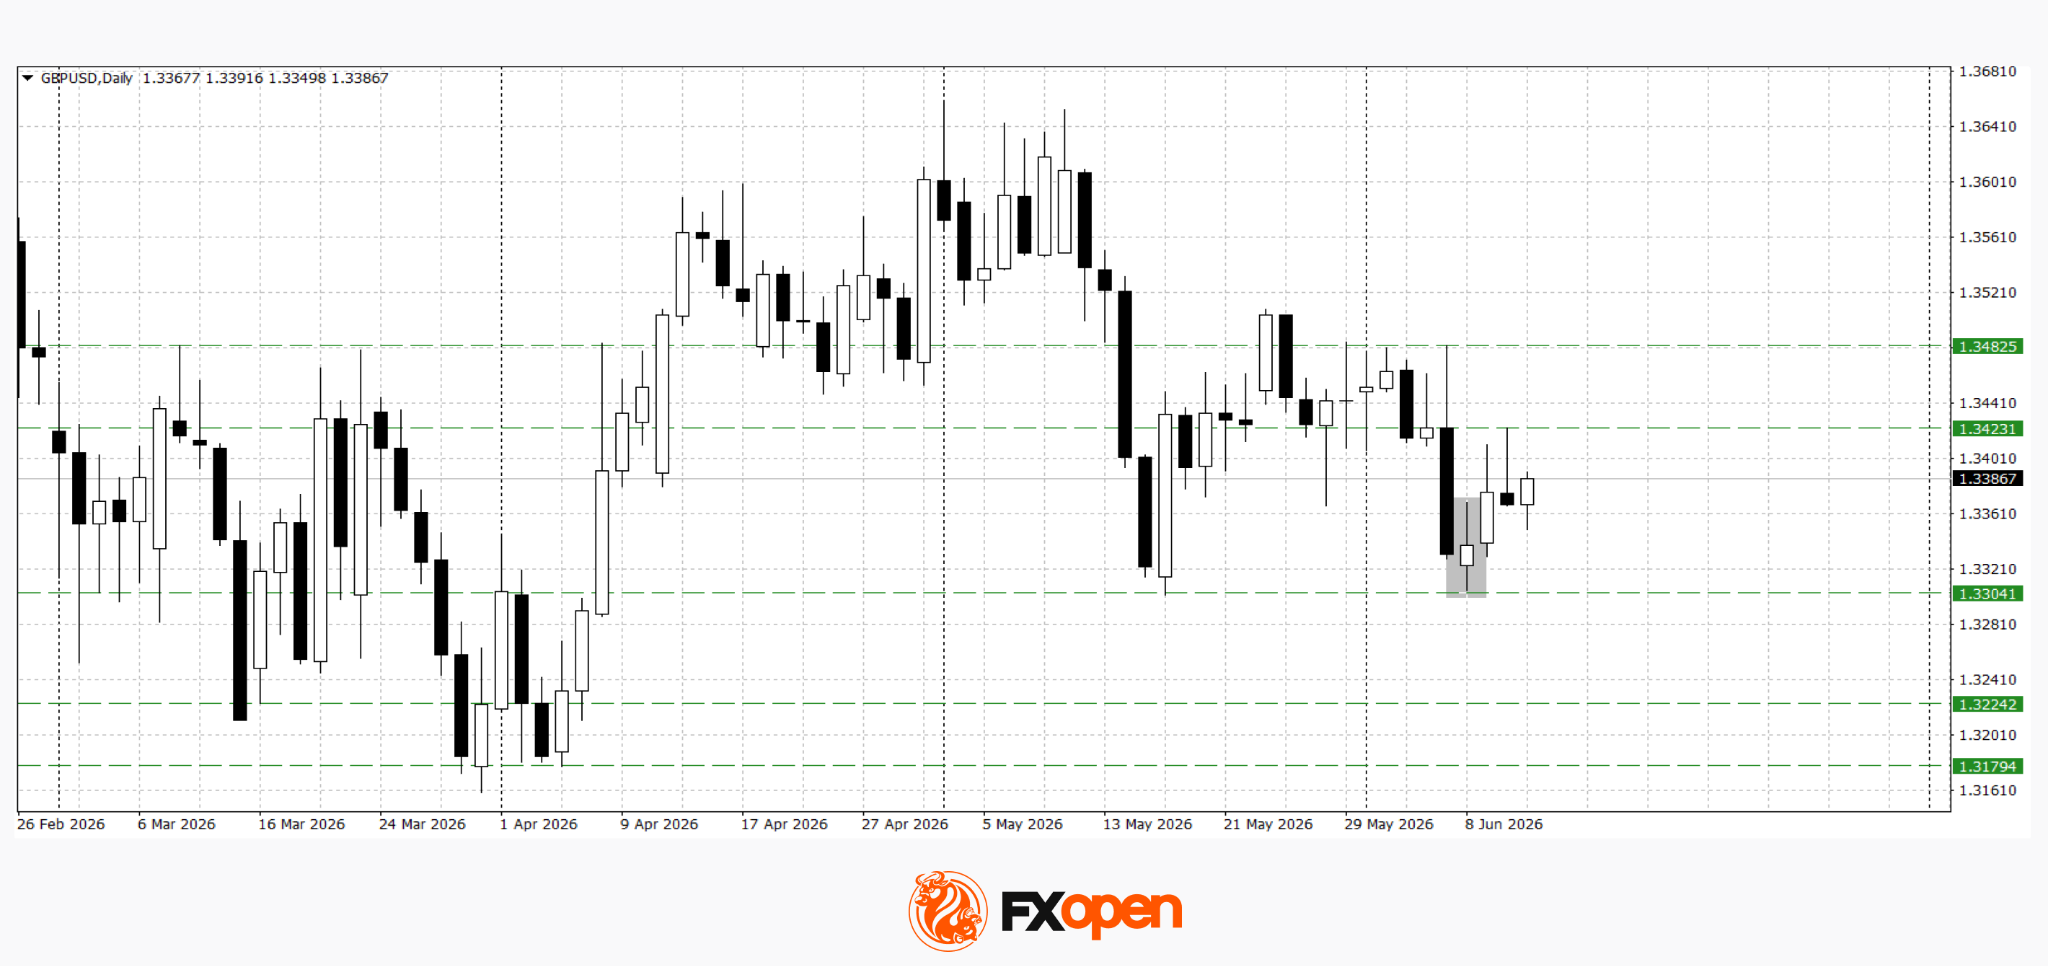
From a technical perspective, GBP/USD remains in a consolidation phase following its recent decline. After bouncing from support at 1.3300, a bullish piercing candlestick pattern formed on the daily chart, with potential follow-through towards 1.3420–1.3480. A sustained break below 1.3300, however, could extend the downside move towards the April lows in the 1.3220–1.3180 area.
Key events for GBP/USD:
- Today at 13:00 (GMT+3): Thomson Reuters/Ipsos Primary Consumer Sentiment Index (PCSI) in the UK;
- Today at 15:30 (GMT+3): US Producer Price Index (PPI);
- Today at 19:00 (GMT+3): US Department of Agriculture (USDA) World Agricultural Supply and Demand Estimates report.
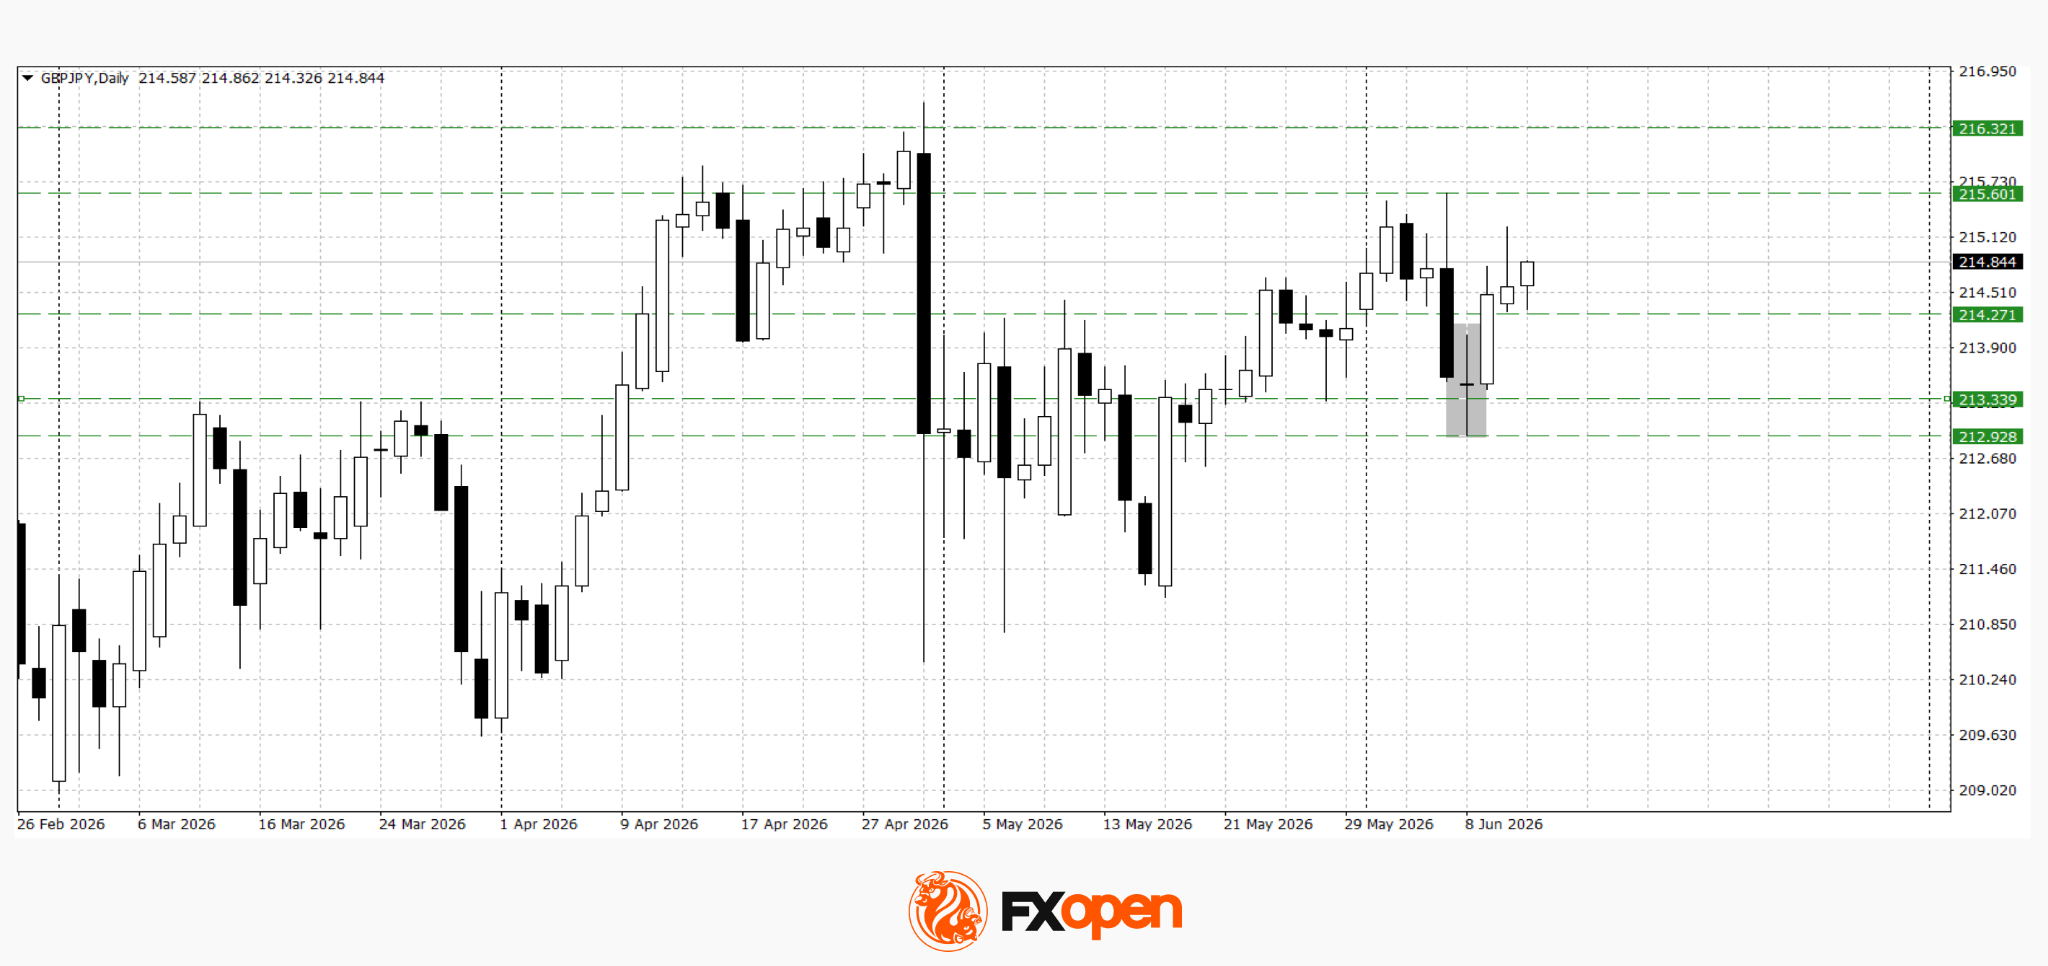
GBP/JPY
GBP/JPY is also trading in a consolidation range near important resistance levels. The pair continues to find support from persistent yen weakness, although the lack of a decisive breakout above recent highs suggests caution among buyers. Strong UK data could prompt another attempt to extend gains towards the 215.60–216.30 area. Conversely, a break below 214.20 may open the way towards 213.30–213.00.
Key events for GBP/JPY:
- Tomorrow at 07:30 (GMT+3): Japan industrial production;
- Tomorrow at 09:00 (GMT+3): UK gross domestic product (GDP);
- Tomorrow at 09:00 (GMT+3): UK manufacturing output.
Overall, sterling is approaching a key juncture where its next direction will largely depend on the state of the UK economy. Upcoming GDP, industrial production, and trade balance data could act as the main short-term drivers for GBP/USD and GBP/JPY. Ahead of these releases, markets are likely to remain cautious, with consolidation near current levels remaining the dominant scenario.
Trade over 50 forex markets 24 hours a day with FXOpen. Take advantage of low commissions, deep liquidity, and spreads from 0.0 pips (additional fees may apply). Open your FXOpen account now or learn more about trading forex with FXOpen.
This article represents the opinion of the Companies operating under the FXOpen brand only. It is not to be construed as an offer, solicitation, or recommendation with respect to products and services provided by the Companies operating under the FXOpen brand, nor is it to be considered financial advice.
Sunrise Market Commentary
Markets
Market focus at least temporary moved from the Middle East conflict to US data yesterday and May CPI inflation in particular. After last week’s strong activity data (ISM’s, Jolts, ADP, Payrolls), rising inflationary pressures should get ever more weight in Fed deliberations. However, the May CPI report was almost bang in line with expectations. Headline inflation rose 0.5% M/M and 4.2% Y/Y (from 3.8%). Core inflation rose a milder 0.2% M/M to be up 2.9% Y/Y (from 2.8%). Energy prices understandably were an important driver (3.9% M/M and 23.5% Y/Y). Services inflation also still rose 0.3% M/M and 3.5% Y/Y. US yields spiked lower as the report at least didn’t bring the upward surprise some feared for. However, the easing was modest and temporary. Yields soon rebounded on growing signs of frustration from the US/president Trump. Iran not signing a ‘deal’ anytime soon would lead to additional military action he said. He later walked the talk. Higher risk premia overall finally propelled oil back from intraday lows near $91/b (Brent) to close near $95. This also filtered through into bond markets. US yields reversed the post CPI correction to close 2.5-3.5 bps higher. German yields added between 5 bps (2-y ) and 1.5 bps (30-y) as markets look forward to any ECB guidance on the central bank’s reaction function going forward. In the meantime, especially US equity markets for now are captured in a tentative sell-on-up-ticks pattern with the three main indices ceding between 1.6% and 2%. On FX markets , the dollar is holding near recent highs but at the same time isn’t able to decisively reap the fruits of its presumed safe haven status. DXY is blocked near the 100 barrier (close 99.95). EUR/USD (close 1.1535) stays away from the 1.15 correction low earlier this week. USD/JPY holds north of 160. BoJ governor Ueda not participating at next week BoJ decision adds to yen uncertainty.
Reported mutual strikes between Iran and the US overnight are causing a nervous start in Asia, but equity losses could have been bigger given the US sell-off yesterday. Later today, US PPI might give some insight in upcoming US price dynamics . However, the ECB policy decision including new forecasts is the main dish today. The ECB is expected to raise its policy rate by 25 bps to 2.25%. Key question is what conclusions they draw from updated forecasts on (the timing of) further hikes. Any guidance will be conditional and data/event dependent. Still, markets will try to find out how much policy needs to be tightened away from neutral and how fast the ECB will need to act to preserve its inflation credibility. With a next step in July only less than 50% discounted (September fully priced), maybe there is room for markets to position for frontloading if the ECB talks strongly on avoiding second round effects. Even if the ECB holds such a decisive bias it probably won’t help the euro much. EUR/USD (and the dollar in general) is still mainly driven by the global, geopolitically-dominated narrative.
News & Views
The Bank of Canada (BoC) yesterday kept the policy rate unchanged at 2.25%. BoC remains torn between weak growth but rising inflation. Canada’s economy shrank by 0.1% in Q1, weaker than expected at the time of the April projections. The BoC foresees growth to resume this quarter but not to the extent that it will pull the economy out of excess supply. Inflation meanwhile accelerated to 2.8% on energy prices (and base effects). There was only limited evidence of broad-based pass-through to other consumer prices, it said, as measures of core inflation have moved down to around 2%. Total inflation is expected to hover around the top of the 1-3% target band the near term before easing gradually towards 2%. Governor Macklem reiterated the two-sided risks: the BoC may need to cut if US tariffs escalate or deliver hikes if energy-driven inflation broadens into persistent price pressures beyond headline inflation. Both Canadian swap yields and the dollar ended the day little changed USD/CAD finished around 1.394.
The UK’s RICS residential survey for May contained signs of a subdued but stabilizing housing market. It said new buyer enquiries recorded a net balance of -34%, showing that agents reporting a fall outnumbered those seeing an increase. It is, however, the first time since January that this headline demand indicator hadn’t moved further into negative territory. A similar conclusion applies for agreed sales, matching the -37% of April. House prices continued to edge lower at the headline level, with the net balance holding at -35%, the survey noted. Short-term sentiment stays cautious with near-term sales expectations improving slightly to -25%. Over a 12-month horizon, expectations moved into neutral territory at +2%. Price expectations remain weak near term. A net balance of -45% is expecting prices to fall over the next three months. The year-ahead indicator, however, edged into positive territory (+6%).