
Sample Category Title
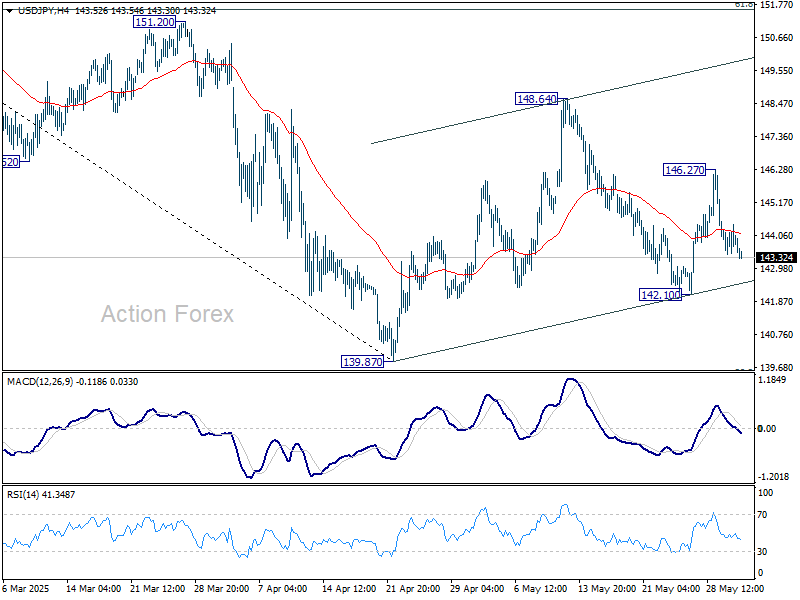
USD/JPY Daily Outlook
Daily Pivots: (S1) 143.51; (P) 143.98; (R1) 144.51; More...
Intraday bias in USD/JPY remains neutral. On the upside, above 146.27 will target 148.64 resistance first. Firm break there will resume the rebound from 139.87. Nevertheless, break of 142.10 will bring deeper fall back to 139.87 low.
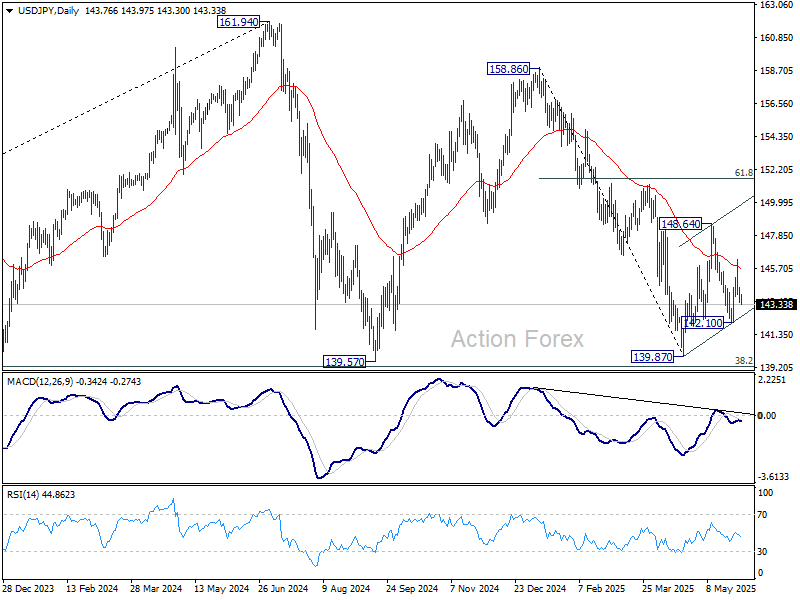
In the bigger picture, price actions from 161.94 are seen as a corrective pattern to rise from 102.58 (2021 low), with fall from 158.86 as the third leg. Strong support should be seen from 38.2% retracement of 102.58 to 161.94 at 139.26 to bring rebound. However, sustained break of 139.26 would open up deeper medium term decline to 61.8% retracement at 125.25.
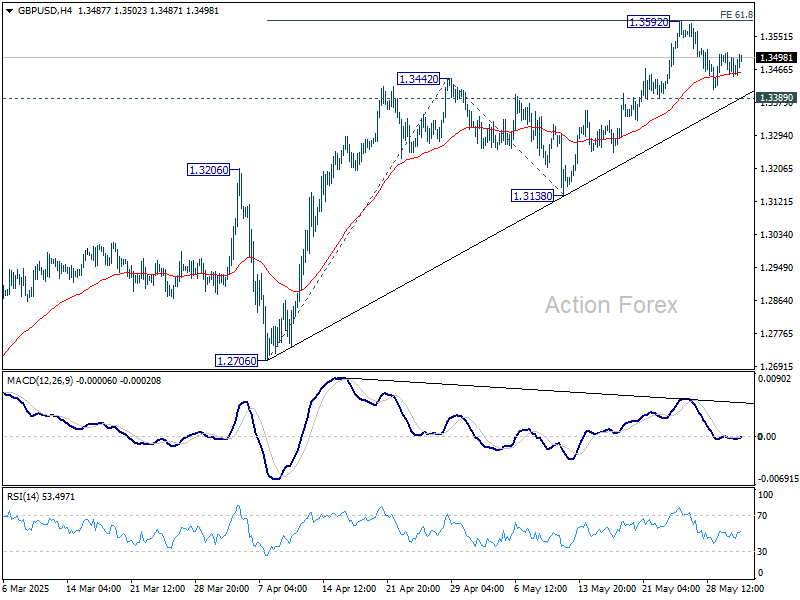
GBP/USD Daily Outlook
Daily Pivots: (S1) 1.3431; (P) 1.3471; (R1) 1.3494; More...
Intraday bias in GBP/USD stays neutral and further rally is expected with 1.3389 support intact. On the upside, firm break of 1.3592 will resume larger up trend to 100% projection of 1.2706 to 1.3442 from 1.3138 at 1.3874. However, decisive break of 1.3389 will confirm short term topping, and turn bias back to the downside for 1.3138 support instead.
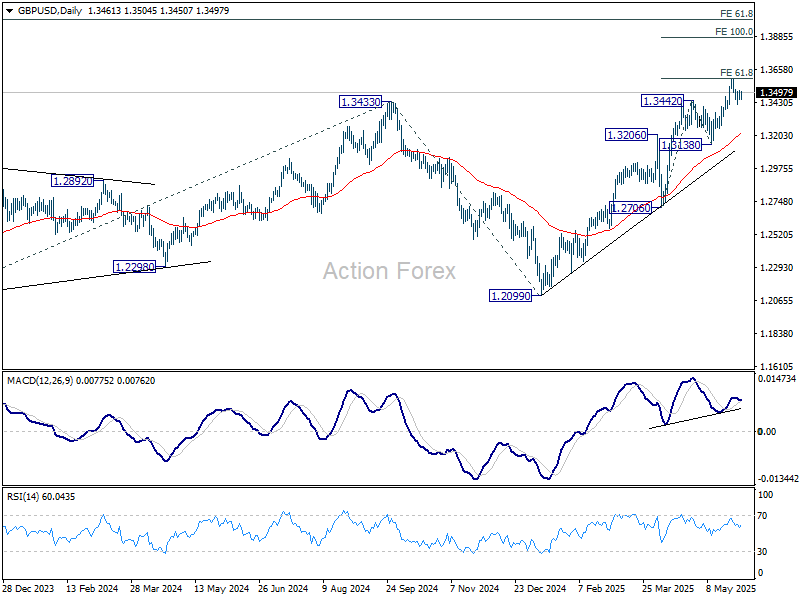
In the bigger picture, up trend from 1.3051 (2022 low) is in progress. Next medium term target is 61.8% projection of 1.0351 to 1.3433 from 1.2099 at 1.4004. Outlook will now stay bullish as long as 55 W EMA (now at 1.2866) holds, even in case of deep pullback.
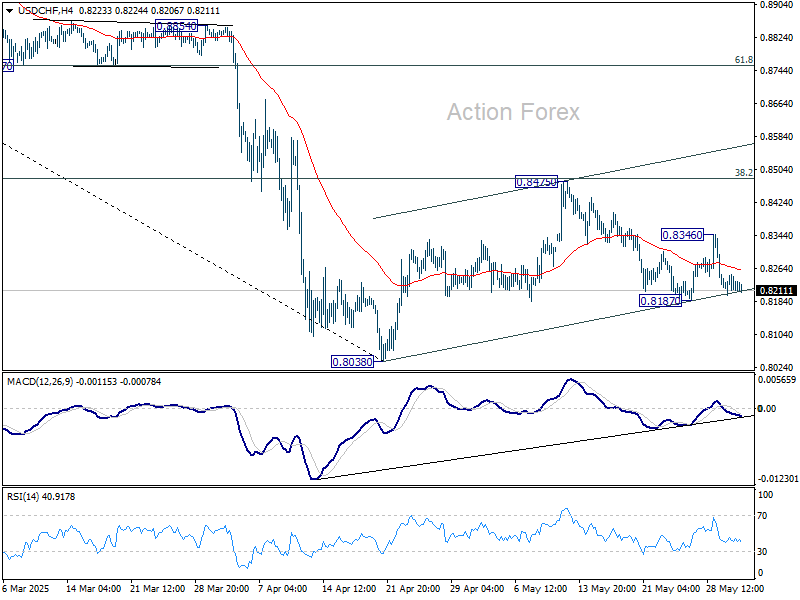
USD/CHF Daily Outlook
Daily Pivots: (S1) 0.8202; (P) 0.8226; (R1) 0.8252; More….
Intraday bias in USD/CHF remains neutral for the moment. Price actions from 0.8038 are seen as a corrective pattern to the decline from 0.9200, which might still be extending. On the downside, below 0.8187 will bring retest of 0.8038 low. On the upside, above 0.8346 will bring stronger rebound to 0.8475. But after all, larger down trend is expected to resume after the correction completes.
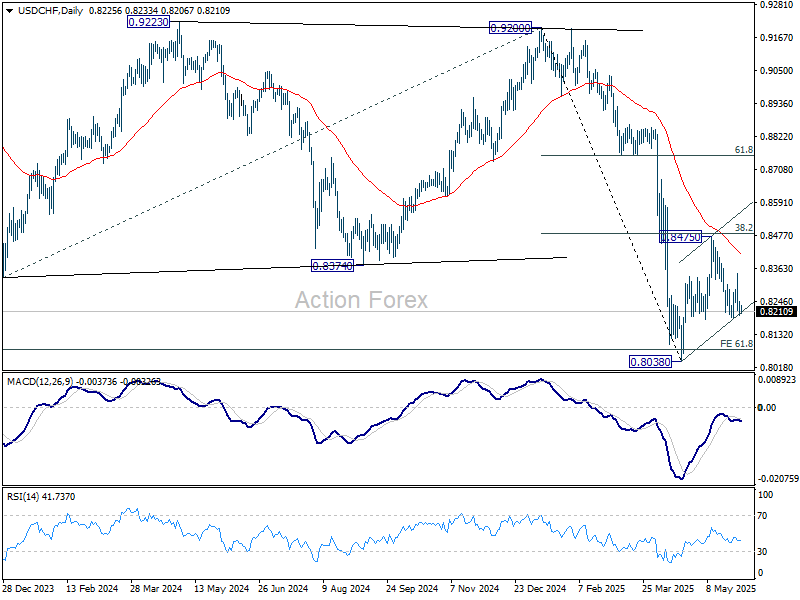
In the bigger picture, long term down trend from 1.0342 (2017 high) is still in progress and met 61.8% projection of 1.0146 (2022 high) to 0.8332 from 0.9200 at 0.8079 already. In any case, outlook will stay bearish as long as 55 W EMA (now at 0.8732) holds. Sustained break of 0.8079 will target 100% projection at 0.7382.
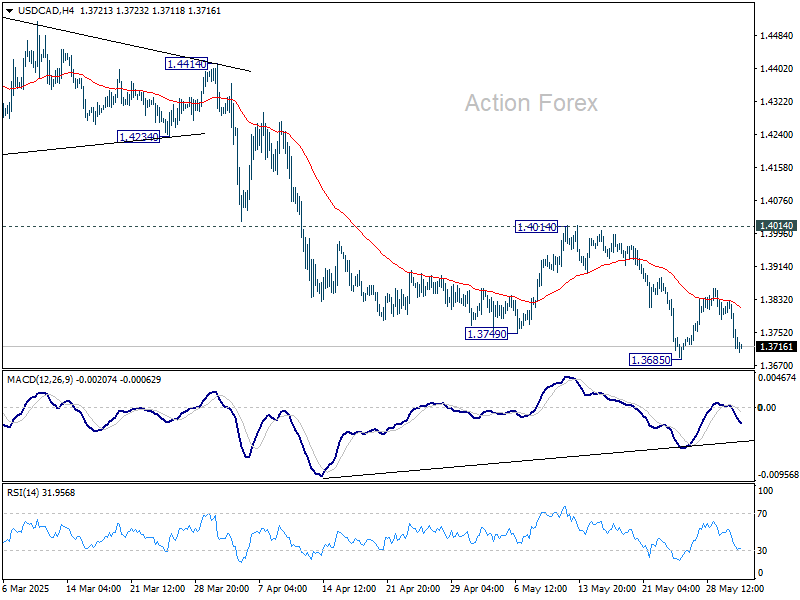
USD/CAD Daily Outlook
Daily Pivots: (S1) 1.3695; (P) 1.3763; (R1) 1.3811; More...
Intraday bias in USD/CAD stays neutral at this point. Consolidation from 1.3685 might extend. But outlook will stay bearish as long as 1.4014 resistance holds, in case of another recovery. On the downside, break of 1.3685 will resume whole fall from 1.4791 towards 1.3418 support.
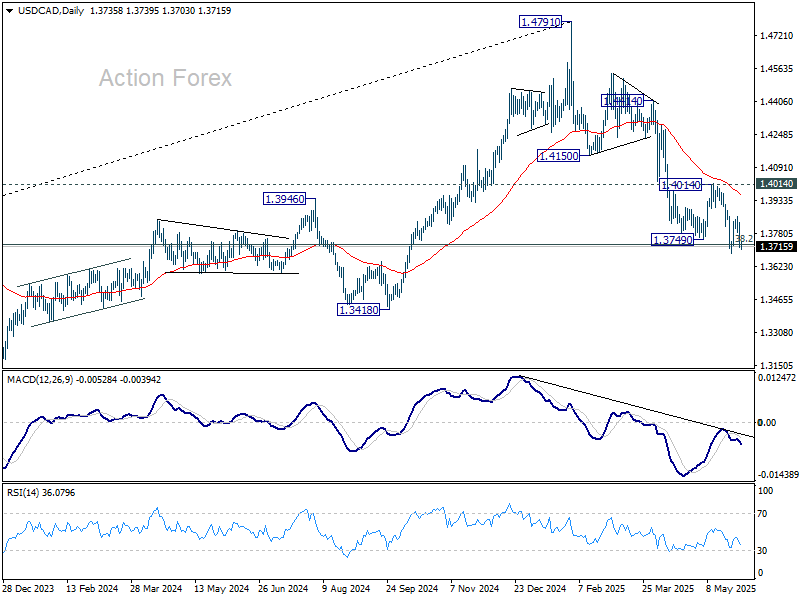
In the bigger picture, price actions from 1.4791 medium term top could either be a correction to rise from 1.2005 (2021 low), or trend reversal. In either case, further decline is expected as long as 1.4014 resistance holds. Firm break of 38.2% retracement of 1.2005 (2021 low) to 1.4791 at 1.3727 will pave the way back to 61.8% retracement at 1.3069.
AUD/USD Daily Report
Daily Pivots: (S1) 0.6409; (P) 0.6431; (R1) 0.6454; More...
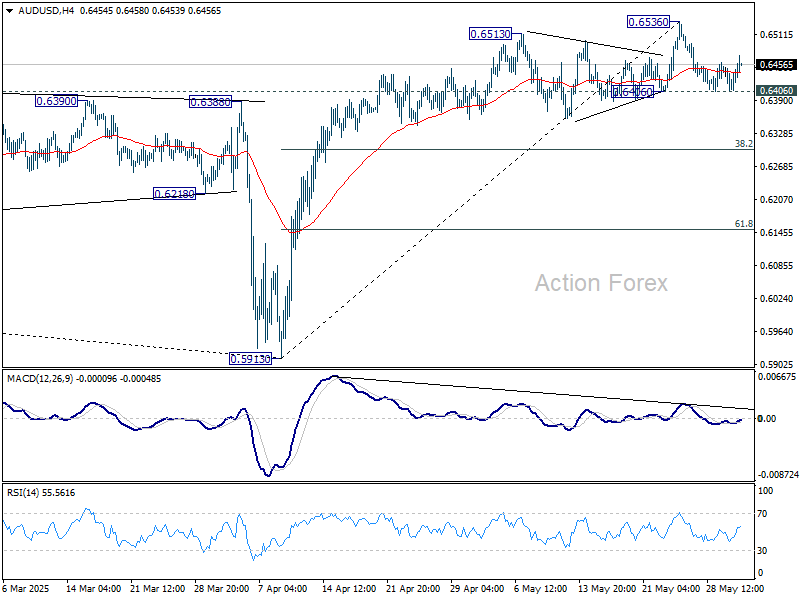
Range trading continues in AUD/USD and intraday bias stays neutral. Further rally is expected with 0.6406 support intact. Above 0.6536 will resume the rally from 0.5913 to 61.8% retracement of 0.6941 to 0.5913 at 0.6548. However, firm break of 0.6406 will confirm short term topping, and turn bias back to the downside for 38.2% retracement of 0.5913 to 0.6536 at 0.6298.
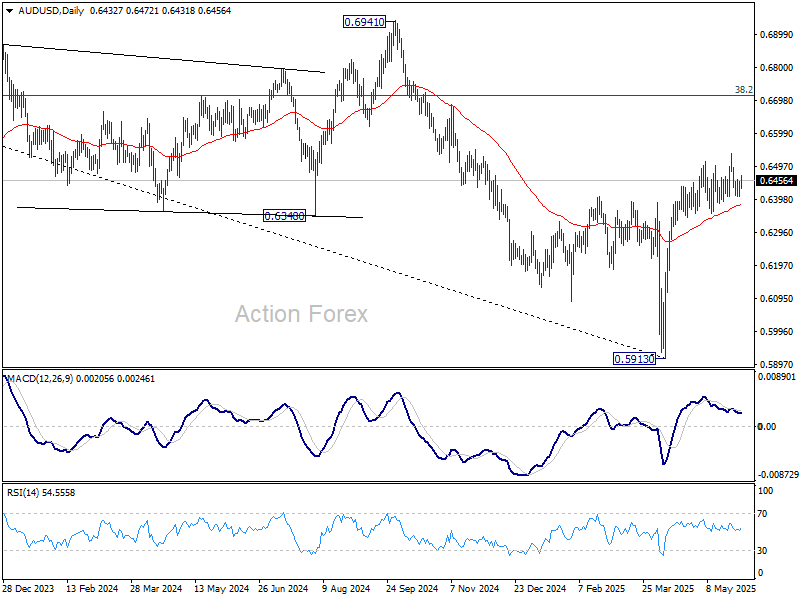
In the bigger picture, AUD/USD is still struggling to sustain above 55 W EMA (now at 0.6441) cleanly, and outlook is mixed. Sustained trading above 55 W EMA will indicate that rise from 0.5913 is at least correcting the down trend from 0.8006 (2021 high), with risk of trend reversal. Further rise should be seen to 38.2% retracement of 0.8006 to 0.5913 at 0.6713. However, rejection by 55 W EMA will revive medium term bearishness for another fail through 0.5913 at a later stage.
Cautious Mood in Asia as Markets Eye Trump-Xi Trade Call and Steel Tariff Fallout
Asian markets traded with a mild risk-off tone to start the week, though overall activity remains subdued due to holidays in China, Malaysia, and New Zealand. Nikkei is under pressure, weighed down by rising US-China trade tensions and US President Donald Trump's announcement of steeper steel tariffs. Hong Kong equities are also lower, reflecting regional unease. The muted mood extends to currency markets, where Dollar is softer, though the pullback remains modest. The Swiss Franc and Loonie are also on the weaker side, while Kiwi, Aussie, and Yen are firmer. Euro and Sterling are holding mid-pack.
On the trade front, US National Economic Council Director Kevin Hassett said on Sunday that President Trump and Chinese President Xi Jinping could speak as soon as this week, raising hopes that communication channels remain open. "We expect a wonderful conversation about the trade negotiations," Hassett said, expressing optimism about renewed dialogue. However, last week’s heated rhetoric casts a long shadow. Trump accused Beijing of violating their preliminary trade deal, prompting a swift rebuttal from Chinese officials today, who insisted they had “strictly implemented” their commitments and decried the US claims as “seriously contrary to the facts.”
Further darkening the trade outlook, Trump announced late on Friday that tariffs on imported steel and aluminum will be doubled to 50% starting June 4, aiming to provide what he called “even further security” for the U.S. steel industry. The European Commission responded sharply over the weekend, warning that the move increases economic uncertainty and imposes higher costs on both sides of the Atlantic. Brussels confirmed it is prepared to retaliate, with countermeasures now under consideration. The threat of escalating tariff battles across multiple fronts continues to weigh on investor sentiment globally.
With the lingering tension, markets in a cautious mood, waiting for clarity on whether the Trump-Xi call will materialize this week—and, more importantly, whether it brings any de-escalation. In the background, traders are also preparing for two major central bank decisions this week, with both ECB and Bank BoC set to meet. Key US data releases—including ISM manufacturing and services indexes, and the May non-farm payrolls report—will also be closely watched.
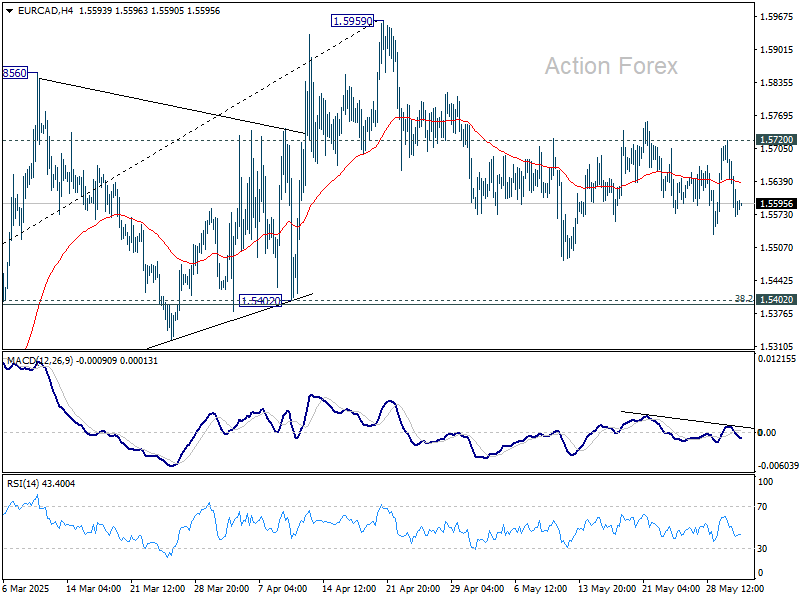
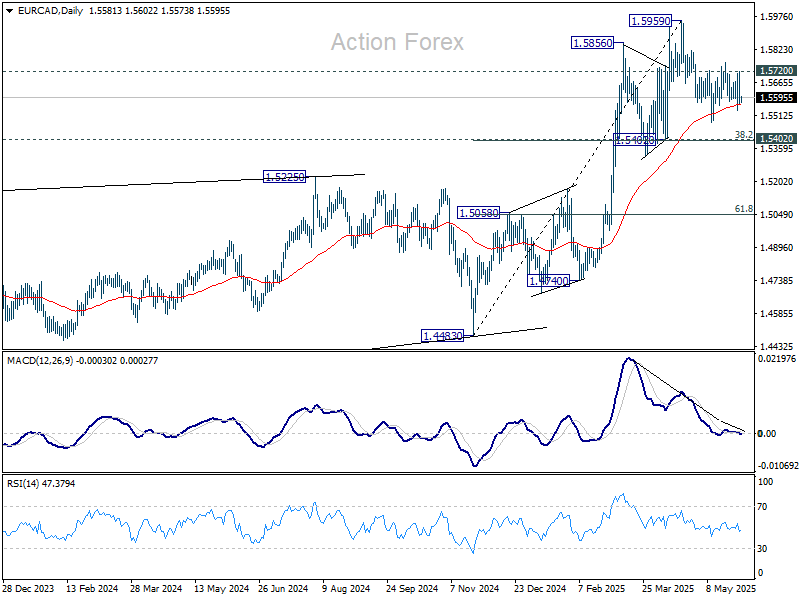
Technically, EUR/CAD would be a pair to watch this week. Price actions from 1.5959 are seen as a consolidation pattern to rally from 1.4483, that is set to extend further. In case of another dip, downside should be contained by 1.5420 cluster support (38.2% retracement of 1.4483 to 1.5959 at 1.5395. Break of 1.5720 will bring stronger rebound, but upside should be limited by 1.5959 resistance. Some range trading setup could be used to capitalize on the moves.
In Asia, at the time of writing, Nikkei is down -1.40%. Hong Kong HSI is down -2.20%. China is on holiday. Singapore Strait Times is down -0.49%. Japan 10-year JGB yield is up 0.006 at 1.511.
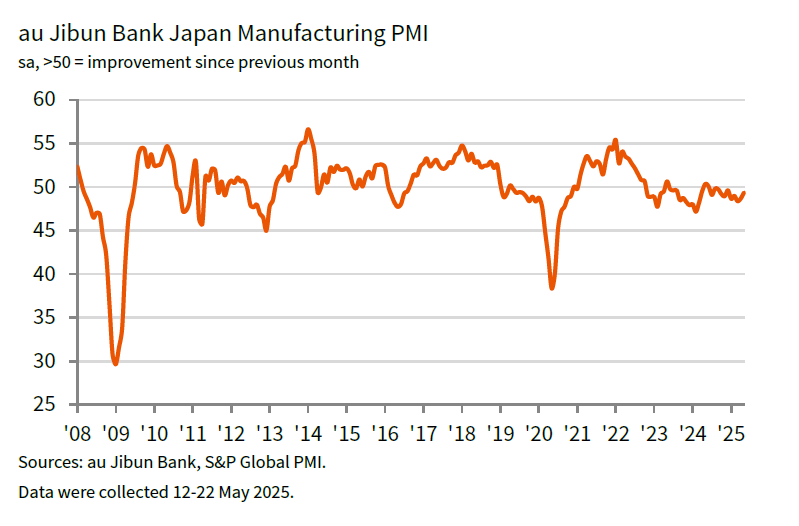
Japan’s PMI manufacturing finalized at 49.5, firms eye recovery despite trade headwinds
Japan's PMI Manufacturing was finalized at 49.5 in May, up from April's 48.7. S&P Global’s Annabel Fiddes noted that business conditions “moved closer to stabilisation,” as declines in sales eased and firms reported improved hiring activity.
Global trade tensions stemming from US tariffs continue to weigh on demand, with businesses citing "increased client hesitancy" and weaker orders.
Despite persistent external challenges around tariffs, sentiment around future output improved, and hiring rose at the fastest pace in over a year.
China’s NBS PMI Manufacturing edges higher to 49.5, second month of contraction
China’s official NBS PMI Manufacturing rose from 49.0 to 49.5 in May, signaling a modest improvement but still marking the second consecutive month of contraction.
The lift was driven by an acceleration in production and more optimistic business sentiment. The production sub-index climbed 0.9 pts to 50.7. New orders index increased from 49.2 to 49.8. New export orders also rebounded from a low base of 44.7 to 47.5, as some firms reported improved trade activity with the US.
Meanwhile, PMI Non-Manufacturing edged slightly lower from 50.4 to 50.3, lifting the PMI Composite to 50.4 from 50.2. Although still in expansion territory, the composite figure is consistent with the sluggish momentum seen over the past year.
Fed’s Waller: Temporary tariff effects could clear path for "good news" rate cut later this year
In a speech today, Fed Governor Christopher Waller struck signaled his support for "good news" rate cuts later this year, if inflation continues to ease and trade tensions don’t escalate significantly.
In his view, any inflation resulting from tariffs "will not be persistent" and he supports “looking through” these effects when considering policy decisions.
Waller added that the strong labor market and continued disinflation through April give the Fed time to assess the outcome of ongoing trade negotiations before making policy moves.
Should tariffs remain near his “lower scenario” and inflation continue its downward path toward 2%, Waller said he would support so-called “good news” rate cuts, easing driven by a stable economy rather than distress.
ECB to cut, BoC to hold, NFP and other data eyed
Markets enter the week bracing for a dense calendar of central bank decisions and high-impact data releases, all unfolding under the shadow of unresolved global trade tensions. ECB is poised to deliver its another rate cut of the cycle, while BoC is widely expected to stay on hold. In parallel, a string economic indicators from the US, Canada, and China will be scrutinized for clues on the global outlook. But with sentiment increasingly shaped by geopolitics, markets may struggle to find a clear directional cue out of the economic events.
ECB is all but certain to lower its deposit rate by 25bps to 2.00%. However, the bigger question is what comes next. With rates then clearly within the estimated neutral zone, many expect this week’s move to mark a pivot to a more cautious stance. A Reuters poll shows that 51 of 72 economists forecast the ECB will pause in July. Nearly 30% believe the June cut will be the final one of the cycle. Only 45% anticipate one more cut beyond this week.
Much hinges on the tone President Christine Lagarde strikes in her post-meeting press conference. Investors will watch closely for signs of a formal shift to a wait-and-see stance. Updated ECB economic projections will also be key, particularly any revisions to inflation and growth forecasts in light of persistent trade tensions. Adding to the picture, Eurozone flash CPI for May, due earlier in the week, is expected to slow to the 2% target. Such a reading would reinforce the view that aggressive further easing is unlikely, at least in the near term.
In Canada, BoC is widely expected to keep its benchmark interest rate unchanged at 2.75% for a second consecutive meeting. Markets are pricing in roughly a 75% chance of a hold. Although the Canadian economy remains fragile, the sharper-than-expected rebound in core inflation, specifically CPI excluding energy, which surged to 2.9% in April, has made policymakers wary of easing further too quickly. BoC appears inclined to wait for greater clarity on US-Canada trade developments before contemplating further policy moves. May employment data will also be watched closely for any signs of labor market weakening that could shift the policy calculus.
In the US, attention turns to the ISM manufacturing and services indexes, as well as May non-farm payrolls report. Barring any major surprises, however, these releases are unlikely to dislodge the Fed from its patient stance. With inflation still trending lower but global risks elevated, Fed has made clear it will not rush into rate cuts again. Fed fund futures are currently pricing in a 73% chance of a rate cut in September, though that remains highly dependent on the outcome of trade negotiations—particularly with China and the EU.
Elsewhere, investors will also parse Australia’s Q1 GDP and RBA meeting minutes, Swiss GDP and CPI, and China’s Caixin PMIs. But for now, it is trade headlines—not just data—that are likely to set the tone. With central banks turning more cautious and the global growth pulse still uncertain, volatility may persist, especially as June unfolds with little in the way of firm resolution to the issues most weighing on sentiment.
Here are som ehighlights for the week:
- Monday: Japan PMI manufacturing final; Swiss retail sales, GDP, PMI manufacturing; EUrozone PMI manufacturing final; UK PMI manufacturing final; Canada PMI manufacturing; US ISM manufacturing.
- Tuesday: New Zeaand terms of trade; Japan monetary base; RBA minutes; China Caixin PMI manufacturing; Swiss CPI; Eurozone CPI flash, unemployment rate.
- Wednesday: Australia GDP; Eurozone PMI services final; UK PMI services final; US ADP employment, ISM services, Fed's Beige Book; BoC rate decision.
- Thursday: Japan labor cash earnings; Australia goods trade balance; China Caixin PMI services; Swiss unemployment rate; Germany factory orders; UK PMI construction; ECB rate decsion; US jobless claims, trade balance.
- Friday: Japan household spending, leading indicators; Germany industrial production, trade balance; Swiss Foreign currency reserves; Eurozone GDP final, retail sales; Canada employment; US non-farm payrolls.
AUD/USD Daily Report
Daily Pivots: (S1) 0.6409; (P) 0.6431; (R1) 0.6454; More...
Range trading continues in AUD/USD and intraday bias stays neutral. Further rally is expected with 0.6406 support intact. Above 0.6536 will resume the rally from 0.5913 to 61.8% retracement of 0.6941 to 0.5913 at 0.6548. However, firm break of 0.6406 will confirm short term topping, and turn bias back to the downside for 38.2% retracement of 0.5913 to 0.6536 at 0.6298.
In the bigger picture, AUD/USD is still struggling to sustain above 55 W EMA (now at 0.6441) cleanly, and outlook is mixed. Sustained trading above 55 W EMA will indicate that rise from 0.5913 is at least correcting the down trend from 0.8006 (2021 high), with risk of trend reversal. Further rise should be seen to 38.2% retracement of 0.8006 to 0.5913 at 0.6713. However, rejection by 55 W EMA will revive medium term bearishness for another fail through 0.5913 at a later stage.
Japan’s PMI manufacturing finalized at 49.5, firms eye recovery despite trade headwinds
Japan's PMI Manufacturing was finalized at 49.5 in May, up from April's 48.7. S&P Global’s Annabel Fiddes noted that business conditions “moved closer to stabilisation,” as declines in sales eased and firms reported improved hiring activity.
Global trade tensions stemming from US tariffs continue to weigh on demand, with businesses citing "increased client hesitancy" and weaker orders.
Despite persistent external challenges around tariffs, sentiment around future output improved, and hiring rose at the fastest pace in over a year.
China’s NBS PMI Manufacturing edges higher to 49.5, second month of contraction
China’s official NBS PMI Manufacturing rose from 49.0 to 49.5 in May, signaling a modest improvement but still marking the second consecutive month of contraction.
The lift was driven by an acceleration in production and more optimistic business sentiment. The production sub-index climbed 0.9 pts to 50.7. New orders index increased from 49.2 to 49.8. New export orders also rebounded from a low base of 44.7 to 47.5, as some firms reported improved trade activity with the US.
Meanwhile, PMI Non-Manufacturing edged slightly lower from 50.4 to 50.3, lifting the PMI Composite to 50.4 from 50.2. Although still in expansion territory, the composite figure is consistent with the sluggish momentum seen over the past year.
EUR/USD Targets More Upside — Breakout In The Making?
Key Highlights
- EUR/USD started a fresh increase above the 1.1280 resistance zone.
- A connecting bullish trend line is forming with support at 1.1260 on the 4-hour chart.
- GBP/USD is now struggling to clear the 1.3600 resistance zone.
- USD/JPY could gain bullish momentum if it clears the 145.00 resistance zone.
EUR/USD Technical Analysis
The Euro formed a base above 1.1200 and started a fresh increase against the US Dollar. EUR/USD cleared the 1.1280 resistance for bullish moves.
Looking at the 4-hour chart, the pair traded settled above the 1.1280 level, the 100 simple moving average (red, 4-hour), and the 200 simple moving average (green, 4-hour).
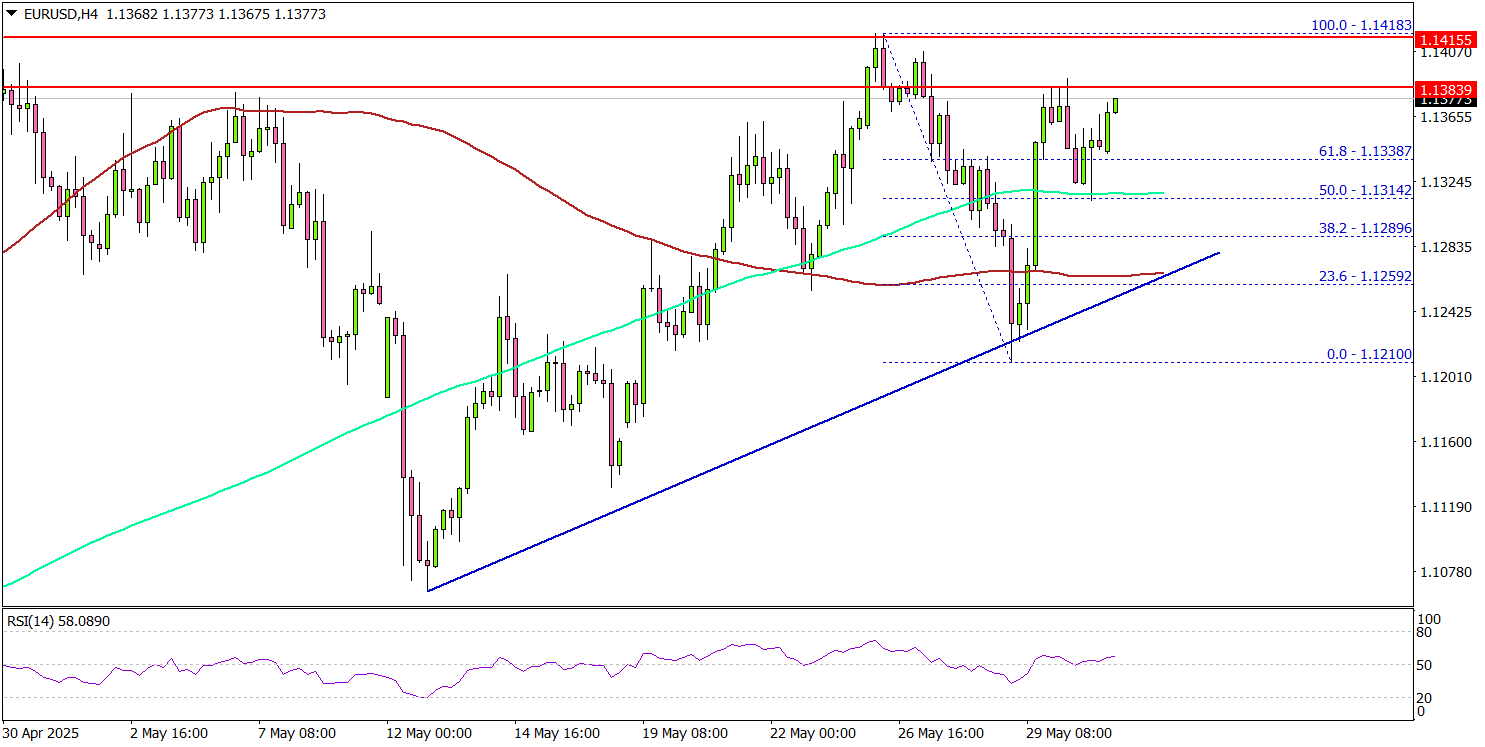
The bulls pushed the pair above the 61.8% Fib retracement level of the downward move from the 1.1418 swing high to the 1.1210 low. On the upside, the pair could face resistance near the 1.1380 level. The next key resistance sits near the 1.1420 level.
The first major resistance sits at 1.1450. A close above the 1.1450 level could set the pace for another increase. In the stated case, the pair could even clear the 1.1500 resistance. The next major stop for the bulls could be near the 1.1580 resistance.
On the downside, immediate support sits near the 1.1300 level. The next key support sits near 1.1280. Any more losses could send the pair toward the 1.1250 pivot level in the near term. The main support could be near 1.1220.
Looking at GBP/USD, the pair started another increase, but the bulls seem to be facing hurdles near the 1.3600 level.
Upcoming Economic Events:
- Euro Zone Manufacturing PMI for May 2025 – Forecast 49.4, versus 49.4 previous.
- US Global Manufacturing PMI for May 2025 – Forecast 52.3, versus 52.3 previous.
- US ISM Manufacturing Index for May 2025 – Forecast 48.7, versus 48.7 previous
Fed’s Waller: Temporary tariff effects could clear path for “good news” rate cut later this year
In a speech today, Fed Governor Christopher Waller struck signaled his support for "good news" rate cuts later this year, if inflation continues to ease and trade tensions don’t escalate significantly.
In his view, any inflation resulting from tariffs "will not be persistent" and he supports “looking through” these effects when considering policy decisions.
Waller added that the strong labor market and continued disinflation through April give the Fed time to assess the outcome of ongoing trade negotiations before making policy moves.
Should tariffs remain near his “lower scenario” and inflation continue its downward path toward 2%, Waller said he would support so-called “good news” rate cuts, easing driven by a stable economy rather than distress.